Immunogenicity and safety of a live-attenuated SARS-CoV-2 vaccine candidate based on multiple attenuation mechanisms
- The Research Foundation for Microbial Diseases of Osaka University, Japan
- Virus Vaccine Group, BIKEN Innovative Vaccine Research Alliance Laboratories, Institute for Open and Transdisciplinary Research Initiatives, Osaka University, Japan
- Department of Experimental Genome Research, Research Institute for Microbial Diseases, Osaka University, Japan
- Center for Advanced Modalities and DDS (CAMaD), Osaka University, Japan
- Center for Infectious Disease Education and Research (CiDER), Osaka University, Japan
- Department of Infectious Diseases and Host Defense, Gunma University Graduate School of Medicine, Japan
- Virus Vaccine Group, BIKEN Innovative Vaccine Research Alliance Laboratories, Research institute for Microbial Diseases, Osaka University, Japan
Figures
Figure 1 with 1 supplement
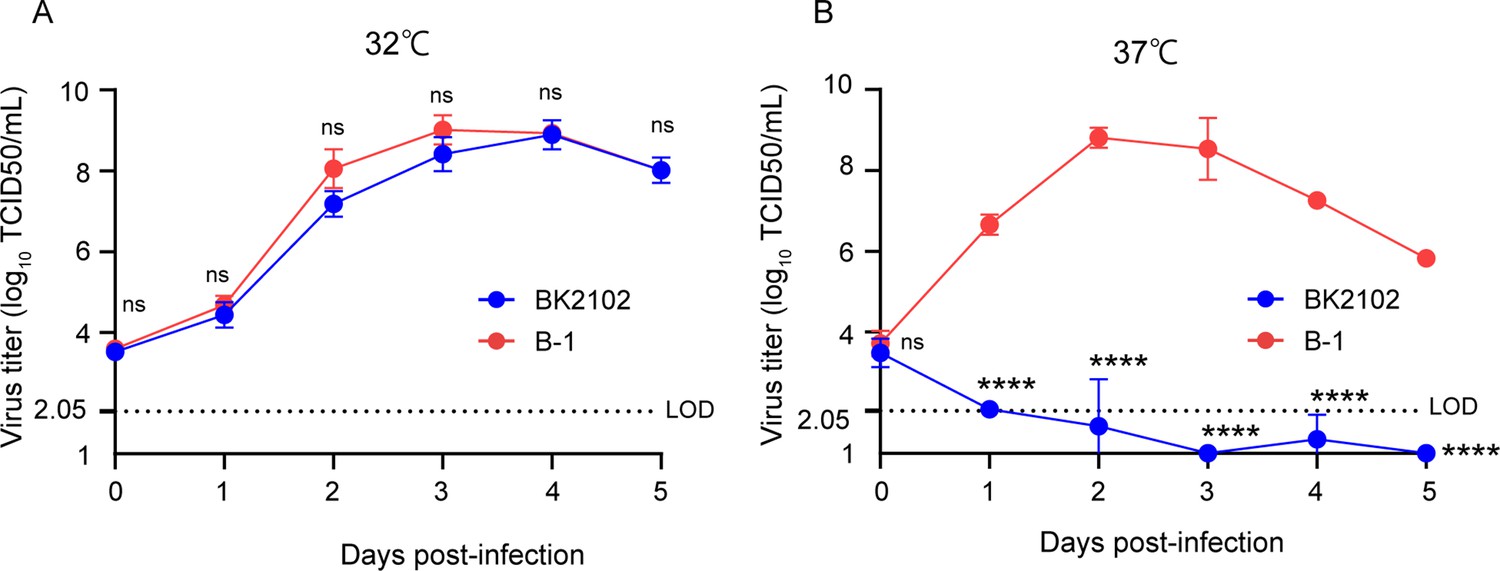
Growth dynamics of the vaccine candidate strain at different temperatures.
Vero cells were infected with the wild-type parent B-1 (D614G) or the BK2102 vaccine candidate strains at a multiplicity of infection (MOI) = 0.01, and virus titers in the supernatants were determined for samples harvested every day, after incubating at 32°C (A) or 37°C (B). Infectious virus titers were determined using the TCID50 method. Symbols indicate the average of three independent experiments, and error bars represent the SD. The limit of detection (LOD) was 2.05 log10 TCID50/mL, and for samples below the LOD, the mean value was calculated as 1 log10 TCID50/mL. The dotted line represents the assay’s LOD. Days post-infection are indicated on the x-axis. For statistical analysis, two-way ANOVA with Sidak’s multiple-comparison test was performed (ns, not significant; ****p<0.0001).
-
Figure 1—source data 1
Related to Figure 1A and B.
- https://cdn.elifesciences.org/articles/97532/elife-97532-fig1-data1-v1.zip
Figure 1—figure supplement 1
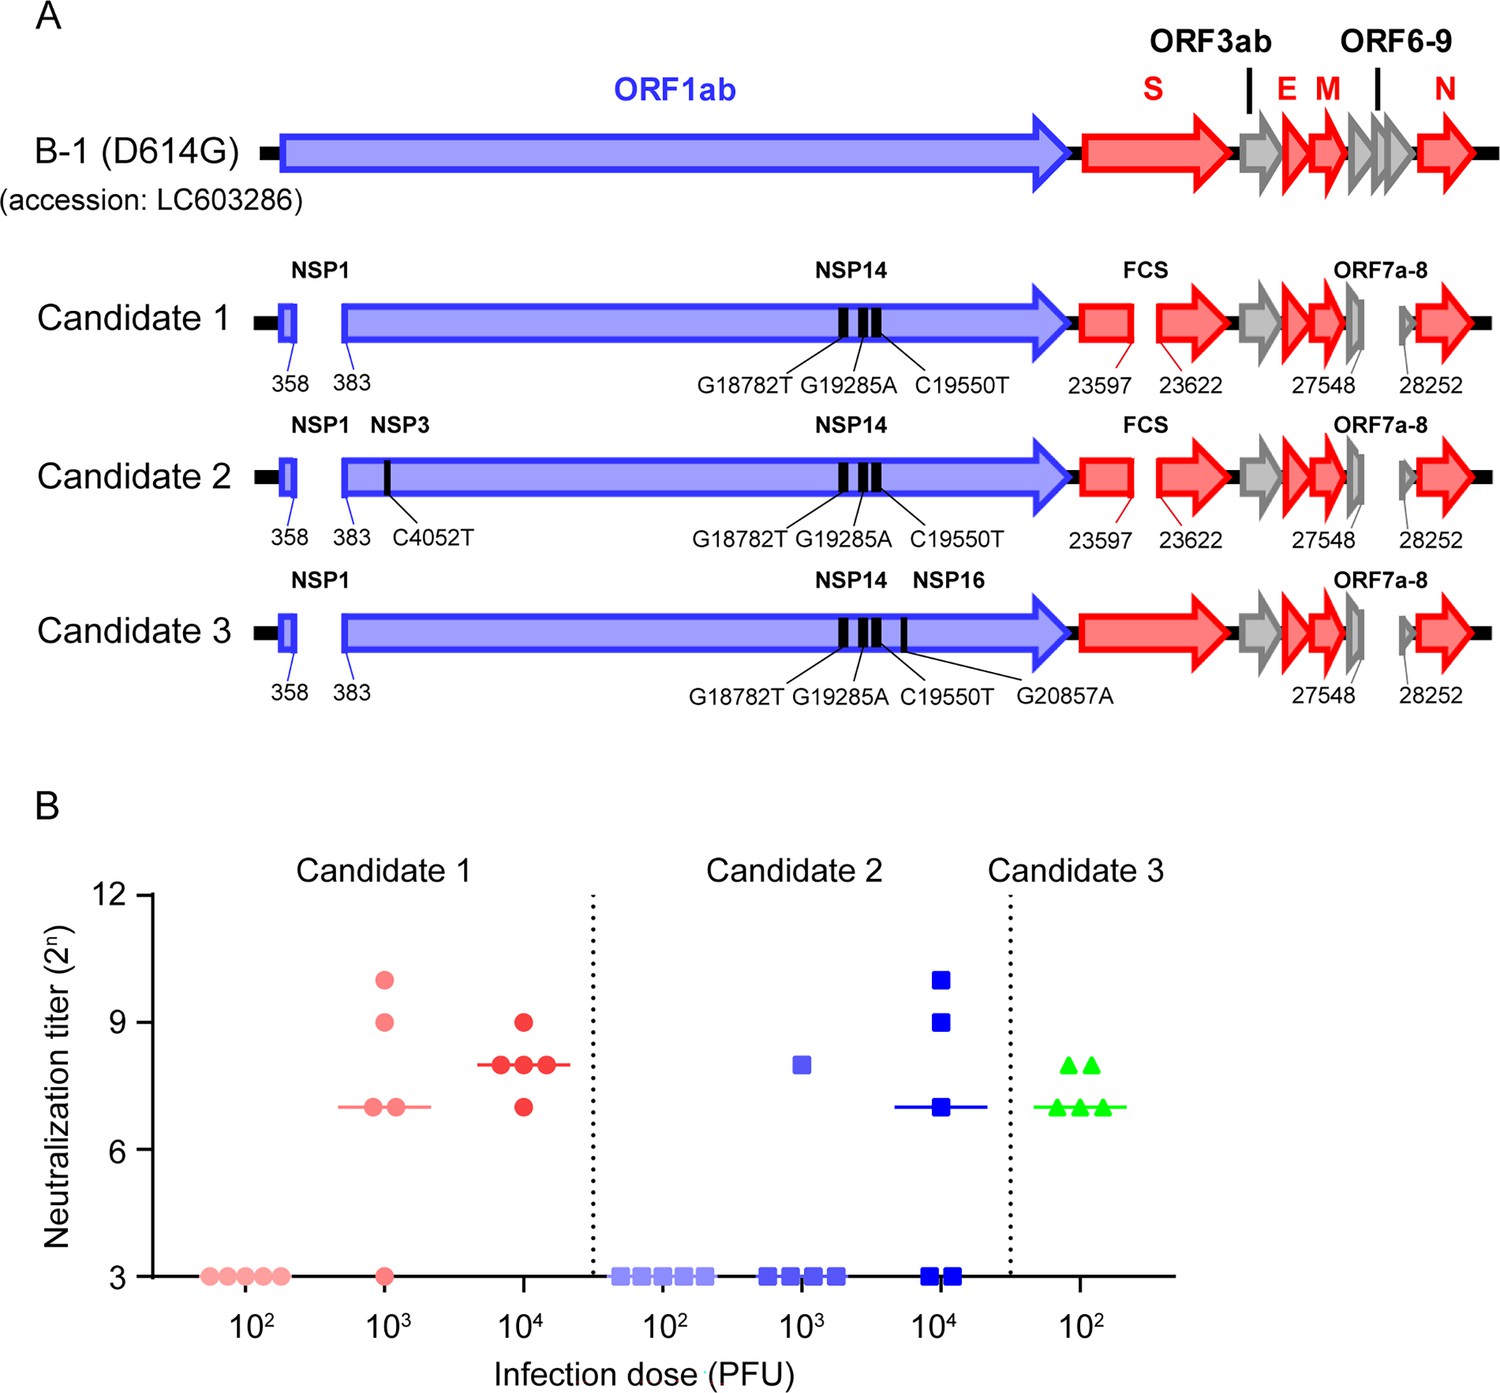
Characteristics of the vaccine candidates.
(A) Candidate vaccine constructs. ORF: open-reading frame; NSP: non-structural protein; FCS: furin cleavage site. (B) Immunogenicity of vaccine candidates in hamsters. Neutralizing antibody titers in the sera were measured 21 days post-inoculation. Symbols represent titers of individual animals (n=5), and the bars indicate the median. The limit of detection (LOD) was 24, and for samples below the LOD, the mean value was set to 23.
-
Figure 1—figure supplement 1—source data 1
Related to Figure 1—figure supplement 1B.
- https://cdn.elifesciences.org/articles/97532/elife-97532-fig1-figsupp1-data1-v1.zip
Figure 2 with 4 supplements
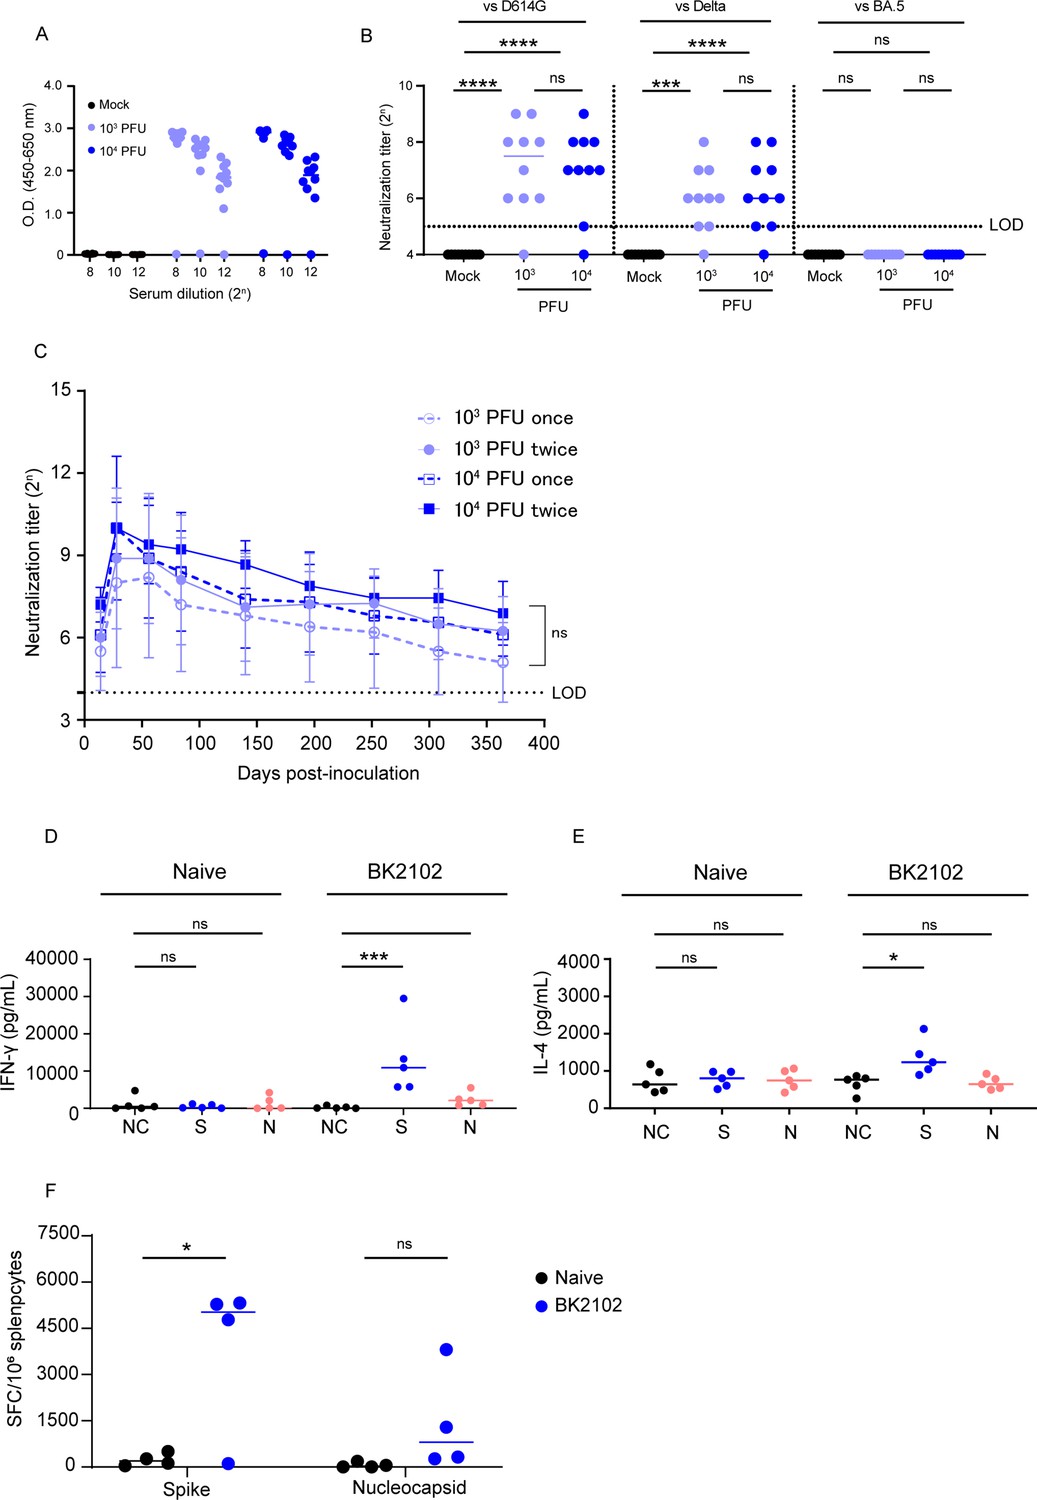
Immunogenicity of the vaccine candidate in hamsters.
(A) Hamsters were inoculated with 1 × 10³ or 1 × 10⁴ plaque-forming unit (PFU) of BK2102 intranasally, and the serum was collected 4 weeks after inoculation. Spike-specific IgG in the sera of BK2102-inoculated hamsters and mock-treated hamsters was detected by ELISA. Symbols depict data of individual hamsters (n=10), and bars correspond to the median value. The limit of dilution is indicated in the x-axis. (B) Neutralizing antibodies in the sera were induced in BK2102-inoculated hamsters. Neutralizing antibodies in the sera were measured at day 28 post-inoculation using the following authentic SARS-CoV-2 strains: wild-type D614G (left), Delta (middle), and BA.5 (right). Symbols represent titers of individual animals (n=10), and the bars indicate the median. The limit of detection (LOD) was 25, and for samples below the LOD, the mean value was set to 24. The dotted line represents the assay’s LOD. For statistical analysis, one-way ANOVA with Tukey’s multiple-comparison test was performed (ns, not significant; ***p<0.001; ****p<0.0001). (C) Neutralizing antibodies persist in hamsters for at least 364 days. The neutralizing antibody titer against the authentic D614G wild-type strain was measured periodically in the sera of hamsters inoculated with BK2102 (once or twice at 4-week intervals with 1 × 10³ or 1 × 10⁴ PFU) for about a year. Symbols represent the mean of 9–10 animals, and error bars represent the SD. The LOD was 24, and for samples below the LOD, the mean value was set to 23. The dotted line represents the assay’s LOD. For statistical analysis, two-way ANOVA with Tukey’s multiple-comparison test was performed (ns, not significant). (D, E) Evaluation of the cellular immune response in BK2102-inoculated hamsters. Splenocytes were collected 1 week post-inoculation with 1 × 10⁴ PFU of BK2102 and were stimulated in vitro with spike or nucleocapsid peptide pools. IFN-γ (D) and IL-4 (E) in the supernatants were measured with commercially available ELISA kits (MABTECH AB and FineTest, respectively). Symbols depict data of individual hamsters (n=5), and bars indicate the median. For statistical analysis, one-way ANOVA with Tukey’s multiple-comparison test was performed (ns, not significant; *p<0.05; ***p<0.001). This experiment was conducted twice to ensure reproducibility. (F) Evaluation of IFN-γ-secreting cells. Four hamsters were inoculated with 1 × 10⁴ PFU of BK2102 once and the splenocytes were collected a week later. Splenocytes were stimulated in vitro with spike or nucleocapsid peptide pools for 24 hr. IFN-γ-secreting splenocytes were quantified by ELISPOT. Symbols depict data of individual hamsters (n=4), and bars indicate the median. For statistical analysis, two-way ANOVA with Sidak’s multiple-comparison test was performed (ns, not significant; *p<0.05).
-
Figure 2—source data 1
Related to Figure 2A.
- https://cdn.elifesciences.org/articles/97532/elife-97532-fig2-data1-v1.zip
-
Figure 2—source data 2
Related to Figure 2B.
- https://cdn.elifesciences.org/articles/97532/elife-97532-fig2-data2-v1.zip
-
Figure 2—source data 3
Related to Figure 2C and Figure 2—figure supplement 3.
- https://cdn.elifesciences.org/articles/97532/elife-97532-fig2-data3-v1.zip
-
Figure 2—source data 4
Related to Figure 2D and E.
- https://cdn.elifesciences.org/articles/97532/elife-97532-fig2-data4-v1.zip
-
Figure 2—source data 5
Related to Figure 2F.
- https://cdn.elifesciences.org/articles/97532/elife-97532-fig2-data5-v1.zip
Figure 2—figure supplement 1
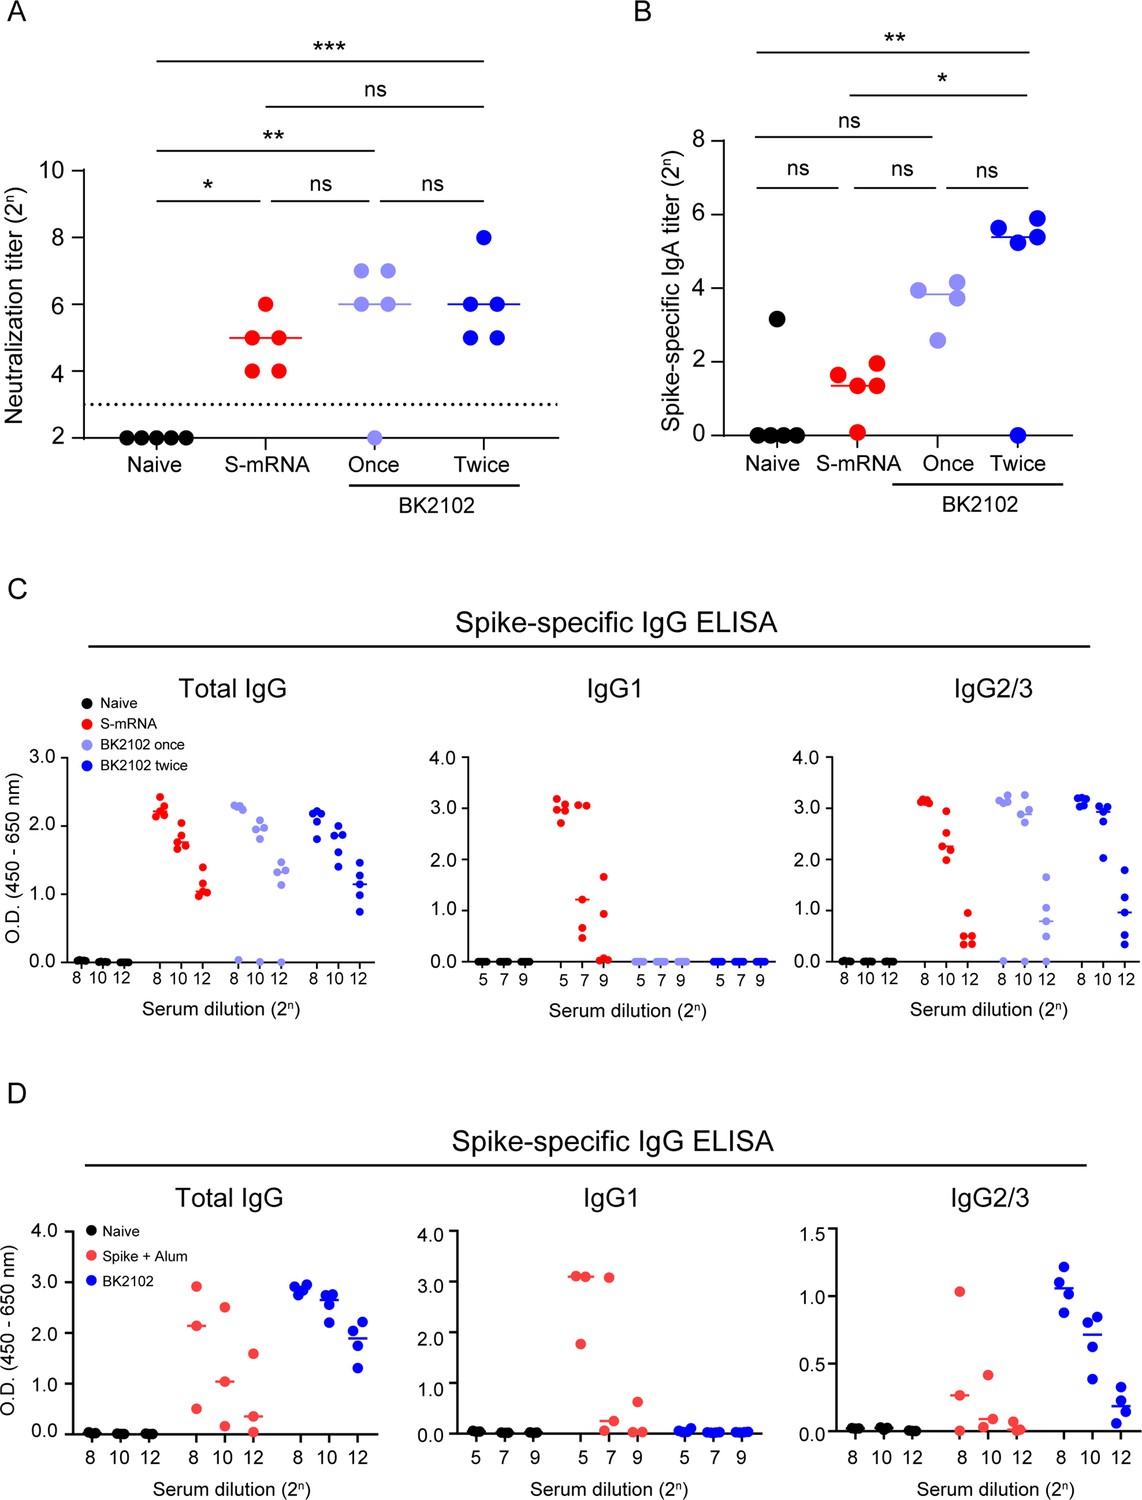
Comparison of immunogenicity of BK2102 with other vaccine modalities.
(A) An mRNA vaccine was administered to hamsters intramuscularly twice at 2-week intervals, and BK2102 was inoculated to another group of hamsters intranasally once or twice at 2-week intervals. Neutralizing antibodies in the sera were measured at day 28 post-first inoculation using authentic SARS-CoV-2 wild-type D614G strain. Symbols represent titers of individual animals (n=5), and the bars indicate the median. The limit of detection (LOD) was 23, and for samples below the LOD, the mean value was set to 22. The dotted line represents the assay’s LOD. For statistical analysis, one-way ANOVA with Tukey’s multiple-comparison test was performed (ns, not significant; *p<0.05; **p<0.01; ***p<0.001). (B) SARS-CoV-2 spike-specific IgA measured via ELISA of nasal wash from inoculated hamsters, 28 days post-first inoculation. Symbols represent titers of individual animals (n=4 or 5), and the bars indicate the median. To calculate the IgA titer, the dilution factor at an OD value of 0.1 was considered and corrected with the value of the standard serum included in each plate. For statistical analysis, one-way ANOVA with Tukey’s multiple-comparison test was performed (ns, not significant; *p<0.05; **p<0.01; ***p<0.001). (C) SARS-CoV-2 spike-specific total IgG and IgG subclasses (IgG1 and IgG2/3) were measured in the serum of inoculated hamsters, 28 days post-first inoculation via ELISA. Symbols depict data of individual hamsters (n=5), and bars correspond to the median value. (D) Recombinant SARS-CoV-2 Spike-protein mixed with an alum adjuvant was administered to hamsters intramuscularly twice at 2-week intervals, and BK2102 inoculated once to another group of hamsters intranasally. SARS-CoV-2 spike-specific total IgG and IgG subclasses (IgG1 and IgG2/3) were measured via ELISA of serum from inoculated hamsters, 28 days post-inoculation. Symbols depict data of individual hamsters (n=3), and bars correspond to the median value.
-
Figure 2—figure supplement 1—source data 1
Related to Figure 2—figure supplement 1A.
- https://cdn.elifesciences.org/articles/97532/elife-97532-fig2-figsupp1-data1-v1.zip
-
Figure 2—figure supplement 1—source data 2
Related to Figure 2—figure supplement 1B.
- https://cdn.elifesciences.org/articles/97532/elife-97532-fig2-figsupp1-data2-v1.zip
-
Figure 2—figure supplement 1—source data 3
Related to Figure 2—figure supplement 1C.
- https://cdn.elifesciences.org/articles/97532/elife-97532-fig2-figsupp1-data3-v1.zip
-
Figure 2—figure supplement 1—source data 4
Related to Figure 2—figure supplement 1D.
- https://cdn.elifesciences.org/articles/97532/elife-97532-fig2-figsupp1-data4-v1.zip
Figure 2—figure supplement 2
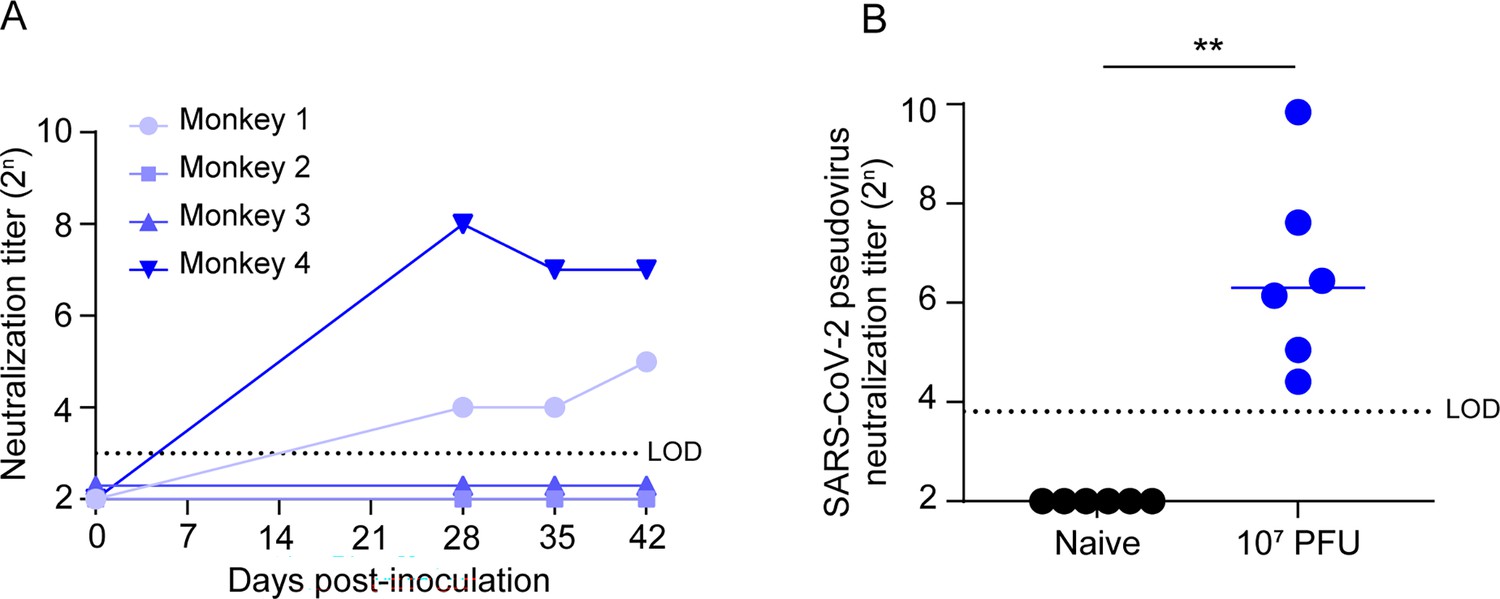
Immunogenicity of BK2102 in monkeys.
(A) Immune response in monkeys. Neutralizing antibodies in the sera of monkeys inoculated with 107 plaque-forming unit (PFU) of BK2102 were measured at the indicated time points post-inoculation. The data for individual monkeys are shown (n=4). The LOD was 23, and for samples below the LOD, the mean value was set to 22. The dotted line represents the assay’s LOD. (B) Neutralizing antibodies in the sera were induced in BK2102-inoculated monkeys. Monkeys were inoculated with 107 PFU of BK2102 or the solvent, receiving three doses given at 2-week intervals. Neutralizing antibodies in the sera were measured at day 42 post-inoculation using luciferase-expressing pseudovirus carrying the SARS-CoV-2 Wuhan strain’s spike protein. Symbols represent titers of individual animals (n=6), and the bars indicate the median. The LOD was 23.8, and for samples below the LOD, the mean value was c set to 22. The dotted line represents the assay’s LOD. For statistical analysis, Mann–Whitney U test was performed (**p<0.01).
-
Figure 2—figure supplement 2—source data 1
Related to Figure 2—figure supplement 2A.
- https://cdn.elifesciences.org/articles/97532/elife-97532-fig2-figsupp2-data1-v1.zip
-
Figure 2—figure supplement 2—source data 2
Related to Figure 2—figure supplement 2B.
- https://cdn.elifesciences.org/articles/97532/elife-97532-fig2-figsupp2-data2-v1.zip
Figure 2—figure supplement 3
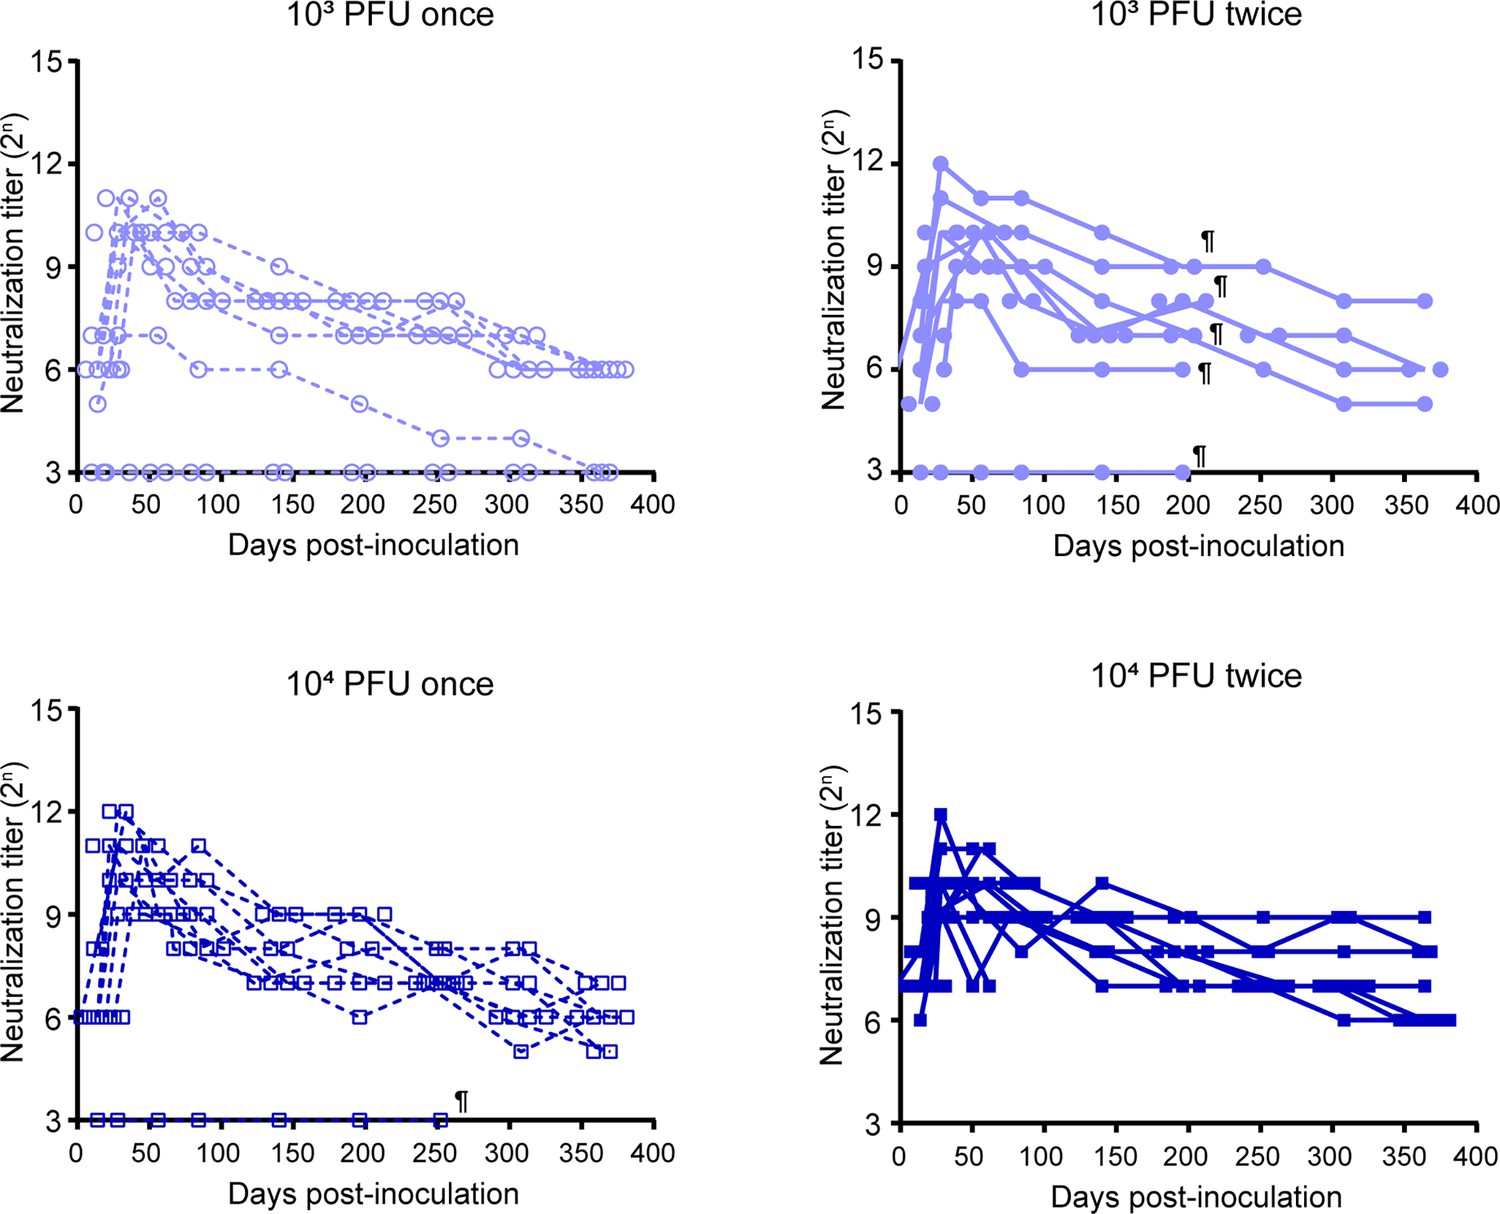
Persistence of the neutralizing antibodies induced by BK2102 in each group.
Results for individual hamsters in the group used in the experiment of Figure 2D are shown. Light–blue circles correspond to mice inoculated with 103 PFU, while dark–blue circles correspond to mice inoculated with 104 plaque-forming unit (PFU). Dotted lines depict one dose, and solid lines to two doses. ¶ Hamsters died due to aging, fighting, or mishandling.
Figure 2—figure supplement 4
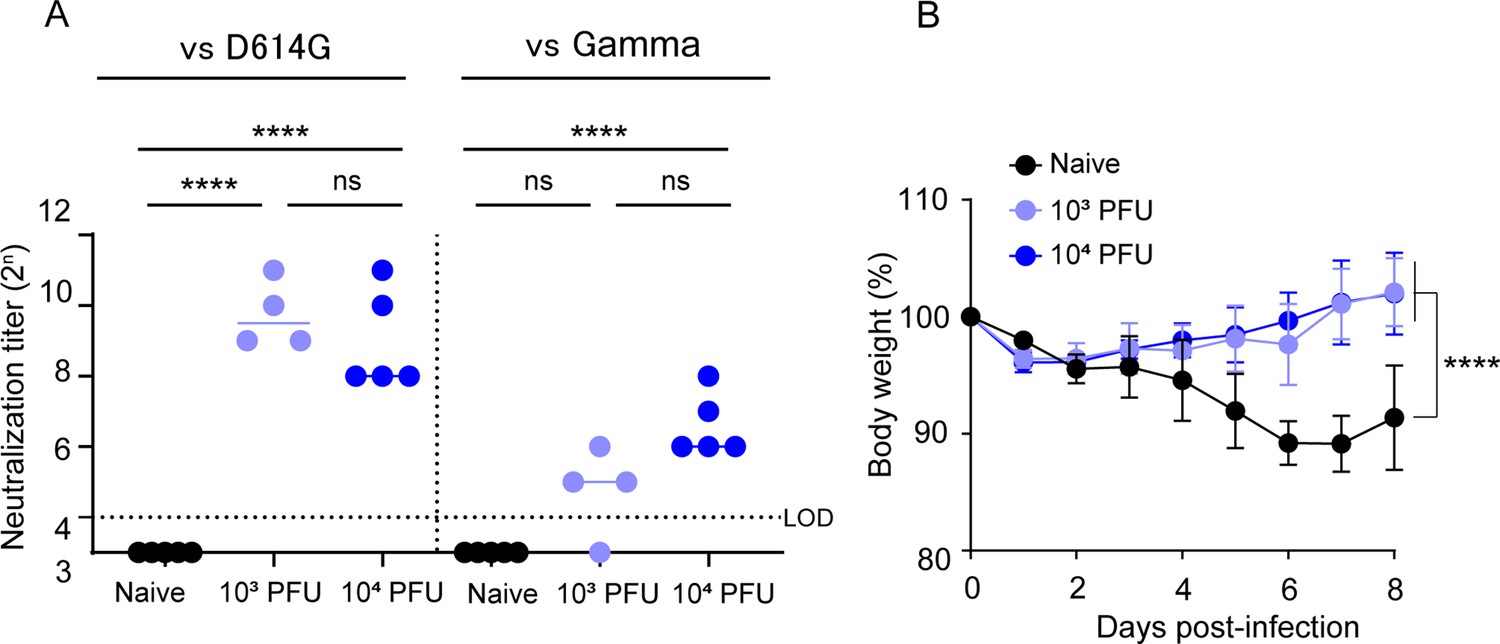
BK2102 induces protective immunity against SARS-CoV-2 gamma strain.
(A) Neutralizing antibodies in the sera were induced by BK2102-inoculated hamsters. Neutralizing antibodies in the sera were measured at day 28 post-inoculation using the following authentic SARS-CoV-2 strains: wild-type D614G (left) and gamma (right). Symbols represent titers of individual animals (n=4 or 5), and the bars indicate the median. The dotted line represents the assay’s limit of detection (LOD). For statistical analysis, one-way ANOVA with Tukey’s multiple-comparison test was performed (ns, not significant; ****p<0.0001). (B) Weight changes in vaccinated mice after the challenge with the gamma strain. Hamsters inoculated with BK2102 were challenged with 3×10⁵ plaque-forming unit (PFU) of the gamma strain on day 28 post-inoculation. The symbols represent the average weight of the hamsters (n=4 or 5), and error bars indicate the mean SD. Two-way ANOVA with Tukey’s multiple-comparison test was performed for statistical analysis (****p<0.0001).
-
Figure 2—figure supplement 4—source data 1
Related to Figure 2—figure supplement 4A.
- https://cdn.elifesciences.org/articles/97532/elife-97532-fig2-figsupp4-data1-v1.zip
Figure 3 with 2 supplements
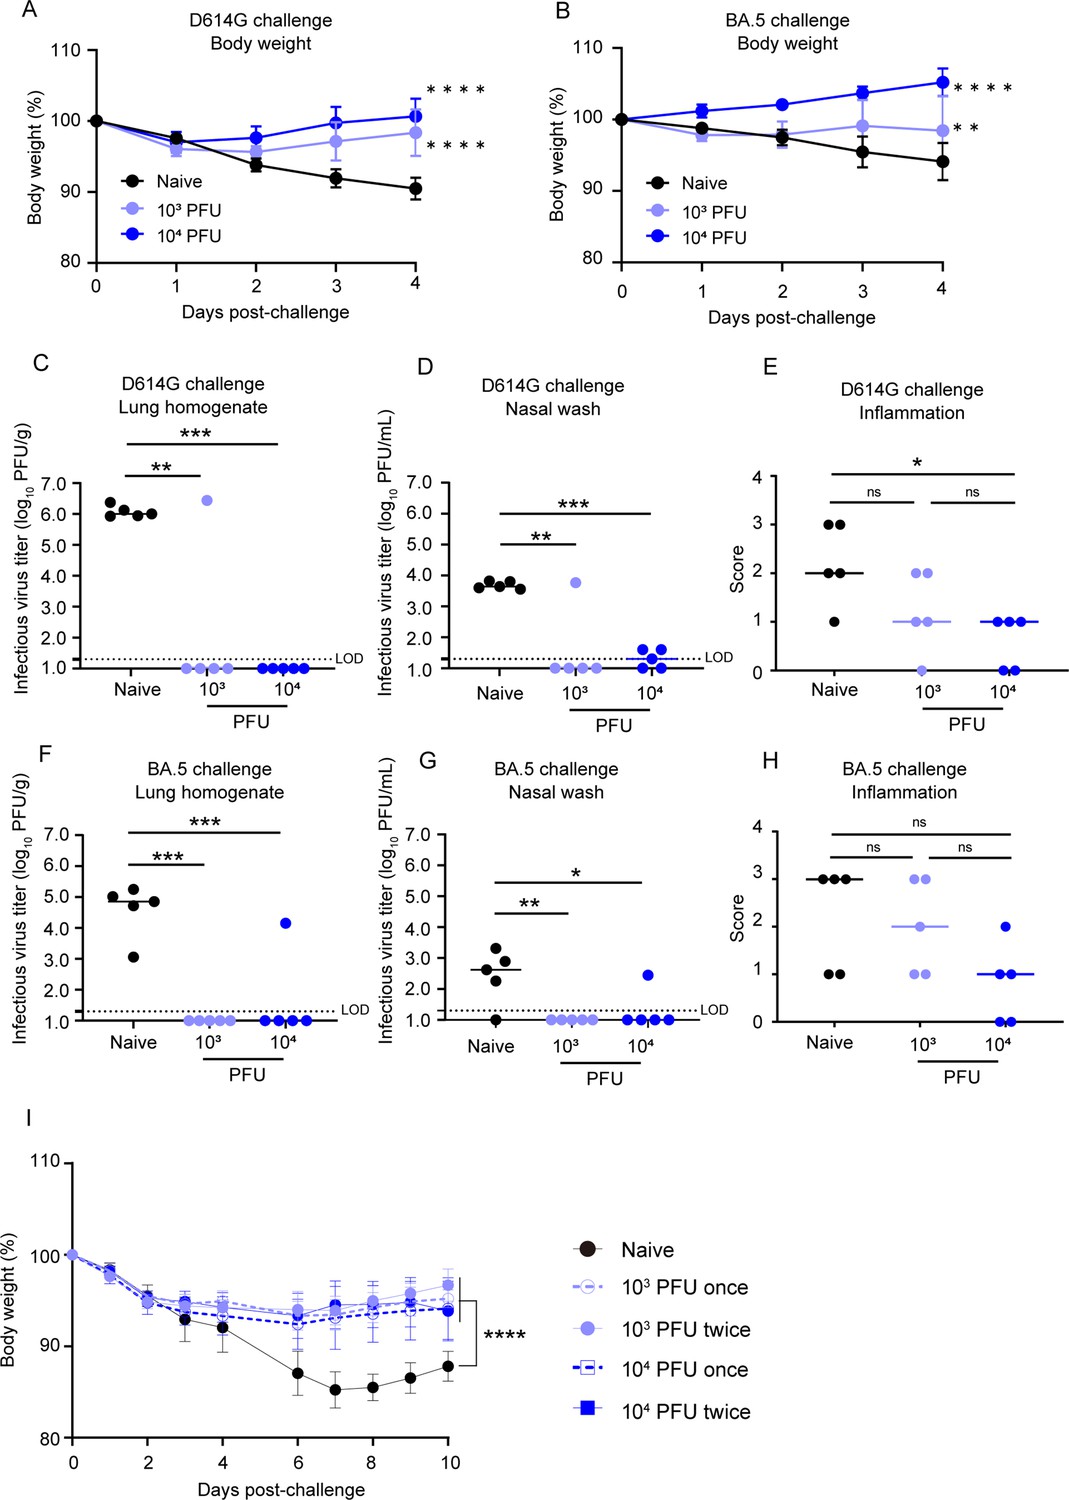
BK2102 induces protective immunity.
(A, B) BK2102 protects hamsters against homologous and heterologous virus challenges. Hamsters that received a full vaccination protocol with the indicated doses of BK2102 were challenged with 3 × 10⁵ plaque-forming unit (PFU) of wild-type D614G (A) or BA.5 (B) strains, and their body weight was monitored for 4 days. Body weight is expressed as a percentage of the initial weight. The symbols represent the average weight of the hamsters (n=5), and error bars indicate the mean SD. Two-way ANOVA with Tukey’s multiple-comparison test was performed for statistical analysis (**p<0.01; ****p<0.0001). (C, D, F, G) The infectious virus titer in the lungs and nasal wash specimens taken on day 4 post-challenge was measured via a plaque assay for the wild-type D614G strain (C, D) and for the BA.5 strain (F, G). Symbols represent titers of individual animals (n=5), and the bars indicate the median. The limit of detection (LOD) was 1.3 log10 PFU/g or PFU/mL, and for samples below the LOD, the mean value was calculated as 1.0 log10 PFU/g or PFU/mL. The dotted line represents the assay’s LOD. One-way ANOVA with Dunnett’s multiple-comparison test was performed for statistical analysis (ns, not significant; *p<0.05; **p<0.01; ***p<0.001). (E, H) Lung inflammation scores were determined via H&E staining of D614G- (E) and BA.5-challenged (H) hamsters. The percentage of the disrupted area in the entire visual field was classified as 0: not remarkable (<10%); 1: minimal (10–50%); and 2: mild (50–70%). Symbols depict data of individual animals (n=5), and the bars indicate the median. One-way ANOVA with Tukey’s multiple-comparison test was performed for statistical analysis (ns, not significant; *p<0.05). (I) Weight changes after the challenge assay 1 year post-inoculation with BK2102. Hamsters inoculated with BK2102 were challenged with the wild-type D614G strain at 3 × 10⁵ PFU on 420 days. Nine-month-old elder hamsters were used as the naïve group. The symbols represent the average weight of the hamsters (n=4 or 5), and error bars indicate the mean SD. Two-way ANOVA with Tukey’s multiple-comparison test was performed for statistical analysis (****p<0.0001).
-
Figure 3—source data 1
Related to Figure 3A and B.
- https://cdn.elifesciences.org/articles/97532/elife-97532-fig3-data1-v1.zip
-
Figure 3—source data 2
Related to Figure 3C, D, F and G.
- https://cdn.elifesciences.org/articles/97532/elife-97532-fig3-data2-v1.zip
-
Figure 3—source data 3
Related to Figure 3E and H.
- https://cdn.elifesciences.org/articles/97532/elife-97532-fig3-data3-v1.zip
-
Figure 3—source data 4
Related to Figure 3I.
- https://cdn.elifesciences.org/articles/97532/elife-97532-fig3-data4-v1.zip
Figure 3—figure supplement 1

BK2102 induces protective immunity against SARS-CoV-2 gamma strain.
-
Figure 3—figure supplement 1—source data 1
Related to Figure 3—figure supplement 1B.
- https://cdn.elifesciences.org/articles/97532/elife-97532-fig3-figsupp1-data1-v1.zip
Figure 3—figure supplement 2
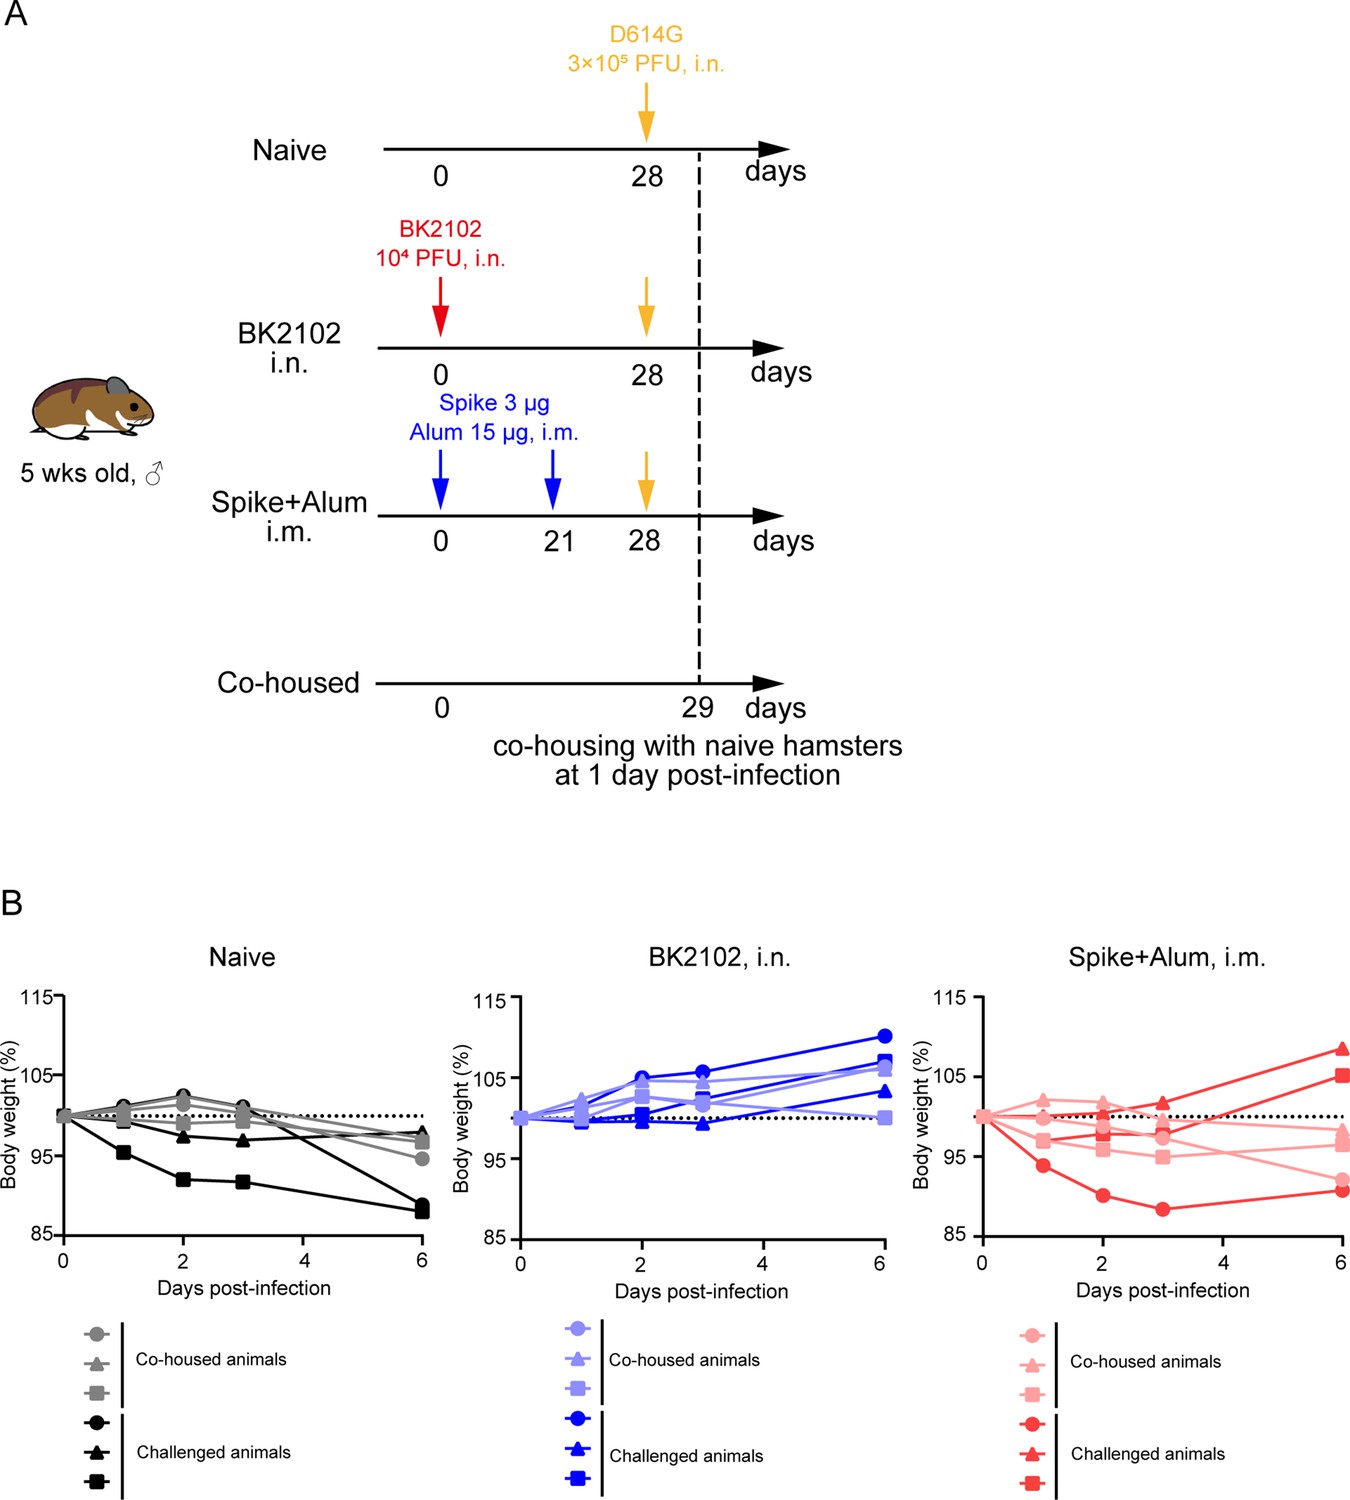
Evaluation of BK2102 onward transmission in hamsters.
(A) Scheme of the onward transmission experiment. Hamsters that received the full vaccination protocol with the indicated doses of BK2102 and recombinant SARS-CoV-2 spike protein mixed with an alum adjuvant were challenged with the wild-type D614G strain. Vaccinated and infected animals were co-housed with naïve hamsters at 1 day post-infection. (B) Body weight was monitored for 6 days. Body weight is expressed as a percentage of the initial weight. The data for individual hamsters are shown (n=3).
-
Figure 3—figure supplement 2—source data 1
Related to Figure 3—figure supplement 2B.
- https://cdn.elifesciences.org/articles/97532/elife-97532-fig3-figsupp2-data1-v1.zip
Figure 4 with 2 supplements
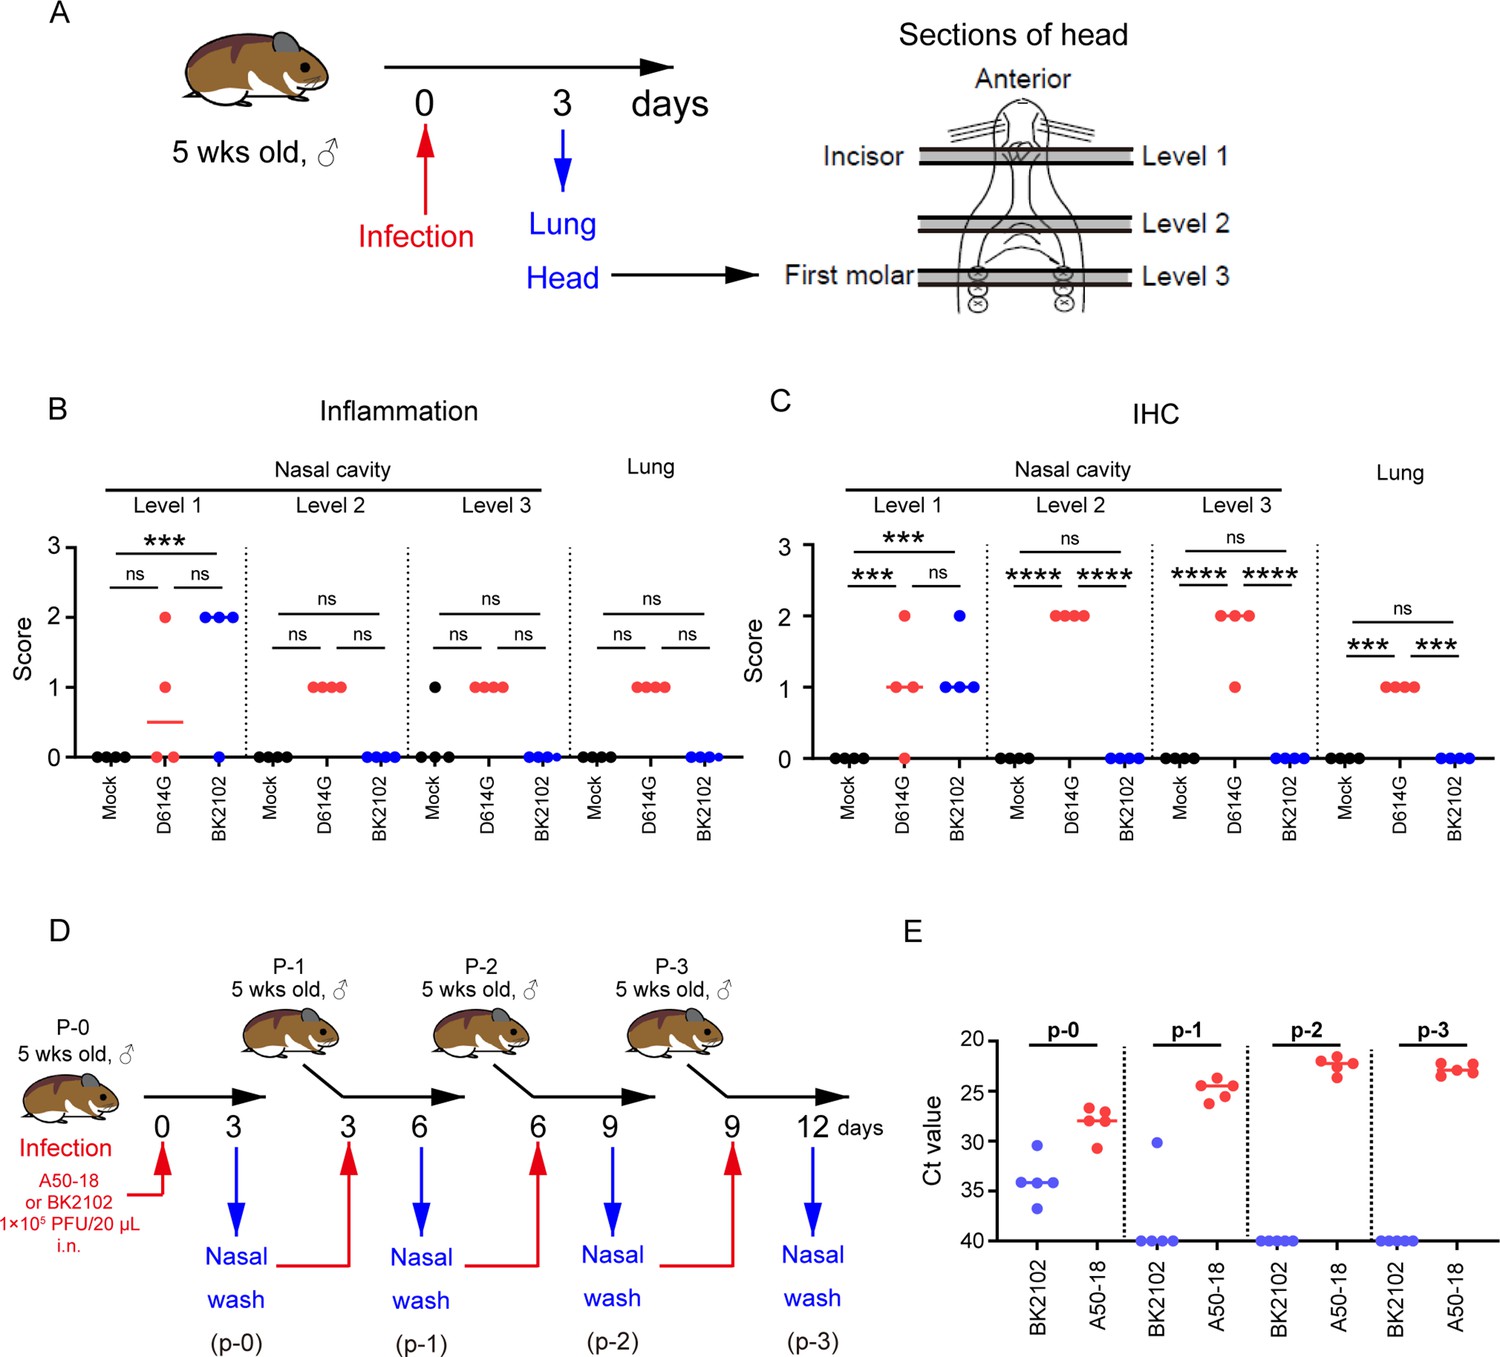
BK2102 caused localized tissue damage and posed as low risk of transmission.
(A) Scheme for the evaluation of tissue damage in acute infection with BK2102 in a hamster model. The wild-type D614G strain was used as a positive control. (B) Inflammation score of nasal cavity sections and lungs determined via H&E. The percentage of the disrupted area in the entire visual field was classified as 0: not remarkable (<10%); 1: minimal (10–50%); 2: mild (50–70%), respectively. The symbols depict data of individual hamsters (n=4), and the bars indicate the median. One-way ANOVA with Tukey’s multiple-comparison test was performed for statistical analysis (ns, not significant; ***p<0.001). (C) SARS-CoV-2 spike protein staining in the nasal cavity sections and lungs determined via immunohistochemistry using a SARS-CoV-2 spike RBD-specific antibody. The proportion of positive cells in the entire visual field was classified as 0: not remarkable (<10%); 1: minimal (10–50%); and 2: mild (50–70%), respectively. The symbols depict data of individual hamsters (n=4), and the bars indicate the median. One-way ANOVA with Tukey’s multiple-comparison test was performed for statistical analysis (ns, not significant; ***p<0.001; ****p<0.0001). (D) Scheme for the evaluation of BK2102 transmission via in vivo passage in hamsters. The TS-strain A50-18 was used as a positive control. (E) Ct values obtained for the RT-PCR performed using RNA extracted from the nasal wash specimens. This experiment was conducted three times to ensure reproducibility. The symbols depict data of individual hamsters (n=5), and the bars indicate the median.
-
Figure 4—source data 1
Related to Figure 4B and C.
- https://cdn.elifesciences.org/articles/97532/elife-97532-fig4-data1-v1.xlsx
-
Figure 4—source data 2
Related to Figure 4E.
- https://cdn.elifesciences.org/articles/97532/elife-97532-fig4-data2-v1.xlsx
Figure 4—figure supplement 1
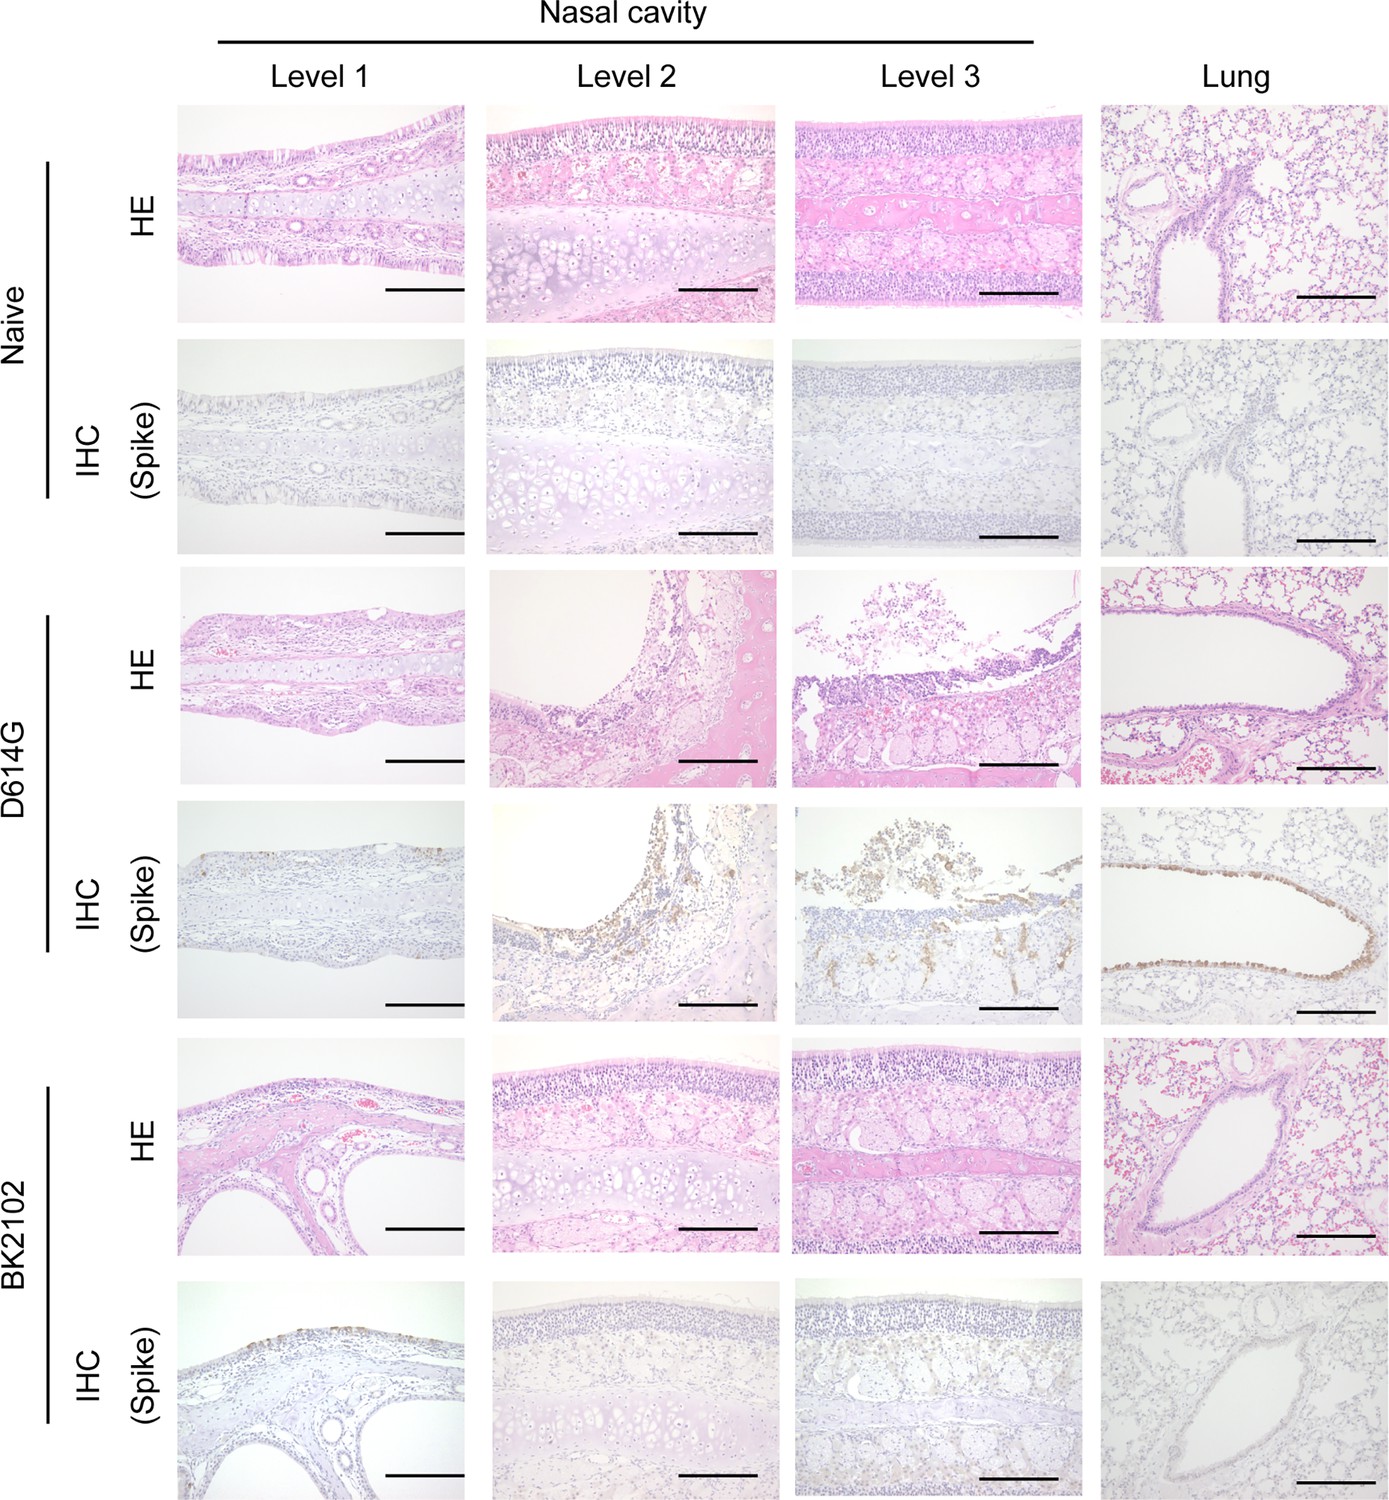
Evaluation of the tissue damage induced by BK2102.
H&E staining of nasal cavity sections and lungs is shown for hamsters infected with the wild-type D614G strain or the BK2102 vaccine candidate. IHC results using a SARS-CoV-2 spike RBD-specific antibody are shown in for the same sections. Scale bar: 200 μm.
Figure 4—figure supplement 2
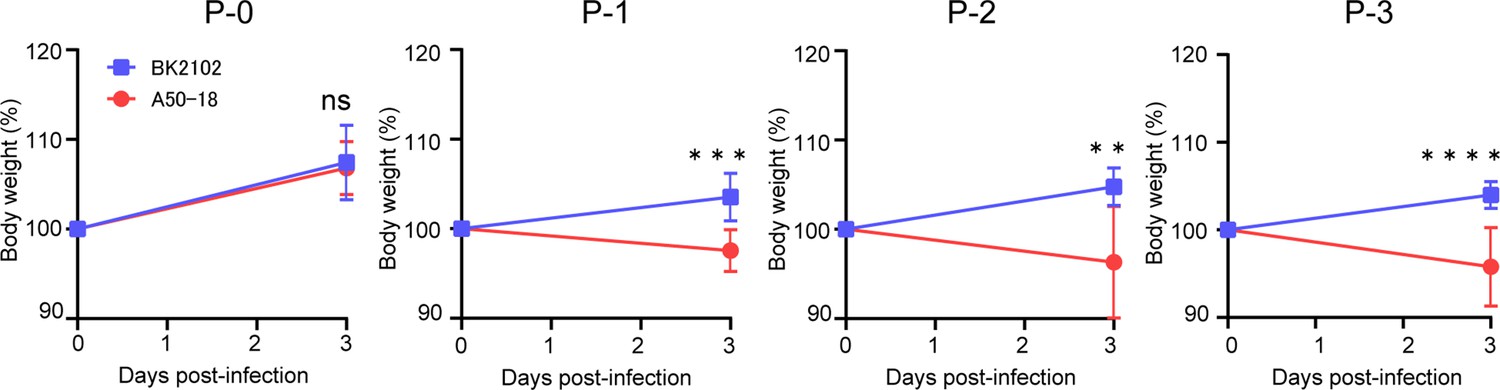
BK2102 showed a low risk of transmission.
The body weights of hamsters inoculated with the A50-18 TS and BK2102 strains obtained in the in vivo passage experiment detailed in Figure 4D are shown. Body weight is expressed as a percentage of the initial weight. The symbols represent the average weight of the hamsters (n=5), and error bars indicate the mean SD. For statistical analysis, two-way ANOVA with Holm–Sidak’s multiple-comparison test was performed (ns, not significant; **p<0.01; ***p<0.001; ****p<0.0001).
-
Figure 4—figure supplement 2—source data 1
Related to Figure 4—figure supplement 2.
- https://cdn.elifesciences.org/articles/97532/elife-97532-fig4-figsupp2-data1-v1.zip
Figure 5 with 1 supplement
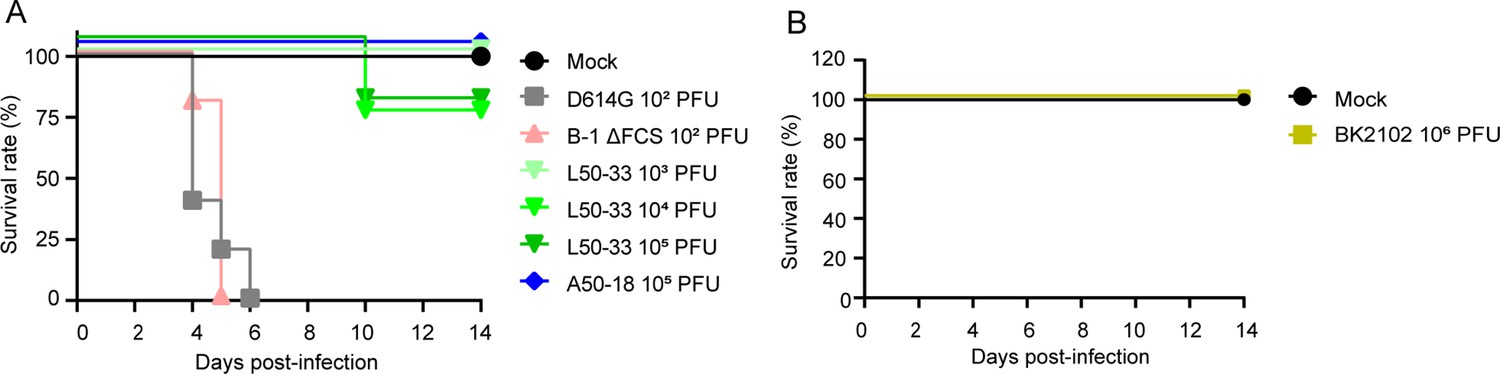
BK2102 showed a highly safe phenotype in Tg mice.
(A, B) Survival rate of Tg mice infected with the wild-type D614G, B-1 ΔFCS, L50-33, and A50-18 TS strains (A) and BK2102 (B). The symbols represent the survival rate of the hamsters (n=4 or 5).
-
Figure 5—source data 1
Related to Figure 5 and Figure 5—figure supplement 1.
- https://cdn.elifesciences.org/articles/97532/elife-97532-fig5-data1-v1.zip
-
Figure 5—source data 2
Related to Figure 5 and Figure 5—figure supplement 1.
- https://cdn.elifesciences.org/articles/97532/elife-97532-fig5-data2-v1.zip
Figure 5—figure supplement 1
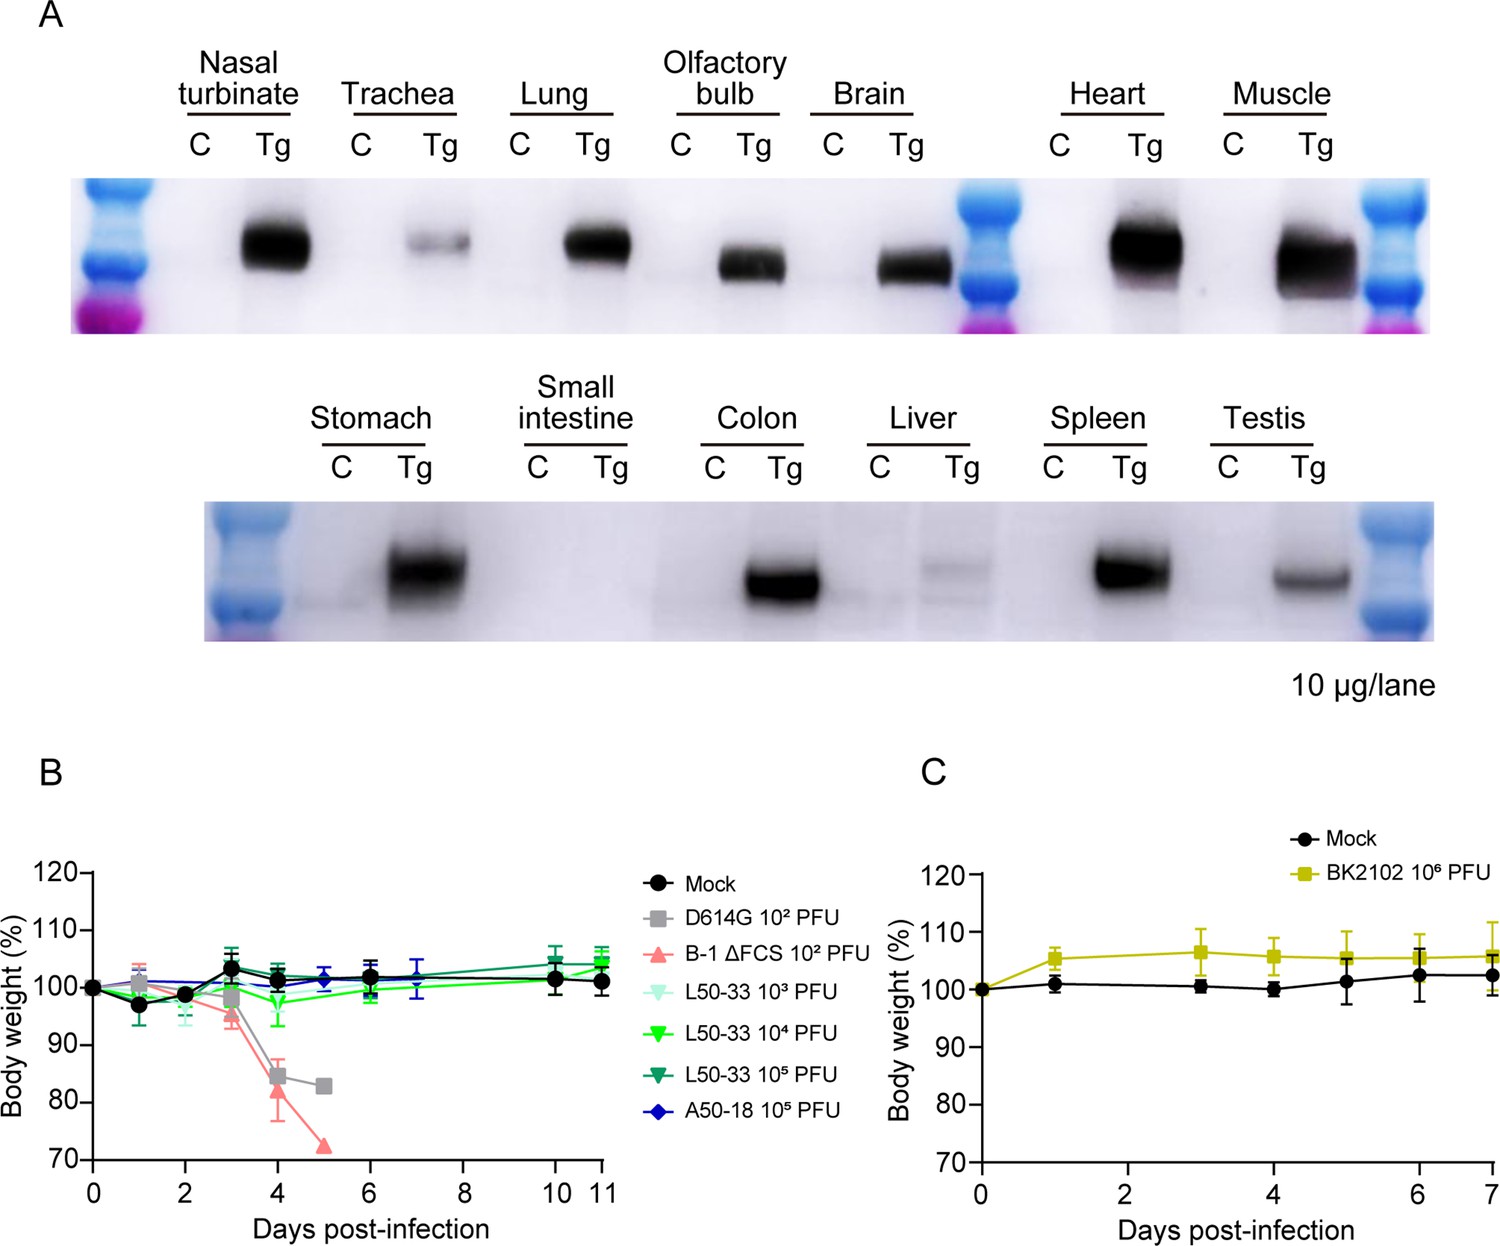
Expression of hACE2 and body weight of Tg mice after infection.
(A) The expression of hACE2 in various tissues of Tg mice was detected via western blotting using an anti-human ACE2 antibody (ab15348). (B) The body weight of Tg mice infected with the wild-type D614G, B-1 ΔFCS, L50-33, and A50-18 TS strains. The symbols represent the average weight of each group, and error bars indicate the mean SD. Two-way ANOVA with Tukey’s multiple-comparison test was performed for statistical analysis (ns, not significant; ****p<0.0001). (C) The body weight of Tg mice inoculated with the BK2102. The symbols represent the average weight of each group (n=4 or 5), and error bars indicate the mean SD. Two-way ANOVA with Tukey’s multiple-comparison test was performed for statistical analysis (ns, not significant).
-
Figure 5—figure supplement 1—source data 1
Original western blots for Figure 5—figure supplement 1.
- https://cdn.elifesciences.org/articles/97532/elife-97532-fig5-figsupp1-data1-v1.zip
-
Figure 5—figure supplement 1—source data 2
Image raw data of western blots for Figure 5—figure supplement 1.
- https://cdn.elifesciences.org/articles/97532/elife-97532-fig5-figsupp1-data2-v1.zip
Tables
Table 1
Genetic variations of viruses passaged in vivo.
| Mutations | ||||||
|---|---|---|---|---|---|---|
| ΔG359 - A382(NSP1) | G18782T(NSP14) | G19285A(NSP14) | C19550T(NSP14) | ΔA23598-G23624(Spike FCS) | ΔC27549-T28251(ORF7a-8) | |
| A50-18 | N/A | G | G/A | T | N/A | N/A |
| N/A | G/T | G/A | T | N/A | N/A | |
| N/A | G/T | G/A | T | N/A | N/A | |
| N/A | G/T | G | T | N/A | N/A | |
| N/A | G/T | G/A | T | N/A | N/A | |
| BK2102 | ○* | T | A | T | ○* | ○* |
| ○* | T | A | T | ○* | ○* | |
| ○* | T | A | T | ○* | ○* | |
| ○* | T | A | T | ○* | ○* | |
| ○* | T | A | T | ○* | ○* | |
-
N/A, not applicable.
-
*
Same sequence as the inoculated virus.
-
Table 1—source data 1
AB1 files of sequence data for Table 1.
- https://cdn.elifesciences.org/articles/97532/elife-97532-table1-data1-v1.zip
-
Table 1—source data 2
Agarose gel electrophoresis pattern of PCR products corresponding to the amplification of the ORF7a-8.
- https://cdn.elifesciences.org/articles/97532/elife-97532-table1-data2-v1.zip
Table 2
NSP3 genetic variations in viruses recovered from infected Tg mice.
-
Table 2—source data 1
Virus titer for Table 2.
- https://cdn.elifesciences.org/articles/97532/elife-97532-table2-data1-v1.xlsx
-
Table 2—source data 2
AB1 files of sequence data for Table 2.
- https://cdn.elifesciences.org/articles/97532/elife-97532-table2-data2-v1.zip
Table 3
SARS-CoV-2 strains.
| Reagent or resource | Source | Identifier | |
|---|---|---|---|
| SARS-CoV-2: pre-alpha type, D614G, B-1 strain | Yoshida et al., 2022 | NCBI: LC603286 | |
| A50-18 strain | Yoshida et al., 2022 | NCBI: LC603287 | |
| L50-33 strain | Yoshida et al., 2022 | NCBI: LC603289 | |
| B-1 ΔFCS strain | Current study | N/A | |
| Candidate 1 (BK2102) | Current study | N/A | |
| Candidate 2 | Current study | N/A | |
| Candidate 3 | Current study | N/A | |
| SARS-CoV-2: delta variant, BK325 strain | Research Foundation for Microbial Diseases of Osaka University | N/A | |
| SARS-CoV-2: gamma variant, TY7-501 strain | National Institute of Infectious Diseases | GISAID ID: EPI_ISL_833366 | |
| SARS-CoV-2: omicron variant, TY41-702 strain | National Institute of Infectious Diseases | GISAID ID: EPI_ISL_13241867 | |
-
N/A, not applicable.
Table 4
Primer list.
| Primer ID | Oligonucleotides | Source |
|---|---|---|
| F1_F | CTATATAAGCAGAGCTCGTTTAGTGAACCGTattaaaggtttataccttcccaggtaac | Torii et al., 2021 |
| F1_R | cagattcaacttgcatggcattgttagtagccttatttaaggctcctgc | Torii et al., 2021 |
| F2_F | gcaggagccttaaataaggctactaacaatgccatgcaagttgaatctg | Torii et al., 2021 |
| F2_R | ggtaggattttccactacttcttcagagactggttttagatcttcgcaggc | Torii et al., 2021 |
| F3_F | gcctgcgaagatctaaaaccagtctctgaagaagtagtggaaaatcctacc | Torii et al., 2021 |
| F3_R | ggtgcacagcgcagcttcttcaaaagtactaaagg | Torii et al., 2021 |
| F4_F | caccactaattcaacctattggtgctttggacatatcagcatctatagtagctggtgg | Torii et al., 2021 |
| F4_R | gtttaaaaacgattgtgcatcagctgactg | Torii et al., 2021 |
| F5_F | cacagtctgtaccgtctgcggtatgtggaaaggttatggctgtagttgtgatc | Torii et al., 2021 |
| F5_R | gcggtgtgtacatagcctcataaaactcaggttcccaataccttgaagtg | Torii et al., 2021 |
| F6_F | cacttcaaggtattgggaacctgagttttatgaggctatgtacacaccgc | Torii et al., 2021 |
| F6_R | catacaaactgccaccatcacaaccaggcaagttaaggttagatagcactctag | Torii et al., 2021 |
| F7_F | ctagagtgctatctaaccttaacttgcctggttgtgatggtggcagtttgtatg | Torii et al., 2021 |
| F7_R | ctagagactagtggcaataaaacaagaaaaacaaacattgttcgtttagttgttaac | Torii et al., 2021 |
| F8_F | gttaacaactaaacgaacaatgtttgtttttcttgttttattgccactagtctctag | Torii et al., 2021 |
| F8_R | gcagcaggatccacaagaacaacagcccttgagacaactacagcaactgg | Torii et al., 2021 |
| F9_F | ccagttgctgtagttgtctcaagggctgttgttcttgtggatcctgctgc | Torii et al., 2021 |
| F9_R | caatctccattggttgctcttcatc | Torii et al., 2021 |
| F10_F | gatgaagagcaaccaatggagattg | Torii et al., 2021 |
| F10_R | GGAGATGCCATGCCGACCCtttttttttttttttttttttttttgtcattctcctaag | Torii et al., 2021 |
| Linker_F | cttaggagaatgacaaaaaaaaaaaaaaaaaaaaaaaaaGGGTCGGCATGGCATCTCC | Torii et al., 2021 |
| Linker_R | gttacctgggaaggtataaacctttaatACGGTTCACTAAACGAGCTCTGCTTATATAG | Torii et al., 2021 |
| TS_F6_R | catacaaactgccacTatcacaaccaggcaagttaaggttagatagcactctag | Yoshida et al., 2022 |
| TS_F7_F | ctagagtgctatctaaccttaacttgcctggttgtgatAgtggcagtttgtatg | Yoshida et al., 2022 |
Additional files
Download links
A two-part list of links to download the article, or parts of the article, in various formats.
Downloads (link to download the article as PDF)
Open citations (links to open the citations from this article in various online reference manager services)
Cite this article (links to download the citations from this article in formats compatible with various reference manager tools)
Immunogenicity and safety of a live-attenuated SARS-CoV-2 vaccine candidate based on multiple attenuation mechanisms
eLife 13:RP97532.
https://doi.org/10.7554/eLife.97532.3


