GABAergic inhibition in human hMT+ predicts visuo-spatial intelligence mediated through the frontal cortex
- Department of Neurosurgery of the Second Affiliated Hospital, Interdisciplinary Institute of Neuroscience and Technology, Zhejiang University School of Medicine, China
- Department of Psychology and Behavioral Sciences, Zhejiang University, China
- Key Laboratory of Biomedical Engineering of Ministry of Education, Qiushi Academy for Advanced Studies, College of Biomedical Engineering and Instrument Science, Zhejiang University, China
- College of Intelligence Science and Technology, National University of Defense Technology, China
- University of Ottawa Institute of Mental Health Research, University of Ottawa, Canada
- Oujiang Laboratory (Zhejiang Lab for Regenerative Medicine, Vision and Brain Health), China
- MOE Frontier Science Center for Brain Science & Brain-Machine Integration, Zhejiang University, China
Figures
Figure 1
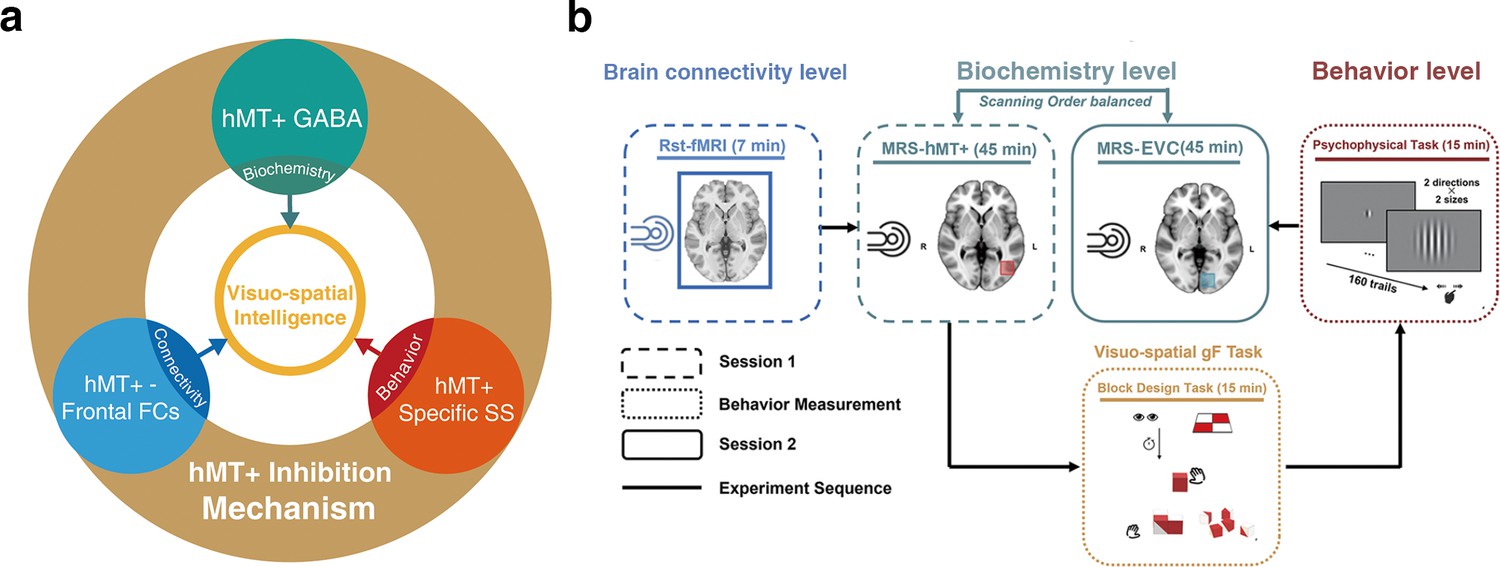
Hypothesis and experimental design.
(a) Schematic of hypothesis. The inhibition mechanism centered on MT+ GABA, including the molecular level: the GABAergic inhibition in MT+ (cyan circle), brain connectivity level: hMT+-frontal functional connectivity (blue circle), and behavior level: hMT+ specific surround suppression of visual motion (red circle), contributes to the visuo-spatial component of general fluid intelligence (gF) (3D domain, yellow circle). (b) Schematic of experimental design. Session 1 (rectangle box of short line) was the functional MRI and MRS scanning at resting state. Session 2 (rectangle box of solid line) was another region of MRS acquisition. In the two sessions, the order of MRS scanning regions (hMT+ and early visual cortex [EVC] [primarily in V1]) was counterbalanced across participants. There was a structural MRI scanning before each MRS data acquisition. The interval between the two sessions was used for behavioral measurement (rectangle box of dotted line): block design task (BDT) and psychophysical task-motion discrimination. Sold lines indicate the experiment sequence.
Figure 2 with 1 supplement

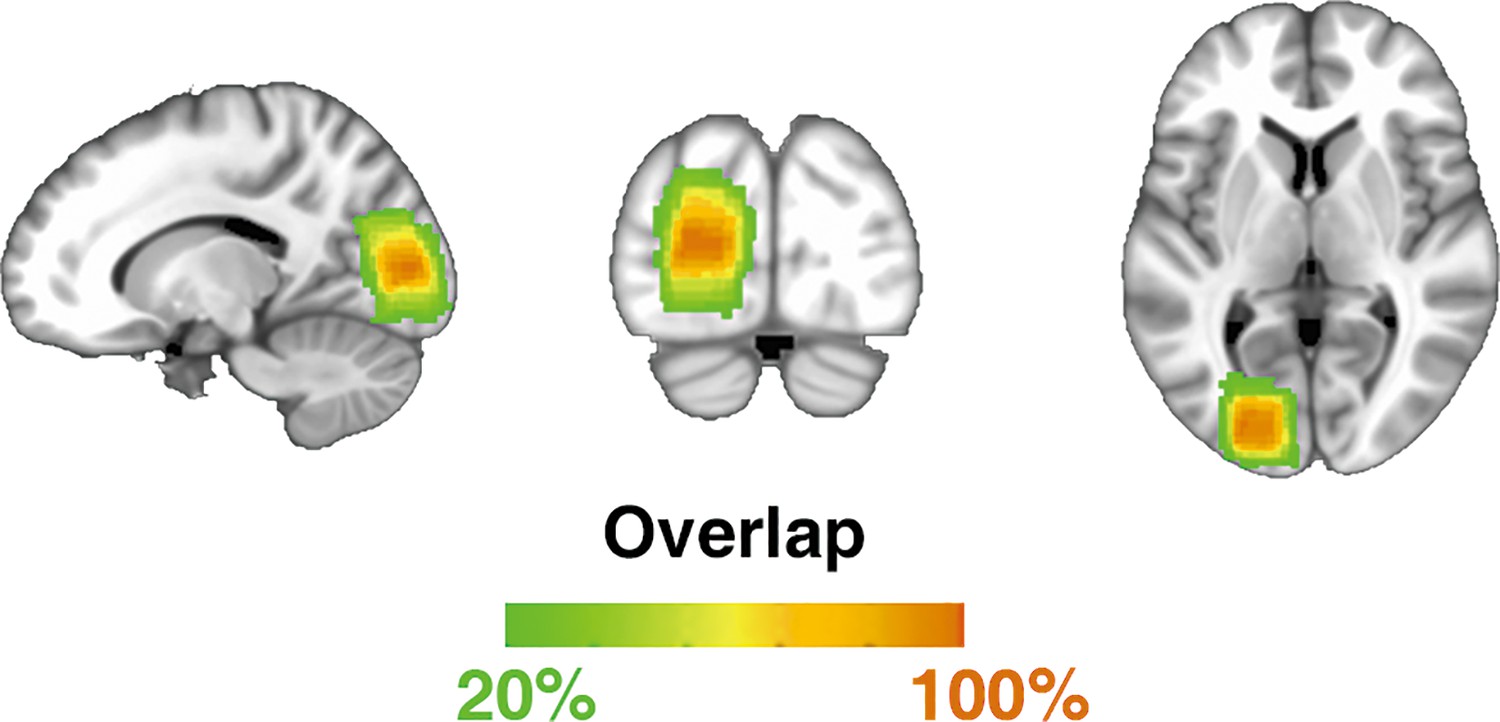
hMT+ localizer scans and hMT+ magnetic resonance spectroscopy (MRS) volume-of-interest (VOI) placement.
(a) Single task block designs. First: a cross fixation on the center of the screen (10 s). Second: a moving grating (2°) toward left last 10 s. Third: the grating keeps static for 10 s. Fourth: the grating moves toward right last 10 s. The localizer scans consist of 8 blocks. (b) hMT+ location and MRS VOI placement. The upper template is the horizontal view. The lower templates from left to right are coronal and sagittal views. The warm color indicates the overlap of fMRI activation of hMT+ across 14 subjects, the cold color bar indicates the overlap of MRS VOIs across all subjects.
Figure 2—figure supplement 1
The left hemisphere early visual cortex (EVC) (primarily in V1) magnetic resonance spectroscopy (MRS) scanning ROI.
The color bar indicates the overlap of the MRS volume-of-interests (VOIs) across all subjects.
Figure 3 with 4 supplements
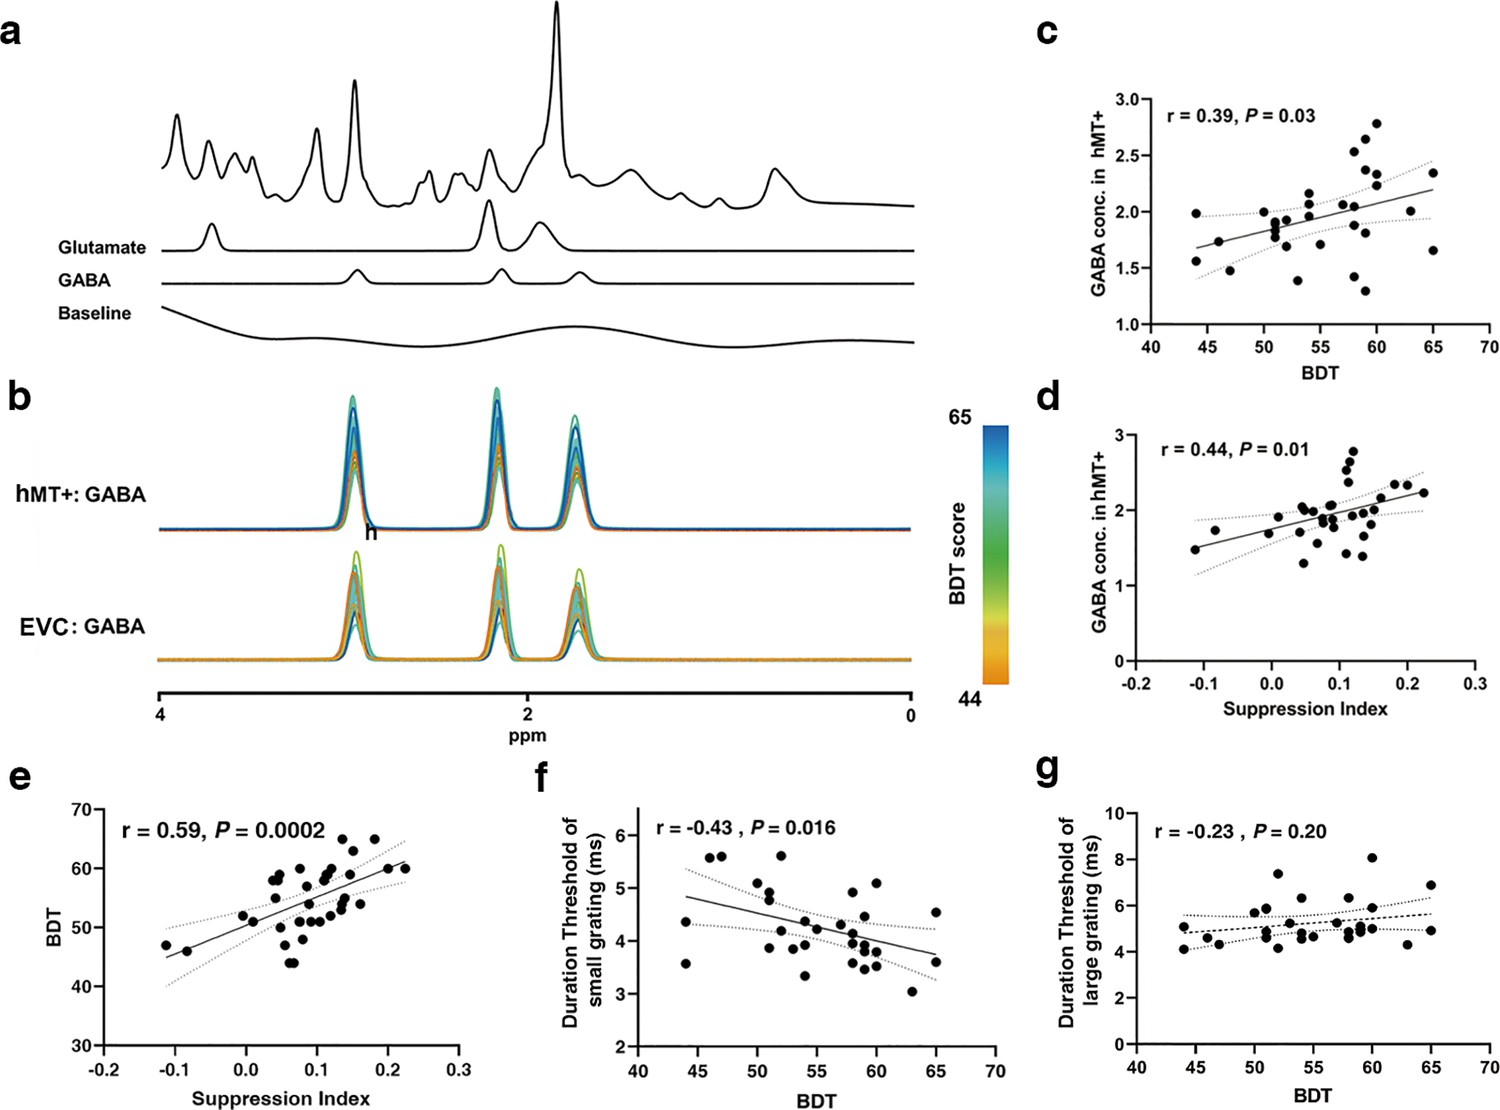
Magnetic resonance spectroscopy (MRS) spectra and the relationships between GABA levels and suppression index (SI)/block design test (BDT).
(a) Example spectrum from the hMT+ voxel of one participant. The first line is the LCModel fitting result of all metabolites, and the following lines show the Glu and GABA spectra fitting with LCModel, and then the baseline. (b) Individual participants fitted GABA MRS spectra from the hMT+ (top) and early visual cortex (EVC) (primarily in V1) (bottom) voxels from baseline measurement. The colors of the GABA spectra represent the individual differences of BDT. The color bar represents the scores of BDT. (c, d) Pearson’s correlations showing significant positive correlations between hMT+ GABA and BDT scores (c), between hMT+ GABA and SI (d). (e) Peason’s correlation showing significant positive correlations between SI and BDT. (f) Peason’s correlation showing significant negative correlations between BDT and duration threshold of small grating. (g) No correlation between BDT and duration threshold of large grating. The ribbon between dotted lines represents the 95% confidence interval, and the black regression line represents the Pearson’s correlation coefficient (r). GABA and Glu concentrations (Conc.) are absolute, with units of mmol per kg wet weight (Materials and methods).
Figure 3—figure supplement 1
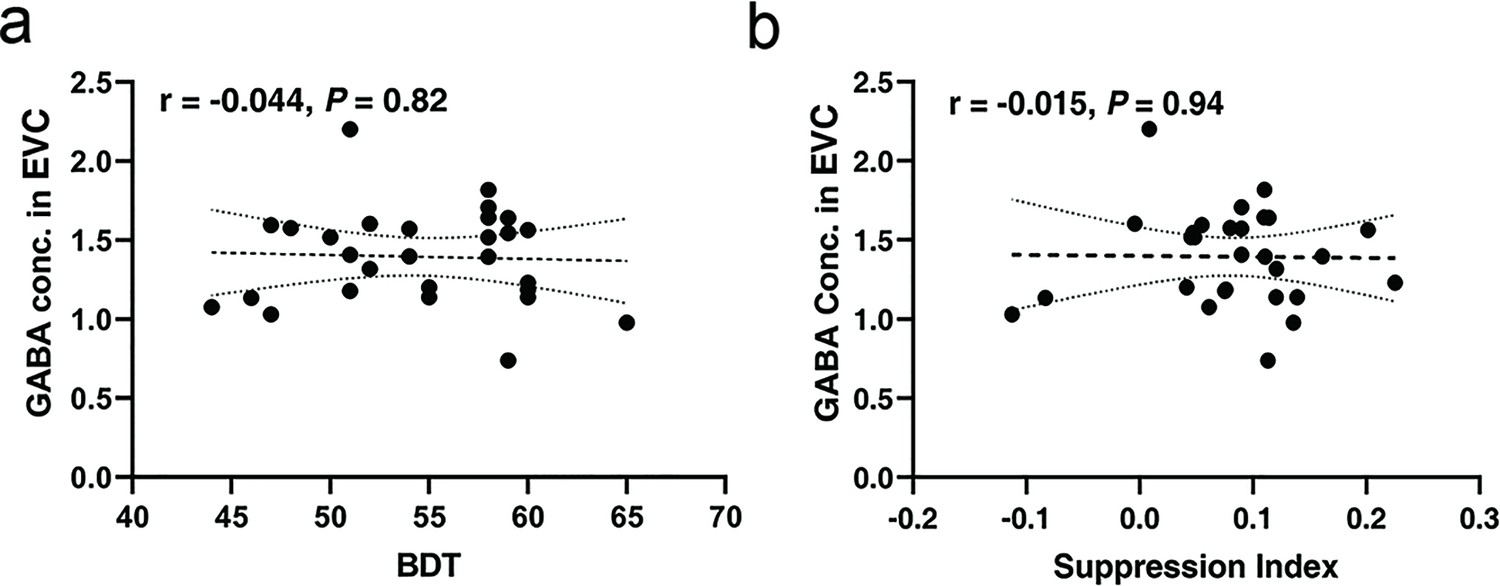
Relationships between GABA concentration in early visual cortex (EVC)1 (primarily in V1) and block design test (BDT)/suppression index (SI).
(a) There is no significant relationship between BDT and GABA concentrations in EVC (primarily in V1) region. (b) There is also no obvious correlation between SI and GABA concentrations in EVC (primarily in V1) region. GABA concentration (Conc.) is absolute, with units of mmol per kg wet weight (Materials and methods).
Figure 3—figure supplement 2
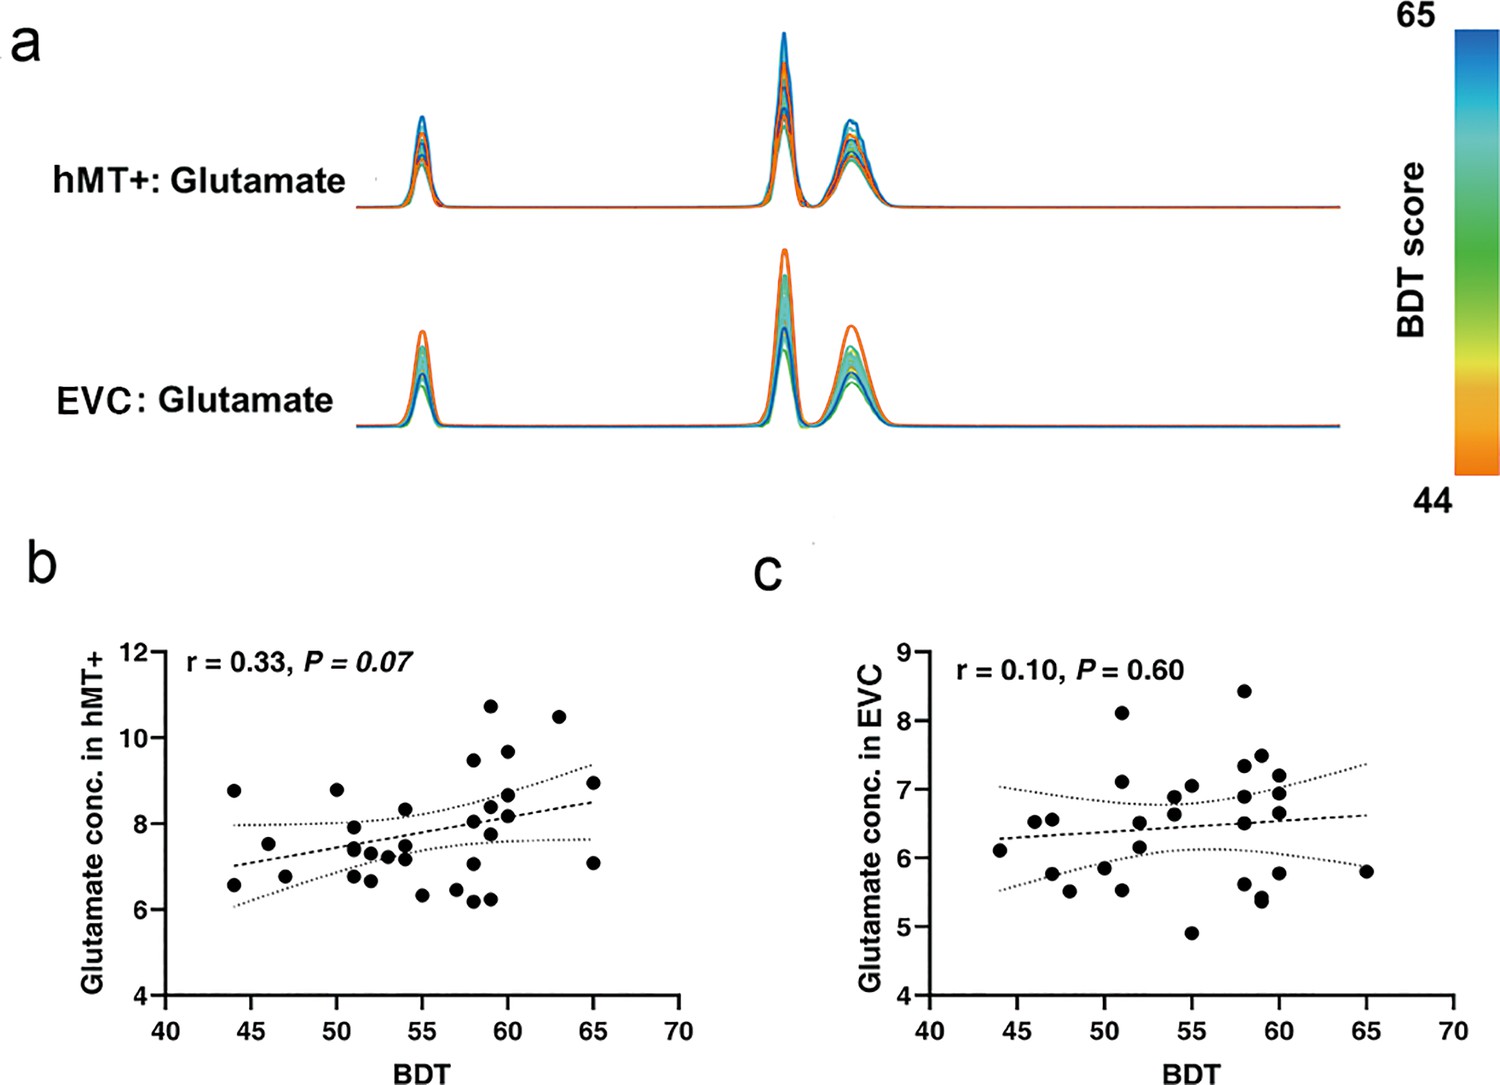
Individual Glu magnetic resonance spectroscopy (MRS) spectra from hMT+/early visual cortex (EVC) (primarily in V1) regions and relationships between block design task (BDT) and Glu concentrations in hMT+/EVC (primarily in V1) regions.
(a) Individual participant fitted Glu MRS spectra from the hMT+ (top, n = 31) and EVC (primarily in V1) (bottom, n = 28) voxels from baseline measurement. The colors of the Glu spectra represent the individual differences of BDT. The color bar represents the scores of BDT. (b) There is no significant relationship between BDT and Glu concentrations in hMT+ region. (c) There is also no significant correlation between BDT and Glu concentrations in EVC (primarily in V1) region. Glu concentration (Conc.) is absolute, with units of mmol per kg wet weight (Materials and methods).
Figure 3—figure supplement 3
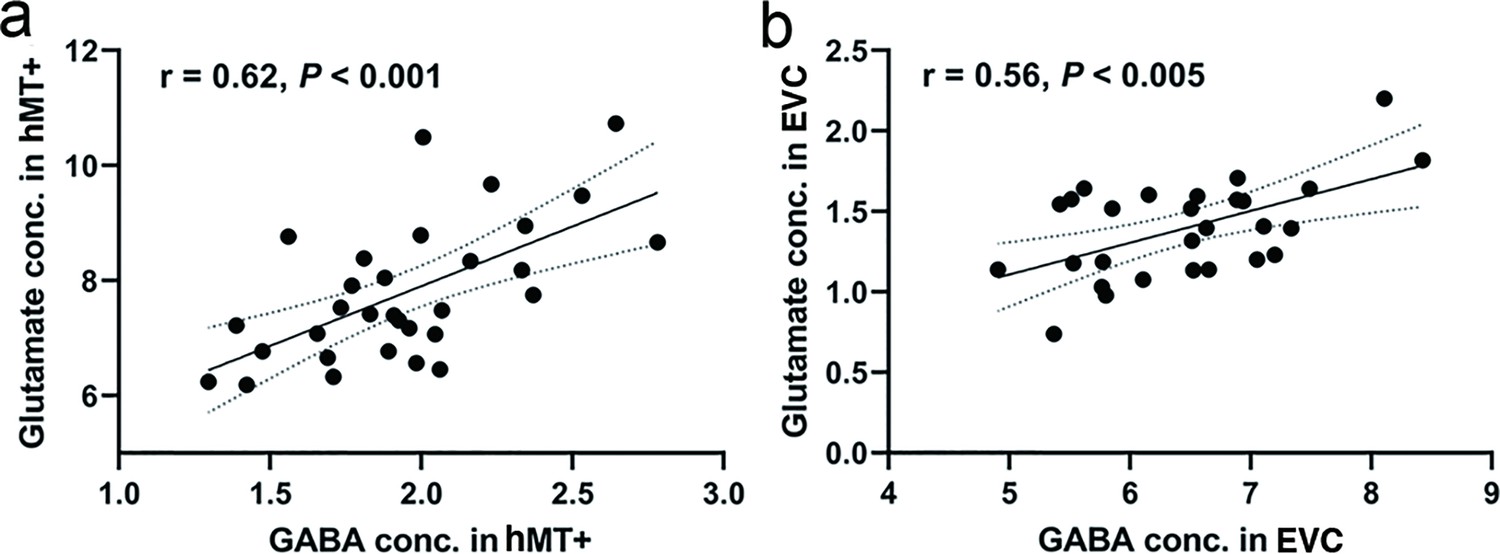
Correlations between GABA and Glu concentrations in hMT+ and early visual cortex (EVC) (primarily in V1) regions.
(a) There is significant correlation between GABA and Glu concentrations in hMT+ region. (b) The levels of GABA also significantly correlate with Glu in EVC (primarily in V1) region. GABA and Glu concentrations (Conc.) are absolute, with units of mmol per kg wet weight (Materials and methods).
Figure 3—figure supplement 4
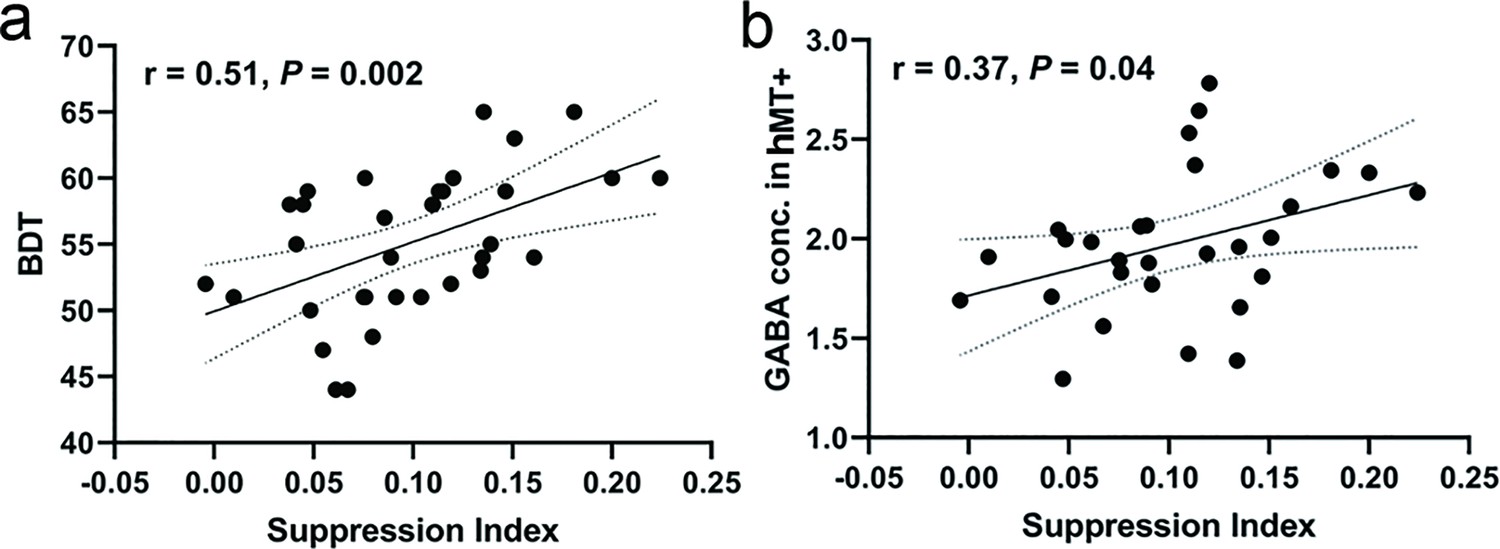
Two linear correlations show without outlines results.
(a) Significant positive correlation between suppression index and block design test (BDT) scores (took out two outlines). (b) Suppression index also significantly correlates with GABA concentration in hMT+ region (without two outliers, having the similar result shown in Figure 3d).
Figure 4 with 2 supplements
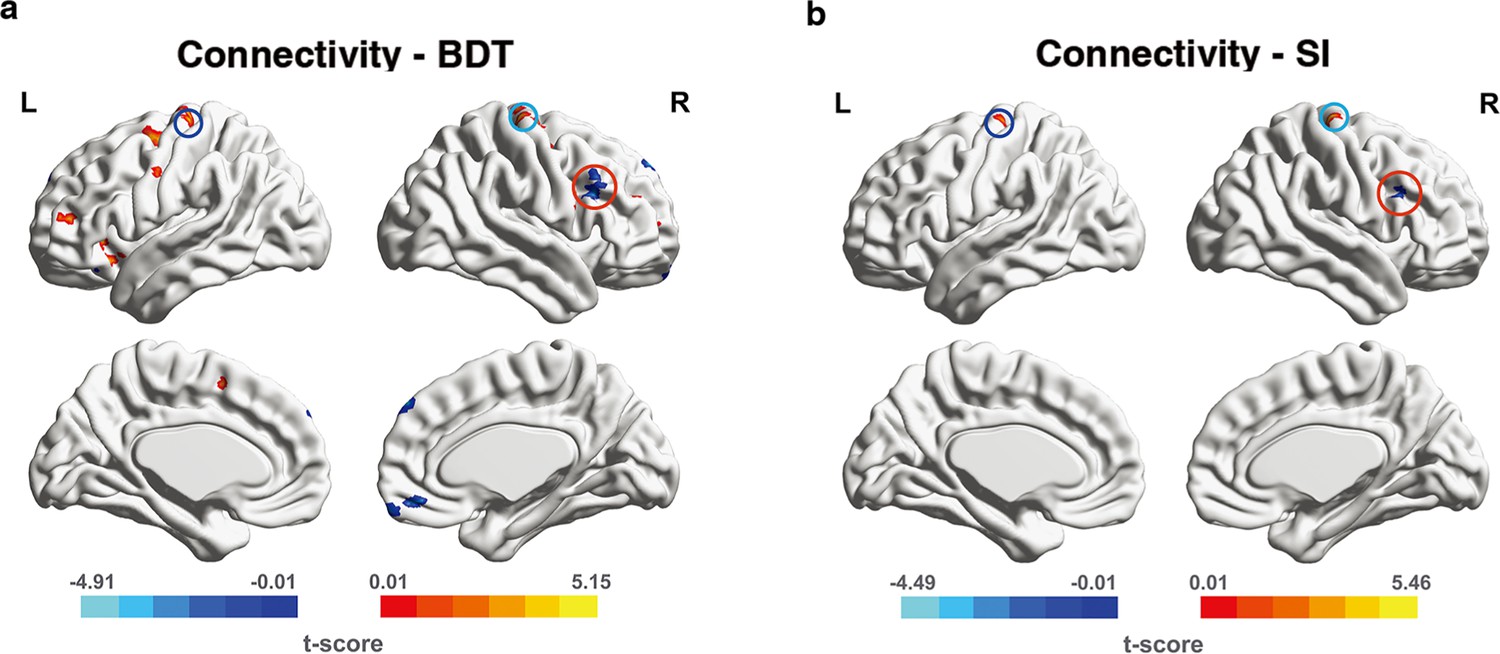
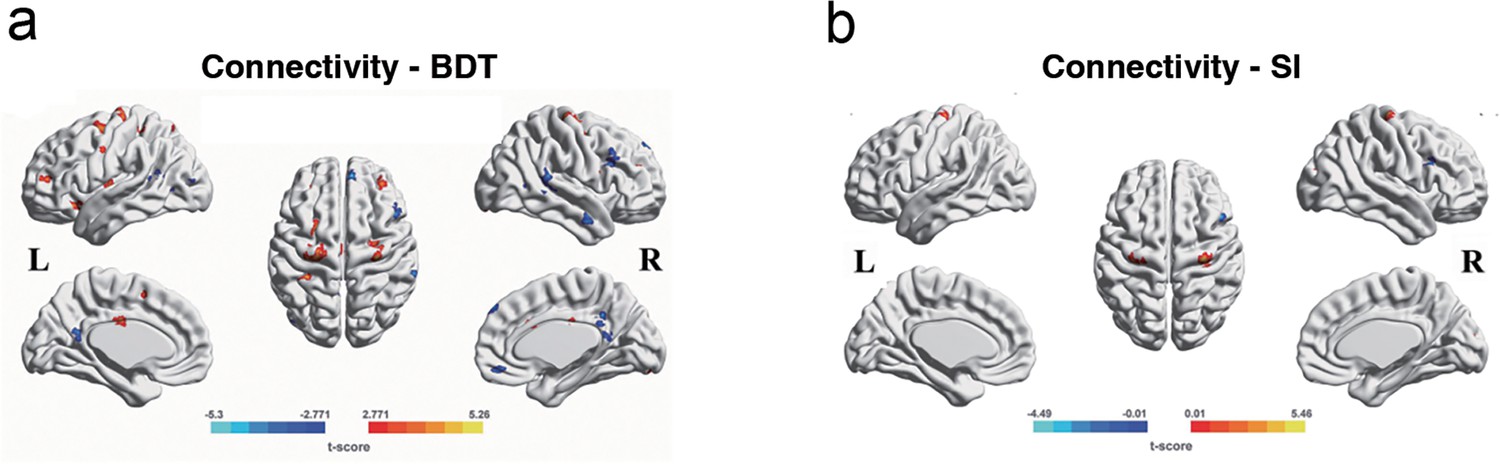
Significant functional connectivities (FCs) from connectivity-behavior analyses in a priori search space.
The seed region is the left hMT+. The significant FCs are obtained from a priori space (frontal cortex). (a) The significant FCs obtained from connectivity-BDT analysis. Single voxel threshold p<0.005, adjacent size ≥ 23 (AlphaSim correcting, Materials and methods). (b) The significant FCs obtained from connectivity-SI analysis. Single voxel threshold p<0.005, adjacent size ≥ 22 (AlphaSim correcting, Materials and methods). Positive correlations are shown in warm colors, while negative correlations are shown in cold colors. The paired deep blue, light blue, red circles on (a) and (b) indicate the overlap regions in left BA6, right BA6, right BA46(DLPFC) between connectivity-BDT analysis and connectivity-SI analysis, respectively.
Figure 4—figure supplement 1
Significant functional connectivities (FCs) searched from connectivity-behavior (block design test [BDT]/surround suppression [SI]) analyses in the whole brain.
The seed region is the left hMT+. The significant FCs are obtained from the entire brain search, single voxel threshold p<0.01, adjacent size ≥37 voxels (AlphaSim correcting, Materials and methods). Positive correlations are shown in warm colors, while negative correlations are shown in cold colors. (a) The significant FCs obtained from connectivity-BDT analysis. (b) The significant FCs obtained from connectivity-SI analysis.
Figure 4—figure supplement 2
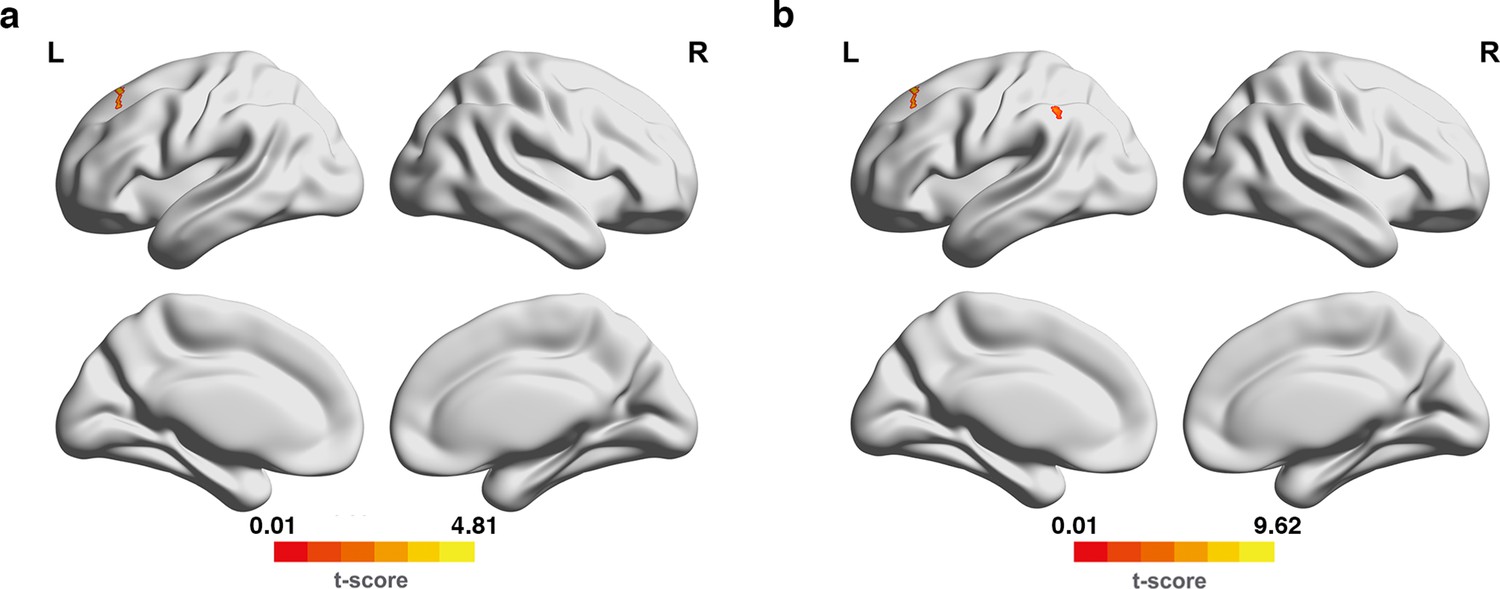
Significant functional connectivities (FCs) searched from connectivity-behavior (block design test [BDT]) analyses in the frontal and whole brain.
The seed region is the left V1. (a) The significant FCs are obtained from the frontal search, single voxel threshold p<0.005, adjacent size ≥23 (AlphaSim correcting, same methods for hMT+). (b) The significant FCs are obtained from the 306 entire brain search, single voxel threshold p<0.01, adjacent size ≥37 voxels (AlphaSim correcting, same methods for hMT+). Only positive correlations were detected, shown in warm colors.
Figure 5 with 1 supplement
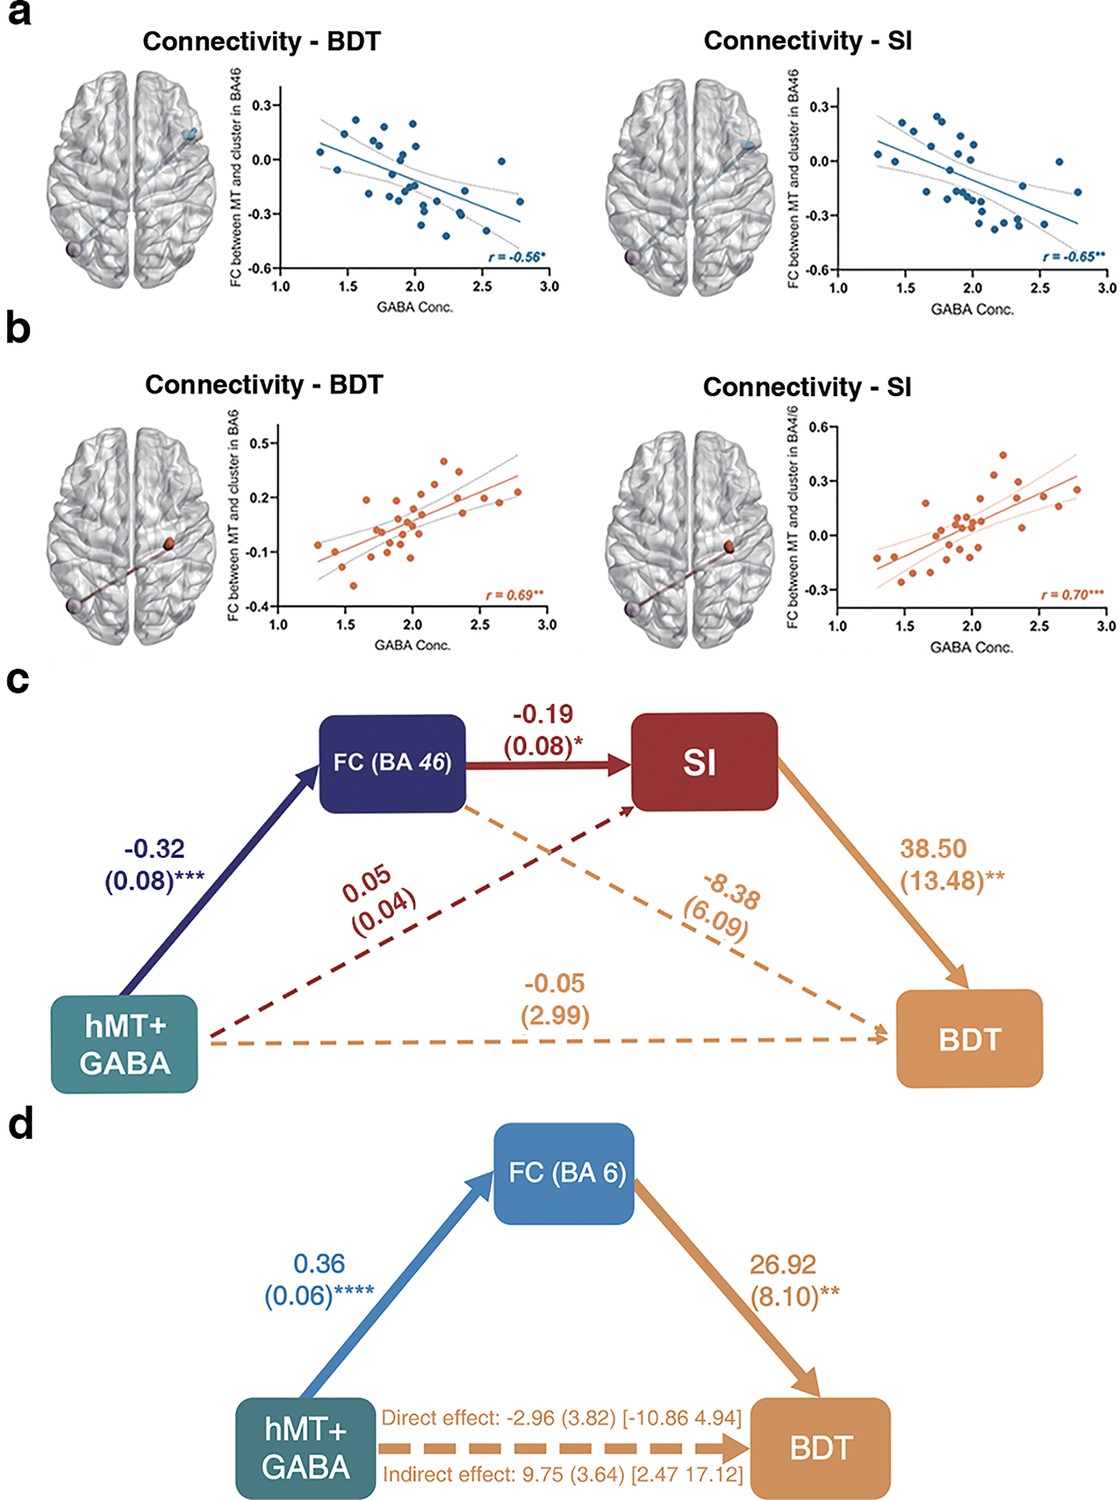
Local hMT+ GABA acts on suppression index (SI) and block design test (BDT) via global hMT-frontal connectivity.
(a) Significant negative correlation between the functional connectivity (FC) of left hMT+-right DLPFC (BA46) and hMT+ GABA (false discovery rate [FDR] correction). (b) Significant positive correlation between the FC of left hMT+-right (pre) motor cortex (BA4/6) and hMT+ GABA (FDR correction). In (a) and (b), left: the significant FCs obtained from connectivity-BDT analysis; right: the significant FCs obtained from connectivity-SI analysis. (c) Significant pathways: hMT+ GABA→ FC (left hMT+-right BA46, negative correlation) → SI (negative correlation) → BDT (positive correlation). This pathway can explain 34% of the variance in BDT. (d) Significant pathways: hMT+ GABA → FC (left hMT+-right BA6, positive correlation) → BDT (positive correlation). The bolded lines represent the hypothesized mediation effect. The dotted lines represent alternative pathways. *: p<0.05; **: p<0.01; ***: p<0.001.
Figure 5—figure supplement 1
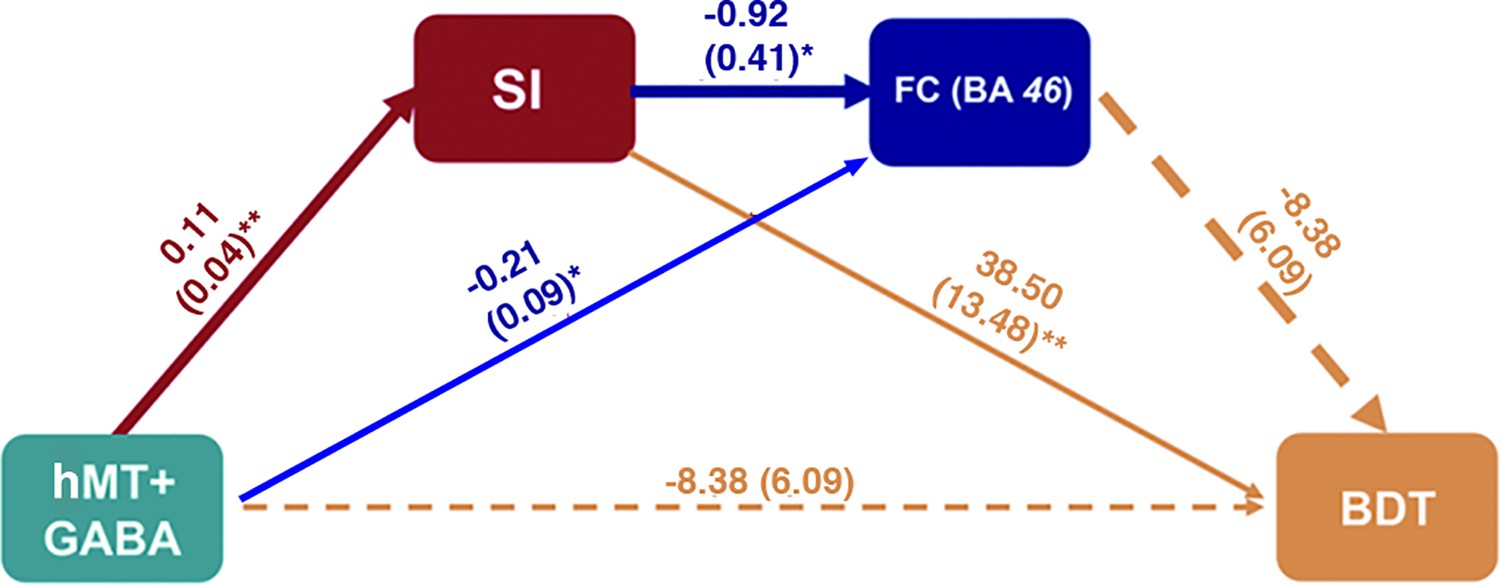
The alternative serial mediation models from local hMT+ GABA to global performance of block design test (BDT).
The pathway that hMT+ GABA was predicted to be associated with suppression index (SI), followed by the functional connectivity (FC) of hMT+-BA46, and then BDT, did not yield the chained mediation effects on BDT. *: p<0.05; **: p<0.01; ***: p<0.001.
Figure 6 with 1 supplement
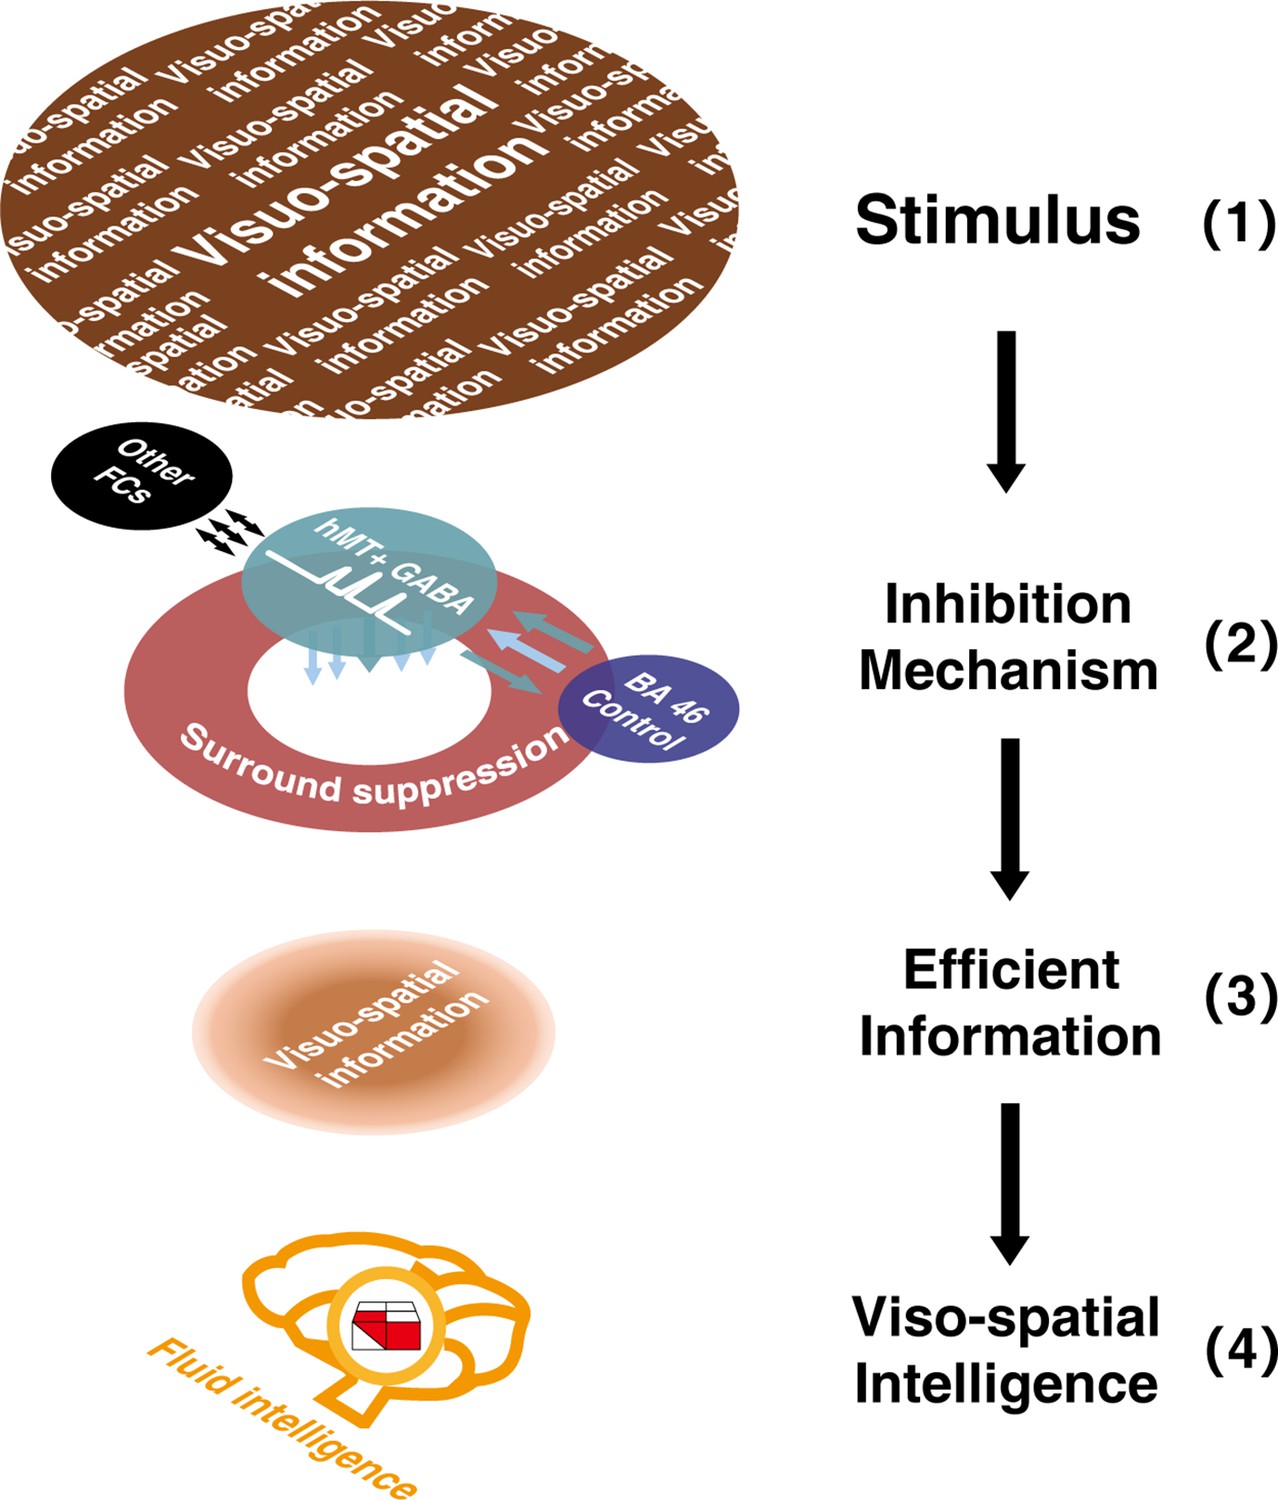
Sketch depicting the multi-level inhibitory mechanisms centered on hMT+ GABA contributing to visuo-spatial intelligence.
Inhibitory GABA in hMT+ (a sensory cortex, shown in green circle), coupling with the functional connectivity between hMT+ and BA46 (cognitive control core, shown in purple circle), and mediated by motion surround suppression (shown in red circle), contributes to visuo-spatial intelligence (block design test [BDT], 3D domain, shown in red and white building blocks). In this sketch, the two-colored parallel arrows show the negative FC between hMT+ and BA46, the colored arrows below the green circle display the inhibition mechanisms centered on hMT+ GABA (2), filtered the irrelevant information in (1) and focused on the efficient visuo-spatial information (3). Black long arrows display the direction of information flow: from input information (1) to visuo-spatial intelligence (4).
Figure 6—figure supplement 1
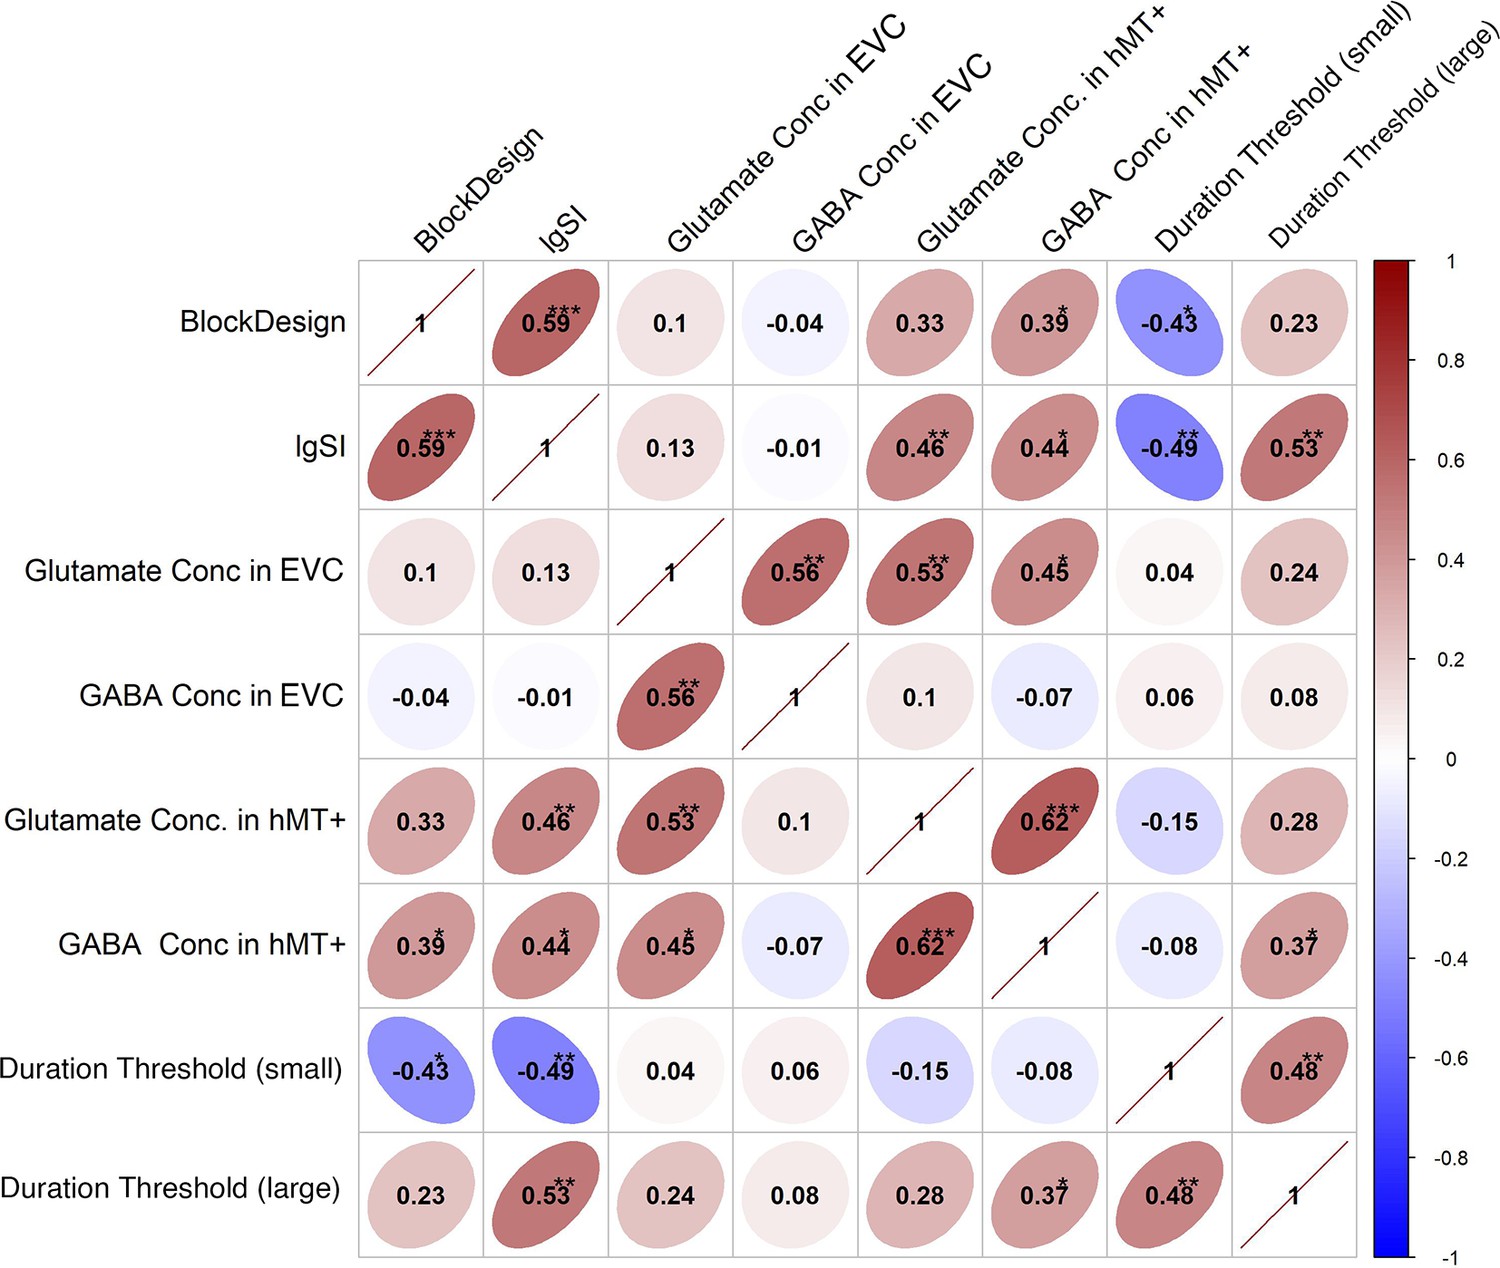
Correlation matrix shows correlations between all measured in our biochemistry and behavior level.
*: p<0.05, **: p<0.01, ***: p<0.001.
Tables
Table 1
Functional connectivity (FC) of voxels showing significant correlation with block design test (BDT) scores across subjects in frontal cortex.
| FC number | Connected regions | BA | Size | Peak coordinate | r | p |
|---|---|---|---|---|---|---|
| MNI (x, y, z) | ||||||
| 1 | Frontal_Sup_Orb_R | 11 | 33 | (12,63,–19.5) | –0.57 | 0.0011 |
| 2 | Frontal_Inf_Orb_L | 47 | 24 | (−34.5,28.5,–13.5) | –0.63 | 0.0003 |
| 3 | Frontal_Med_Orb_R | 11 | 41 | (3,43.5,–12) | –0.58 | 0.0009 |
| 4 | Frontal_Inf_Orb_R | 47 | 48 | (−31.5,24,–12) | 0.59 | 0.0008 |
| 5 | Frontal_Inf_Orb_R | 47 | 29 | (25.5,30,–13.5) | 0.67 | 0.0001 |
| 6 | Insula_L | \ | 26 | (–28.5,27,0) | 0.67 | 0.0001 |
| 7 | Frontal_Inf_Oper_R | 45 | 41 | (43.5,16.5,6) | 0.64 | 0.0002 |
| 8 | Frontal_Sup_R | 10 | 25 | (31.5,57,9) | 0.59 | 0.0008 |
| 9 | Frontal_Mid_L | 10 | 82 | (–33,48,12) | 0.62 | 0.0003 |
| 10 | Frontal_Inf_Oper_R | 44 | 49 | (51,7.5,21) | 0.59 | 0.0007 |
| 11 | Frontal_Inf_Oper_R | 46 | 96 | (49.5,16.5,28.5) | –0.62 | 0.0003 |
| 12 | Frontal_Mid_L | 10 | 32 | (–31.5,49.5,24) | 0.57 | 0.0012 |
| 13 | Frontal_Mid_R | 10 | 102 | (31.5,36,30) | 0.59 | 0.0009 |
| 14 | Precentral_L | 6 | 46 | (−49.5,–1.5,34.5) | 0.59 | 0.0007 |
| 15 | Frontal_Mid_R | 9 | 107 | (51,19.5,40.5) | –0.67 | 0.0001 |
| 16 | Frontal_Sup_L | 9 | 35 | (–9,60,37.5) | –0.69 | 0.0001 |
| 17 | Frontal_Sup_Medial_R | 9 | 74 | (4.5,52.5,43.5) | –0.57 | 0.0011 |
| 18 | Frontal_Sup_R | 6 | 136 | (28.5,–7.5,63) | –0.64 | 0.0002 |
| 19 | Supp_Motor_Area_L | 6 | 48 | (–10.5,6,54) | 0.63 | 0.0003 |
| 20 | Frontal_Mid_L | 6 | 119 | (–24,4.5,55.5) | 0.63 | 0.0003 |
| 21 | Precentral_L | 6 | 229 | (−24,–18,66) | 0.60 | 0.0005 |
| 22 | Frontal_Sup_R | 6 | 32 | (16.5,–18,67.5) | 0.68 | 0.0001 |
| 23 | Precentral_R | 6 | 80 | (30,–24,70.5) | 0.70 | 0.0001 |
| 24 | Precentral_R | 6 | 23 | (16.5,–25.5,76.5) | 0.70 | 0.0001 |
-
Single voxel threshold p<0.005 (t>3.057 or t<–3.057), adjacent size ≥23 voxels (AlphaSim corrected).
Table 2
Correlations between functional connectivity (FC) in Table 1 and GABA/Glu concentrations in hMT+.
| FC number | hMT+ GABA concentrations | hMT+ Glu concentrations | ||||
|---|---|---|---|---|---|---|
| r | p | FDR | r | p | FDR | |
| 1 | –0.07 | 0.72 | 0.75 | –0.11 | 0.58 | 0.85 |
| 2 | –0.28 | 0.14 | 0.36 | –0.27 | 0.15 | 0.81 |
| 3 | –0.13 | 0.52 | 0.59 | –0.07 | 0.71 | 0.85 |
| 4 | 0.10 | 0.59 | 0.64 | 0.12 | 0.54 | 0.85 |
| 5 | 0.14 | 0.48 | 0.58 | 0.24 | 0.21 | 0.81 |
| 6 | 0.31 | 0.11 | 0.33 | 0.15 | 0.43 | 0.85 |
| 7 | 0.20 | 0.30 | 0.48 | 0.07 | 0.74 | 0.85 |
| 8 | 0.14 | 0.45 | 0.58 | 0.05 | 0.79 | 0.85 |
| 9 | 0.20 | 0.30 | 0.48 | 0.10 | 0.60 | 0.85 |
| 10 | –0.13 | 0.49 | 0.58 | –0.16 | 0.41 | 0.85 |
| 11 | –0.56 | 0.0018 | 0.02* | –0.22 | 0.25 | 0.81 |
| 12 | 0.18 | 0.34 | 0.51 | 0.15 | 0.43 | 0.85 |
| 13 | 0.20 | 0.30 | 0.48 | 0.05 | 0.81 | 0.85 |
| 14 | 0.39 | 0.04 | 0.14 | 0.22 | 0.24 | 0.81 |
| 15 | –0.40 | 0.03 | 0.12 | –0.21 | 0.27 | 0.81 |
| 16 | –0.27 | 0.15 | 0.36 | –0.12 | 0.53 | 0.85 |
| 17 | 0.17 | 0.37 | 0.52 | 0.06 | 0.74 | 0.85 |
| 18 | 0.26 | 0.18 | 0.39 | 0.16 | 0.40 | 0.85 |
| 19 | 0.39 | 0.03 | 0.12 | 0.31 | 0.10 | 0.81 |
| 20 | 0.01 | 0.98 | 0.98 | 0.14 | 0.46 | 0.85 |
| 21 | 0.40 | 0.03 | 0.12 | 0.24 | 0.21 | 0.81 |
| 22 | 0.22 | 0.25 | 0.48 | 0.06 | 0.76 | 0.85 |
| 23 | 0.69 | 0.0001 | 0.002** | 0.47 | 0.01 | 0.24 |
| 24 | 0.41 | 0.03 | 0.12 | 0.001 | 0.97 | 0.97 |
-
*: pFDR < 0.05; **: pFDR < 0.01; ***: pFDR < 0.001; Bold font indicates the significant correlations survived from multi-correlation correction.
Additional files
-
Supplementary file 1
Functional connectivity (FC) of voxels showing significant correlation with block design test (BDT) scores across subjects in whole brain.
- https://cdn.elifesciences.org/articles/97545/elife-97545-supp1-v1.docx
-
Supplementary file 2
Functional connectivities (FCs) of voxels showing significant correlation with suppression index (SI) across subjects in frontal cortex.
- https://cdn.elifesciences.org/articles/97545/elife-97545-supp2-v1.docx
-
Supplementary file 3
Functional connectivities (FCs) of voxels showing significant correlation with suppression index (SI) across subjects in whole brain.
- https://cdn.elifesciences.org/articles/97545/elife-97545-supp3-v1.docx
-
Supplementary file 4
Correlations between functional connectivity (FC) in Supplementary file 1 and GABA/Glu concentrations in hMT+.
- https://cdn.elifesciences.org/articles/97545/elife-97545-supp4-v1.docx
-
Supplementary file 5
Correlations between functional connectivities (FCs) in Supplementary file 2 and GABA/Glu concentrations in hMT+.
- https://cdn.elifesciences.org/articles/97545/elife-97545-supp5-v1.docx
-
Supplementary file 6
Correlations between functional connectivities (FCs) in Supplementary file 3 and GABA/Glu concentrations in hMT+.
- https://cdn.elifesciences.org/articles/97545/elife-97545-supp6-v1.docx
-
MDAR checklist
- https://cdn.elifesciences.org/articles/97545/elife-97545-mdarchecklist1-v1.docx
Download links
A two-part list of links to download the article, or parts of the article, in various formats.
Downloads (link to download the article as PDF)
Open citations (links to open the citations from this article in various online reference manager services)
Cite this article (links to download the citations from this article in formats compatible with various reference manager tools)
GABAergic inhibition in human hMT+ predicts visuo-spatial intelligence mediated through the frontal cortex
eLife 13:RP97545.
https://doi.org/10.7554/eLife.97545.4


