The evolutionary history of the ancient weevil family Belidae (Coleoptera: Curculionoidea) reveals the marks of Gondwana breakup and major floristic turnovers, including the rise of angiosperms
- Department of Entomology, College of Plant Protection, China Agricultural University, China
- Department of Biological Sciences, University of Memphis, United States
- Center for Biodiversity Research, University of Memphis, United States
- CONICET, División Entomología, Facultad de Ciencias Naturales y Museo, Universidad Nacional de La Plata, Argentina
- CONICET, Instituto Argentino de Investigaciones de Zonas Áridas, Entomología, Argentina
- CSIRO, Australian National Insect Collection, Canberra, Australian Capital Territory, Australia
- Department of Organismic and Evolutionary Biology, Harvard University, United States
- Department of Biological Sciences, Wellesley College, United States
- West Calle Balaustre, Green Valley, United States
- Department of Entomology, University of Georgia, United States
- School of Biological Sciences, Seoul National University, Republic of Korea
- Florida State Collection of Arthropods, Florida Department of Agriculture – DPI, United States
Figures
Figure 1 with 2 supplements
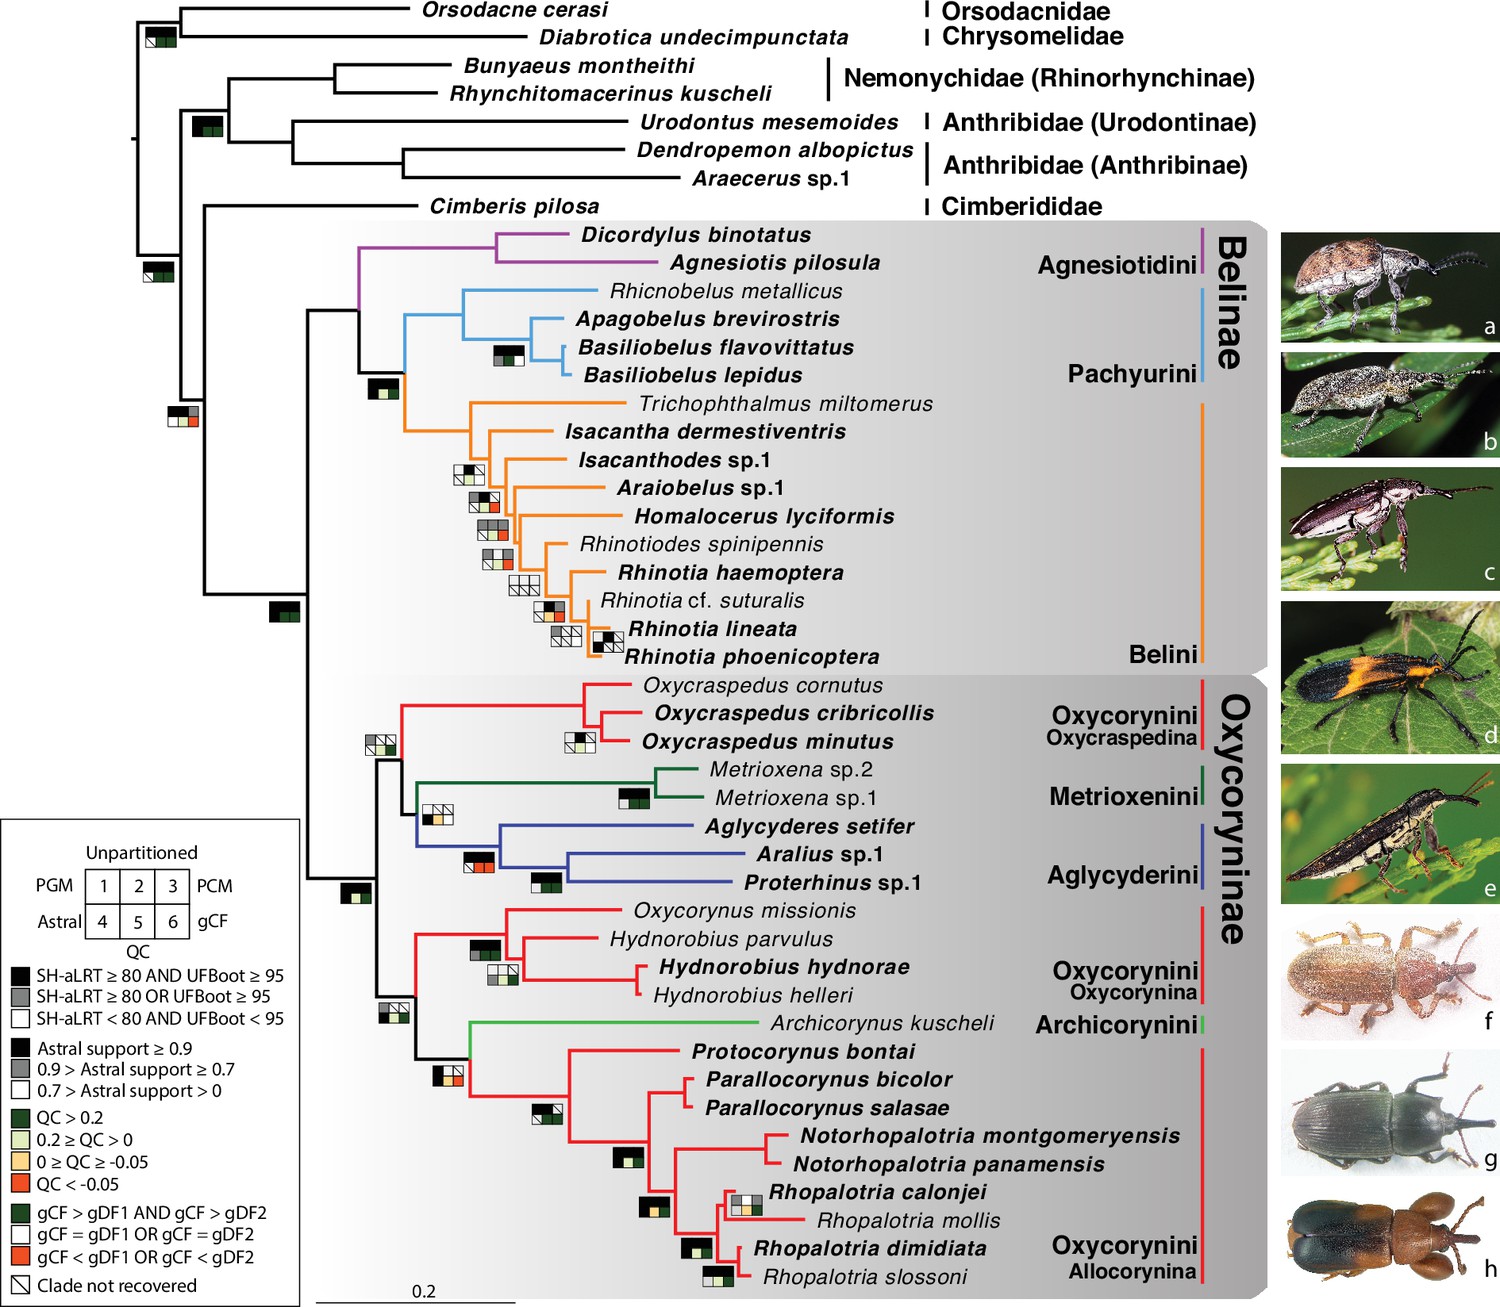
Phylogeny estimate of Belidae.
Topology obtained from analysis of the 46t424g matrix via maximum likelihood (ML), partitioned by gene. Squares along branches are ML SH-aLRT and UFBoot values for 1–3: 1. partition by gene, 2. unpartitioned, and 3. partition by gene and codon positions. Astral support for 4, Quartet Concordance (QC) for 5, and gene concordance factor (gCF) for 6. Branches without squares indicate the highest support in all analyses. Taxa displayed on the right: a. Cyrotyphus vestitus (Agnesiotidini) (photo credit: Rolf Oberprieler), b. Pachyura australis (Pachyurini) (photo credit: Simon Grove), c. Isacanthodes ganglionicus (Belini) (photo credit: Rolf Oberprieler), d. Homalocerus sp. (Belini) (photo credit: Jeff Gruber), e. Rhinotia sp. (Belini) (photo credit: Rolf Oberprieler), f. Oxycraspedus cribricollis (Oxycorynini, Oxycraspedina) (photo credit: Adriana Marvaldi), g. Oxycorynus missionis (Oxycorynini, Oxycorynina) (photo credit: Adriana Marvaldi), h. Rhopalotria slossoni (Oxycorynini, Allocorynina) (photo credit: Shayla Salzman).
Figure 1—figure supplement 1

Phylogeny estimate of Belidae and nodal test excluding Sanger data.
(a) Belidae phylogenetic tree inferred from the 33t424g matrix via maximum likelihood (ML), partitioned by gene and codon position. Squares along branches are ML SH-aLRT and UFBoot values. Supporting values are based on the 33t424g matrix for 1–3 and the 33t423g matrix for 4–6. Partitioned by gene and codon position for 1 and 4, partitioned by gene for 2 and 5, and unpartitioned for 3 and 6. (b) Four-cluster likelihood mapping (FcLM) result based on the 33t424g matrix. (c) FcLM result based on the 33t423g matrix.
Figure 1—figure supplement 2

Topology generated by maximum likelihood (ML) analysis of the 46t424g matrix partitioned by gene, with node numbers.
Figure 2
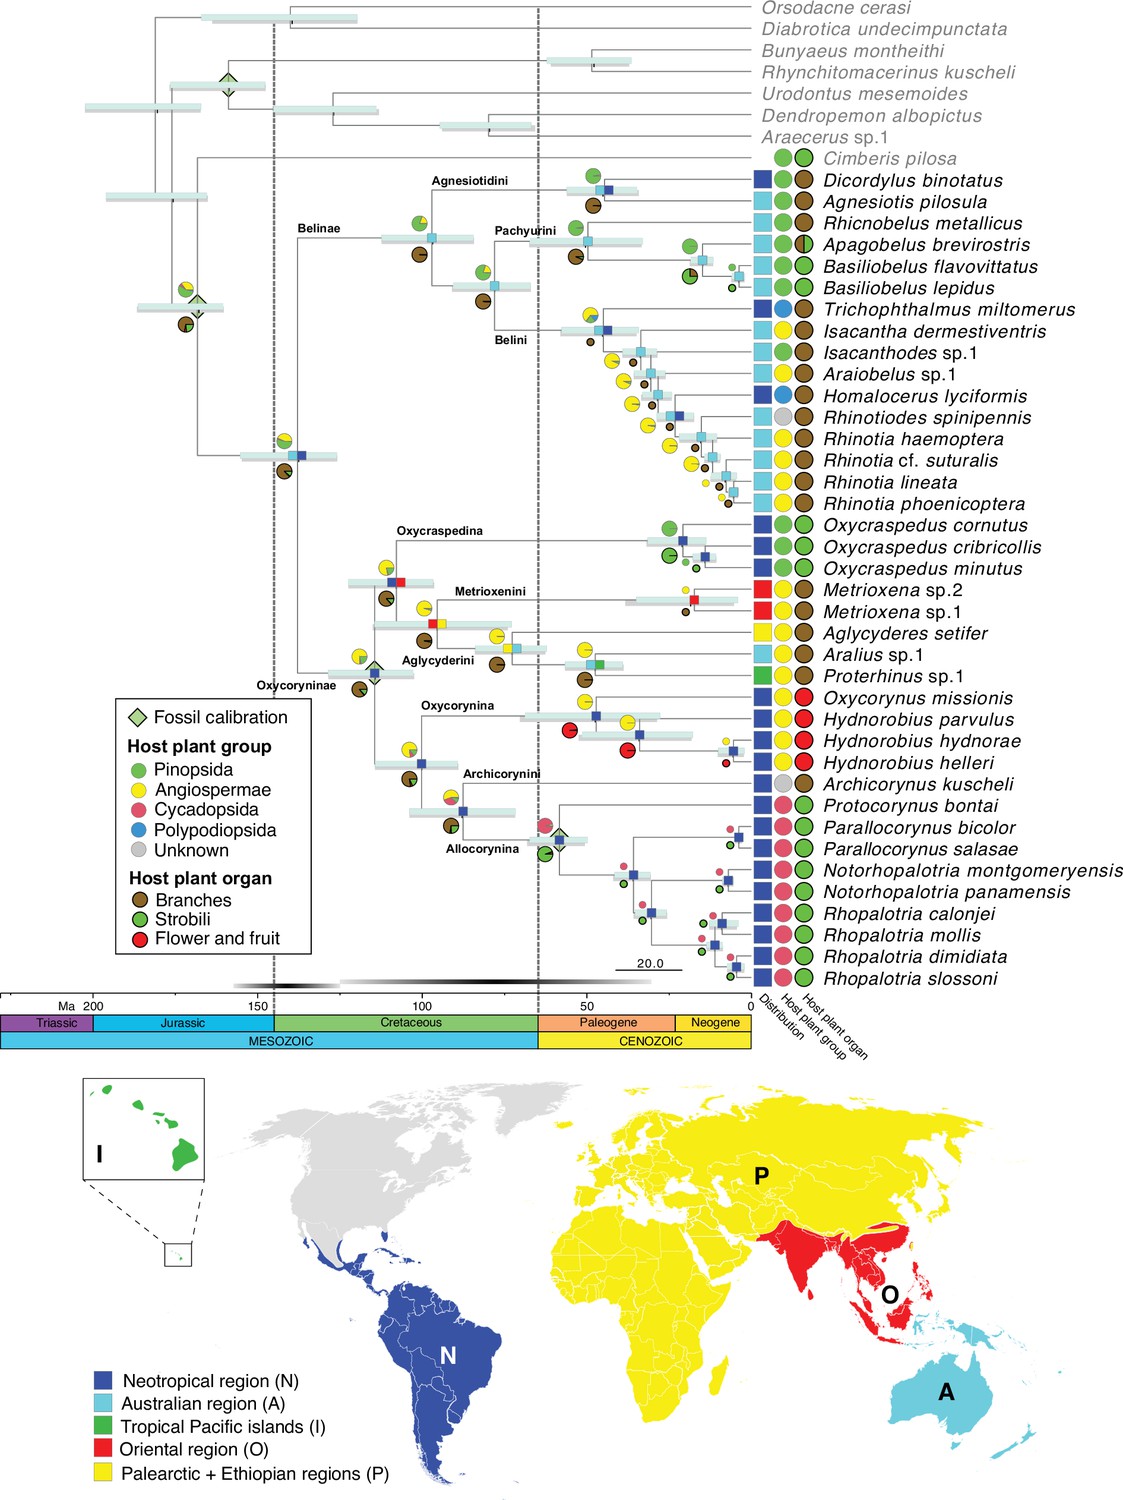
Belid timetree.
Chronogram was generated using BEAST and a birth-death tree prior with 13 unlinked molecular clocks; pale green diamonds on nodes indicate calibration points. Scale is in Ma. Horizontal bars depict the 95% HPD density of each estimate, cyan bars generated by the birth-death tree prior and gray bars generated by the Yule tree prior. Ancestral area estimation under the likelihood-based implementation of dispersal vicariance analysis and unconstrained dispersal rates (DIVALIKE, M0) performed with BioGeoBEARS. The distribution of each species is mapped to the right of the chronogram. A single most probable ancestral area is mapped at each node. Ancestral state reconstruction of belid larval host plant group and host organ usage under the ER model.
Tables
Table 1
Marginal-likelihood estimate (MLE) scores for various BEAST analyses performed for this study, and estimated ages (in Ma) for Belidae crown nodes for each tree prior/clock scheme in BEAST.
Notes: SS, stepping-stone sampling marginal-likelihood estimation; PS, path-sampling marginal-likelihood estimation; median post-burn-in divergence times in millions of years (95% credibility interval).
| Analysis | Tree model | Clock model | MLE SS | MLE PS | Crown Belidae age (Ma) |
|---|---|---|---|---|---|
| A1 | birth-death | 1 ULRC | –142024.6921 | –142025.2950 | 143.8706 [127.5175–159.9967] |
| A2 | Yule | 1 ULRC | –142024.2190 | –142024.9031 | 144.1718 [128.1144–159.9990] |
| A3 | birth-death | 4 ULRC | –135931.3312 | –135932.0701 | 140.7353 [125.4955–157.7755] |
| A4 | Yule | 4 ULRC | –135931.0581 | –135931.8383 | 140.8507 [125.7566–157.9643] |
| A5 | birth-death | 13 ULRC | –134225.1645 | –134225.9867 | 138.4569 [125.5653–154.8667] |
| A6 | Yule | 13 ULRC | –134226.8380 | –134227.8971 | 138.3267 [125.5619–154.5464] |
Additional files
-
Supplementary file 1
Summary of matrices analyzed.
- https://cdn.elifesciences.org/articles/97552/elife-97552-supp1-v1.xlsx
-
Supplementary file 2
Summary of node support generated by concatenated ML analysis, coalescence approach, gene concordance factors (gCF), and Quartet Sampling; the posterior possibility of characters generated by ancestral state reconstructions.
- https://cdn.elifesciences.org/articles/97552/elife-97552-supp2-v1.xlsx
-
Supplementary file 3
Results of the BioGeoBEARS analyses.
- https://cdn.elifesciences.org/articles/97552/elife-97552-supp3-v1.xlsx
-
Supplementary file 4
Taxa sampled in the present study, with the number of loci retained after all cleaning steps, host plant group and organ coding schemes, and distribution coding schemes.
- https://cdn.elifesciences.org/articles/97552/elife-97552-supp4-v1.xlsx
-
MDAR checklist
- https://cdn.elifesciences.org/articles/97552/elife-97552-mdarchecklist1-v1.pdf
Download links
A two-part list of links to download the article, or parts of the article, in various formats.
Downloads (link to download the article as PDF)
Open citations (links to open the citations from this article in various online reference manager services)
Cite this article (links to download the citations from this article in formats compatible with various reference manager tools)
The evolutionary history of the ancient weevil family Belidae (Coleoptera: Curculionoidea) reveals the marks of Gondwana breakup and major floristic turnovers, including the rise of angiosperms
eLife 13:RP97552.
https://doi.org/10.7554/eLife.97552.3


