Local volume concentration, packing domains, and scaling properties of chromatin
- Department of Biomedical Engineering, Northwestern University, United States
- Magnetism and Interface Physics & Computational Polymer Physics, Department of Materials, ETH Zurich, Switzerland
- Department of Gastroenterology and Hepatology, Northwestern Memorial Hospital, United States
- Applied Physics Program, Northwestern University, United States
- Department of Chemistry, Northwestern University, United States
Figures
Figure 1
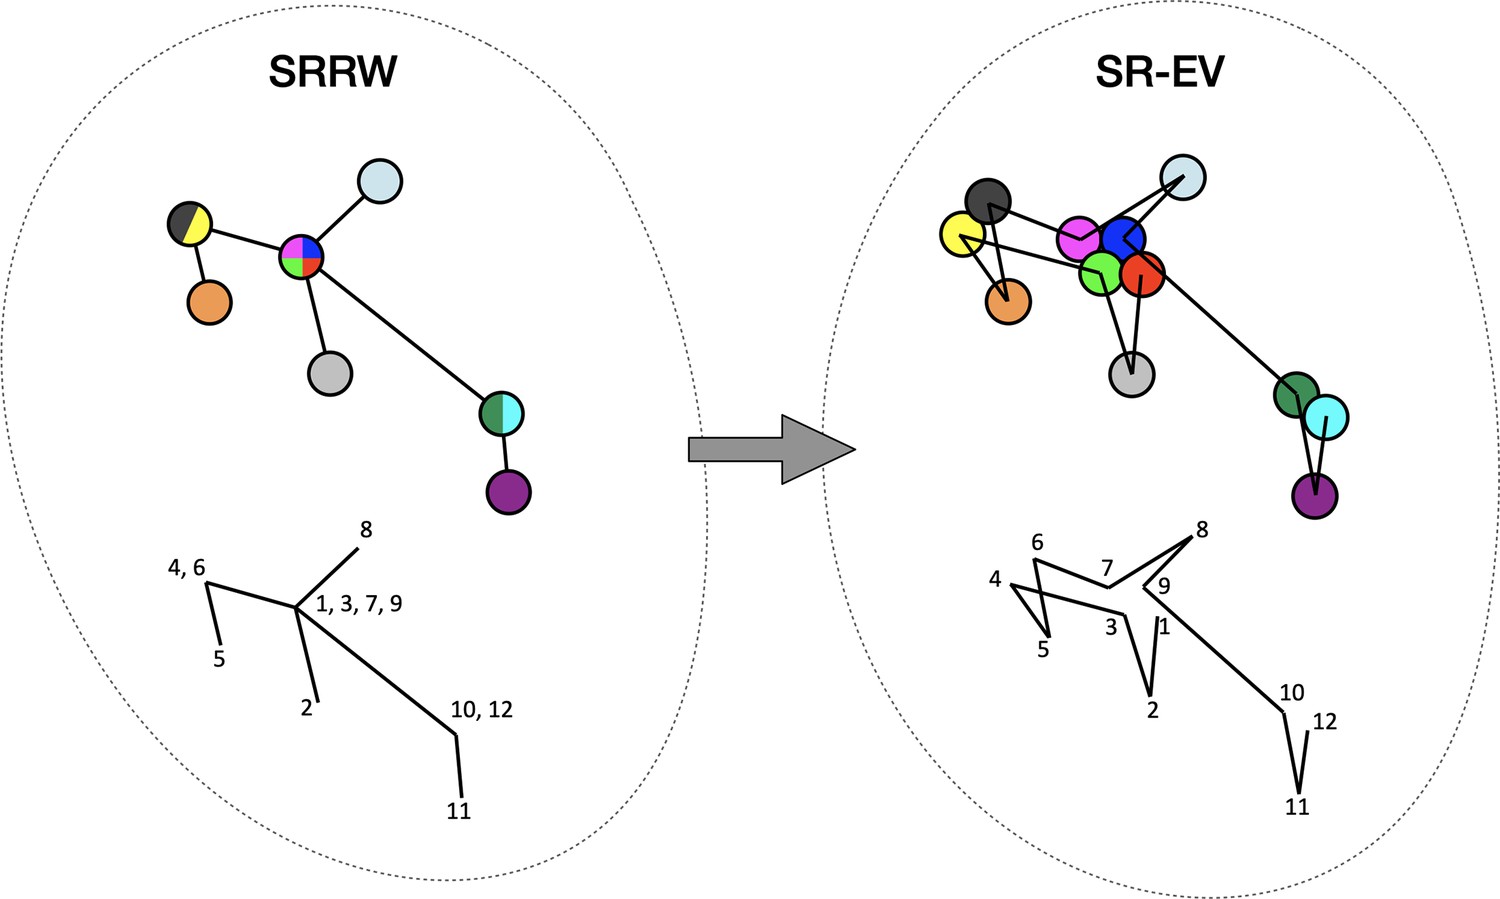
Schematic representation of the conversion process from Self Returning Random Walk (SRRW) to Self Returning Excluded Volume (SR-EV).
The SRRW configurational motif hides the overlap of several beads in a molecule that has the structure of a branching polymer. By the introduction of excluded volume in SR-EV, the overlapping beads separate to form a cluster and a linear molecule.
Figure 2 with 2 supplements
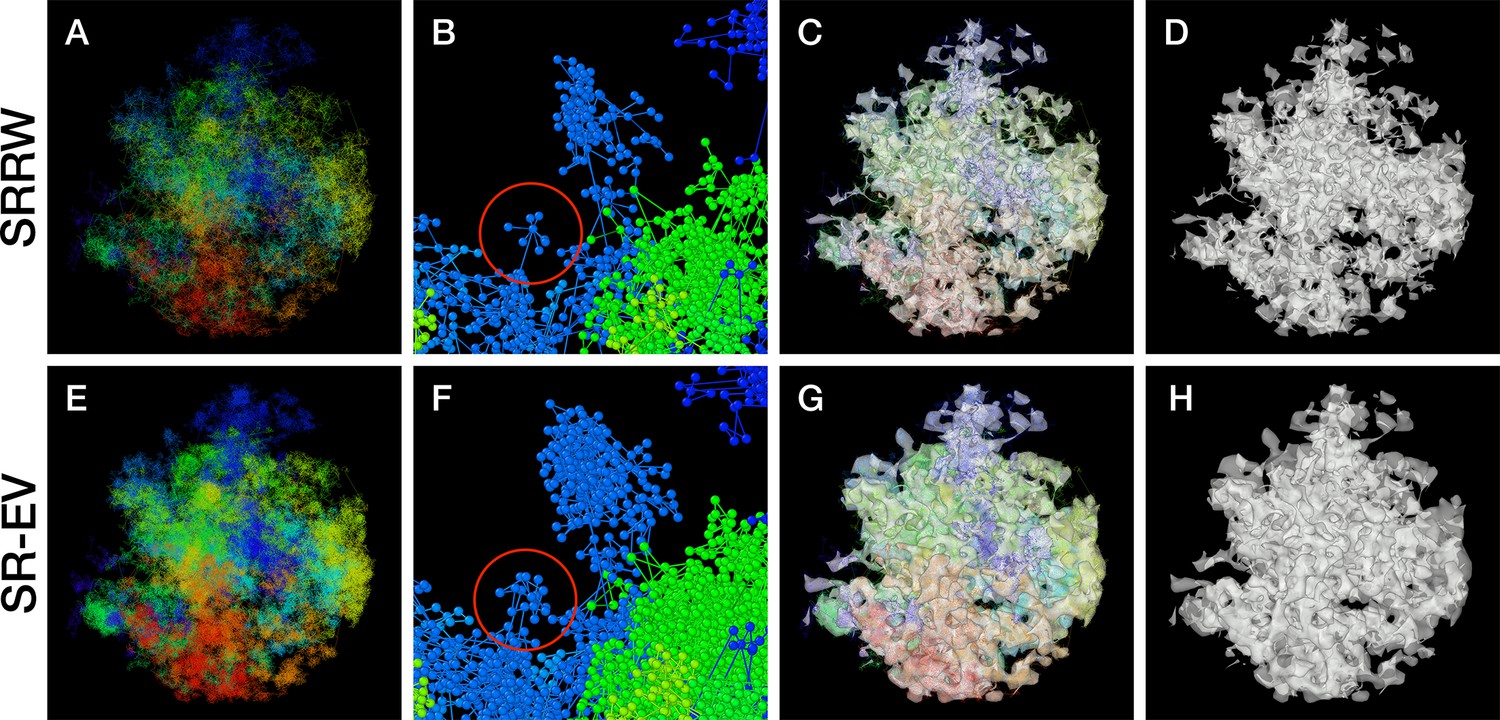
Example Self Returning Random Walk (SRRW) and Self Returning Excluded Volume (SR-EV) configurations.
The top rows are for the SRRW case, and bottom row corresponds to the associated SR-EV configuration. (A) and (E) represent the bonds of the full configurations and show that while SR-EV looks denser than the SRRW case the overall structure is preserved upon removal of the original overlaps. (B) and (F) correspond to the same small portion of the conformation and shows SR-EV having many more beads than SRRW due to the excluded volume between beads. The red circles explicitly highlight a structural motif that in SRRW is a central bead with 7 bonds branching out (a sequence of seven consecutive jump and returns steps) that transform to 15 linearly connecting beads forming a cluster. (C) and (G) display the chromatin conformations wrapped by a tight mesh suggesting the separation between a chromatin-rich and a chromatin-depleted regions, the latter being the space that free crowders could easily occupy. (D) and (H) show the bare interface between the two regions that resembles the interface dividing two bi-continuous phases and also clearly expose the difference between SRRW and SR-EV.
Figure 2—video 1
Self Returning Excluded Volume (SR-EV) configuration represented as beads and sticks, wrapped in a mesh envelope that separates the dense regions from the nearly empty regions of the configuration.
The beads have a diameter to 25% of their actual size to allow for more visibility. This configuration is the same as the one displayed in Figure 2E, G. The configuration rotates about the z-axis to give a good understanding of its corrugated character.
Figure 2—video 2
Representation of the same system of Figure 2—video 1, but in this case it contains only the wrapping mesh that resembles the interface between two disordered bi-continuous phases.
Figure 3
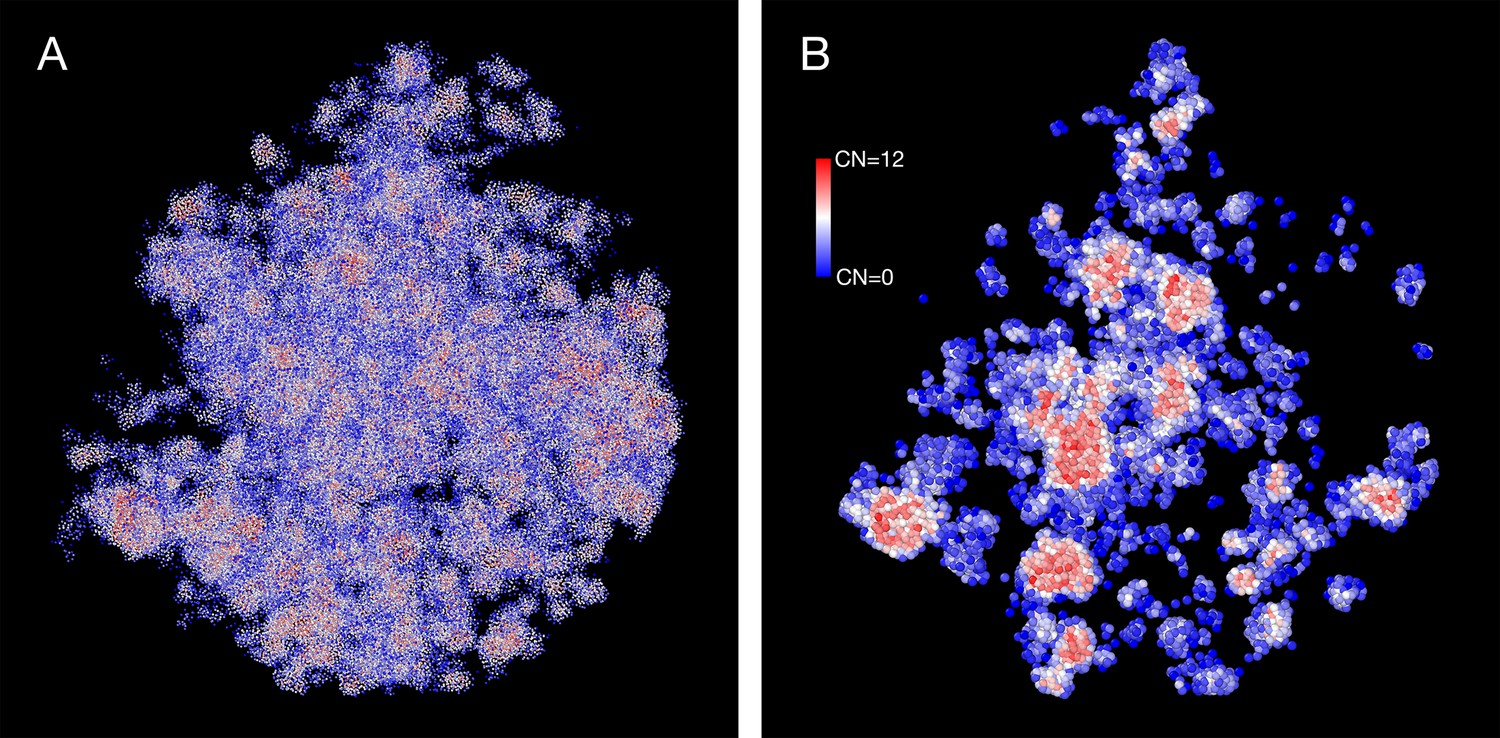
Packing domains and nucleosome accessibility.
Same Self Returning Excluded Volume (SR-EV) configuration displayed in Figure 2, but colored by the coordination number of each nucleosome. (A) Full configuration reveals the spacial dispersity of packing domains in red, consistent with heterochromatic region, intercalated with low coordinated, accesible regions. (B) 50 nm slab cut at the center of the configuration displaying details of the system heterogeneity and transition from packing domains to the intermediate, low coordinated, region. Note the white nucleosomes (coordinations number [CN] ∼ 6) at the periphery of the packing domains.
Figure 4 with 1 supplement
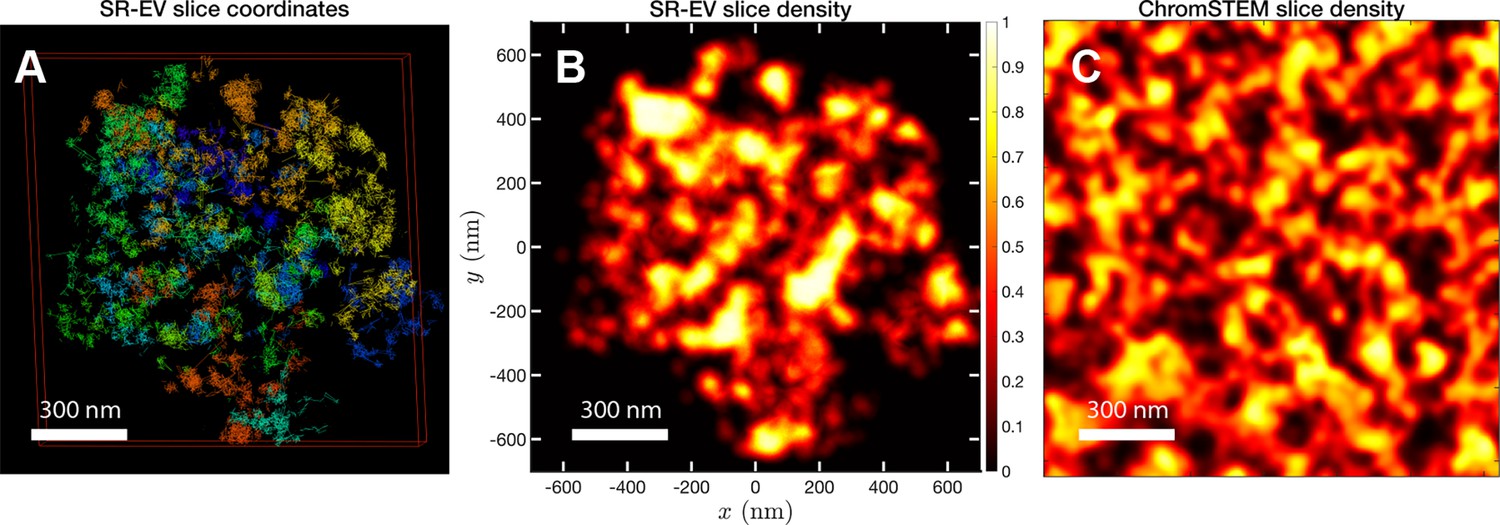
SR-EV and experimental slab images.
(A) representation of a 100-nm slab cut at the center of an SR-VE conformation obtained with and . (B) 2D chromatin density corresponding to coordinates of panel (A). (C) Chromatin scanning transmission electron microscopy (ChromSTEM) 2D chromatin density obtained from a 100-nm slab of a A549 cell. The 2D density color scale is the same for (B, C), and the density is normalized to its highest value in each image.
Figure 4—video 1
Stack of images from a conformation obtained with and .
The planes are separated by 5 nm, and in plane resolution is 2 nm × 2 nm. The image shows the variability of 2D representation in a 100-nm slab.
Figure 5
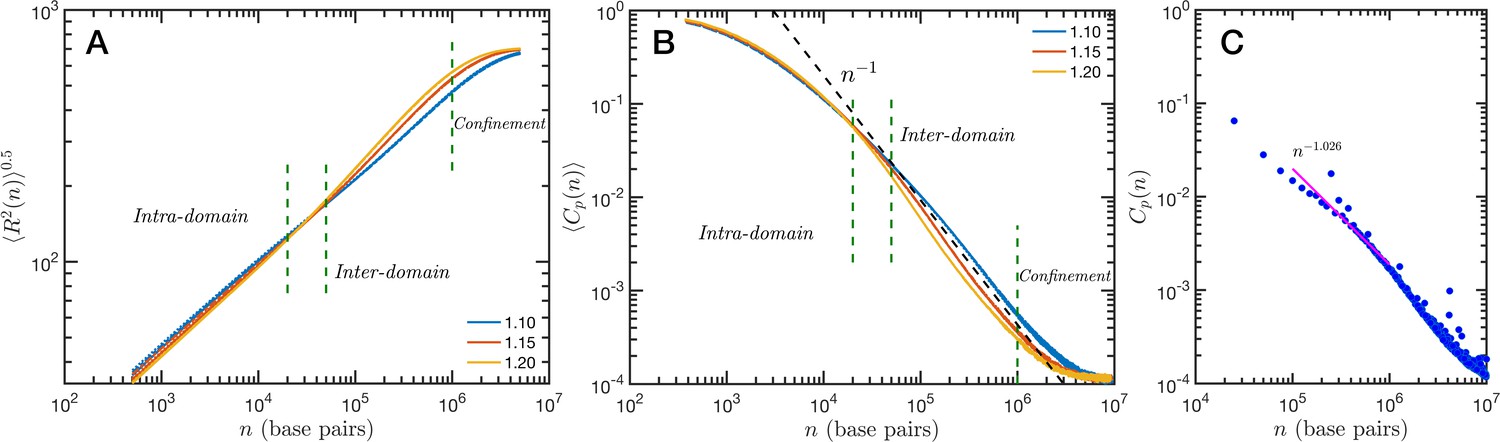
Theoretical and experimental polymeric properties of chromatin.
Self Returning Excluded Volume (SR-EV) ensemble average of (A) end-to-end distance and (B) contact probability a as a function of the genomic distance for all simulated conditions, as described in Table 1. The crossover between short distance intra-domain and long distance inter-domain regimes is explicitly indicated, as well as the confinement effect at longer distances. Notice that on these two panels there are four lines per value, while . (C) Experimental (Hi-C) contact probability for chromosome 1 of HCT-116 cells showing quantitative agreement with the theoretical results.
Figure 6
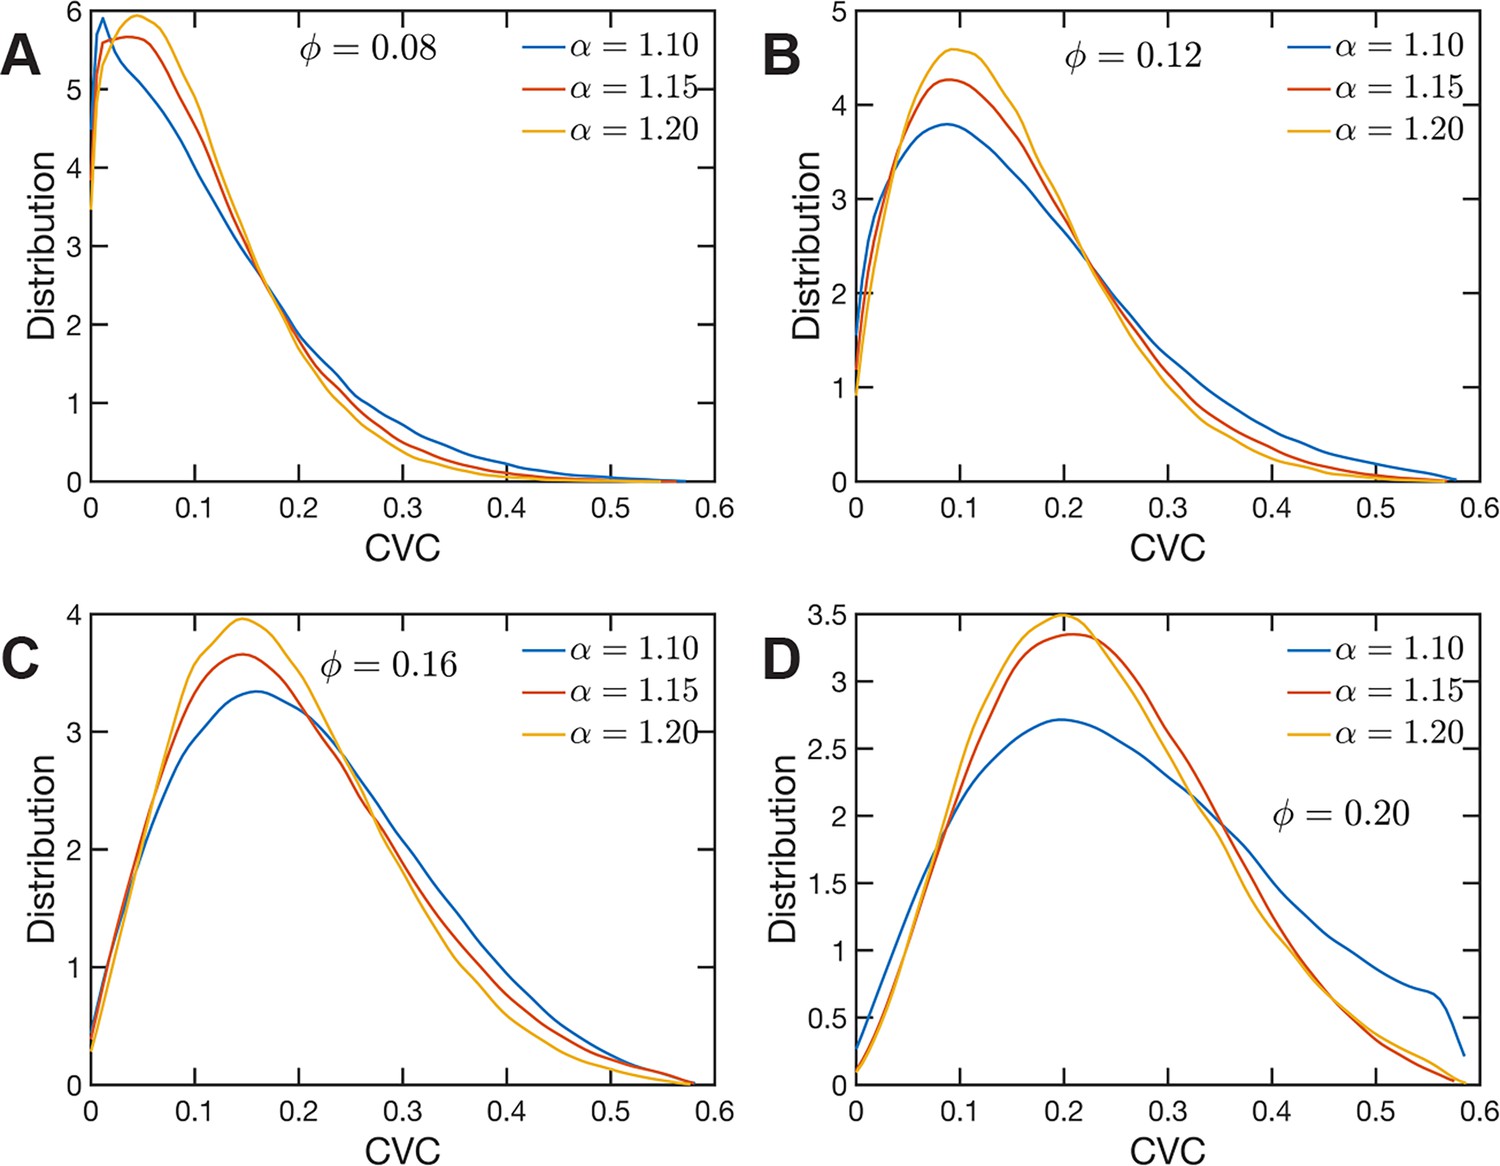
Chromatin volume concentration (CVC) for (A) , (B) , (C) and (D) and .
The results for , are the closest to the experimental findings of Ou et al., 2017. produce CVC distributions with a much larger contribution of low-density regions, and , over enhance the high-density regions.
Figure 7 with 2 supplements
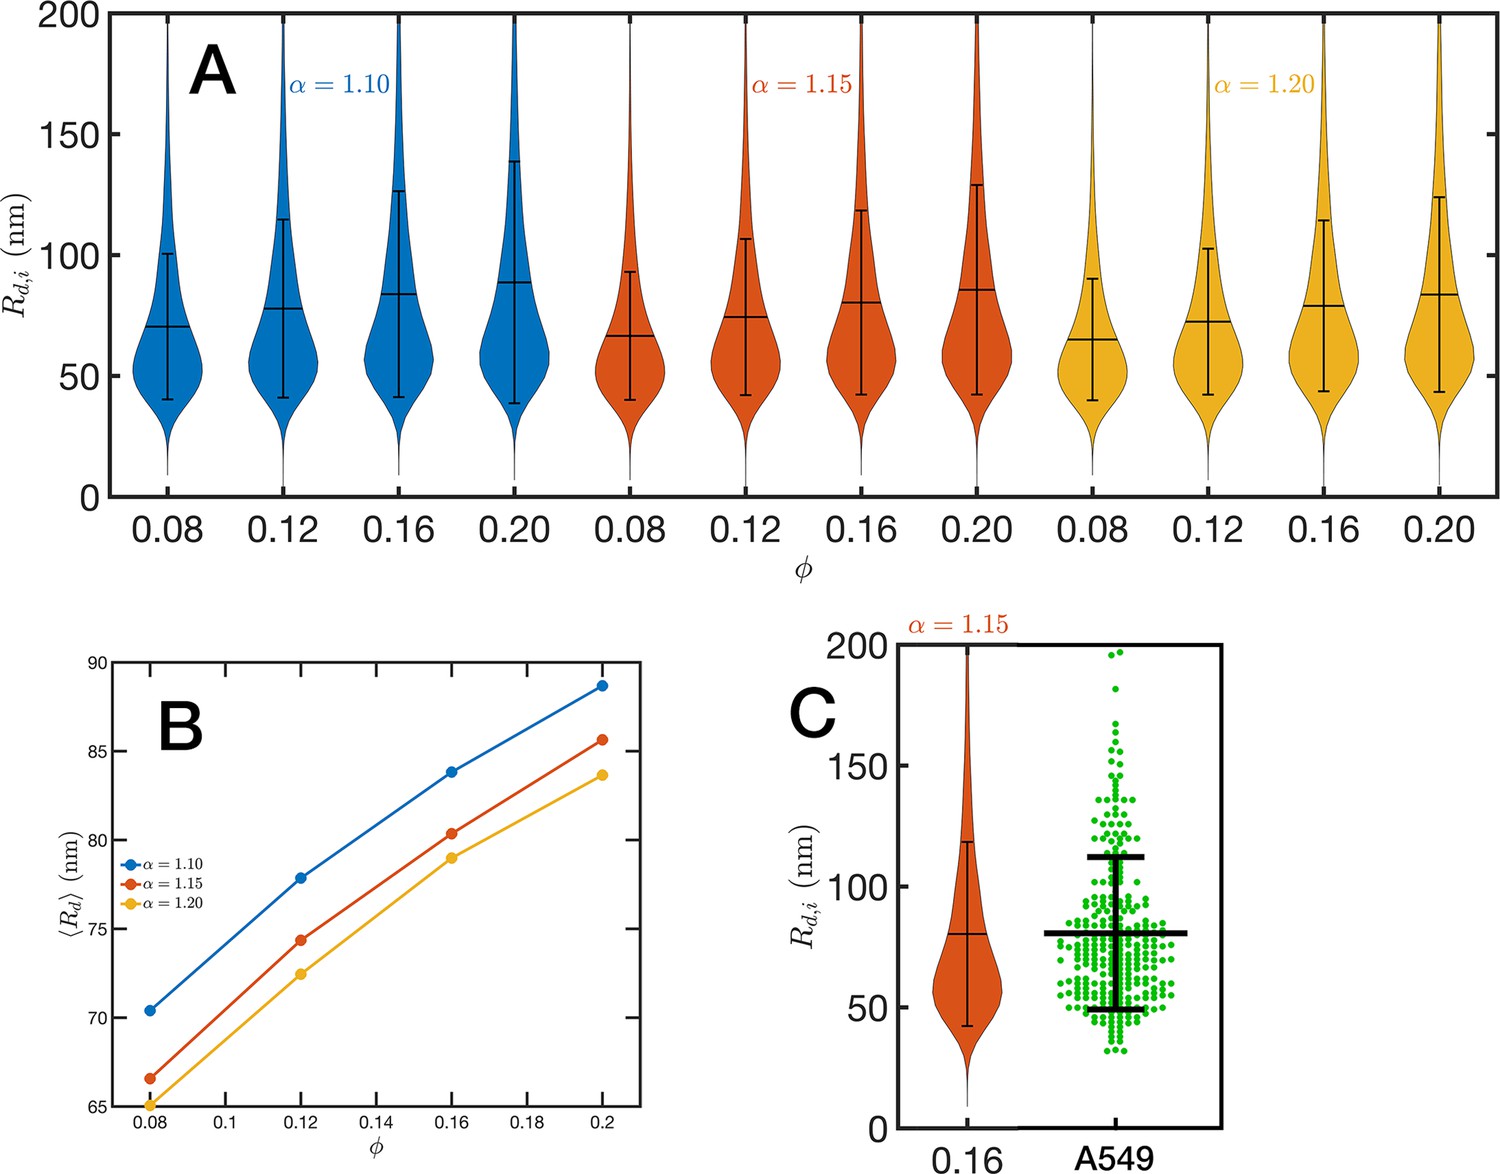
Chromatin packing domains.
(A) Distributions of domain radii for all combinations of Self Returning Excluded Volume (SR-EV) parameters and , as labeled in the figure. (B) Mean value of the domain radii distributions. (C) In green, experimental distribution of domain radii obtained with chromatin scanning transmission electron microscopy (ChromSTEM) on A549 cell line, and the closest approximation from SR-EV that corresponds to and .
Figure 7—figure supplement 1
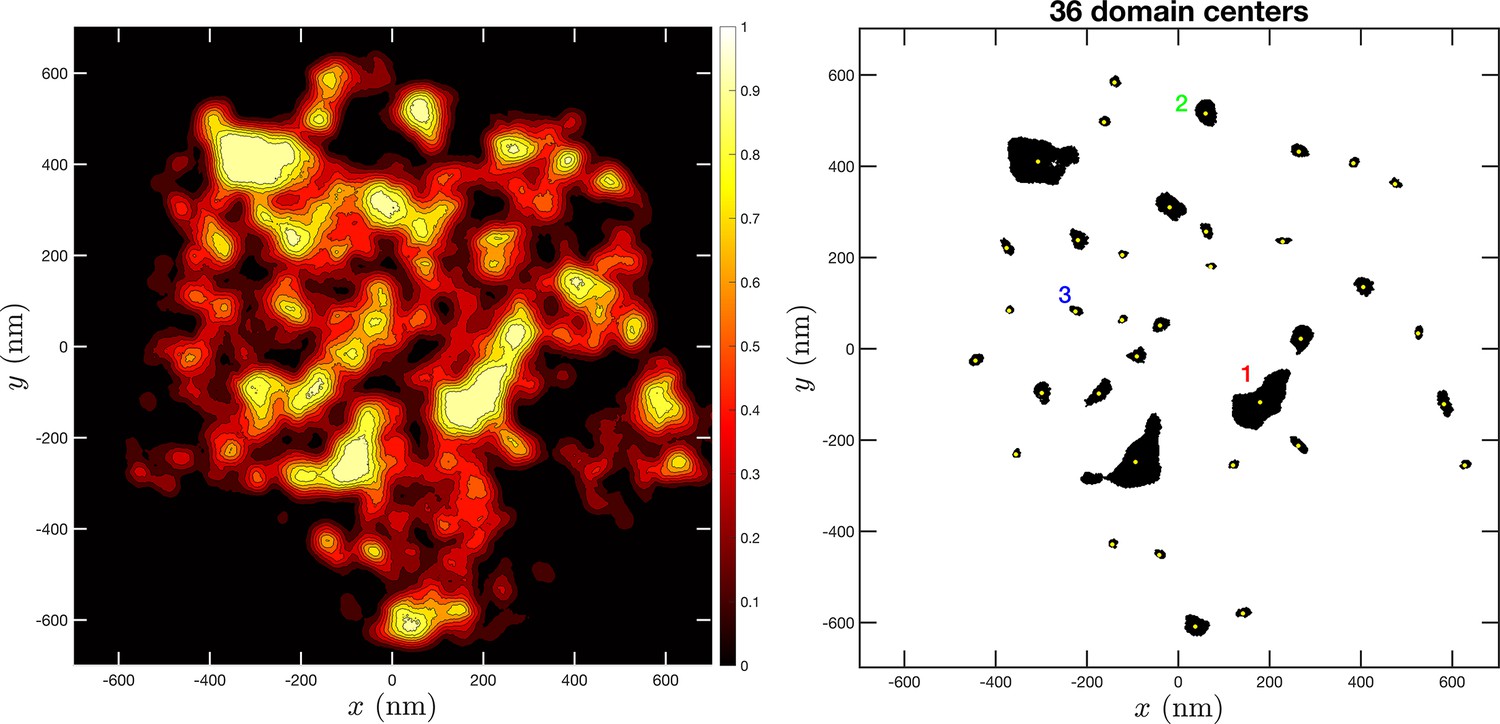
Example of domain and domain’s center determination from Self Returning Excluded Volume (SR-EV) slabs.
The left image shows the collapse SR-EV density from a 100-nm slab. The right image shows the identified domains cores in black and their geometric centers in yellow. Three different domains are identified with the numbers.
Figure 7—figure supplement 2
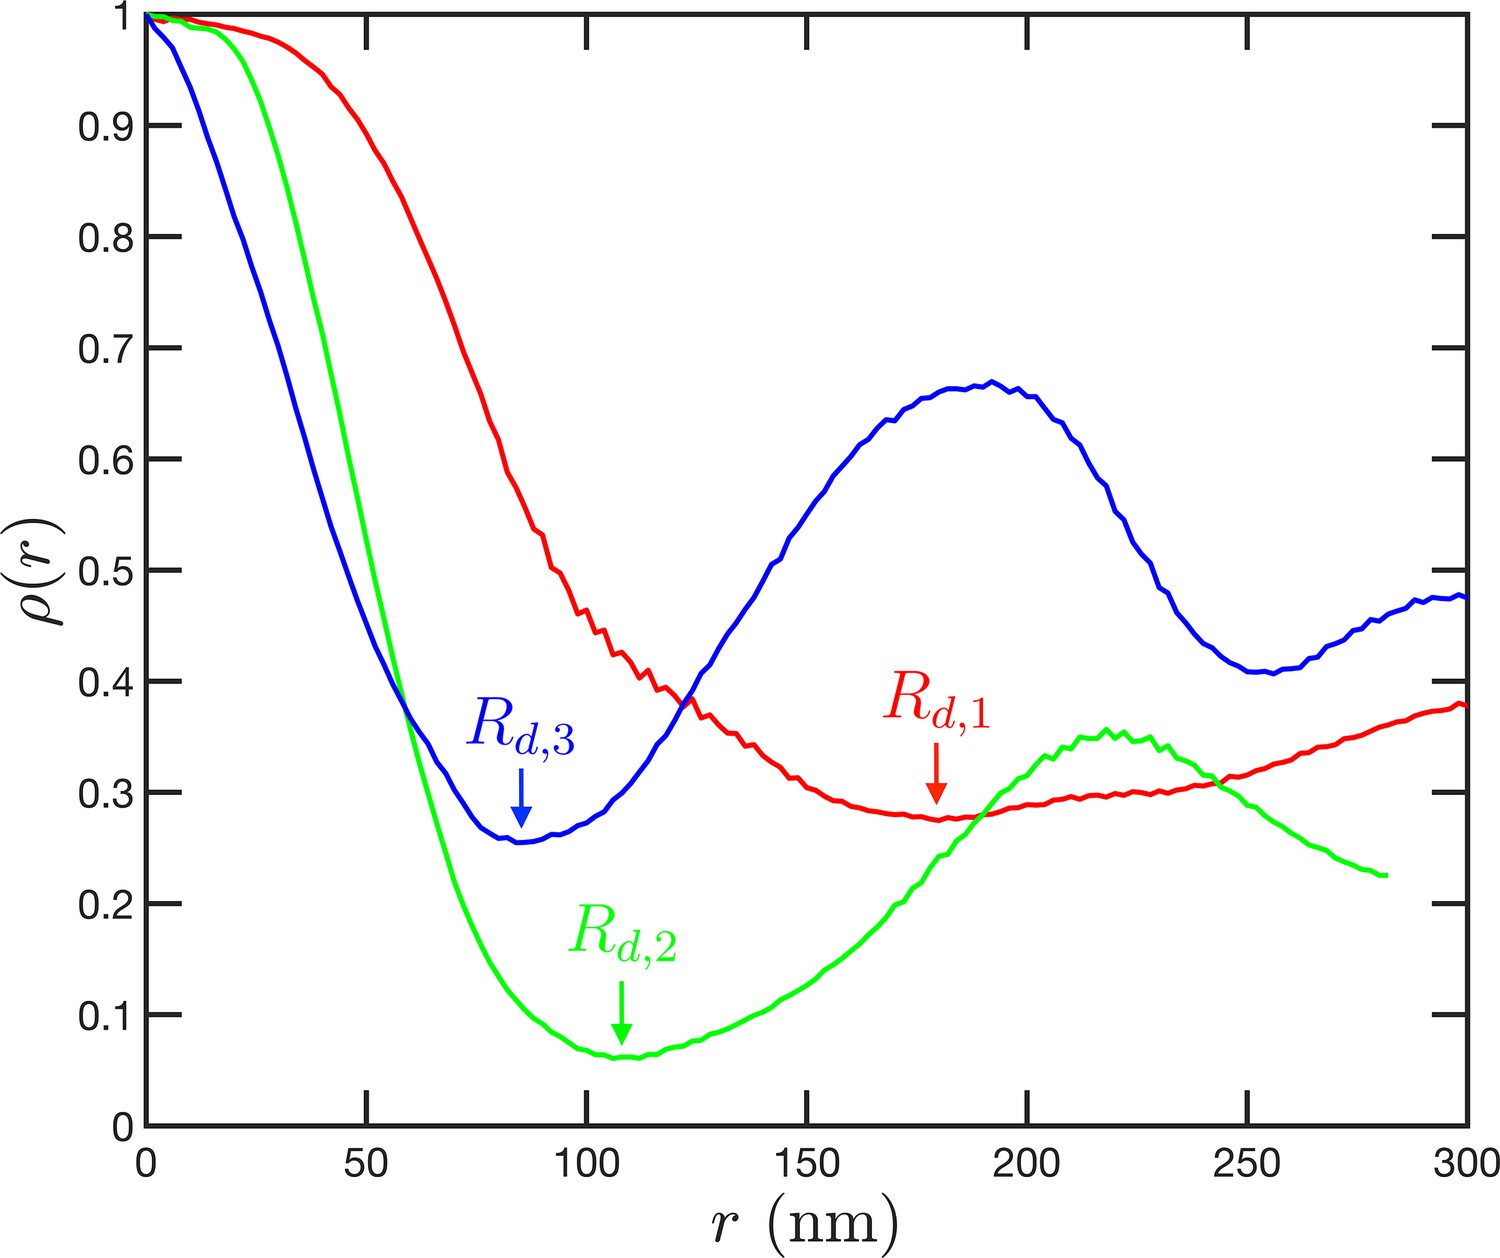
Example of the determination of the density profiles of domains and their effective radii.
The three cases correspond to the large, medium, and small domains denoted by 1, 2, and 3 in Figure 7—figure supplement 1. The profiles are calculated from the domain center using the coordinates from the configurations and assuming cylindrical symmetry. The radius of a domain corresponds to the first minimum in the density profile.
Figure 8 with 1 supplement
Packing coefficient .
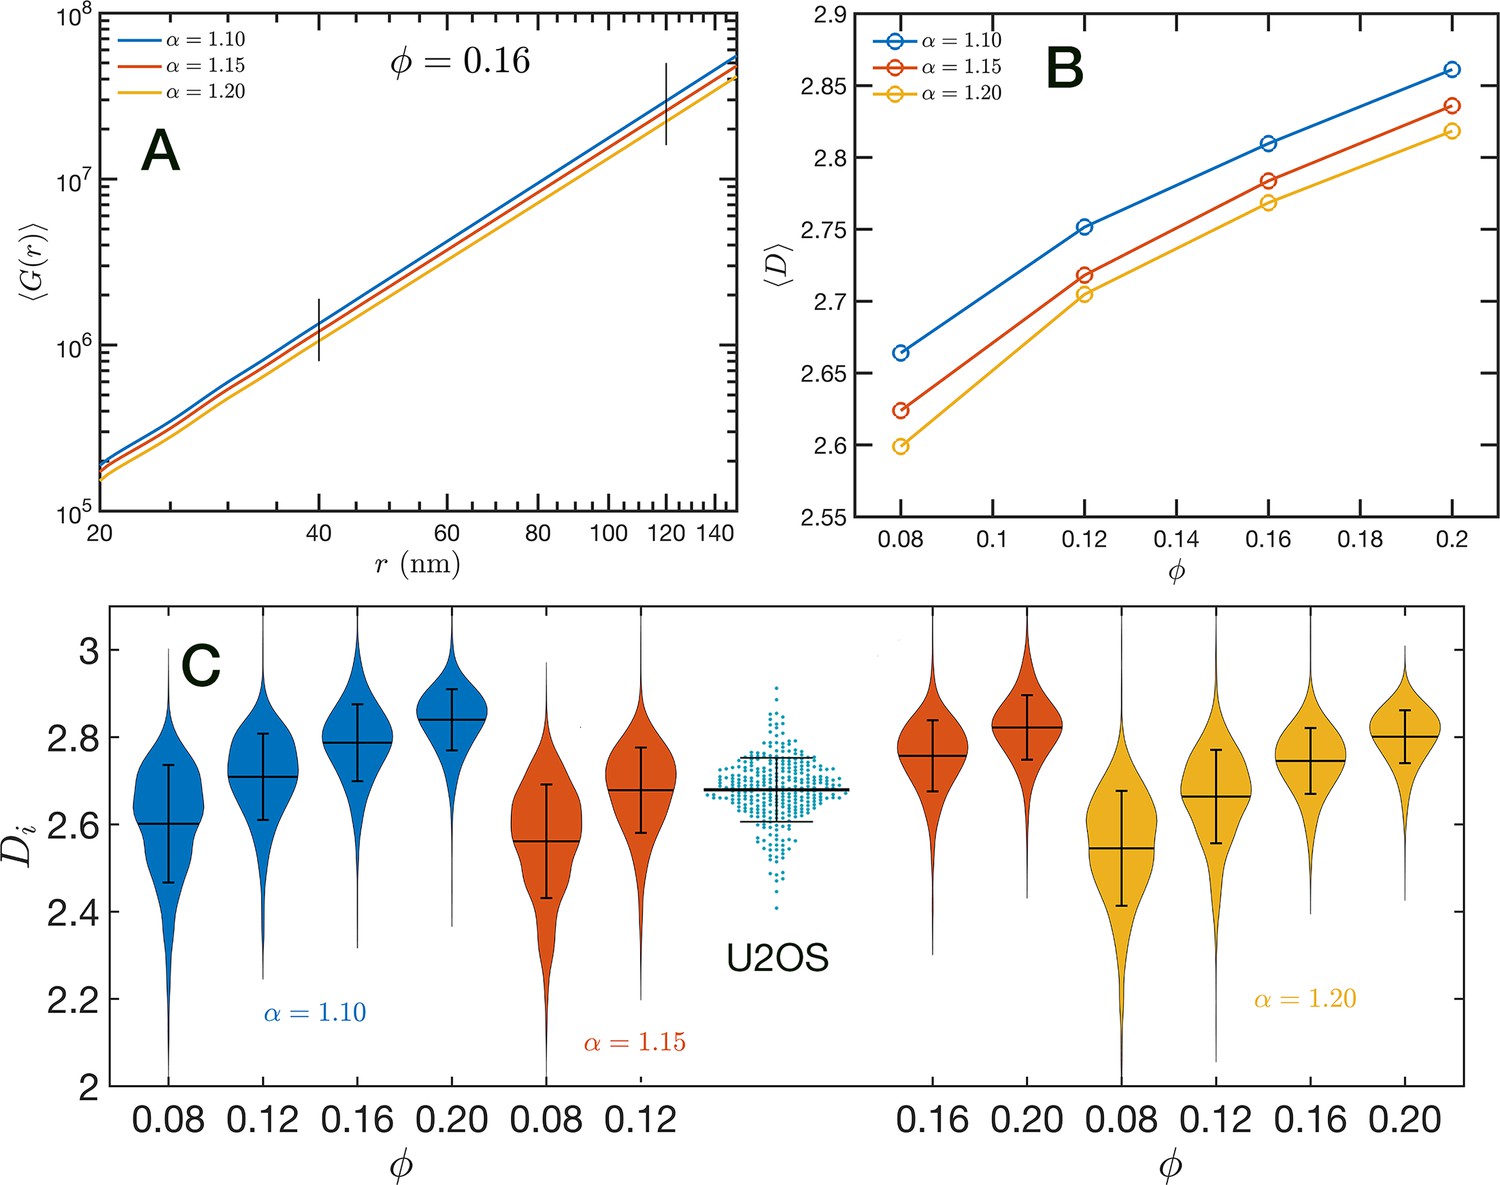
(A) Ensemble average cumulative pair correlation function for and the three studied values of . The vertical black lines mark the boundaries used to perform a power-law regression to calculate . (B) Packing coefficient as a function of and . (C) Distribution of packing coefficient for all the individual configurations for the 12 simulated conditions and, for comparison, we inserted the experimental partial wave spectroscopic (PWS) results for U2OS cells that agree very well with the SR-EV results for and .
Figure 8—figure supplement 1
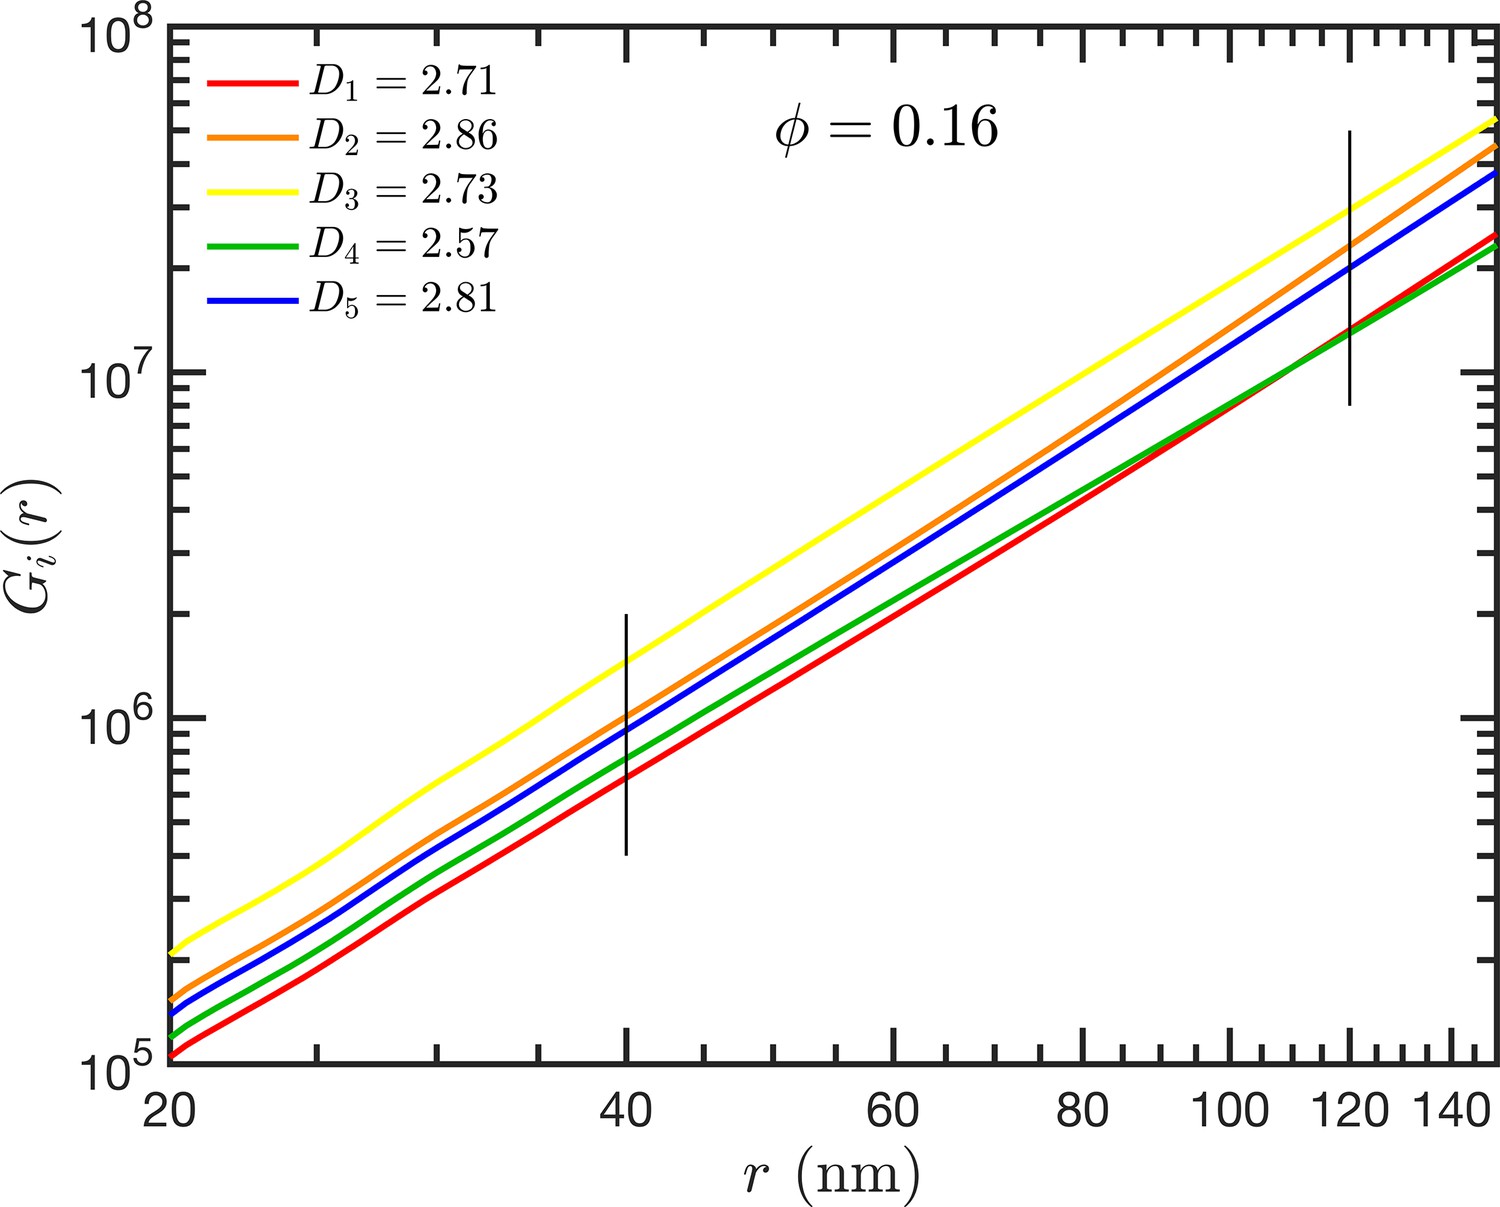
Example of cumulative distribution functions, , for five different Self Returning Excluded Volume (SR-EV) configurations.
Each is fitted with a power law between 40 and 120 nm to determine the packing coefficient corresponding to that configuration.
Figure 9

Local correlation between packing parameter and chromatin volume concentration.
Relation between the calculated with the average local volume fraction . Both quantities are calculated for the same configuration and in the same spherical region of 240 nm in radius. The figure includes one point for each one of the 12,000 configurations of the 12 simulated ensembles.
Figure 10

Effect of degrading RAD21 on the relation between packing parameter and chromatin volume concentration.
The small open symbols are the Self Returning Excluded Volume (SR-EV) results for , and 1.15. The filled symbols represent the experimental values obtained with chromatin scanning transmission electron microscopy (ChromSTEM) (Li, 2024) for the control sample (blue) and the RAD21 degrade sample (red).
Tables
Table 1
Linker DNA mean value for the 12 Φ, α studied combinations.
The folding parameter α controls the return rules, Equations 1 and 2. is the total number of nucleosomes represented in the model, which is related to the overall volume fraction with representing the radius of the nucleosomes and the global spherical cutoff. The average number of DNA base pairs per model nucleosome, including the linker DNA, is 186.6.
| Mean value of linker DNA length (bp) | ||||
|---|---|---|---|---|
| φ | N | α | ||
| 1.10 | 1.15 | 1.20 | ||
| 0.08 | 186741 | 40.8 | 38.0 | 36.3 |
| 0.12 | 280112 | 41.8 | 38.6 | 36.6 |
| 0.16 | 373483 | 44.4 | 39.4 | 37.4 |
| 0.20 | 466854 | 43.2 | 42.0 | 36.9 |
Download links
A two-part list of links to download the article, or parts of the article, in various formats.
Downloads (link to download the article as PDF)
Open citations (links to open the citations from this article in various online reference manager services)
Cite this article (links to download the citations from this article in formats compatible with various reference manager tools)
Local volume concentration, packing domains, and scaling properties of chromatin
eLife 13:RP97604.
https://doi.org/10.7554/eLife.97604.3


