Female-dominated disciplines have lower evaluated research quality and funding success rates, for men and women
- School of Mathematics and Statistics, University of Canterbury, New Zealand
- Bioprotection Centre of Research Excellence, University of Lincoln, Lincoln, New Zealand
- School of Earth and Environment, University of Canterbury, New Zealand
Figures
Figure 1
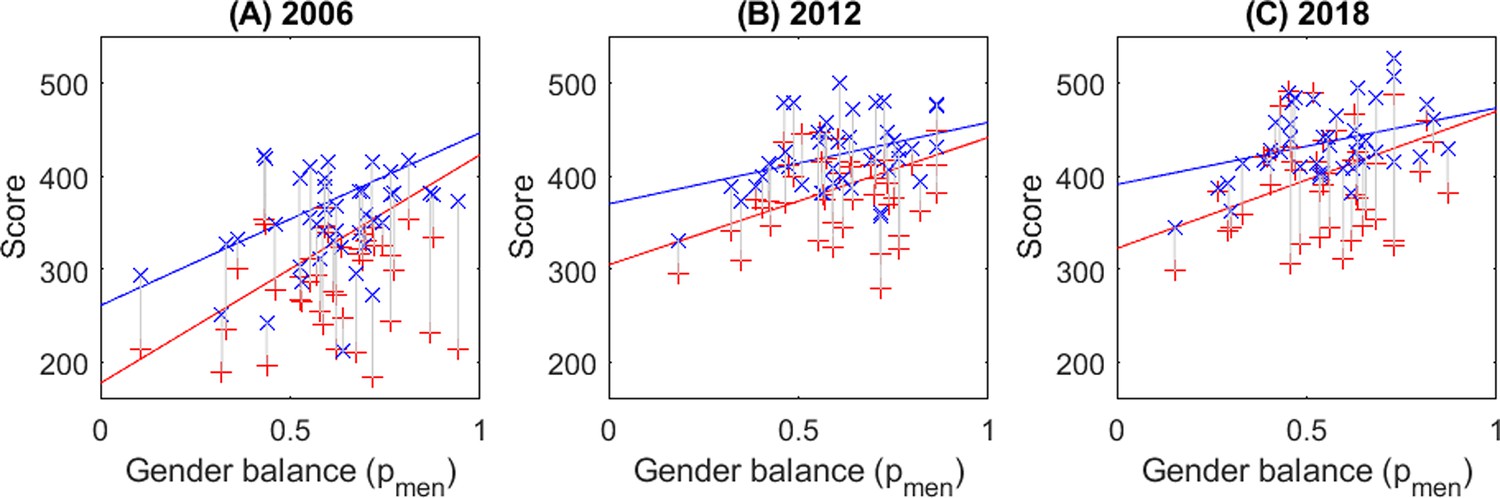
Male-dominated disciplines have higher expected research scores than female-dominated disciplines in all three Performance-Based Research Fund (PBRF) assessments.
Points – the mean raw score of individuals in each of the disciplines (full raw data cannot be shown for privacy reasons), against the proportion of men in the discipline (blue – men, red – women). Lines – expected score from individual-level analysis ( respectively) adjusting for age, institute, gender, and proportion of men in the discipline, and shown for a 50-year-old man (blue) and woman (red) at one university in Aotearoa NZ. (A) 2006 assessment round, (B) 2012 assessment round, (C) 2018 assessment round.
Figure 2
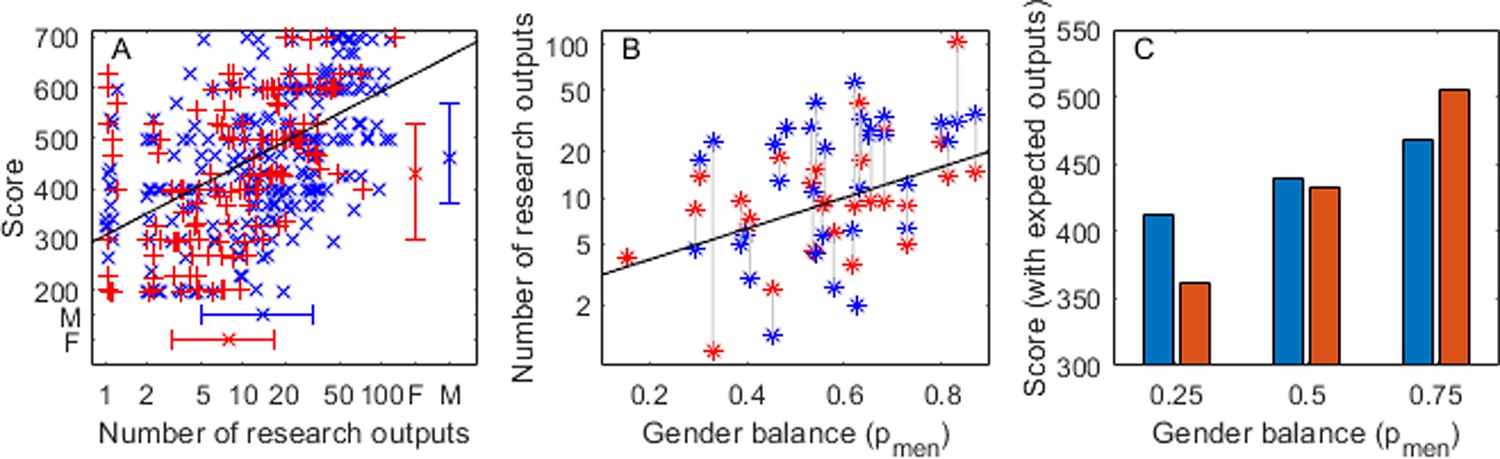
Research score is strongly correlated with number of research outputs (A), which is correlated to the gender balance of the discipline (B); but, after adjusting for a typical number of research outputs, female-dominated disciplines still have lower scores (C).
Performance-Based Research Fund (PBRF) data using individuals at University of Canterbury (UC) (N=384). (A) Score against number of research outputs over the period of the PBRF assessment. Trend line shows the expected score for a 50-year-old. Error bars show the median and interquartile range for men and women for score (vertical) and number of outputs (horizontal). (B) Mean number of outputs by gender for each discipline against gender balance of the discipline. Trend line from individual-level analysis (), gender was not significant. (C) Expected score of a 50-year-old man and woman with the expected number of outputs for a discipline of that gender balance (25%, 50%, 75% men, respectively).
Figure 3
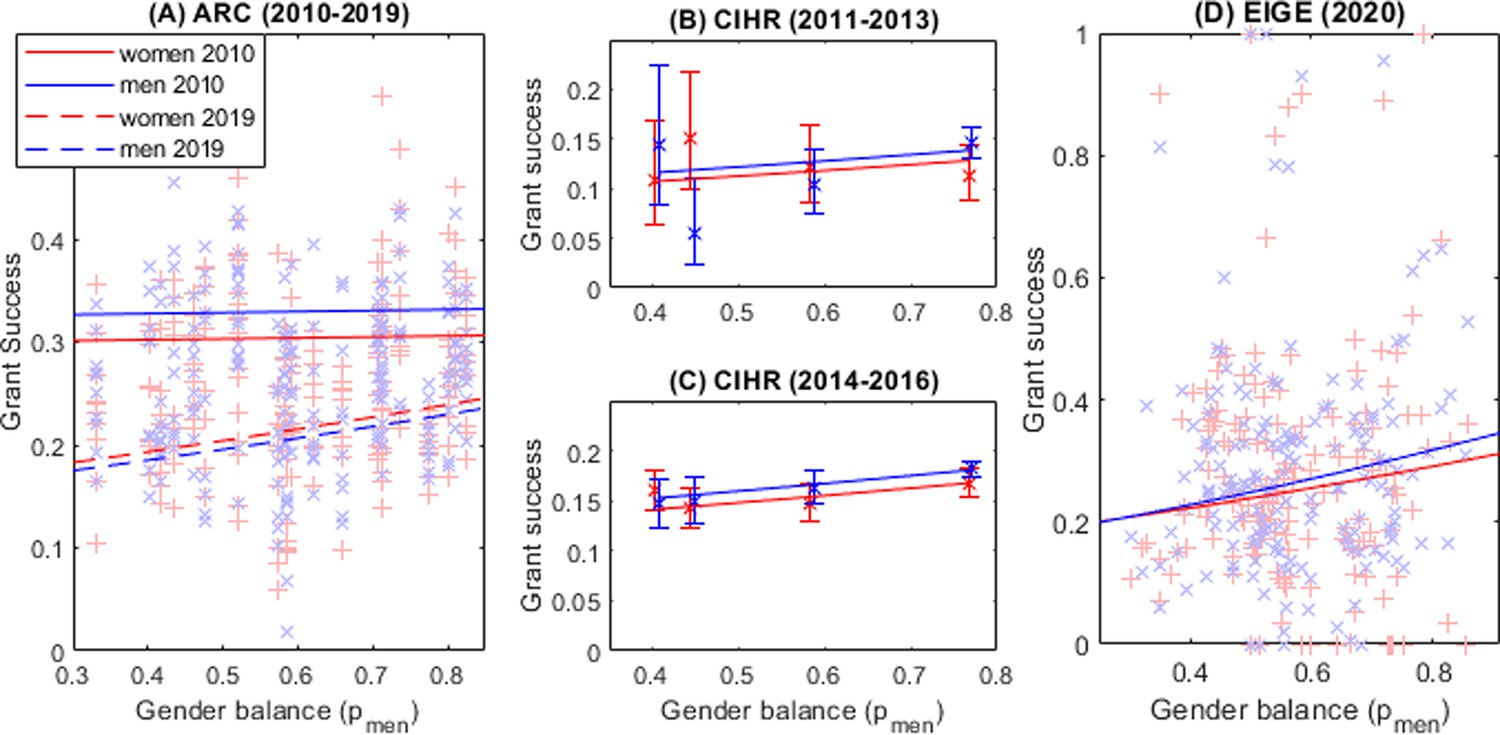
Researchers in male-dominated disciplines have a higher chance of funding success.
(A) Australian Research Council (ARC) (2010–2019): Points – funding success rates by gender in 20 disciplines over 10 years against proportion of men in the discipline in 2018. Lines – expected success rates of men and women in 2010 (solid lines) and 2019 (dashed lines). (B) Canadian Institute of Health Research (CIHR) (2011–2013), (C) CIHR (2014–2016): Points – funding success rates by gender for each discipline against proportion of men in the discipline (estimated from application numbers) error bars are binomial 95% CI. Lines – expected success rate from combined analysis of all grant types in both time periods. (D) European Institute of Gender Equality (EIGE) (2020): Points – funding success rates by gender in 8 disciplines and 27 countries against proportion of men in the discipline in that country. Lines – expected success rates of men and women.
Tables
Table 1
A summary of the four independent datasets used in the study showing: country, time period of the data, number of disciplines, research evaluation method, number of individuals or applicants by gender, number of individual data points, output variable, and mean expected output for each gender across the whole dataset.
| Scheme | PBRF | ARC | CIHR | EIGE | ||
|---|---|---|---|---|---|---|
| Country | Aotearoa New Zealand | Australia | Canada | Predominantly EU | ||
| Time span | 2000–06 | 2007–12 | 2013–18 | 2010–19 | 2011–16 | 2019 |
| Disciplines | 42 | 42 | 43 | 22 | 4 | 8 |
| Evaluation | Research quality score (200–700) | Funding success | ||||
| Women | 1708 | 2658 | 3297 | 46,231 | 8143 | 49,863 |
| Men | 2522 | 4005 | 4181 | 130,331 | 15,775 | 85,305 |
| Data points | 4230 | 6663 | 7487 | 440 | 16 | 333 |
| Outcome | Mean score | Success rate | ||||
| Women | 272 | 368 | 379 | 25.7% | 14.7% | 27.0% |
| Men | 351 | 424 | 433 | 27.1% | 16.4% | 30.3% |
Table 2
Maximal candidate model and best fit model to predict for Performance-Based Research Fund (PBRF) and for each dataset.
Wilkinson notation is used to indicate interaction terms.
| Response | Maximal model | Best model (lowest AIC) | |
|---|---|---|---|
| PBRF | |||
| ARC | |||
| CIHR | |||
| EIGE |
Appendix 1—table 1
A summary of the three Performance-Based Research Fund (PBRF) datasets.
Mean (and standard deviation) of score and age at each time point. ***p<0.001, *0.01<p<0.05, two-sided t-test men/women.
| Time period | 2006 | 2007–12 | 2013–18 | |
|---|---|---|---|---|
| Disciplines | 42 | 42 | 43 | |
| N | Women | 1708 | 2658 | 3297 |
| Men | 2522 | 4005 | 4181 | |
| Mean score (std) | Women | 272 (161)*** | 368 (139)*** | 379 (142)*** |
| Men | 351 (163) | 424 (143) | 433 (146) | |
| Mean age (std) | Women | 44.5 (9.6)* | 47.8 (10.4)*** | 47.7 (11.1)*** |
| Men | 45.3 (10.1) | 50.0 (10.9) | 49.5 (11.4) | |
Additional files
-
Supplementary file 1
Table S1: Comparative descriptions of each of the four datasets.
- https://cdn.elifesciences.org/articles/97613/elife-97613-supp1-v1.docx
-
Supplementary file 2
Table S2: Summary statistics of the Performance-Based Research Fund (PBRF) data by discipline.
Includes the number of women and men, mean age, and mean score for each gender and proportion of men in each discipline.
- https://cdn.elifesciences.org/articles/97613/elife-97613-supp2-v1.xlsx
-
Supplementary file 3
Detailed model output for all Performance-Based Research Fund (PBRF), Australian Research Council (ARC), Canadian Institute of Health Research (CIHR), and European Institute of Gender Equality (EIGE) data candidate models.
Each sheet shows the coefficients and p-values for the full range of candidate models trialled for each dataset to predict either Score (PBRF) or Funding success (ARC, CIHR, EIGE). Coefficient names (first column) are given in Wilkinson’s notation. ΔAIC is the change in AIC between the best fit model (minimum AIC, ΔAIC = 0) and the candidate model. r-Squared is also given for the linear model (PRF only). Individual country coefficients and p-values for the EIGE data are not shown for clarity.
- https://cdn.elifesciences.org/articles/97613/elife-97613-supp3-v1.xlsx
-
Supplementary file 4
Detailed model output for the bibliometric models.
Sheet 1. Single bibliometric models .The coefficients and p-values for each of the five bibliometrics. ΔAIC is the change in AIC between the best fit model, with minimum AIC and ΔAIC = 0, and the candidate model. r-Squared is also given. Sheet 2. Two bibliometric model .The coefficients and p-values for each of the other four bibliometrics. ΔAIC is the change in AIC between the only model (minimum AIC, ΔAIC = 0) and the candidate model. r-Squared is also given. Sheet 3. Coefficients and p-values for .
- https://cdn.elifesciences.org/articles/97613/elife-97613-supp4-v1.xlsx
-
MDAR checklist
- https://cdn.elifesciences.org/articles/97613/elife-97613-mdarchecklist1-v1.docx
-
Source data 1
DataARC.xlsx.
Field, Gender, Year, Number of applicants, Number of successes, proportion men (from external data).
- https://cdn.elifesciences.org/articles/97613/elife-97613-data1-v1.xlsx
-
Source data 2
DataCIHR.xlsx.
Field, Gender, Type of grant, Time period (before or after funding change), Number of applicants, number of successes, proportion male (from application numbers).
- https://cdn.elifesciences.org/articles/97613/elife-97613-data2-v1.xlsx
-
Source data 3
DataEIGE.xlsx.
Country, Field, Gender, Number of applicants, Number of successes, proportion male (from applicant data), proportion male from external data.
- https://cdn.elifesciences.org/articles/97613/elife-97613-data3-v1.xlsx
Download links
A two-part list of links to download the article, or parts of the article, in various formats.
Downloads (link to download the article as PDF)
Open citations (links to open the citations from this article in various online reference manager services)
Cite this article (links to download the citations from this article in formats compatible with various reference manager tools)
Female-dominated disciplines have lower evaluated research quality and funding success rates, for men and women
eLife 13:RP97613.
https://doi.org/10.7554/eLife.97613.3


