Two long-axis dimensions of hippocampal-cortical integration support memory function across the adult lifespan
- Department of Neurobiology, Care Sciences, and Society, Karolinska Institutet, Sweden
- Wallenberg Centre for Molecular Medicine, Umeå University, Sweden
- Aging Research Center, Karolinska Institutet and Stockholm University, Sweden
- Umeå Center for Functional Brain Imaging, Umeå University, Sweden
- Department of Medical and Translational Biology, Umeå University, Sweden
- Department of Radiation Sciences, Umeå University, Sweden
- Centre for Cognitive Neuroimaging, Donders Institute for Brain, Cognition and Behaviour, Radboud University, Netherlands
- Department of Biomedical Engineering, the University of Melbourne, Australia
- Department of Psychiatry, the University of Melbourne, Australia
- Department of Psychology, University of the Bundeswehr Munich, Germany
Figures
Figure 1
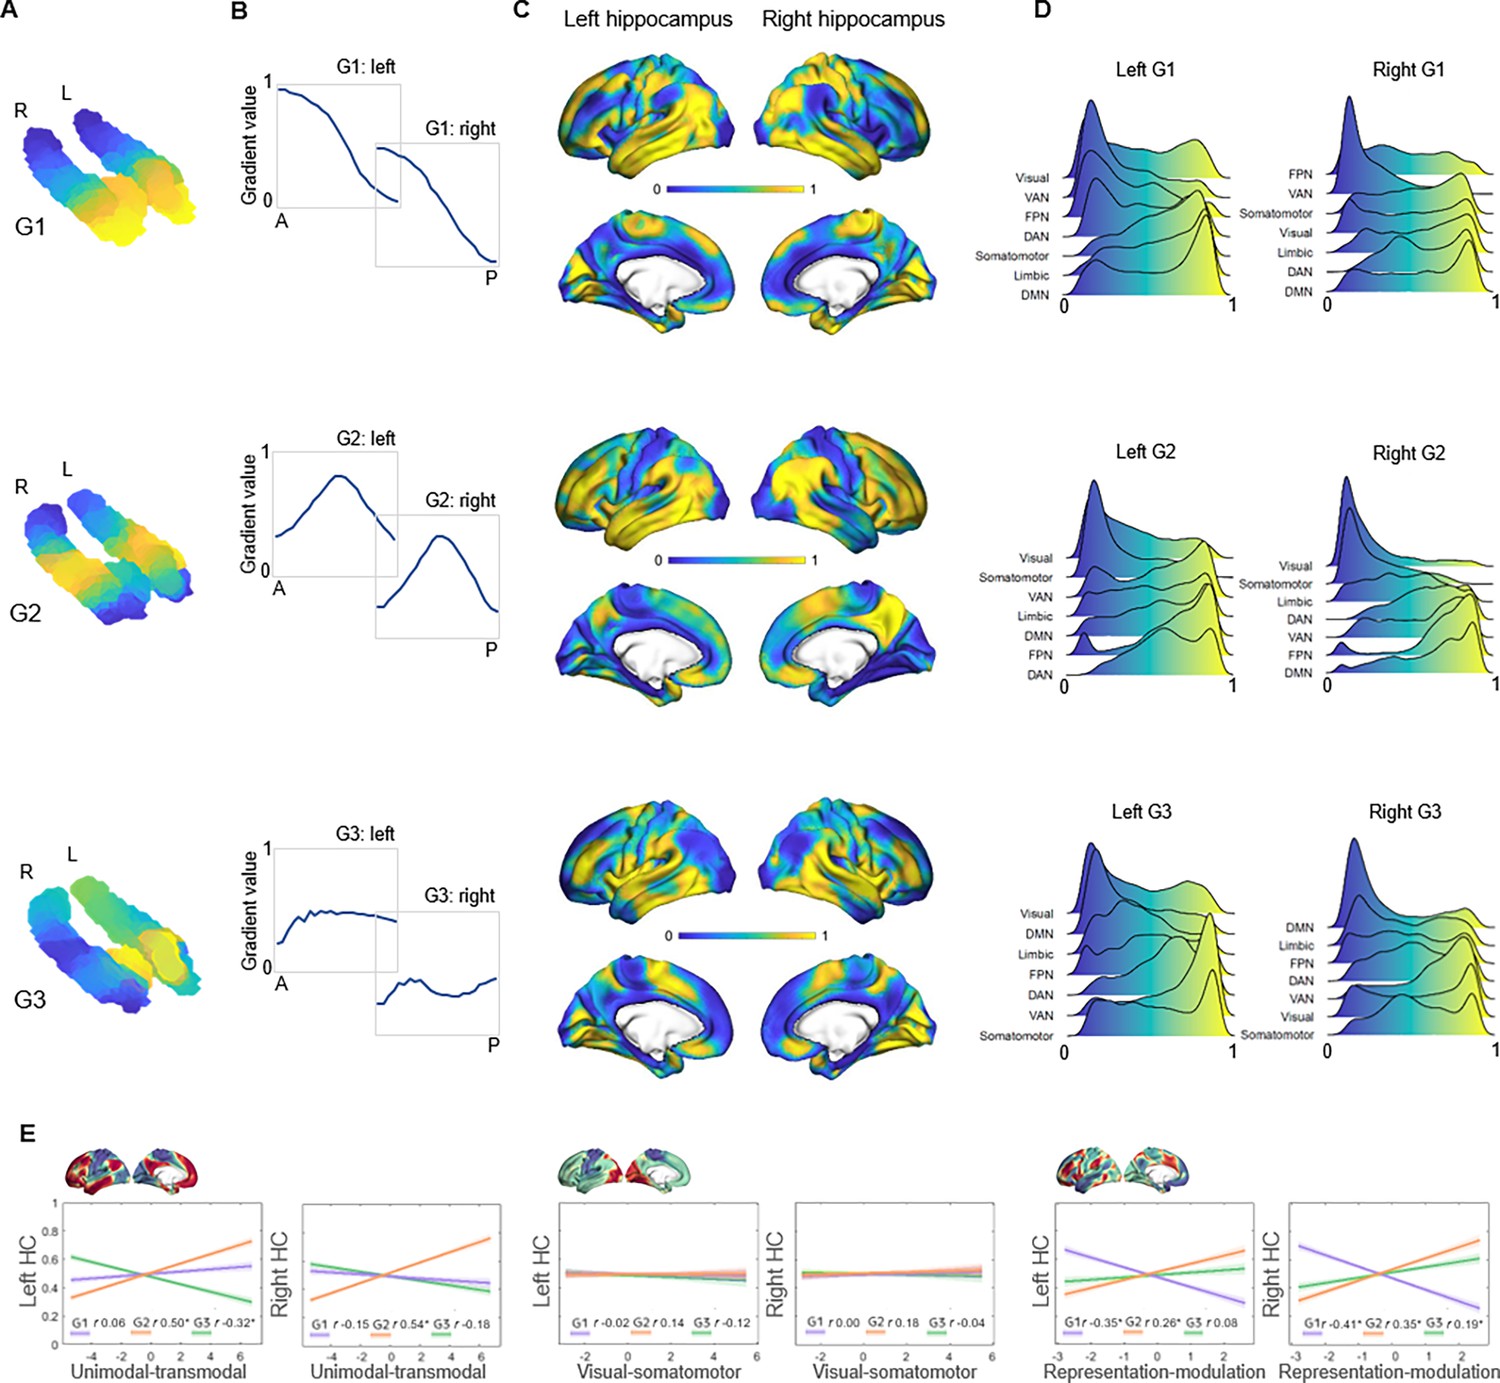
Topographic gradients of hippocampal cortical connectivity.
(A) The first three hippocampal connectopic maps (G1–G3), explaining 67% of the variance across left and right hemispheres. Similar colors convey similar patterns of cortical connectivity. Values range between 0 (blue) and 1 (yellow). (B) Plots convey change in connectivity along the anteroposterior hippocampal axis. Mean values from 23 hippocampal bins (each ~2 mm) are plotted against their distance (in mm) from the most anterior hippocampal voxel. Values were estimated based on subject-level gradients and averaged across participants. G1 conveys gradual change in connectivity along an anteroposterior gradient. G2 conveys gradual change in connectivity along a second-order long-axis gradient, separating the middle hippocampus from anterior and posterior ends. G3 conveys close to no change in connectivity along the longitudinal axis, with connectivity change instead organized in a primarily medial-lateral gradient. (C) Cortical projections for G1, G2, and G3. Values range between 0 (blue) and 1 (yellow). (D) The order of cortical networks in gradient space. Density plots visualize the distribution of gradient values for seven cortical networks (Yeo et al., 2011). (E) Correlations between cortical patterns of hippocampal gradients and the three primary gradients of cortical functional organization, which are exemplified at the top of each graph (Margulies et al., 2016).
Figure 2
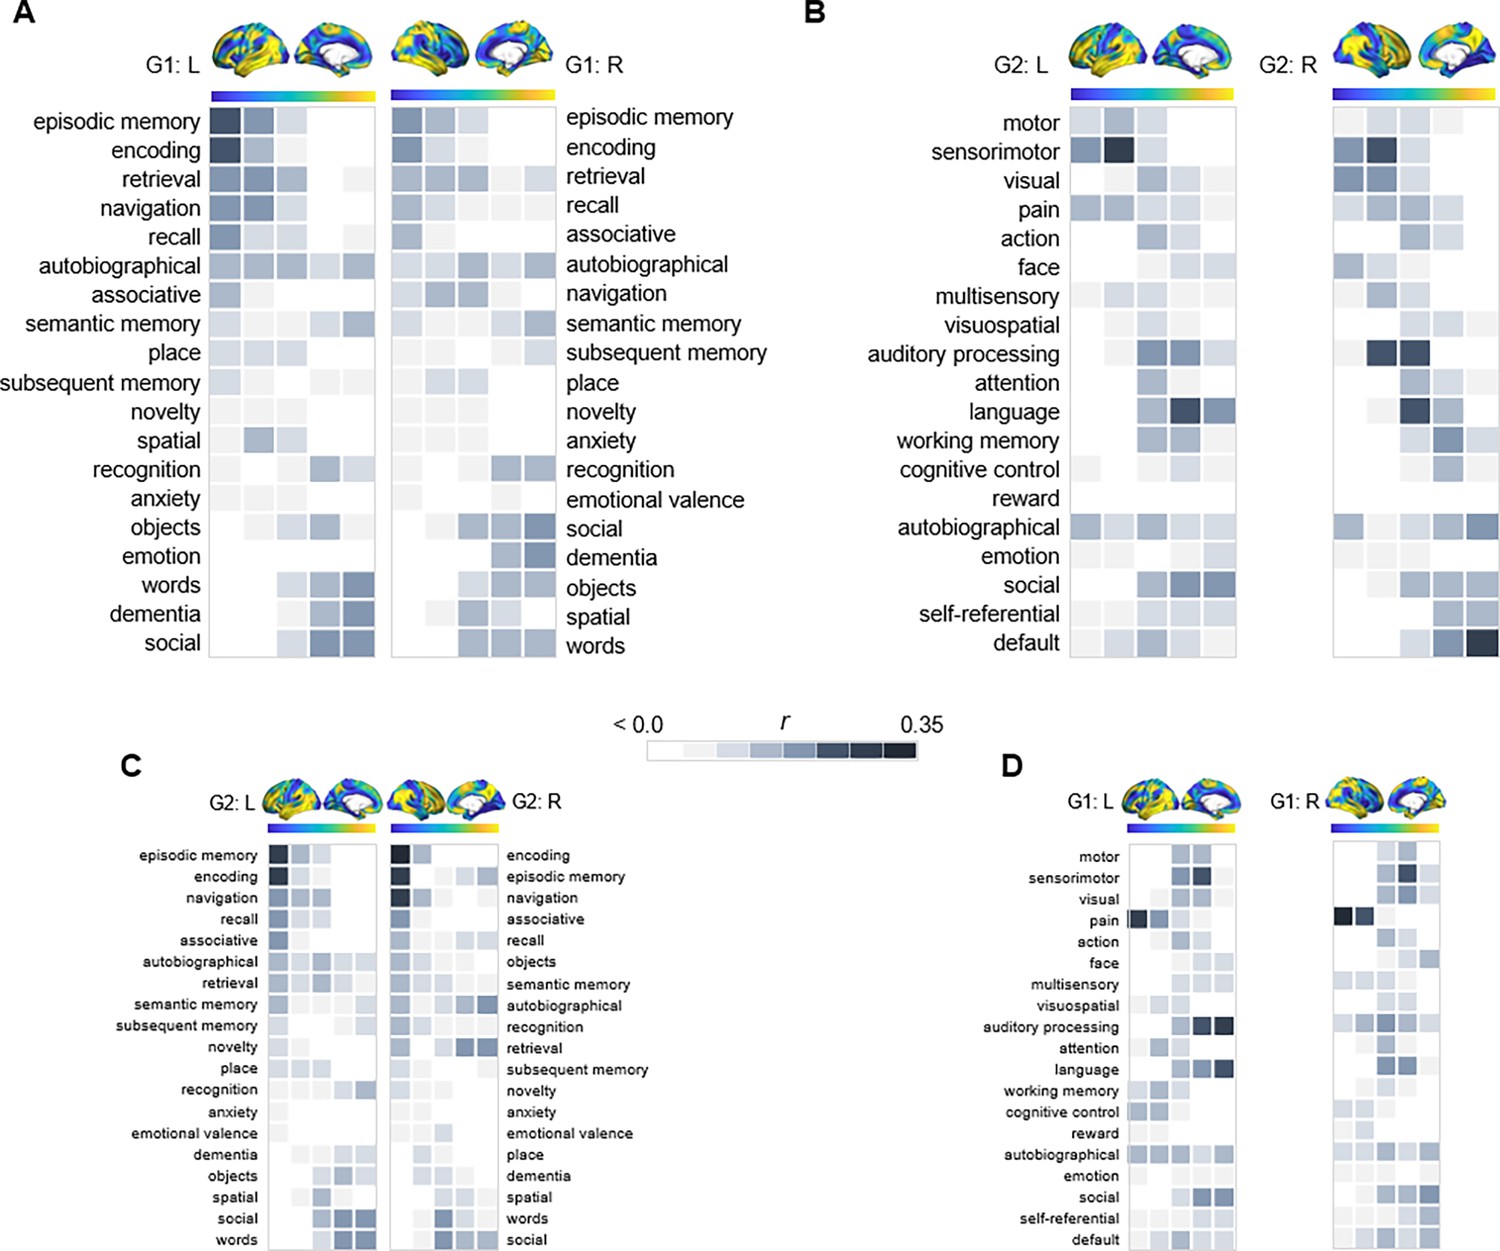
Behavioral profiling of G1 and G2 across cortex.
For each gradient, columns represent 20 percentile bins of the gradient’s cortical projection. Color shadings represent the strength of correlations between gradient bins and meta-analytical maps in Neurosynth. (A) Terms commonly linked to anteroposterior hippocampal functional specialization were assessed across G1 and ranked based on their location along the gradient. (B) For G2, terms were selected and ordered as to reflect a unimodal-transmodal cortical axis (Margulies et al., 2016). (C) The correspondence between G2 and behavioral terms commonly linked to anteroposterior hippocampal functional specialization. (D) The correspondence between G1 and behavioral terms expressing a unimodal-transmodal axis.
Figure 3
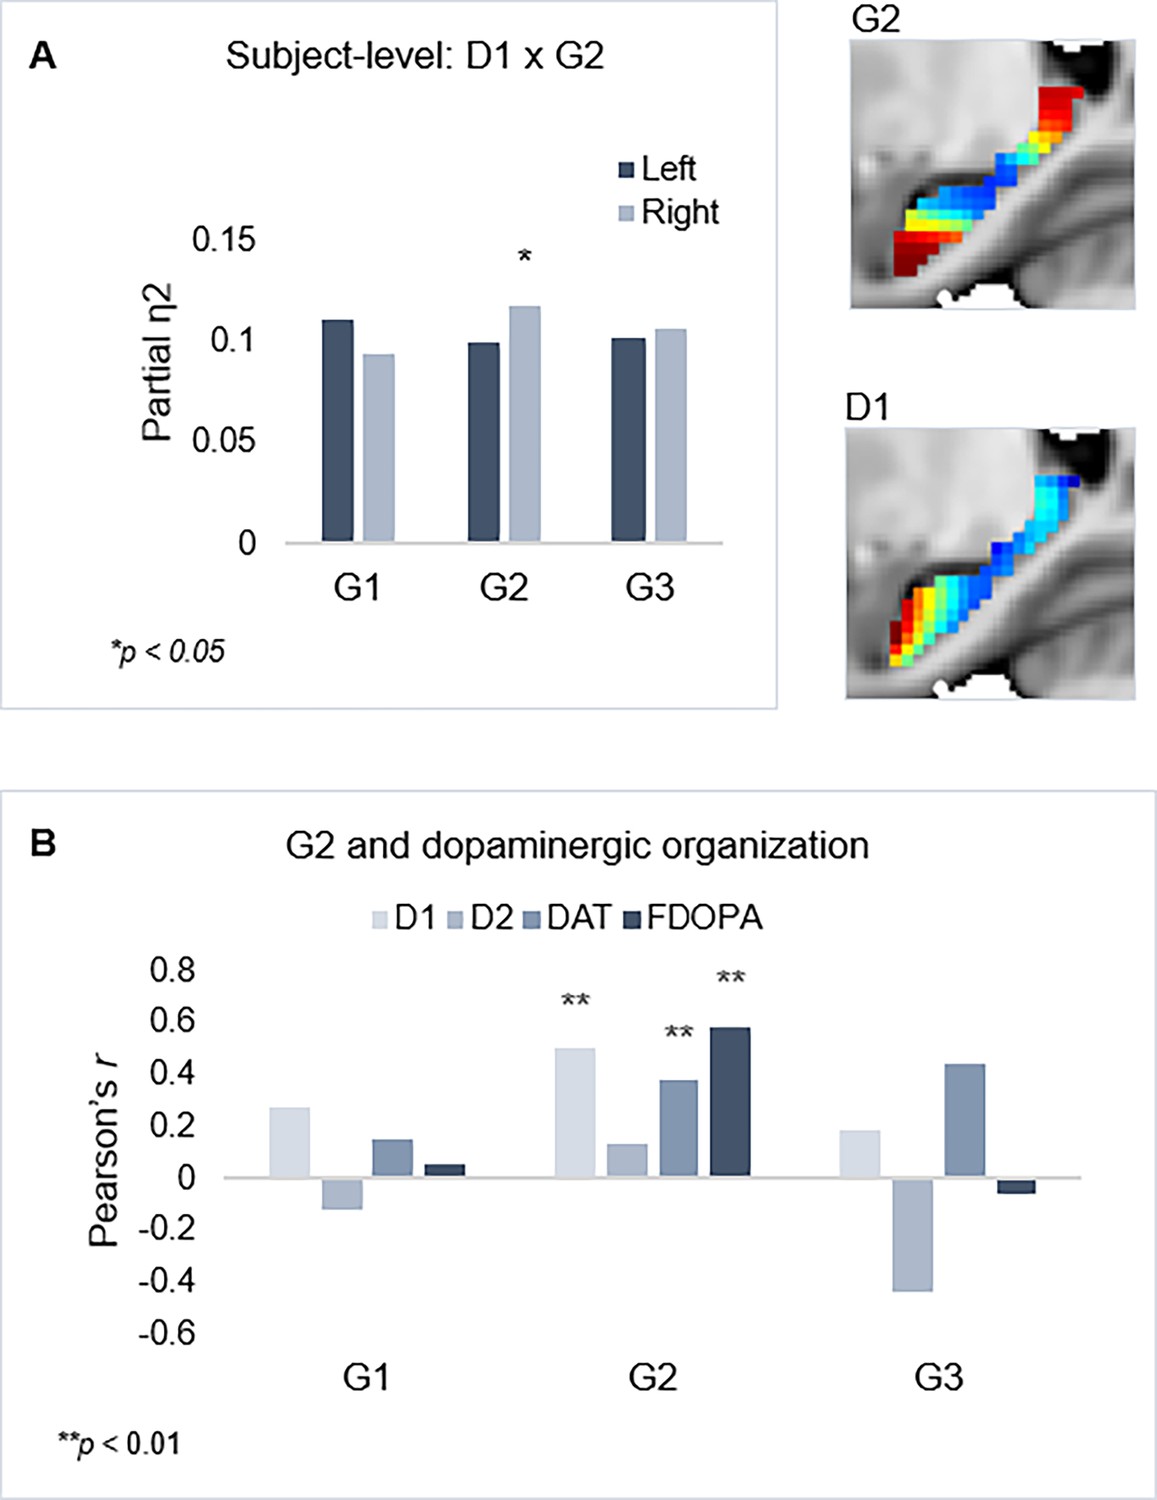
Shared functional and molecular organization within the hippocampus.
(A) Multivariate effects of hippocampal D1DR trend surface modeling (TSM) parameters as predictors of G2 TSM parameters. Images show average organization of G2 and D1DR in the right hemisphere. Note that the arbitrary color scale of G2 has been flipped. (B) Correlations between group-level TSM parameters of functional gradients and dopamine (DA) markers.
Figure 4
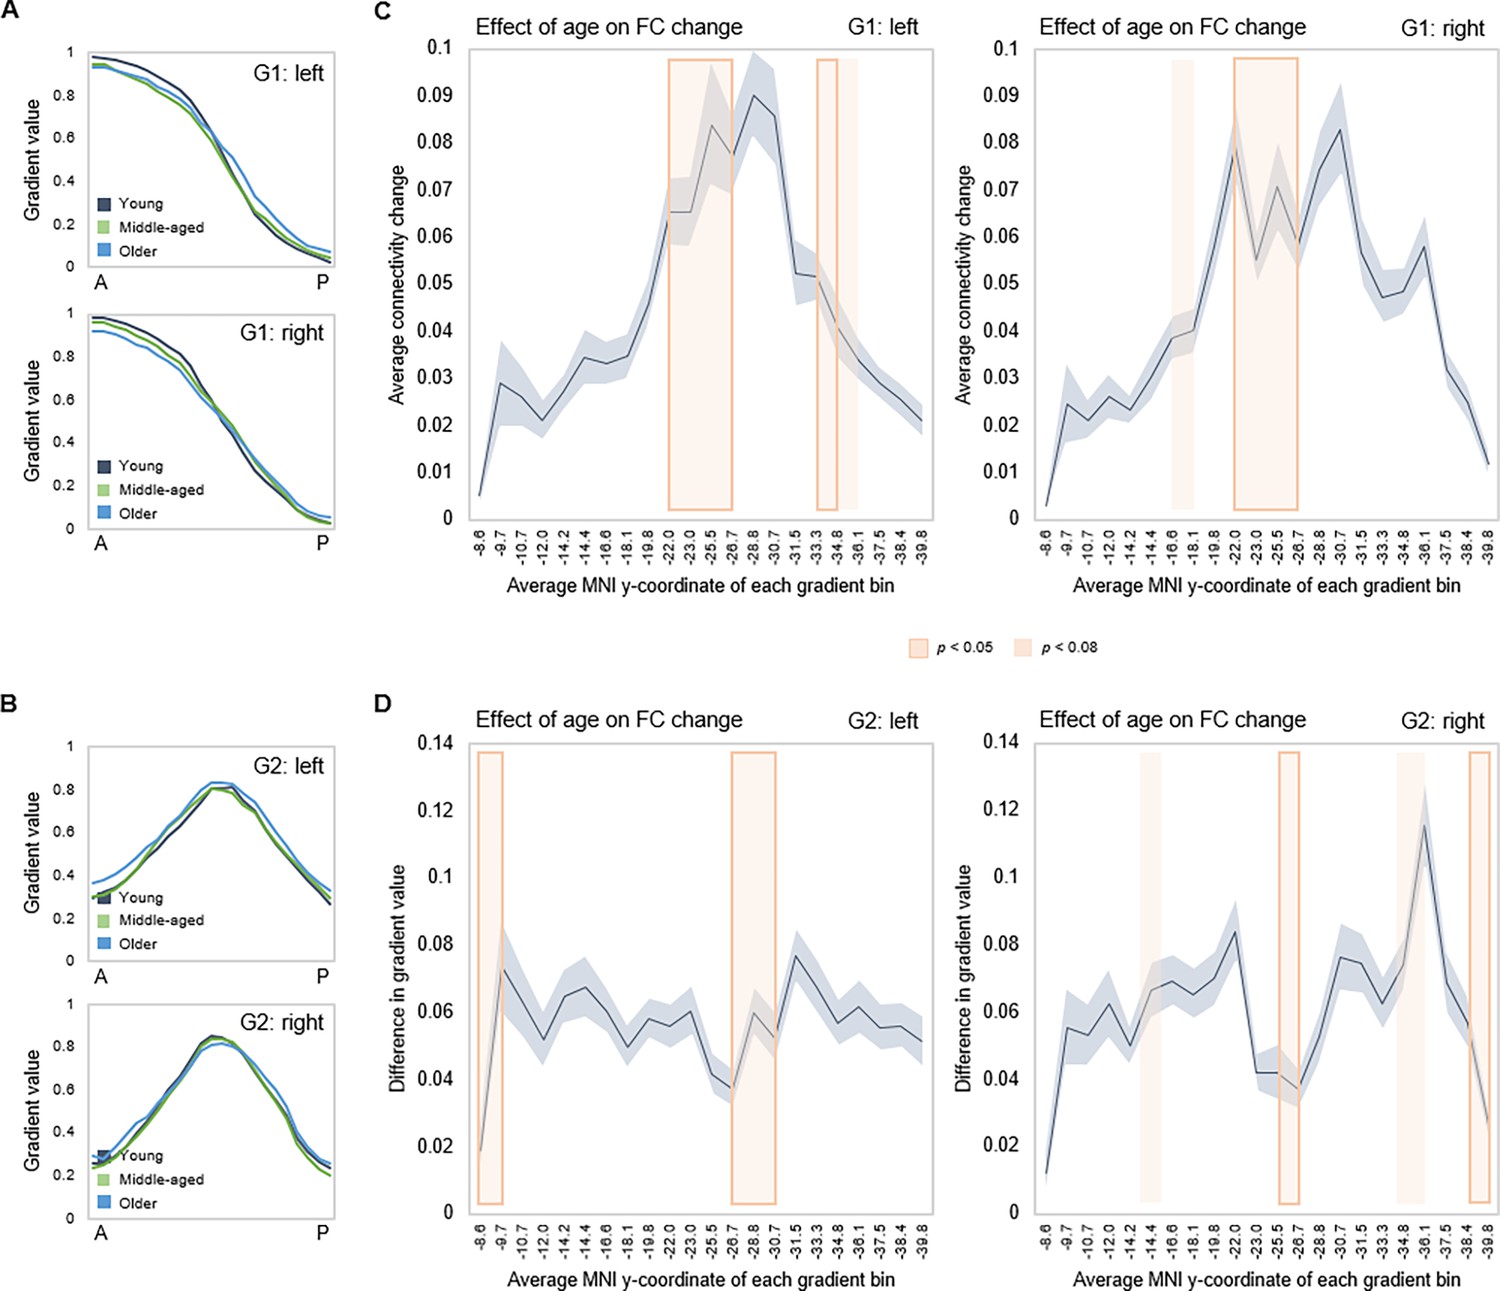
Effects of age on hippocampal gradients.
(A, B) Less specificity in connectivity change across G1 and G2 in older age. Average values of subject-level gradient bins are plotted as a function of their distance from the most anterior hippocampal voxel. Separate lines mark young (20–39 years; gray), middle-aged (40–59 years, green), and older (60–79 years; blue) age-groups. The flatter curves in the older group indicate less distinct change in connectivity patterns across gradients in older age. (C) Localization of age effects along G1. Shaded fields indicate the position of significant age effects along G1. (D) Localization of age effects along G2. Shaded fields indicate the position of significant age effects along G2.
Figure 5
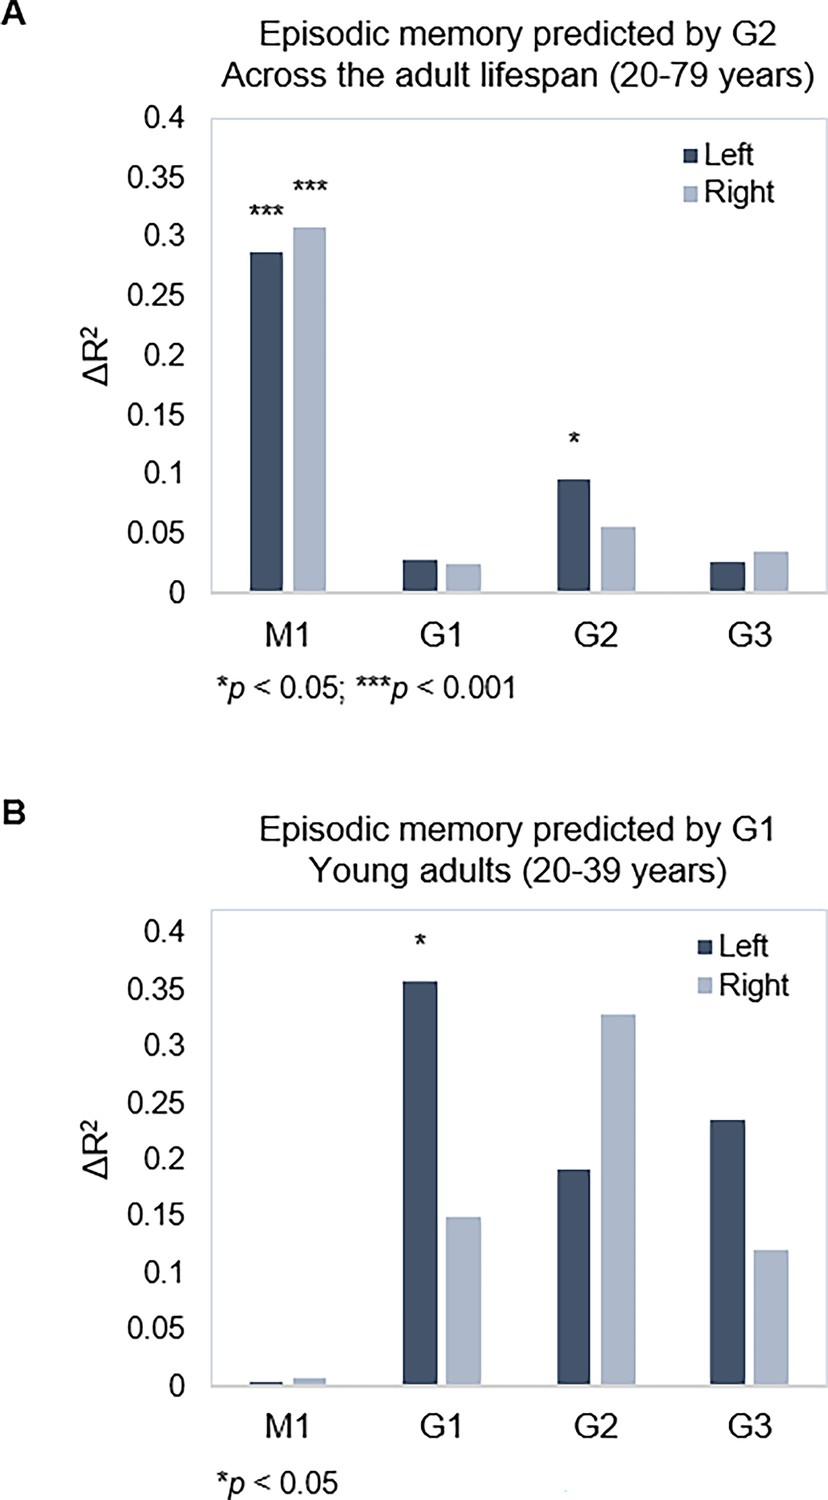
Gradient topography and episodic memory.
(A) Individual differences in topographic characteristics of left-hemisphere G2 significantly predicted episodic memory performance across the sample, over and above the first- and second-step models (M1: age, sex, in-scanner motion; G1 parameters). (B) Topographic characteristics of G1 in the left hemisphere significantly predicted episodic memory performance in young adults, over and above M1 (age, sex, and in-scanner motion).
Figure 6
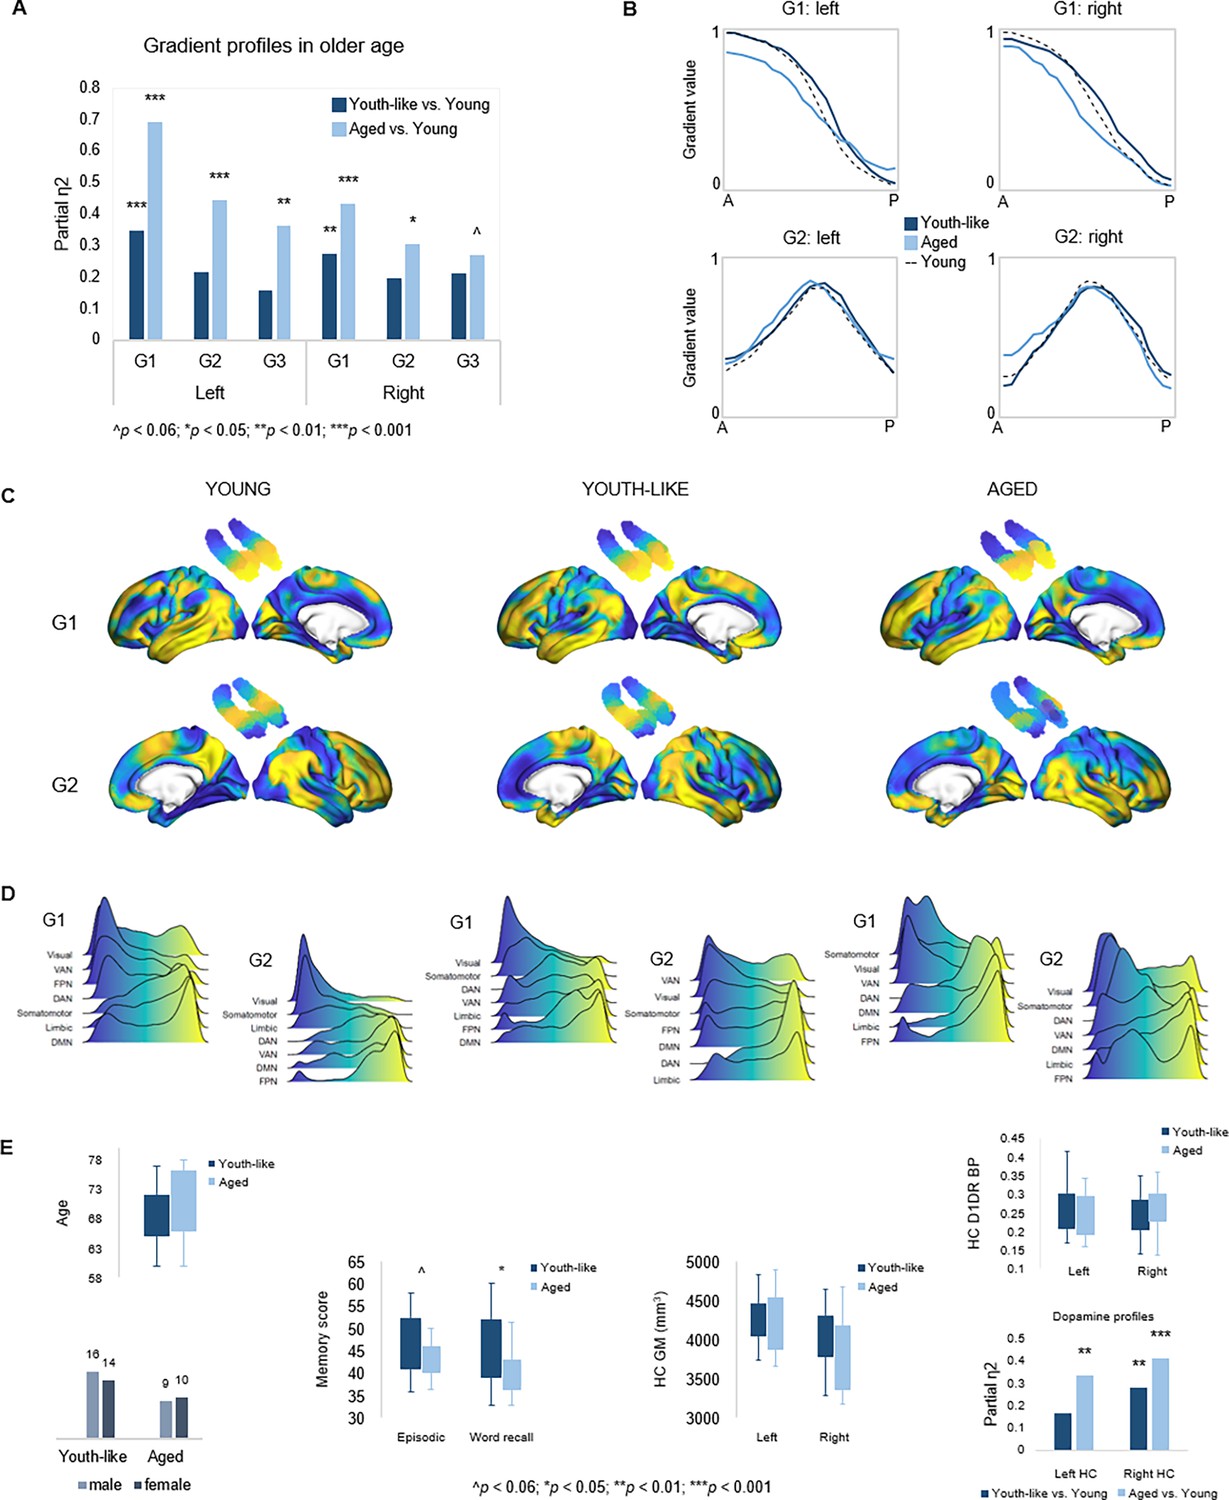
Gradient profiles in older age.
(A) Two older subgroups were identified based on left-hemisphere G1. The first group (n=19) displayed gradient characteristics significantly different from those in young adults, whereas the second group (n=30) displayed gradient characteristics more similar to those in young adults. Bars represent comparisons of gradient trend surface modeling (TSM) parameters between older subgroups and younger adults. (B) Average gradient values across participants within subgroups, plotted against the distance (in mm) from the most anterior hippocampal voxel. The flatter curves in older adults with an aged gradient profile suggest less distinct change in connectivity across gradients. (C) Group-level G1 and G2 for young, youth-like, and aged groups. (D) Position of cortical networks in gradient space. (E) Older subgroups were comparable in terms of age, sex, hippocampal gray matter volume, and average levels of hippocampal D1DR availability, while older adults with a youth-like gradient profile exhibited a more youth-like profile also in D1DR distribution and superior episodic memory.
Appendix 1—figure 1
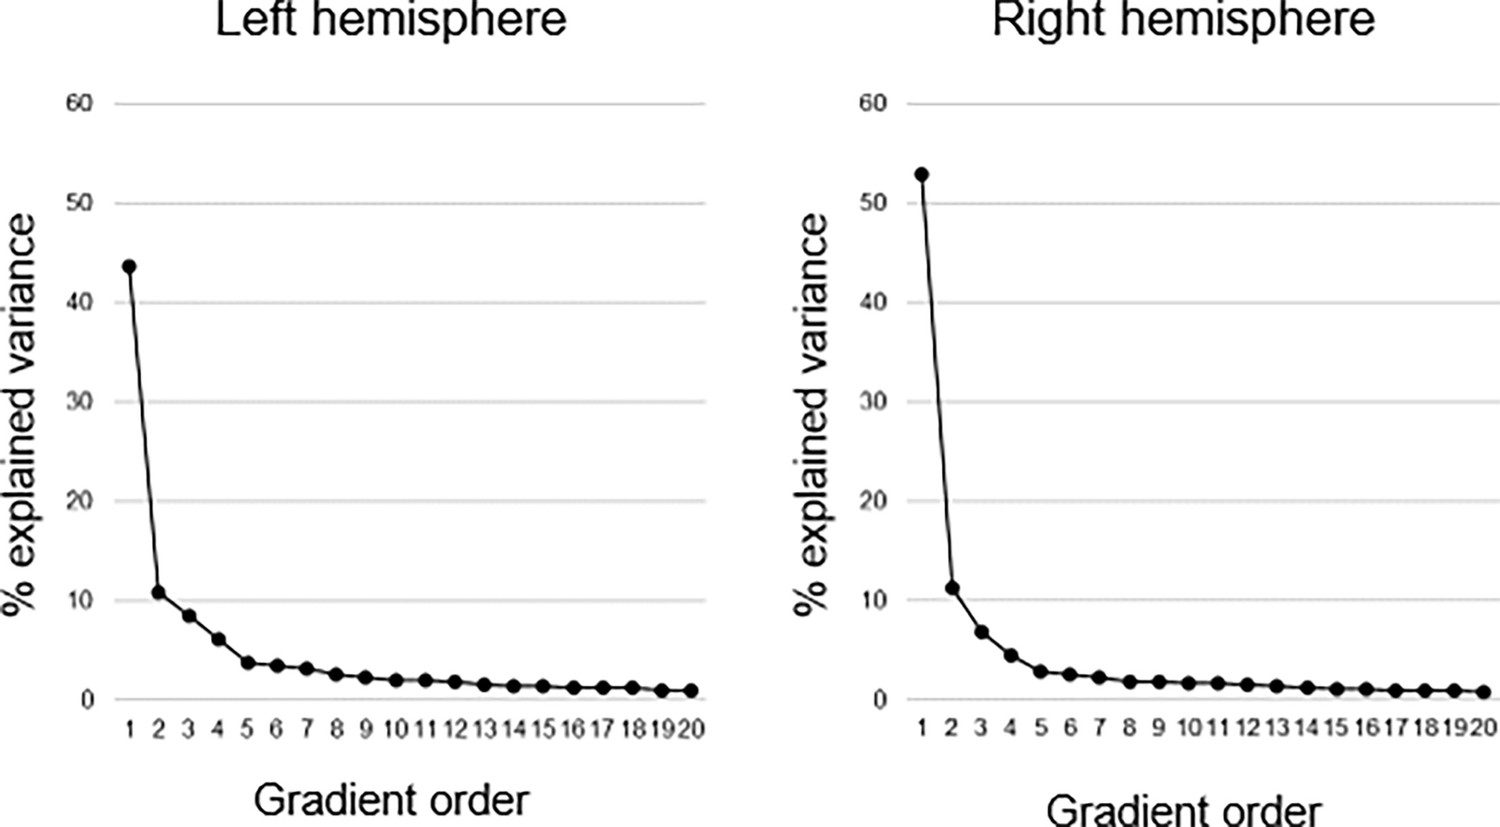
Explained variance of gradients.
Connectopic mapping was used to compute 20 hippocampal gradients in each hemisphere on group level across the sample. The first-order gradient explained 44% and 53% of the variance in left and right hemispheres, respectively. The second-order gradient explained 11% in both hemispheres, and the third-order gradient 8% and 7% in left and right hemispheres, respectively.
Appendix 1—figure 2
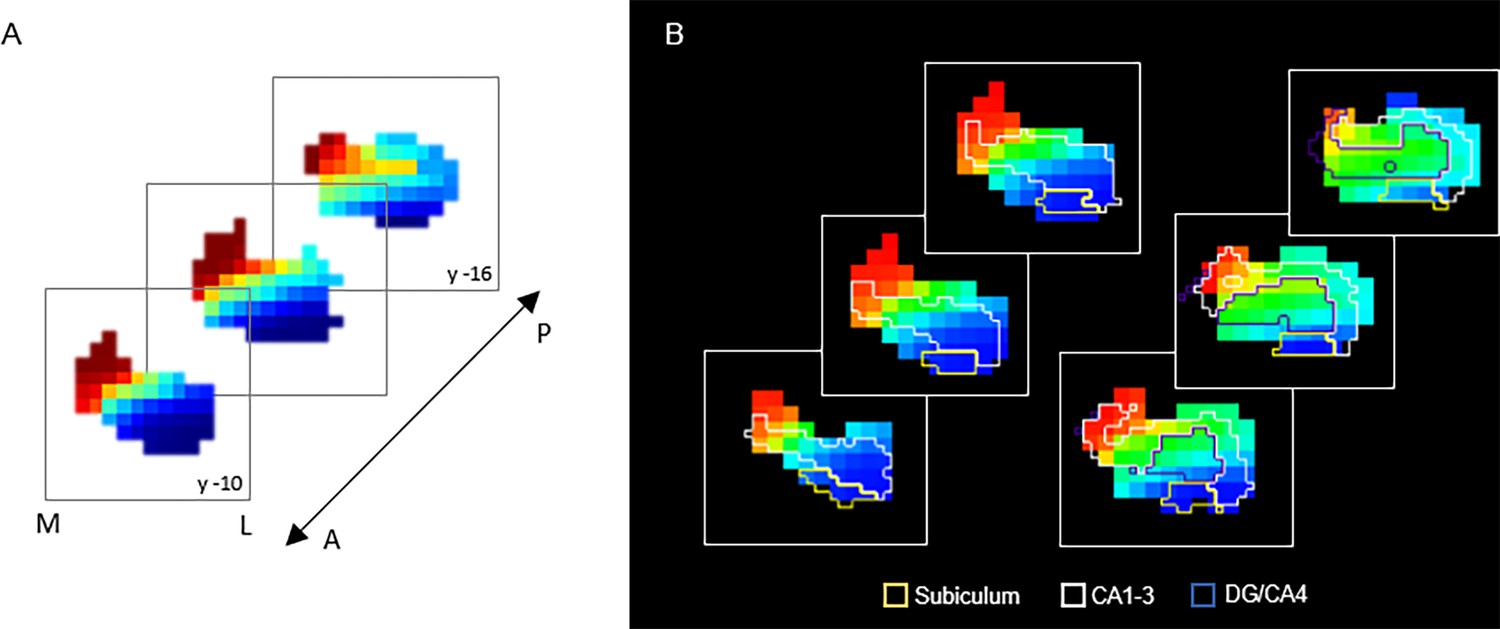
G3 in relation to hippocampal subfields.
(A) Coronal view of the third-order connectopic map, G3, within the anterior hippocampus, where medial-lateral variation was most evident. (B) Hippocampal subfields are displayed as contours: subiculum (yellow), CA1–3 (white), DG/CA4 (blue).
Appendix 1—figure 3
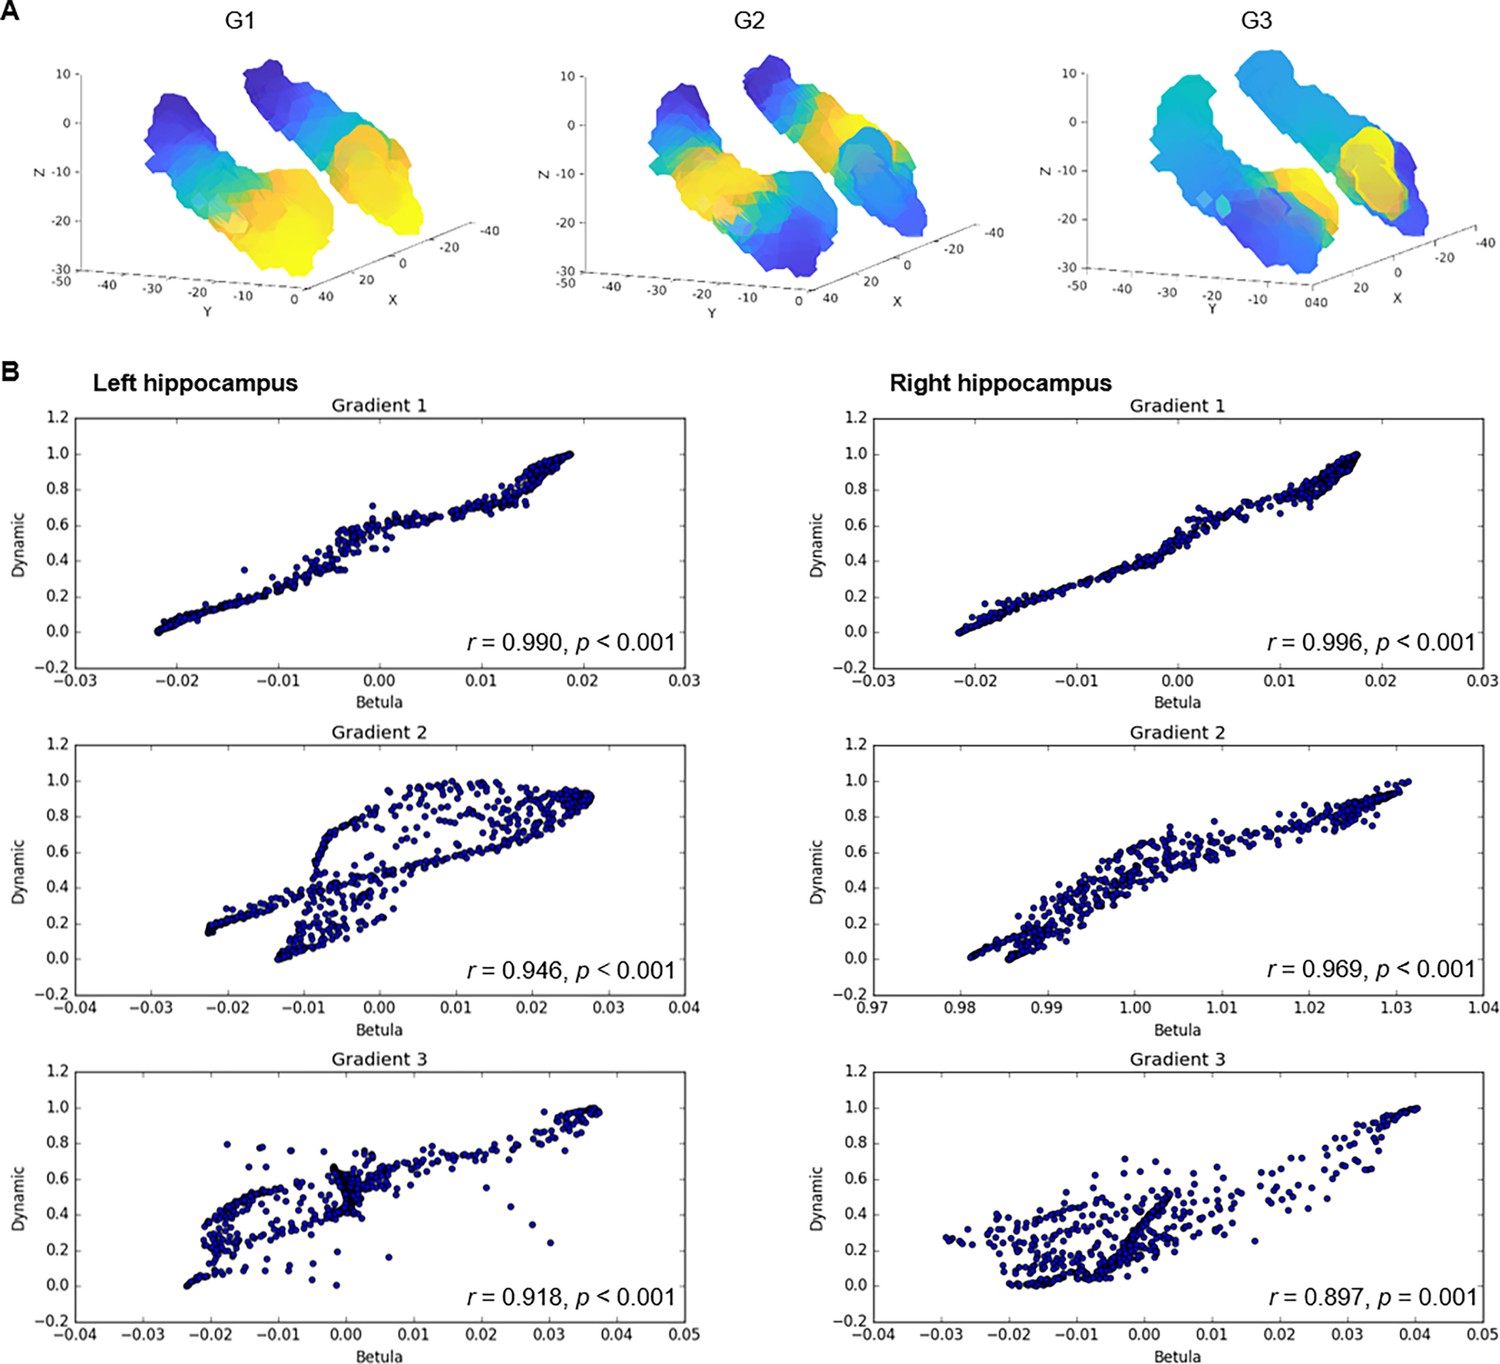
Connectopic mapping in an independent dataset.
(A) Gradients of hippocampal cortical connectivity were replicated in an independent sample of 224 adults (122 men/102 women; 29–85 years, mean age = 65.0 ± 13.0) from the Betula project (Nilsson et al., 2004; Nyberg et al., 2020), such that a principal anterior-posterior gradient (G1) was followed by a second-order middle-to-anterior/posterior gradient (G2) and a third-order inferior-lateral to medial gradient (G3). (B) Voxel-wise correlations between gradients in the Dynamic and Betula datasets.
Appendix 1—figure 4
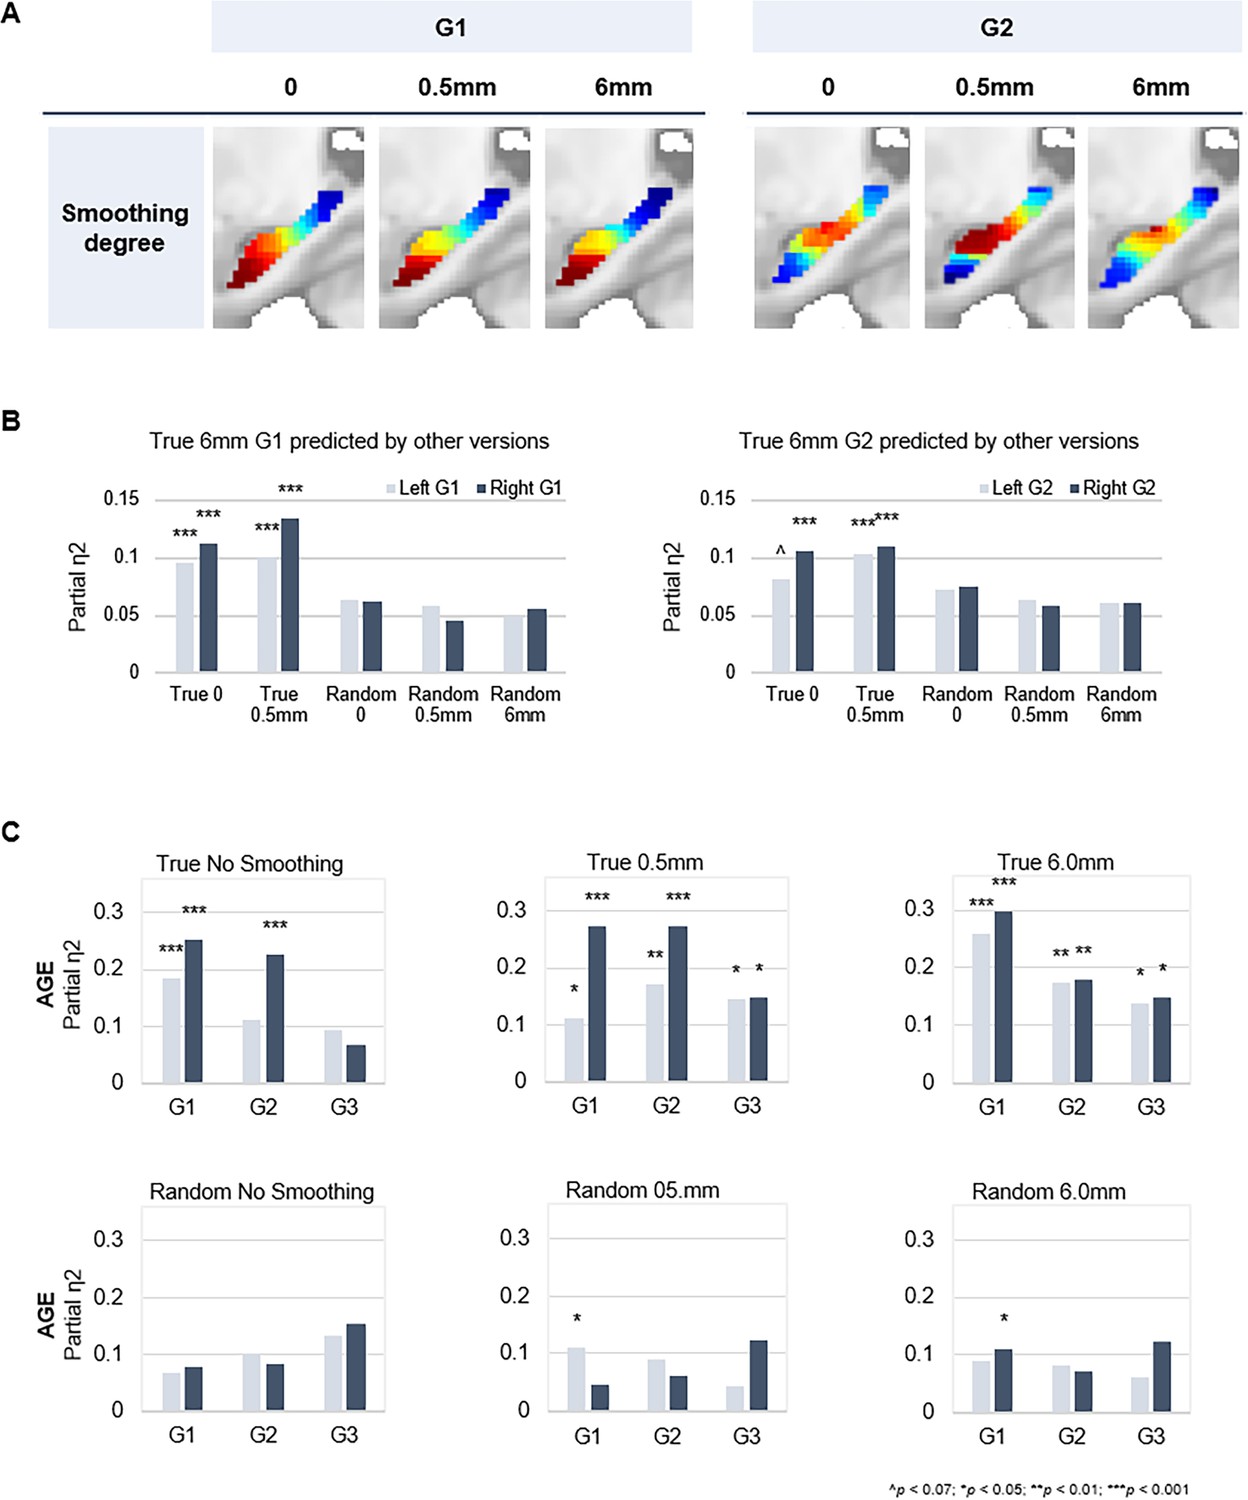
Connectopic mapping on true and random data at varying levels of spatial smoothing.
(A) G1 (left panel) and G2 (right panel) connectopic maps derived from resting-state functional magnetic resonance imaging (fMRI) data after different degrees of spatial smoothing. (B) Bars represent effect sizes from multivariate GLMs with trend surface modeling (TSM) parameters of the G1 (left) and G2 (right) connectopic maps derived from 6.0 mm smoothed data (presented in the main text) as dependent variables, predicted by TSM parameters of connectopic maps based on (i) true data not smoothed; (ii) true 0.5 mm smoothed data; (iii) random data not smoothed; (iv) random 0.5 mm smoothed data; (v) random 6.0 mm smoothed data. (C) Effects of age on the topographic characteristics of gradients (i.e. TSM parameters) for true and random versions across levels of spatial smoothing.
Appendix 1—figure 5
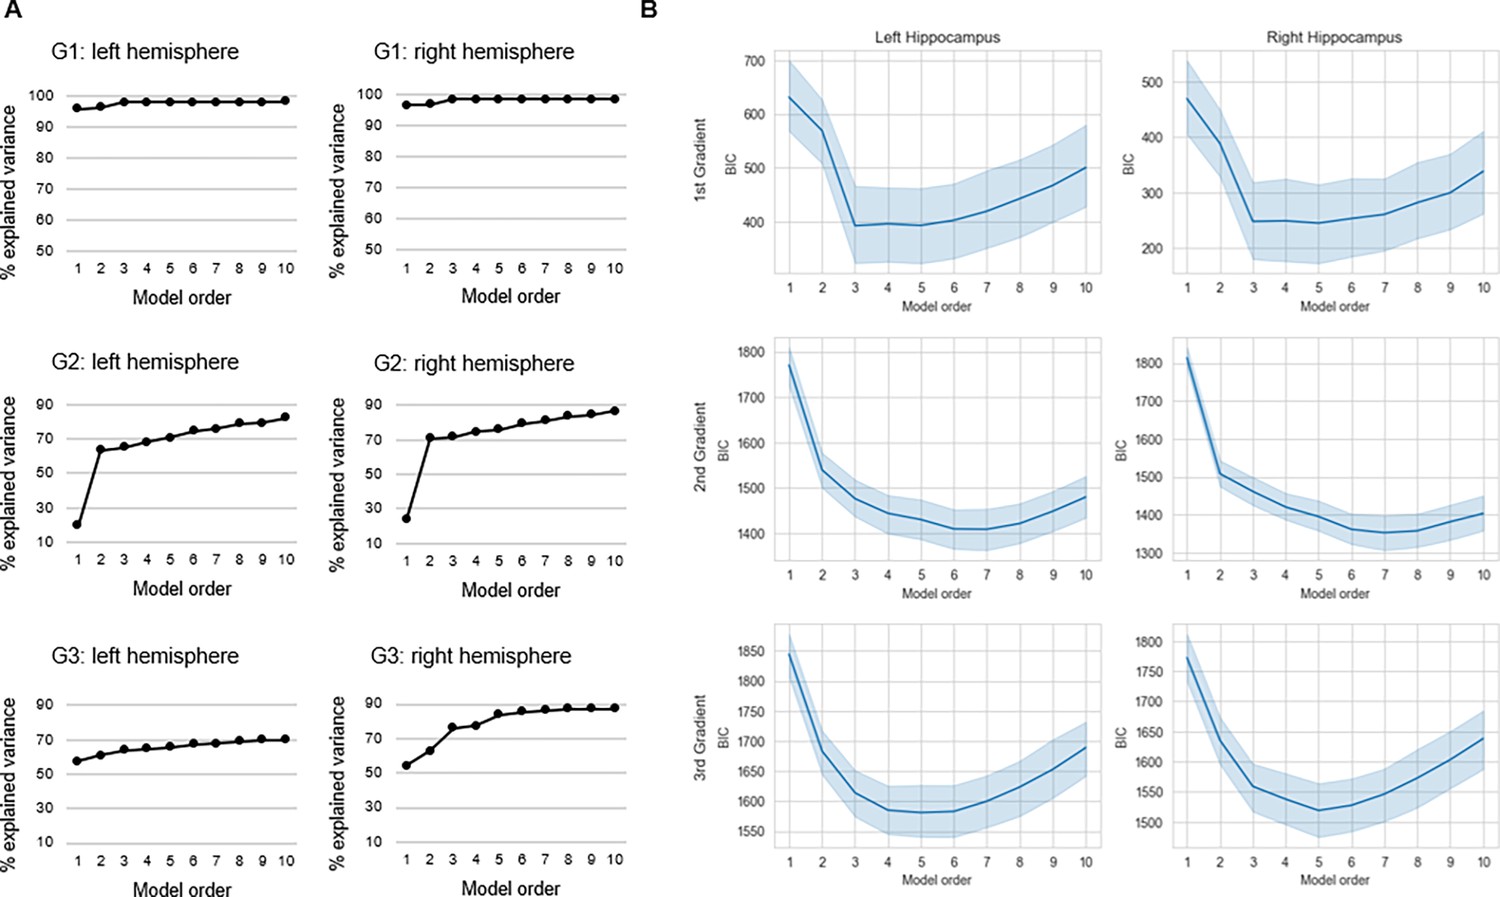
Selection of trend surface modeling (TSM) order.
(A) The % explained variance in group-level connectopic maps by TSMs. (B) Average values of the Bayesian information criterion (BIC) across participants are plotted against TSM orders. Shaded areas represent the 95% confidence interval.
Appendix 1—figure 6
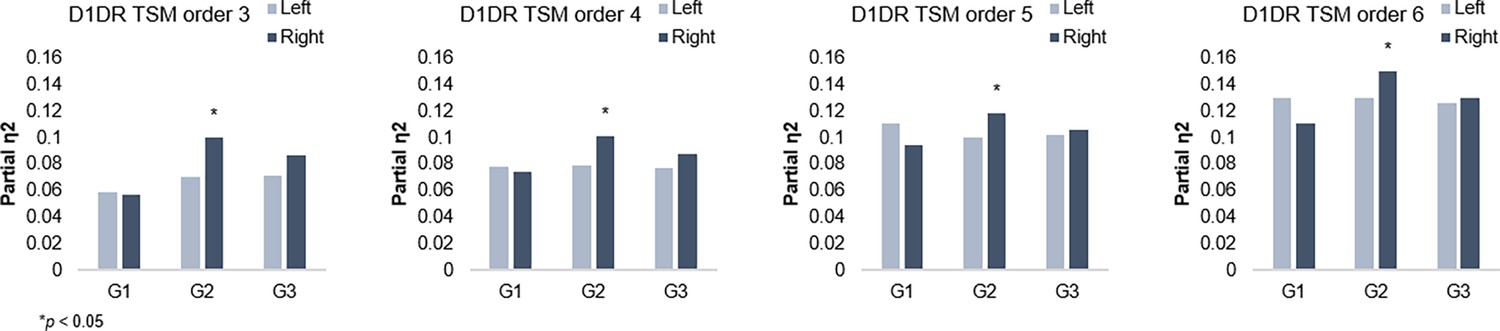
G2 and dopamine D1 receptor distribution.
Individual differences in D1DR topography predict G2 topography in the right hemisphere across trend surface modeling (TSM) orders.
Appendix 1—figure 7
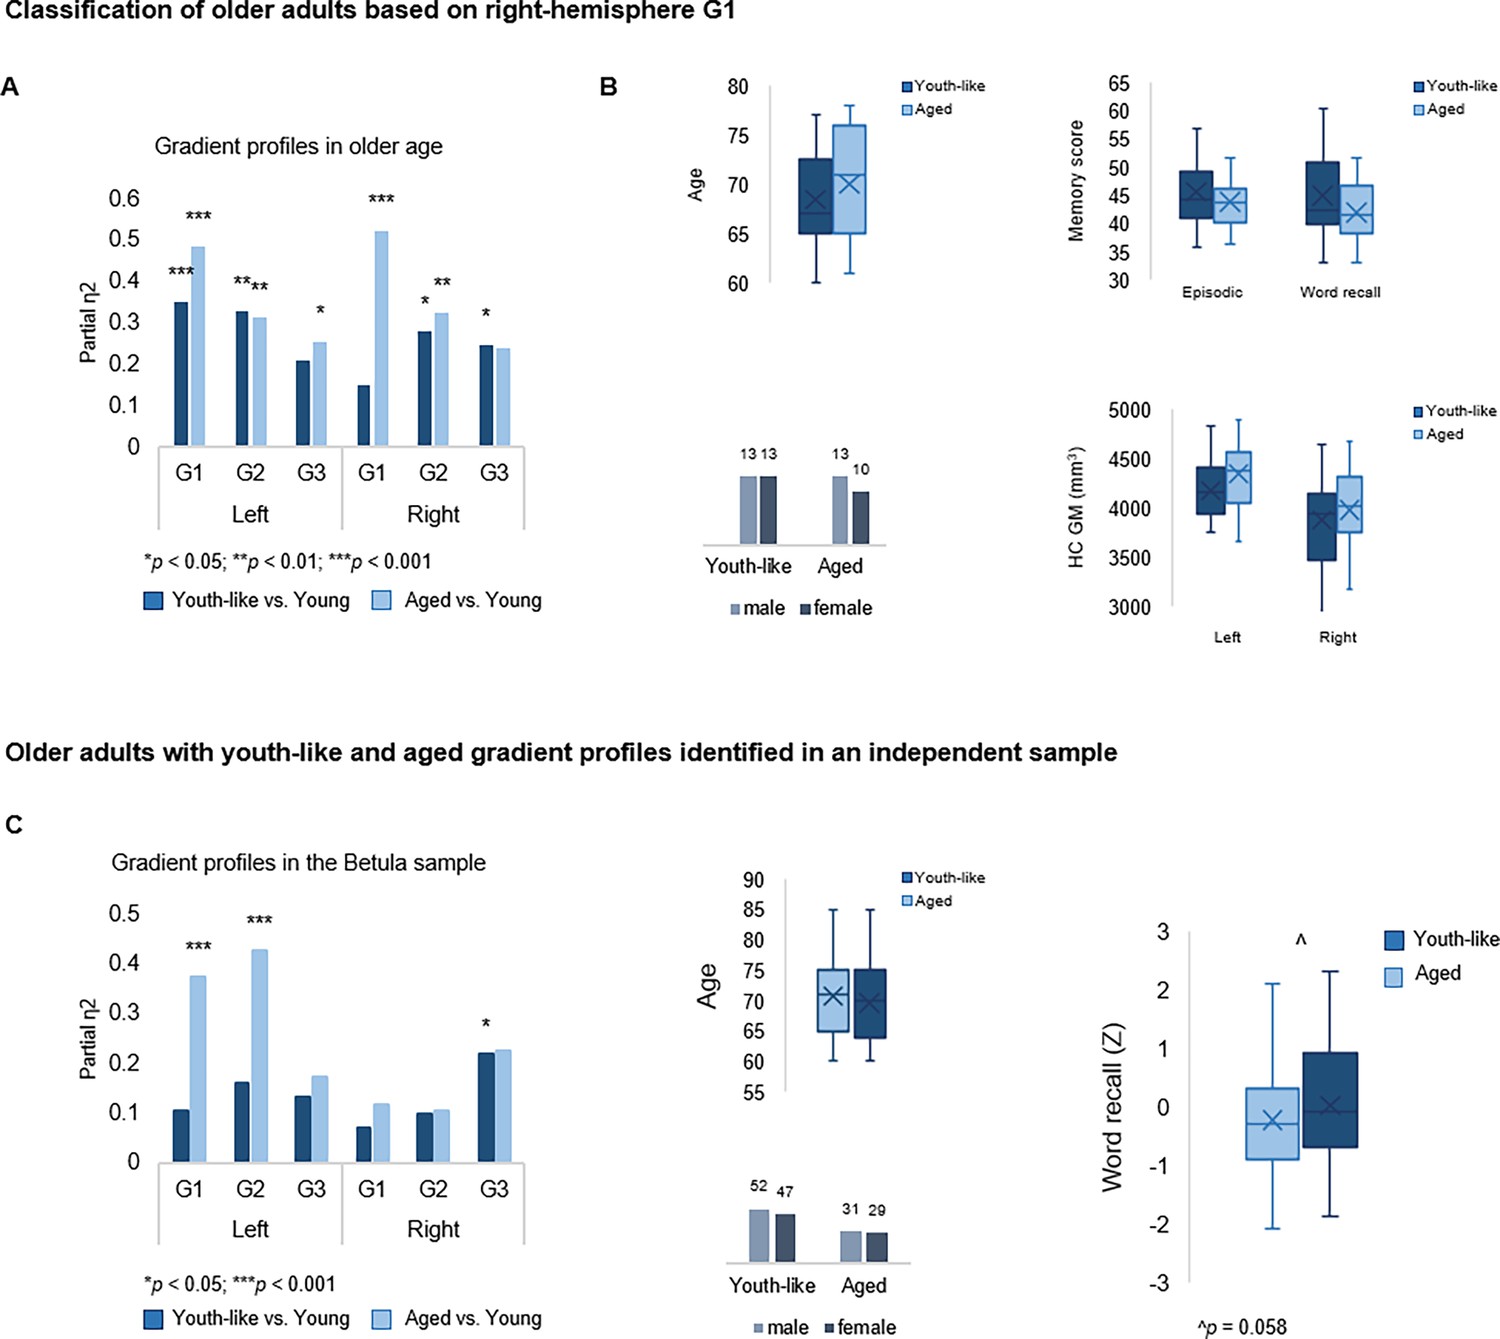
Classification of older adults based on gradient topography.
(A) Classification of older adults in DopamiNe, Age, connectoMe, and Cognition (DyNAMiC) based on right-hemisphere G1 parameters. The first group (n=23) displayed right G1 characteristics significantly different from those in young adults, whereas the second group (n=26) displayed right G1 characteristics more similar to those in young adults. (B) Older subgroups were comparable in terms of age, sex, hippocampal gray matter (GM) volume, and memory performance. (C) Classification of older adults in the independent sample, Betula, based on left-hemisphere G1. A subgroup with a youth-like G1 displayed higher episodic memory performance.
Tables
Appendix 1—table 1
Gradient topography as a predictor of episodic memory performance.
| Full sample | Young (20–40 years) | Middle-aged (40–60 years) | Older (60–79 years) | |||||
|---|---|---|---|---|---|---|---|---|
| ΔR2 | F | ΔR2 | F | ΔR2 | F | ΔR2 | F | |
| Model 1* | 0.287 | 20.92*** | 0.003 | 0.058 | 0.131 | 2.567^ | 0.163 | 2.915* |
| Left HC | ||||||||
| G1 | 0.029 | 0.695 | 0.357 | 2.672* | 0.076 | 0.450 | 0.156 | 0.916 |
| G2 | 0.096 | 1.842* | 0.191 | 1.098 | 0.264 | 1.246 | 0.215 | 0.921 |
| G3 | 0.027 | 0.502 | 0.236 | 1.755 | 0.261 | 1.462 | 0.256 | 1.219 |
| Right HC | ||||||||
| G1 | 0.026 | 0.621 | 0.150 | 0.810 | 0.128 | 0.804 | 0.169 | 0.987 |
| G2 | 0.056 | 1.013 | 0.328 | 1.542 | 0.221 | 1.066 | 0.151 | 0.566 |
| G3 | 0.036 | 0.633 | 0.120 | 0.432 | 0.288 | 1.865 | 0.276 | 1.070 |
-
*
M1=age, sex, mean frame-wise displacement; ^p<0.07; *p<0.05; **p<0.01; ***p<0.001.
Additional files
Download links
A two-part list of links to download the article, or parts of the article, in various formats.
Downloads (link to download the article as PDF)
Open citations (links to open the citations from this article in various online reference manager services)
Cite this article (links to download the citations from this article in formats compatible with various reference manager tools)
Two long-axis dimensions of hippocampal-cortical integration support memory function across the adult lifespan
eLife 13:RP97658.
https://doi.org/10.7554/eLife.97658.3


