T-follicular helper cells are epigenetically poised to transdifferentiate into T-regulatory type 1 cells
- Institut D’Investigacions Biomèdiques August Pi i Sunyer, Spain
- Department of Microbiology, Immunology and Infectious Diseases, Snyder Institute for Chronic Diseases, Cumming School of Medicine, University of Calgary, Canada
Figures
Figure 1 with 1 supplement
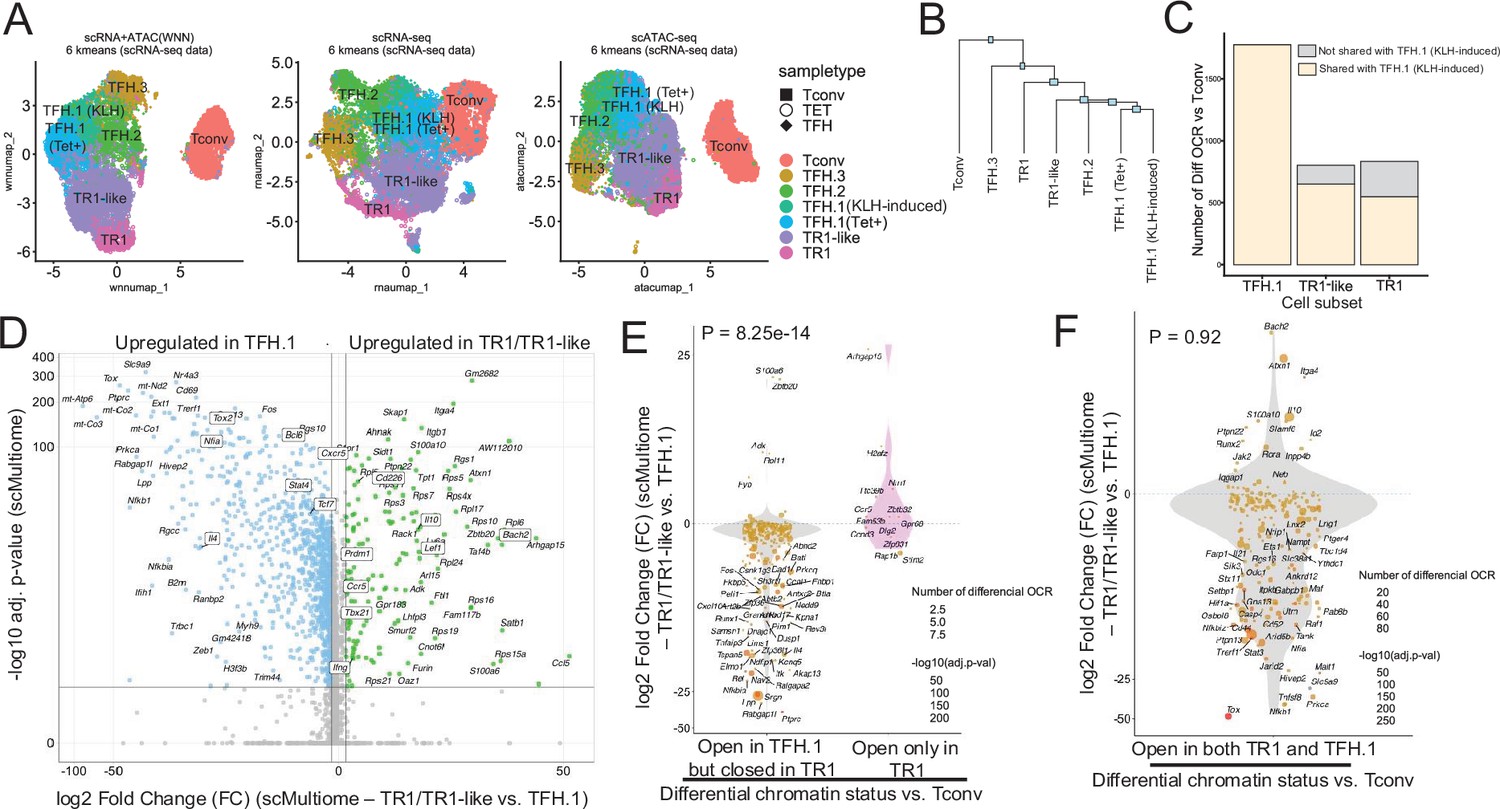
The TFH-to-TR1 conversion is associated with massive closure of previously open chromatin regions (OCRs) and gene silencing.
BDC2.5mi/I-Ag7-NP-induced Tet+ (TET); KLH-DNP-induced TFH (TFH), and Tconv cells (Tconv) from female nonobese diabetic (NOD) mice (n=4, 8, and 1 mice, respectively) were sorted and processed for 10X GEX+ATAC multiome. (A) Left: multidimensional analysis of scRNAseq and ATACseq data using weighted nearest neighbor (WNN). Cell-type prediction is based on K-means clusterization and predicted cell subtype classification of scRNAseq data. Middle and right: scRNAseq (middle) and scATACseq (assay for transposable-accessible chromatin using sequencing) (right) UMAP (Uniform Manifold Approximation and Projection) plots with K-means clusterization and predicted cell subtype classification based on scRNAseq data. The legends’ colors correspond to different T-cell types and the legends’ shape correspond to sample type. (B) Hierarchical clustering of multiome data based on Euclidean distance of all the clusters found in all sample types. (C) Bar plot with the number of differentially OCRs in TFH.1 (including Tet+ TFH.1 and KLH-DNP-induced TFH.1 cells), TR1/TR1-like cells, as compared to Tconv cells (adjusted p<0.05). Color depicts the proportion of OCRs that are shared with KLH-DNP-induced TFH.1 (vs. Tconv cells) (yellow) or that appear de novo in TR1/TR1-like cells (gray). (D) Volcano plot of Wilcox differential analysis of scRNAseq data from the multiome dataset comparing TFH.1 and TR1/TR1-like cells. Not overlapping dots were labeled. Genes mentioned in the text are boxed. (E–F) Jitter plots depicting log2FC in gene expression between TR1/TR1-like and TFH.1 cells as measured by scRNAseq (adjusted p<0.05) for genes associated with OCRs found in TFH.1 cells (left; closed in TR1/TR1-like cells) or TR1/TR1-like (right; closed in TFH.1 cells) (E), or in both TFH.1 and TR1/TR1-like cells (F) as measured by scATACseq (adjusted p<0.05). Dot (gene) colors define the -log10 (adjusted p) for RNA expression of Wilcox test; dot sizes are proportional to the number of differential OCRs associated with each gene. All genes are labeled except when overlapping. Chromatin closure by TR1 cells was significantly associated with gene downregulation as determined via Chi-square test. TFH, T-follicular helper; TR1, T-regulatory type 1; KLH, keyhole limpet hemocyanin.
Figure 1—figure supplement 1
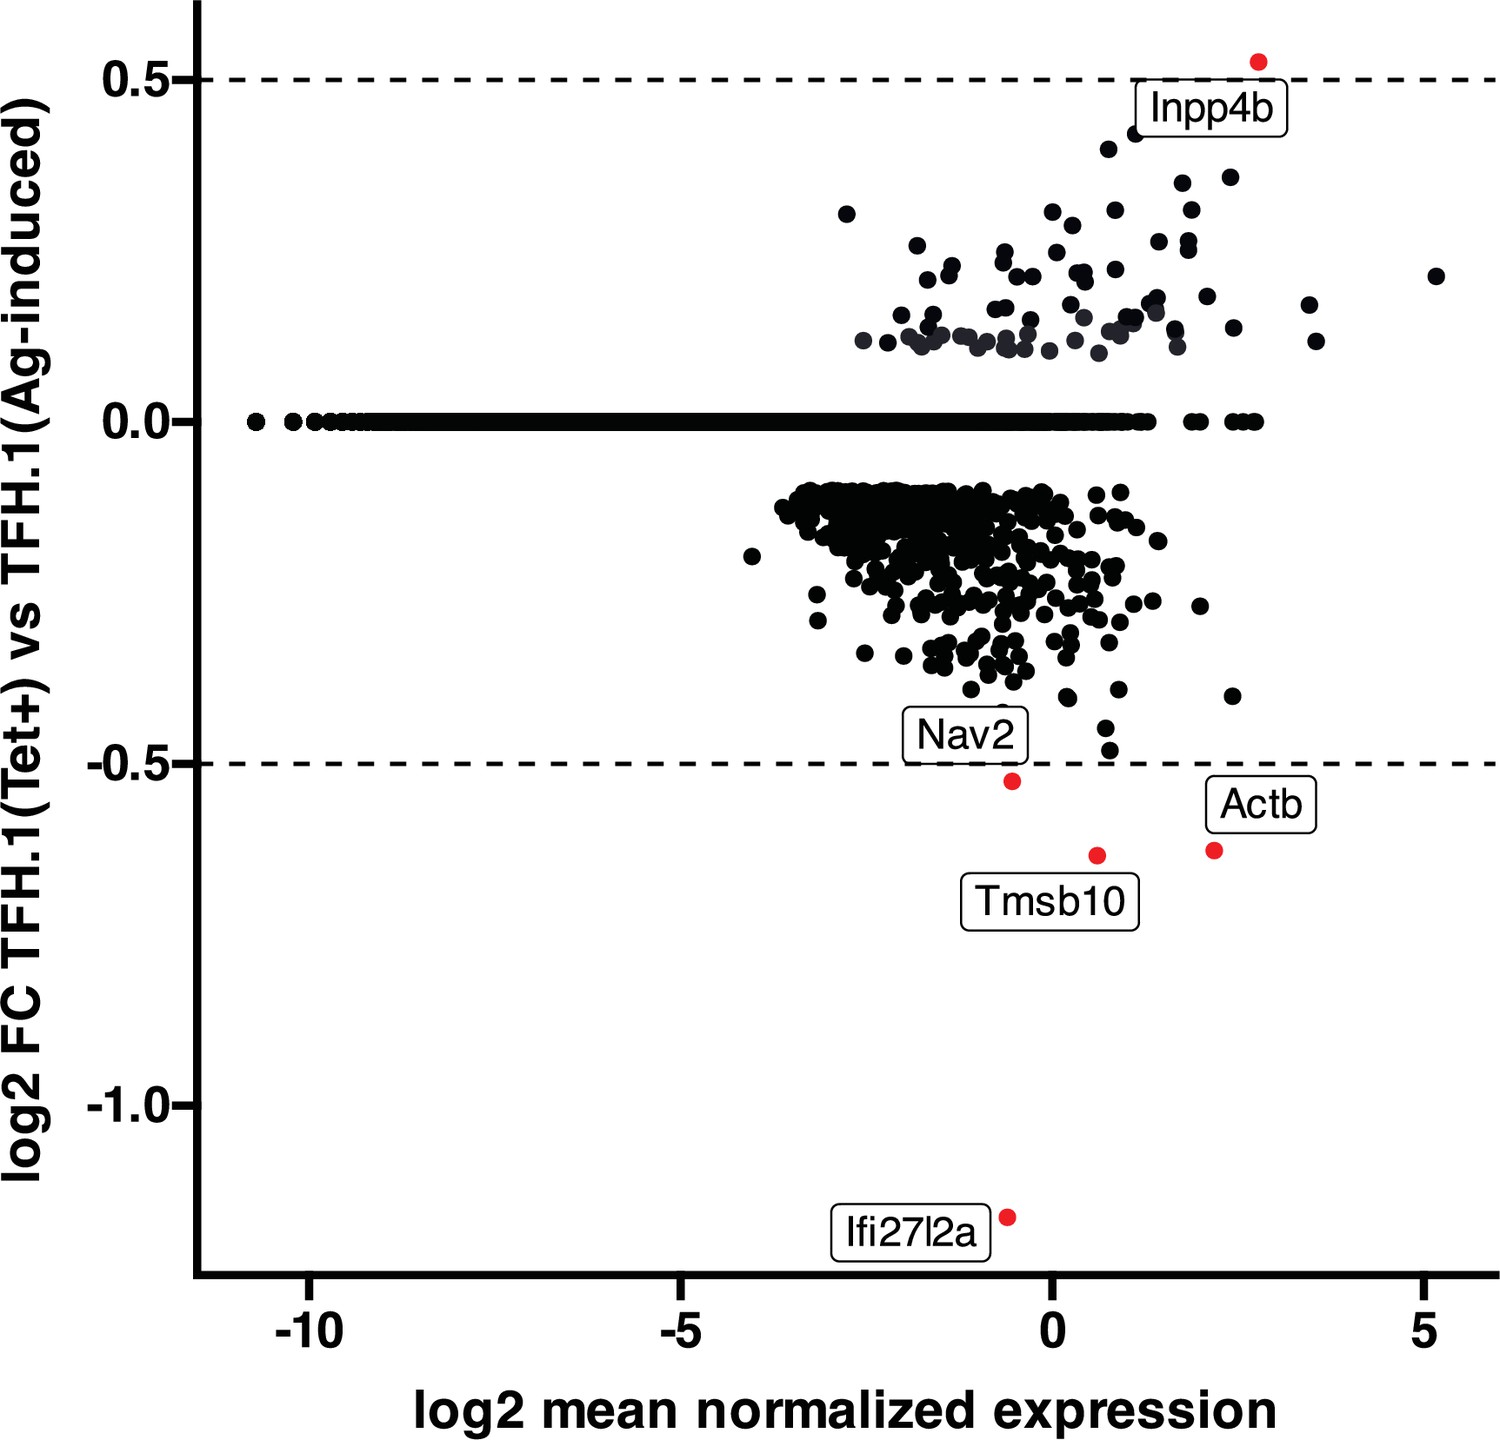
High transcriptional similarity between pMHCII-NP- and vaccine-induced TFH.1 cells.
Figure corresponds to an MA plot comparing the transcriptome of the TFH.1 cells from the KLH-induced TFH cell pool and the TFH-like cells contained within the BDC2.5mi/I-Ag7-NP-induced Tet + pool. There were only five differentially expressed genes (|log2FC|>0.5 and adjusted p<0.05; Actb, Ifi27l2a, Inpp4b, Nav2, and Tmsb10) between these two subsets. NP, nanoparticle; pMHCII, peptide-major histocompatibility complex class II; TFH, T-follicular helper; KLH, keyhole limpet hemocyanin.
Figure 2
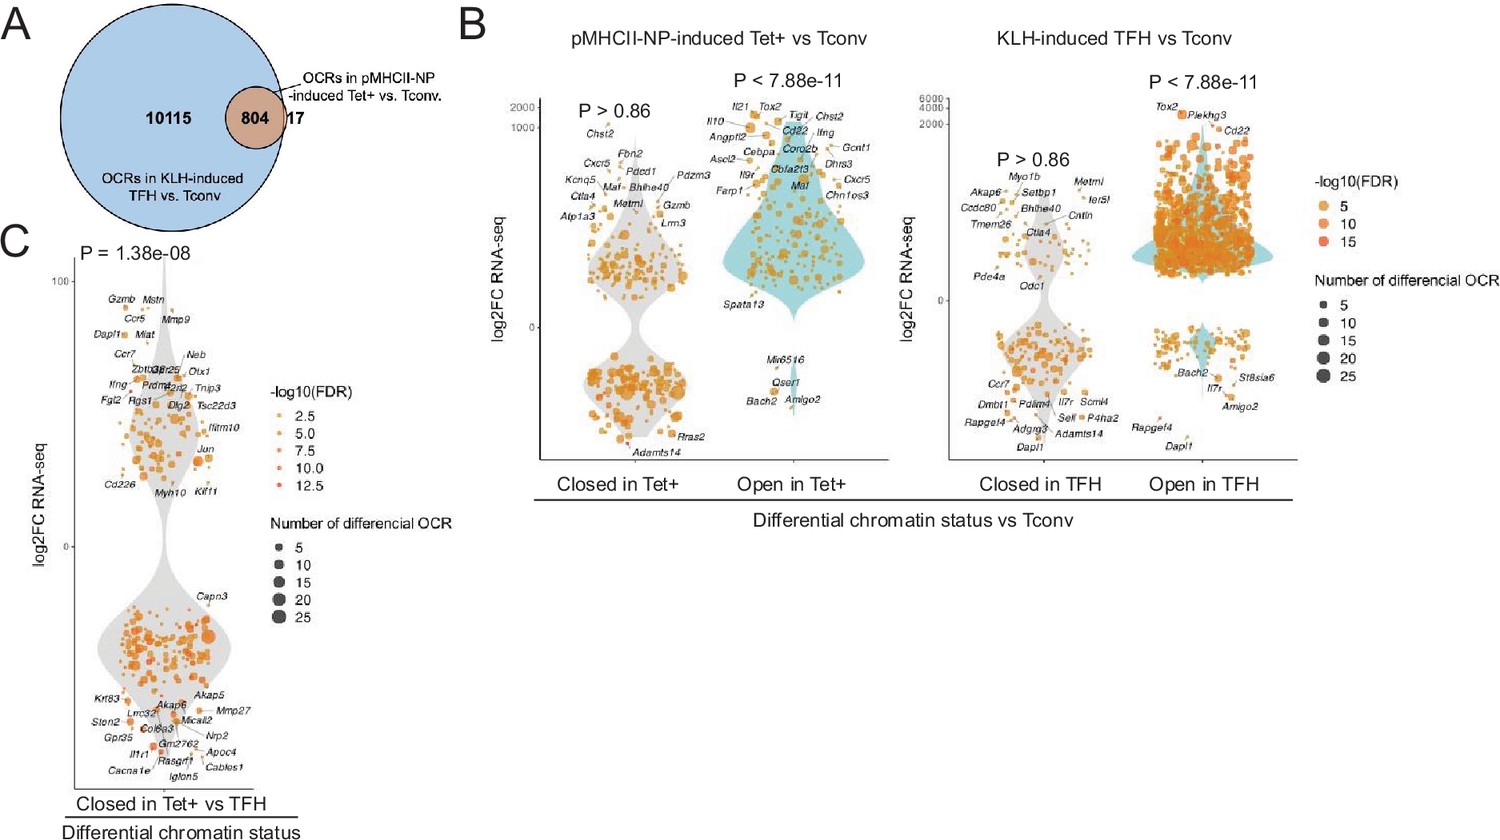
Chromatin accessibility in BDC2.5mi/I-Ag7-NP-induced Tet+ and KLH-DNP-induced T-follicular helper (TFH) cells vs. gene expression.
(A) Euler’s plot comparing the number and sharing of differential open chromatin regions (OCRs) between BDC2.5mi/I-Ag7-NP-induced Tet+ and KLH-induced TFH cells relative to their Tconv counterparts (n=4, 3, and 3, respectively) (adjusted p<0.01). (B) Associations between the number and status of differentially open or closed chromatin sites and gene expression as measured via bulk ATACseq (adjusted p<0.01) and RNAseq (adjusted p<0.01 and |log2FC|>2), respectively. Data correspond, from left to right, to BDC2.5mi/I-Ag7-NP-induced Tet+ vs. Tconv and KLH-induced TFH vs. Tconv. Each dot represents a gene, and its size is proportional to the number of associated OCRs. Dot color represents RNAseq differential analysis’ -log10 of false discovery rate (FDR). Only genes with the highest log2FC value in each condition were labeled. (C) Associations between the status of chromatin accessibility in BDC2.5mi/I-Ag7-NP-induced Tet+ vs. KLH-induced TFH cells and gene expression as measured via bulk ATACseq (adjusted p<0.01) and RNAseq (adjusted p<0.01 and. |log2FC|>2), respectively. Each dot represents a gene, and its size is proportional to the number of associated OCRs. Dot color represents RNAseq differential analysis’ -log10 of FDR. Only genes with the highest log2FC value in each condition were labeled. p-Values in (B) and (C) were calculated using Chi-square. KLH, keyhole limpet hemocyanin.
-
Figure 2—source data 1
Differential chromatin accessibility results by bulk ATAC-seq in pMHCII-NP-induced Tet+ cells and KLH-induced TFH cells, as compared to Tconv controls.
- https://cdn.elifesciences.org/articles/97665/elife-97665-fig2-data1-v1.xlsx
-
Figure 2—source data 2
Number of differentially open chromatin regions (OCRs) and their associated genes in pMHCII-NP-induced Tet+ and KLH-induced TFH cells, compared to Tconv controls.
Also includes the count of differentially expressed genes and those overlapping with genes linked to differentially accessible regions in these cell types.
- https://cdn.elifesciences.org/articles/97665/elife-97665-fig2-data2-v1.xlsx
Figure 3 with 1 supplement
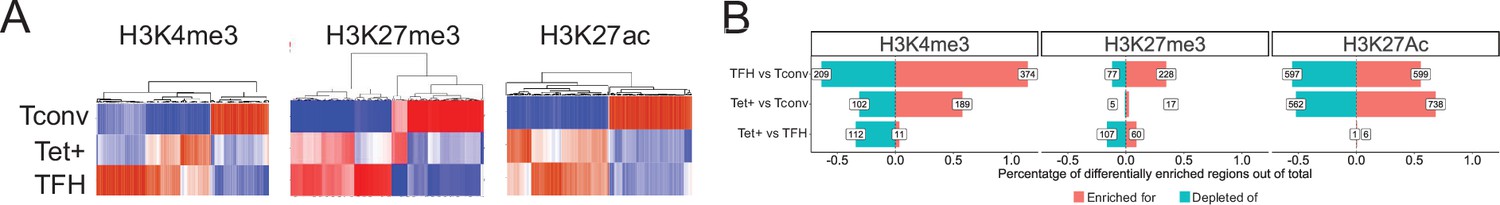
Genome-wide distribution of H3K4me3, H3K27me3, and H3K27ac marks and active enhancers in BDC2.5mi/I-Ag7-NP-induced Tet+ cells and KLH-DNP-induced T-follicular helper (TFH) cells vs. differential gene expression.
(A) Clustering heatmaps of all the regions enriched for H3K4me3 (left), H3K27me3 (middle), and H3K27Ac (right) deposition in BDC2.5mi/I-Ag7-NP-induced Tet+ cells, KLH-DNP-induced TFH cells, and Tconv cells. The intensity of the red color is proportional to the magnitude of enrichment vs. the corresponding background. (B) Bar plot comparing the relative percentages (X-axis) and absolute numbers (number annotations in each bar) of differentially marked regions for each histone modification (false discovery rate [FDR]<0.01). Top, middle, and bottom rows correspond to KLH-DNP-induced TFH vs. Tconv, BDC2.5mi/I-Ag7-NP-induced Tet+ vs. Tconv, and BDC2.5mi/I-Ag7-NP-induced Tet+ vs. KLH-DNP-induced TFH comparisons, respectively. KLH, keyhole limpet hemocyanin; NP, nanoparticle.
-
Figure 3—source data 1
Detected peaks for either H3K27Ac, H3K4me3, and H3k27me3 histone depositions, in pMHCII-NP-induced Tet+, KLH-induced TFH cells, and Tconv cells.
- https://cdn.elifesciences.org/articles/97665/elife-97665-fig3-data1-v1.xlsx
-
Figure 3—source data 2
Pairwise differential enrichment analysis of chromatin regions marked by H3K27Ac, H3K4me3, or H3K27me3 histone modifications, comparing pMHCII-NP-induced Tet+, KLH-induced TFH, and Tconv cells.
- https://cdn.elifesciences.org/articles/97665/elife-97665-fig3-data2-v1.xlsx
-
Figure 3—source data 3
Categorization of differential histone deposition associated genes in pMHCII-NP-induced Tet+ and KLH-induced TFH cells, as compared to Tconv, for either H3K27Ac, H3K4me3, or H3K27me3 histone modifications.
Only genes associated with OCR shared by TFH and TR1 at the single-cell level are included.
- https://cdn.elifesciences.org/articles/97665/elife-97665-fig3-data3-v1.xlsx
Figure 3—figure supplement 1
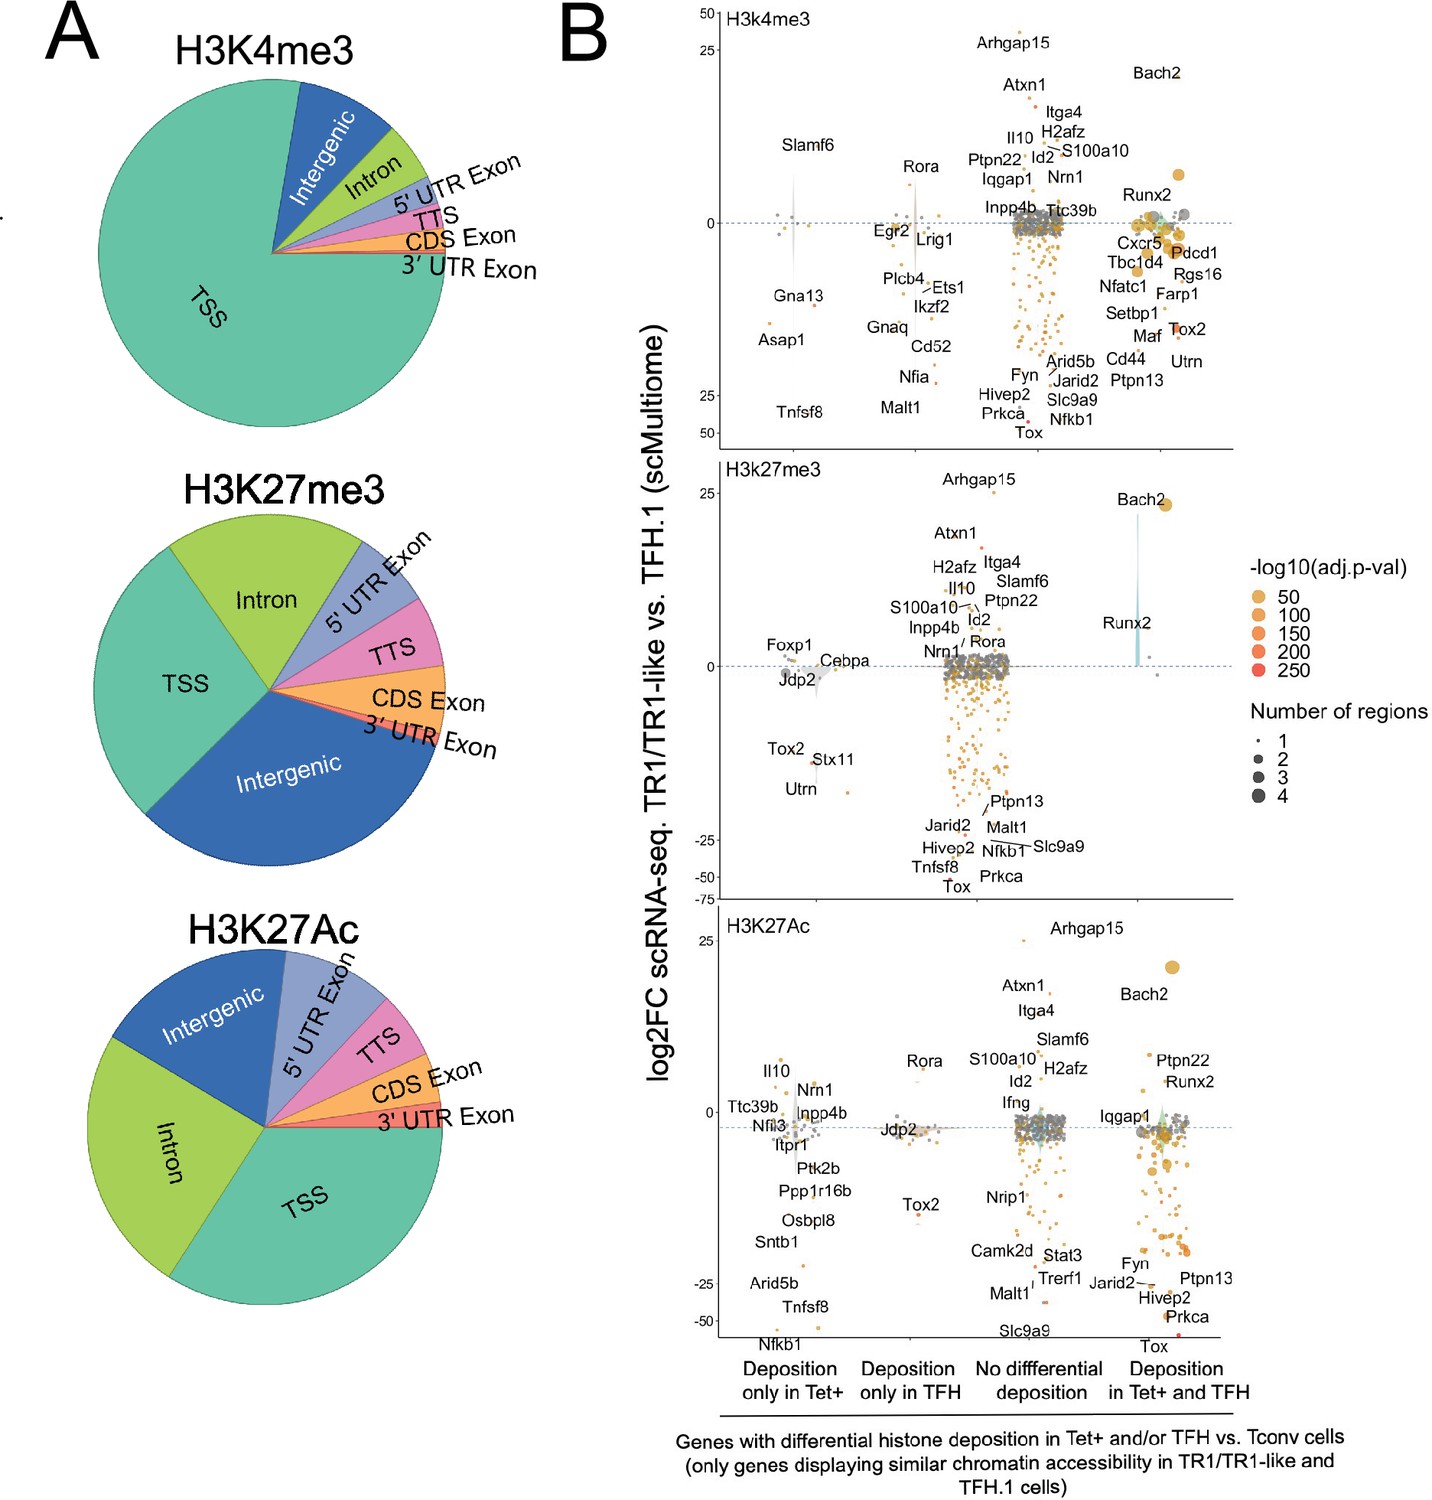
Differential gene deposition of H3K4me3, H3K27me3, and H3K27ac marks in BDC2.5mi/I-Ag7-NP-induced Tet+ cells, KLH-DNP-induced T-follicular helper (TFH) cells, and Tconv cells vs. differential gene expression.
(A) Pie charts showing the relative distribution of H3K4me3 (top), H3K27me3 (middle), and H3K27Ac (bottom) marks in different gene regions. (B) Jitter plots comparing differences in gene expression between BDC2.5mi/I-Ag7-NP-induced TR1/TR1-like and TFH.1 cells (log2 fold change between the two cell clusters in the single-cell Multiome [scMultiome] dataset) for genes linked to open chromatin regions (OCRs) shared between BDC2.5mi/I-Ag7-NP-induced Tet+ and KLH-DNP-induced TFH cells, as a function of shared or differential H3K4me3 (top), H3K27me3 (middle), and H3K27Ac (bottom) deposition status (false discovery rate [FDR]<0.01). Gene expression was not associated with differential histone deposition in any case (Wilcox test for differential gene expression: adjusted p<0.05): H3K4me3: Pearson’s Chi-square test p=0.53; H3K27me3: Fisher exact test p=1; H3K27Ac: Pearson’s Chi-square test p=0.23. Color depicts the -log10(adjusted p-value) of scRNAseq analysis. Bubble size corresponds to the number of marked regions annotated to specific genes. Most differentially expressed and TR1/TR1-like and TFH-relevant genes included in the 106 genes list from Supplementary file 1 are labeled. KLH, keyhole limpet hemocyanin; NP, nanoparticle.
Figure 4 with 5 supplements
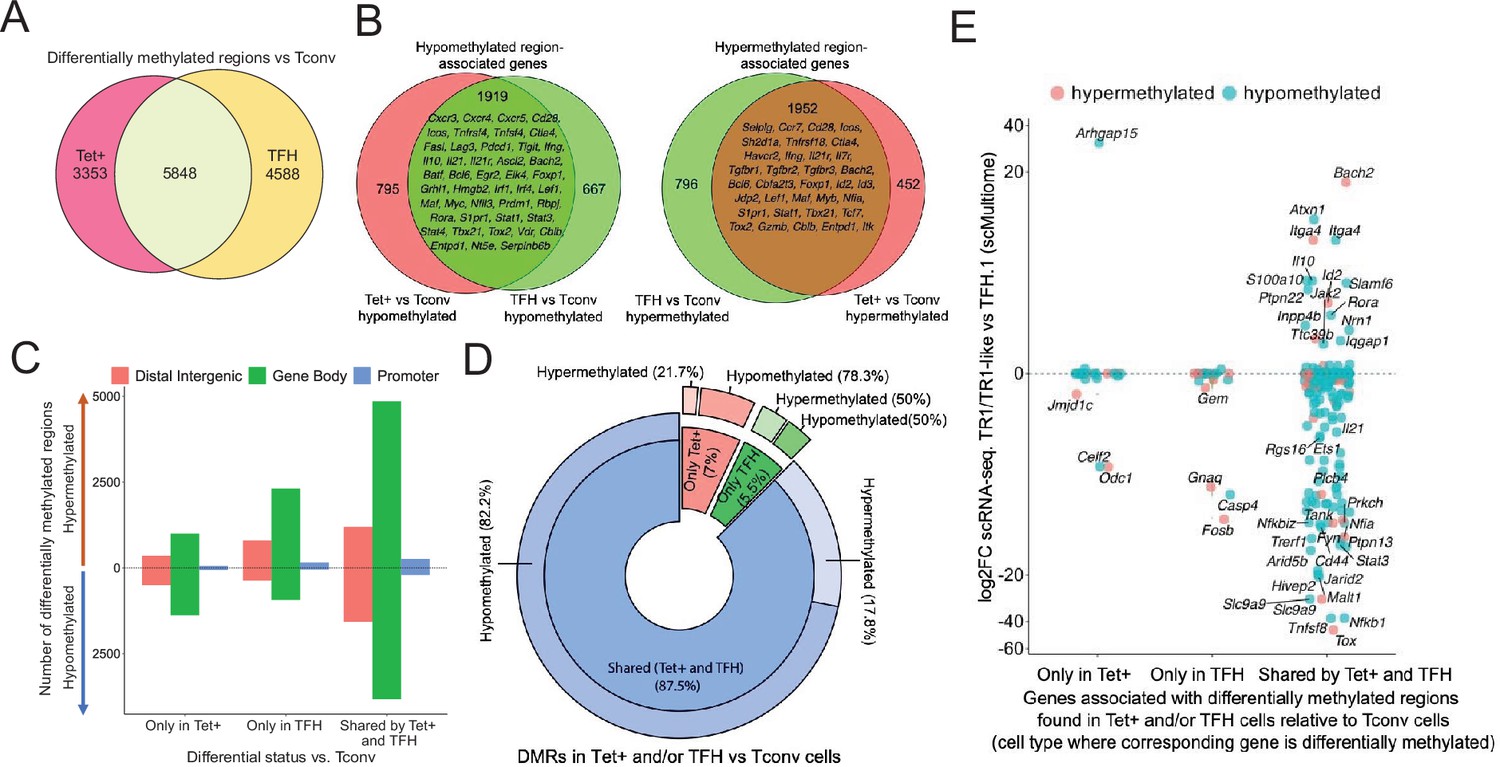
Gene methylation status in BDC2.5mi/I-Ag7-NP-induced Tet+, KLH-DNP-induced T-follicular helper (TFH), and Tconv cells.
(A) Venn diagram of differentially methylated regions (DMRs) in BDC2.5mi/I-Ag7-NP-induced Tet+ and KLH-DNP-induced TFH vs. Tconv cells. (B) Venn diagrams of differentially hypomethylated (left) or hypermethylated (right) regions shared by BDC2.5mi/I-Ag7-NP-induced Tet+ cells and KLH-DNP-induced TFH cells as compared to their Tconv counterparts. Gene names found in the 106 TFH/TR1/Treg gene list in Supplementary file 1, with shared methylation status, are indicated. (C) Bar plot showing the numbers of differentially hypo- or hypermethylated regions (separated by gene region: promoter, gene body, or distal intergenic) in BDC2.5mi/I-Ag7-NP-induced Tet+ and KLH-DNP-induced TFH vs. Tconv cells, respectively. DMRs are classified, from left to right, into those only found in BDC2.5mi/I-Ag7-NP-induced Tet+ cells (only Tet), KLH-DNP-induced TFH cells (only TFH), or found in both subsets (shared by tet+ and TFH). (D) Pie-donut chart showing the distribution of DMRs (hyper- and hypomethylated status) in genes associated with open chromatin regions (OCRs) (n=328) shared by TFH.1 and TR1/TR1-like cells (identified via single-cell Multiome [scMultiome]). (E) Jitter plot comparing differential gene expression between TR1/TR1-like and TFH.1 cells (as determined by scMultiome) and differential methylation status, focusing on the genes that remain open at the TR1/TR1-like cell stage, as determined by scMultiome. DMR-associated genes are classified based on their cell pool specificity, i.e., only found in BDC2.5mi/I-Ag7-NP-induced Tet+ cells (only Tet+), KLH-DNP-induced TFH cells (only TFH), or both (shared by Tet+ and TFH). Color depicts the methylation status (hypo- or hypermethylated) of the regions associated with these genes. No significant correlation between methylation status and differential gene expression was found. KLH, keyhole limpet hemocyanin; NP, nanoparticle.
-
Figure 4—source data 1
Pairwise differentially methylated regions (DMR) comparing pMHCII-NP-induced Tet+, KLH-induced TFH, and Tconv cells.
- https://cdn.elifesciences.org/articles/97665/elife-97665-fig4-data1-v1.pdf
-
Figure 4—source data 2
Relative methylation status, chromatin annotation, relevant associated genes, and number of regions differentially methylated between pairwise comparison of pMHCII-NP-induced Tet+, KLH-induced TFH, and Tconv cells.
- https://cdn.elifesciences.org/articles/97665/elife-97665-fig4-data2-v1.xlsx
-
Figure 4—source data 3
Differential methylation status of genes associated with chromatin regions accessible in TFH.1 and TR1 cells as determined by scATAC-seq.
- https://cdn.elifesciences.org/articles/97665/elife-97665-fig4-data3-v1.xlsx
-
Figure 4—source data 4
List of genes associated with chromatin regions remaining open during TFH to TR1 conversion with corresponding data on differential expression, differential methylation, chromatin accessibility, and histone deposition.
- https://cdn.elifesciences.org/articles/97665/elife-97665-fig4-data4-v1.xlsx
Figure 4—figure supplement 1
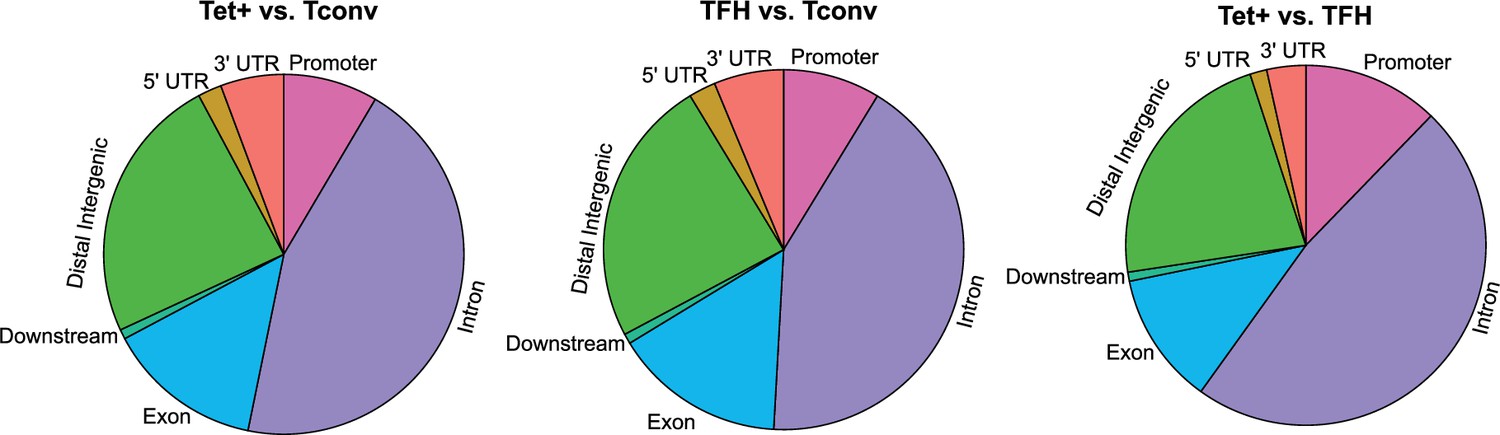
Differences in gene region distribution of differentially methylated regions (DMRs) among BDC2.5mi/I-Ag7-NP-induced Tet+, KLH-DNP-induced T-follicular helper (TFH), and Tconv cells.
Pie charts show the relative distribution of DMRs in BDC2.5mi/I-Ag7-NP-induced Tet+ vs. Tconv (left), KLH-DNP-induced TFH vs. Tconv (middle), and BDC2.5mi/I-Ag7-NP-induced Tet+ vs. KLH-DNP-induced TFH (right). KLH, keyhole limpet hemocyanin; NP, nanoparticle.
Figure 4—figure supplement 2
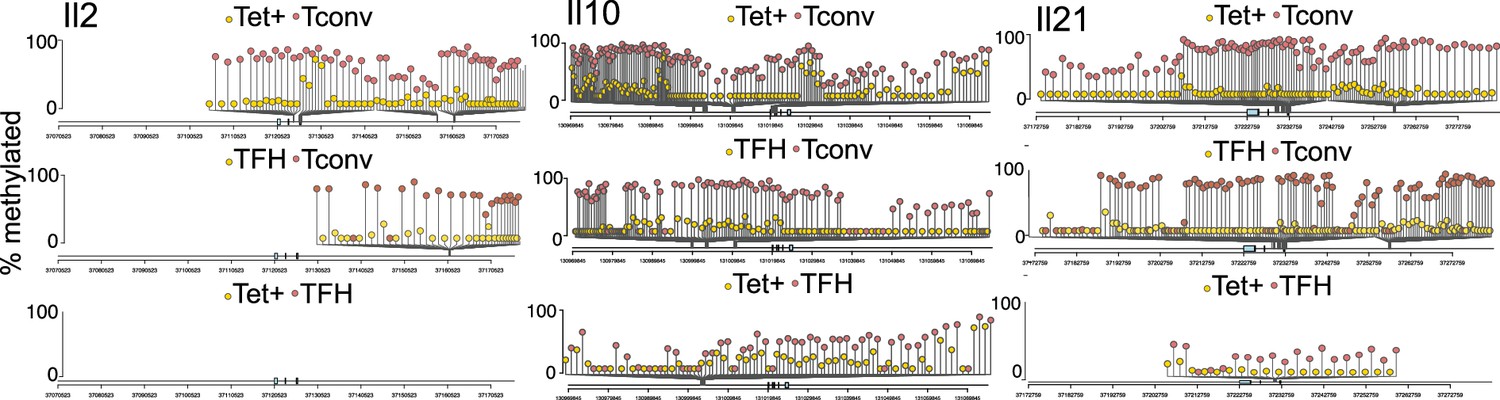
Differential DNA methylation at or near the Il2, Il10, and Il21 loci between BDC2.5mi/I-Ag7-NP-induced Tet+ or KLH-DNP-induced T-follicular helper (TFH) and Tconv cells.
Lolliplots comparing the location of differentially methylated CpGs in Il2 (left), Il10 (middle), and Il21 (right) in BDC2.5mi/I-Ag7-NP-induced Tet+ vs. Tconv (top), KLH-DNP-induced TFH vs. Tconv (middle), and BDC2.5mi/I-Ag7-NP-induced Tet+ vs. KLH-DNP-induced TFH cells’ comparisons (bottom). KLH, keyhole limpet hemocyanin; NP, nanoparticle.
Figure 4—figure supplement 3
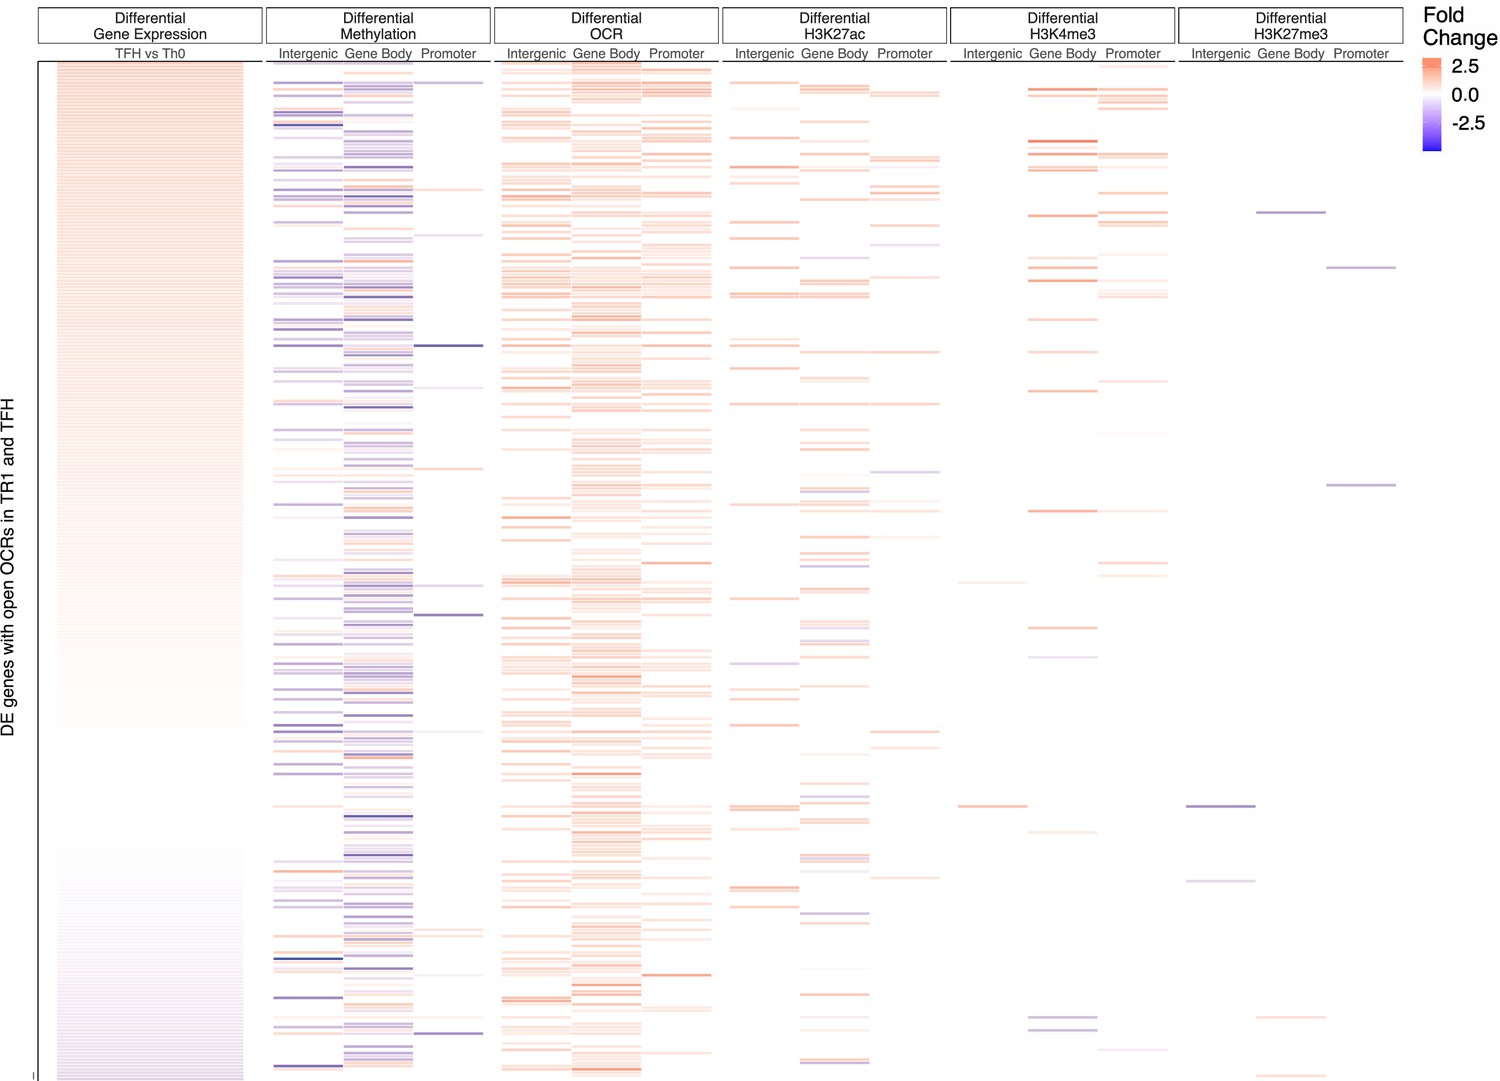
Relative contribution of different epigenetic marks to changes in gene expression during the TFH-to-TR1 cell conversion (TFH vs. Tconv).
Heatmap depicting the presence of different epigenetic marks (from left to right: differential methylation, differential open chromatin regions [OCRs], differential H3K27ac deposition, differential H3K4me3 deposition, and differential H3K27me3 deposition) in antigen-induced TFH vs. Tconv cells. Data correspond to differentially expressed genes with shared OCRs between TR1 and TFH cells. Differential epigenetic data is scaled for each technique and when multiple genomic regions are associated to a gene, the average is provided. Genes are ordered by decreasing fold change of differential gene expression. TFH, T-follicular helper; TR1, T-regulatory type 1.
Figure 4—figure supplement 4
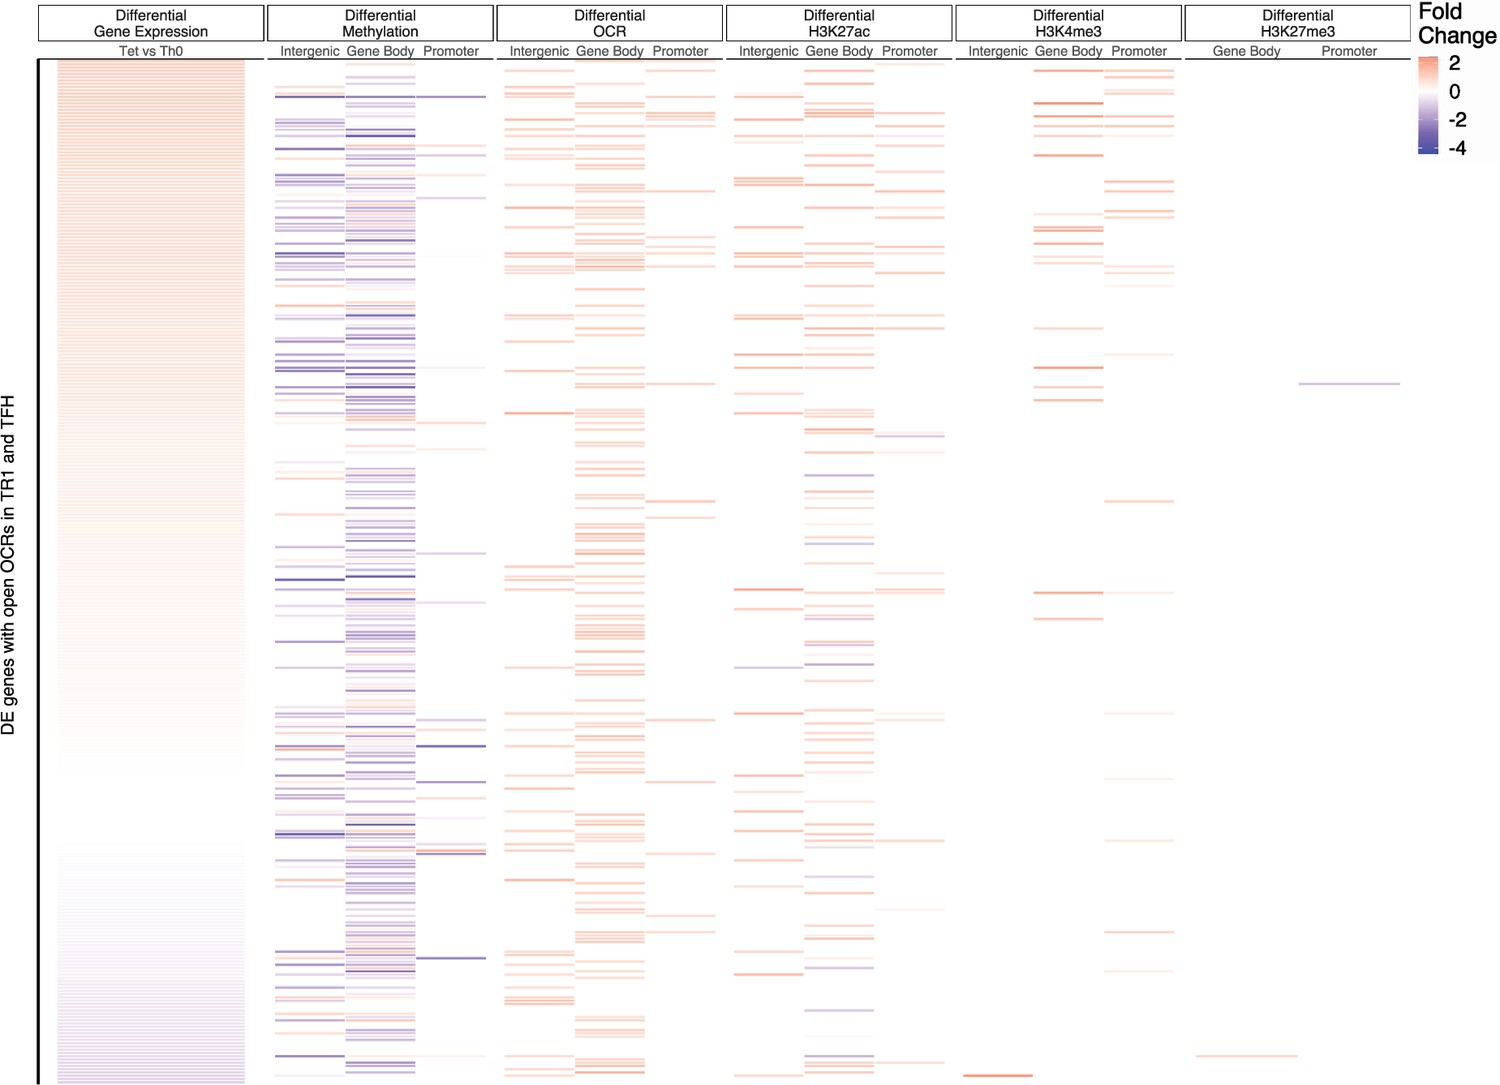
Relative contribution of different epigenetic marks to changes in gene expression during the TFH-to-TR1 cell conversion (Tet+ vs. Tconv).
Heatmap depicting the presence of different epigenetic marks (from left to right: differential methylation, differential open chromatin regions [OCRs], differential H3K27ac deposition, differential H3K4me3 deposition, and differential H3K27me3 deposition) in BDC2.5mi/IAg7-NP-induced Tet+ vs. Tconv cells. Data correspond to differentially expressed genes with shared OCRs between TR1 and TFH cells. Differential epigenetic data is scaled for each technique and when multiple genomic regions are associated to a gene, the average is provided. Genes are ordered by decreasing fold change of differential gene expression. TFH, T-follicular helper; TR1, T-regulatory type 1.
Figure 4—figure supplement 5
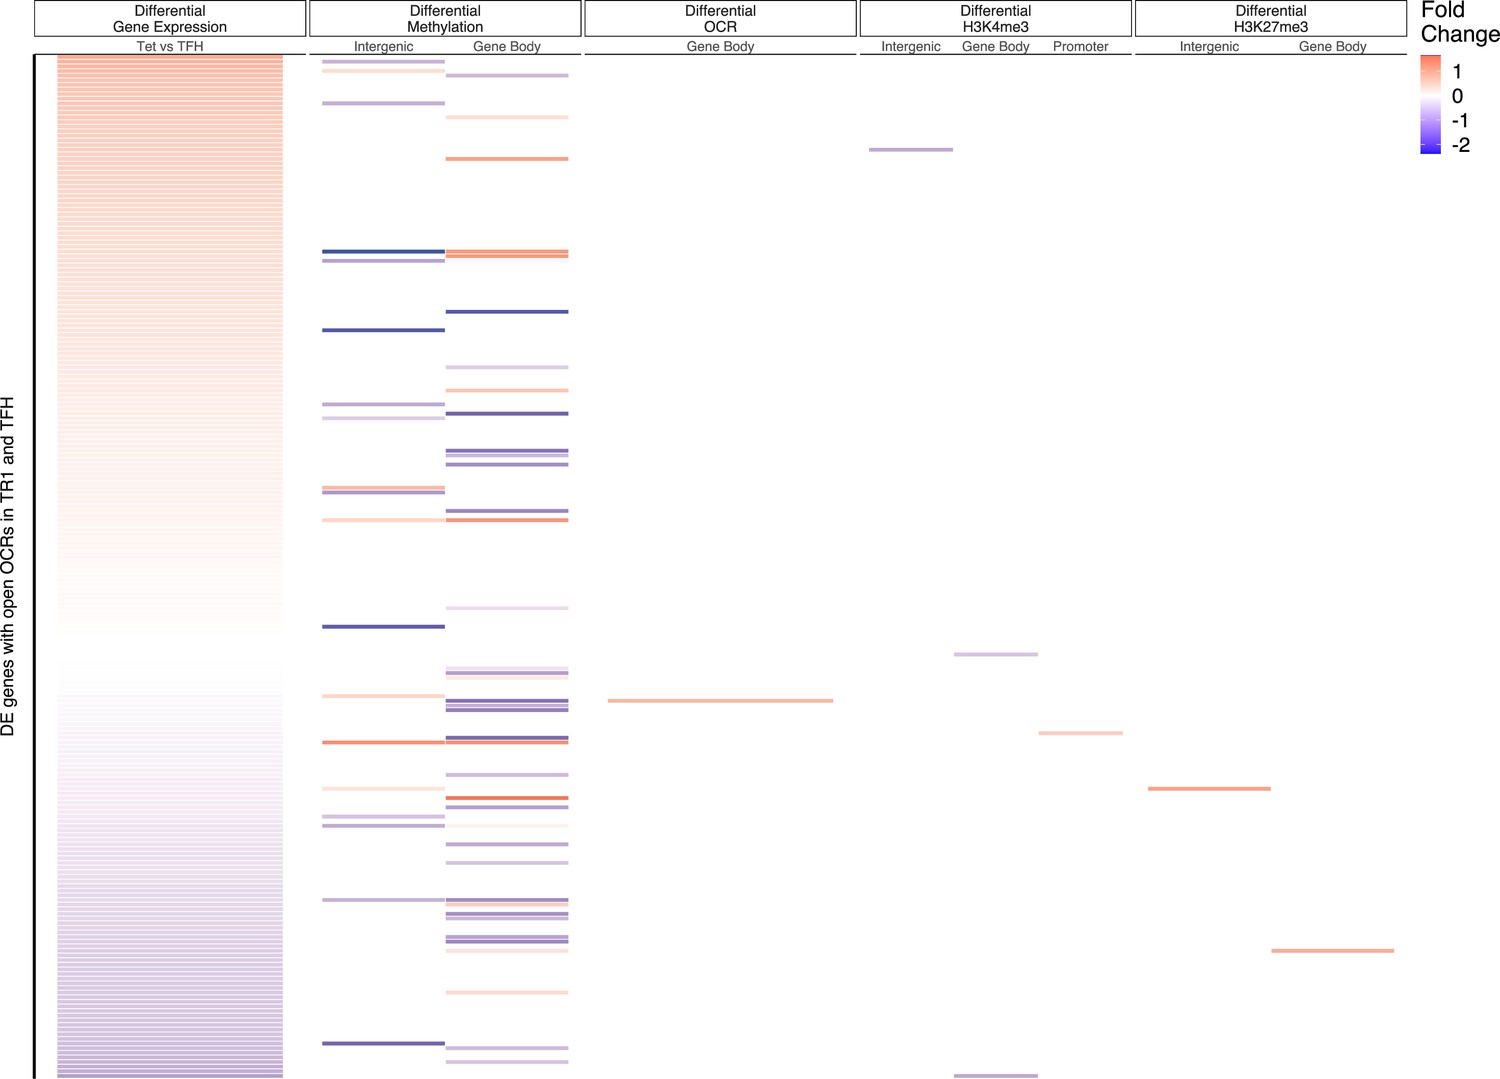
Relative contribution of different epigenetic marks to changes in gene expression during the TFH-to-TR1 cell conversion (Tet+ vs. TFH).
Heatmap depicting the presence of different epigenetic marks (from left to right: differential methylation, differential open chromatin regions [OCRs], differential H3K27ac deposition, differential H3K4me3 deposition, and differential H3K27me3 deposition) in BDC2.5mi/IAg7-NP-induced Tet+ vs. KLH-DNP-induced TFH cells. Data correspond to differentially expressed genes with shared OCRs between TR1 and TFH cells. Differential epigenetic data is scaled for each technique and when multiple genomic regions are associated to a gene, the average is provided. Genes are ordered by decreasing fold change of differential gene expression. KLH, keyhole limpet hemocyanin; TFH, T-follicular helper; TR1, T-regulatory type 1; NP, nanoparticle.
Figure 5
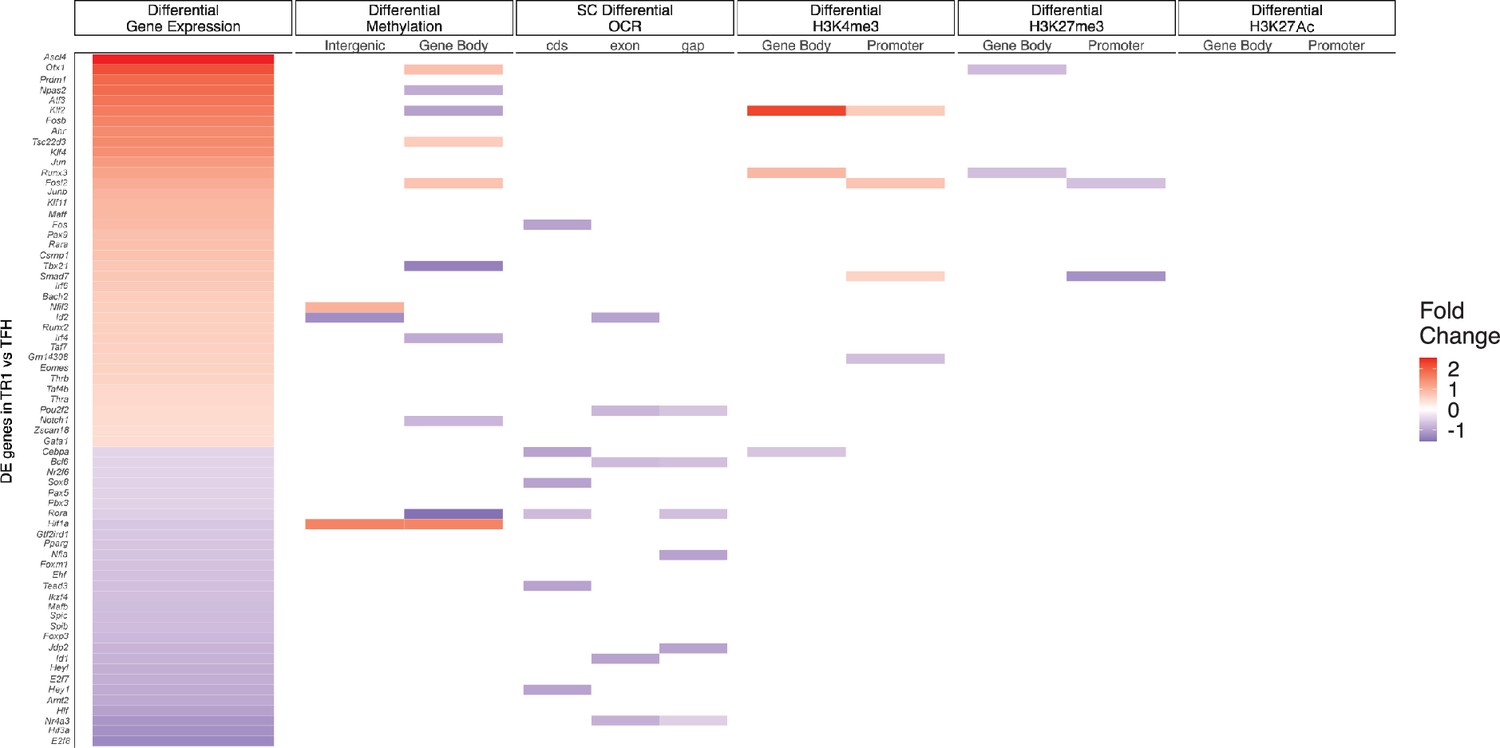
Relative contribution of different epigenetic marks to changes in the expression of differentially expressed transcription factor (TF)-coding genes during the TFH-to-TR1 cell conversion.
Heatmap depicting the presence of different epigenetic marks (from left to right: differential methylation, differential open chromatin regions [OCRs], differential H3K27ac deposition, differential H3K4me3 deposition, and differential H3K27me3 deposition) in BDC2.5mi/I-Ag7-NP-induced Tet+ vs. KLH-DNP-induced TFH cells. Data correspond to differentially expressed TF-coding genes between TR1 and TFH.1 cells as determined by the single-cell Multiome (scMultiome) analyses. Differential epigenetic data is scaled for each technique and when multiple genomic regions are associated to a gene, the average is provided. Genes are arranged from most to least upregulated, followed by least to most downregulated (fold change). No differentially enriched sites for H3K27Ac histone deposition were associated with differential expression of these genes. KLH, keyhole limpet hemocyanin; TFH, T-follicular helper; TR1, T-regulatory type 1; NP, nanoparticle.
-
Figure 5—source data 1
Comparison of transcription factor-coding genes that are upregulated or downregulated during the TFH-to-TR1 conversion, detailing chromatin accessibility changes (OCR closure) and associated epigenetic marks for each gene.
- https://cdn.elifesciences.org/articles/97665/elife-97665-fig5-data1-v1.xlsx
Figure 6
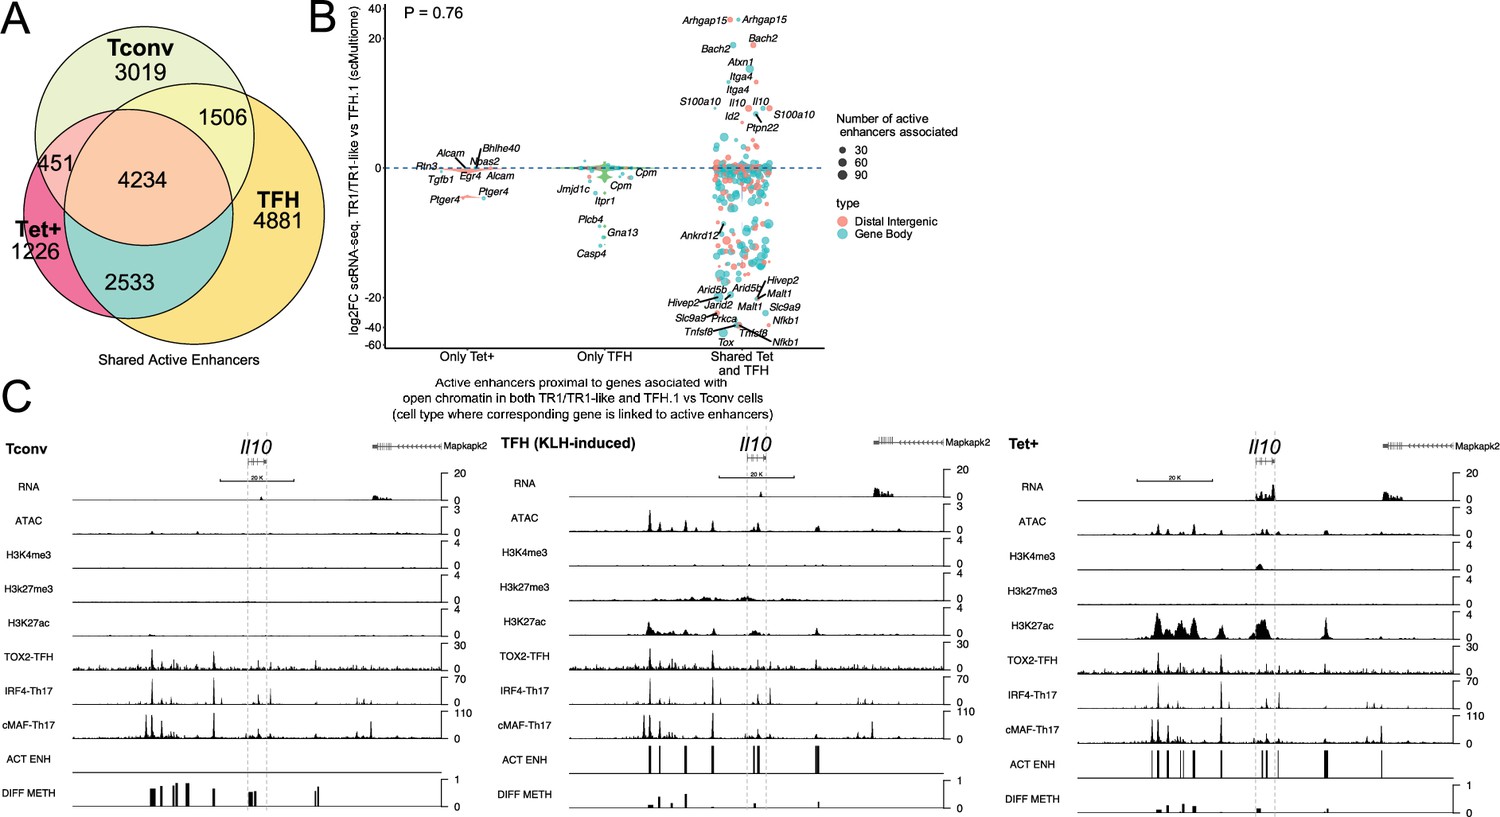
T-regulatory type 1 (TR1) cells inherit hypomethylated active enhancers from their T-follicular helper (TFH) precursors.
(A) Euler’s plot showing total active enhancer sharing by BDC2.5mi/I-Ag7-NP-induced Tet+ cells, KLH-DNP-induced TFH cells, and Tconv cells. Overlapping of active enhancers in BDC2.5mi/I- Ag7-NP-induced Tet+ cells and KLH-DNP-induced TFH cells was significantly higher than overlapping between BDC2.5mi/I-Ag7-NP-induced Tet+ and Tconv cells (Pearson’s Chi-squared test with Yates' continuity correction p<2.2e-16). (B) Jitter plot comparing differential gene expression between TR1/TR1-like and TFH.1 cells (as determined by single-cell Multiome [scMultiome]), focusing on the genes that remain open at the TR1/TR1-like cell stage, and both distribution and number of active enhancers per gene as a function of their cell pool specificity (i.e. only found in BDC2.5mi/I- Ag7-NP-induced Tet+ cells (only Tet+), KLH-DNP-induced TFH cells (only TFH), or both (shared by Tet+ and TFH)). Color and size depict the region type (gene body or intergenic) and the number of active enhancers per gene, respectively. Gene names are displayed for all the genes except when more than 20 dots are in the same region of the plot. No significant correlation between active enhancer distribution and differential gene expression (Wilcox test for differential analysis: adjusted p<0.05) was found using Pearson’s Chi-square test, p=0.76. (C) Figure displays genome tracks for the various readouts examined herein in Tconv CD4+ T-cells (left), KLH-DNP-induced TFH cells (middle), and BDC2.5mi/I-Ag7-NP-induced Tet+ cells (right). Tracks correspond, from top to bottom, to reads for RNAseq (n=4), ATACseq (n=3), ChIPseq (n=1) for H3K4me3, H3K27me3, and H3K4me3 immunoprecipitation, respectively; ChiPseq (n=1) for Tox- 2 (TFH cells), Irf4 (Th17 cells), and cMaf (Th17 cells) deposition, respectively (see main text for references), active enhancers and differential methylation, respectively. Visualization reads were normalized to total sequencing depth per sample using BPM (bins per million) and, where replicates were available, height mean per bin was also computed. ChIPseq data was also normalized for input (non-immunoprecipitated) sequenced reads. Height (y-axis) is equivalent to the normalized number of mapped reads in each region. Active enhancers (ACT ENH) were predicted as overlapping regions of open chromatin region (OCR) (ATACseq) and H3K27Ac deposited peaks (ChIPseq H3K27Ac) and are depicted as absent or present in each region. DIFF METH shows differentially methylated regions (n=3) obtained comparing BDC2.5mi/I-Ag7-NP-induced Tet+ cells and KLH-DNP-induced TFH to Tconv cells. Height corresponds to the relative mean methylation value for each region. KLH, keyhole limpet hemocyanin; NP, nanoparticle.
-
Figure 6—source data 1
Number of total and shared mapped active enhancers between pMHCII-NP-induced Tet+, KLH-induced TFH, and Tconv cells.
- https://cdn.elifesciences.org/articles/97665/elife-97665-fig6-data1-v1.xlsx
-
Figure 6—source data 2
Differential gene expression by scRNA-seq between TR1 and TFH cells of genes associated to active enhancers overlapping accessible chromatin regions in both TFH and TR1 cells.
- https://cdn.elifesciences.org/articles/97665/elife-97665-fig6-data2-v1.xlsx
Figure 7
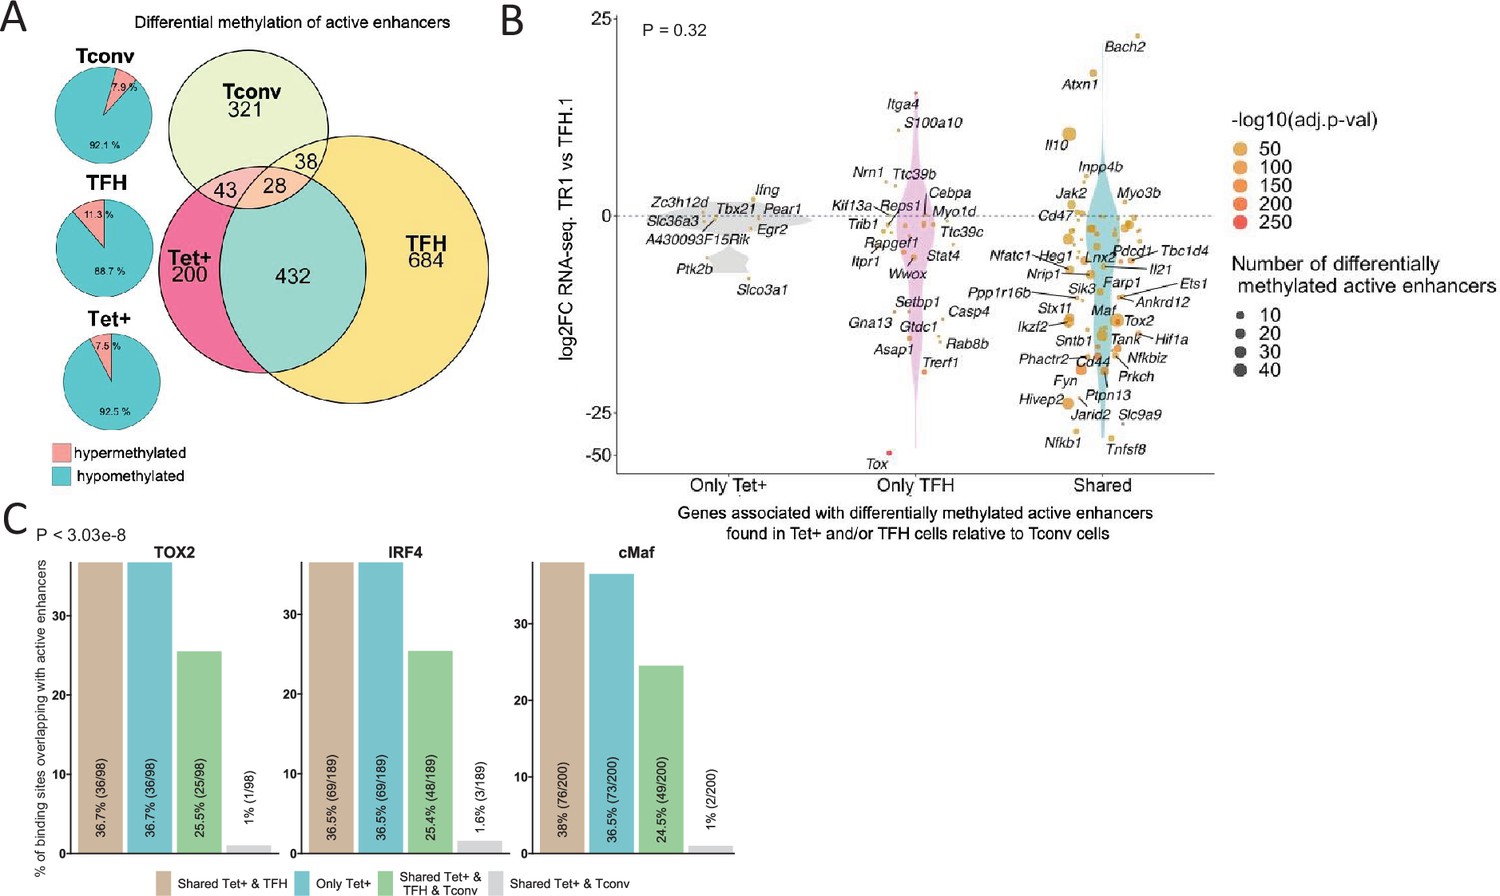
Extensive sharing of differentially methylated active enhancers carrying Tox2, IRF4, and/or c-MAF-binding sites in BDC2.5mi/I-Ag7-NP-induced Tet+ and KLH-DNP-induced T-follicular helper (TFH) cells vs. Tconv cells.
(A) Euler’s plots with differentially methylated active enhancers for each comparison: BDC2.5mi/I- Ag7-NP-induced Tet+ cells vs. Tconv (Tet+; red), KLH-DNP-induced TFH vs. Tconv (TFH; orange), and Tconv vs. BDC2.5mi/I-Ag7-NP-induced Tet+ cells (Tconv; green). Pie charts on the left show the methylation status (hypomethylated or hypermethylated) of each subset of active enhancers for the same subset-to-subset comparisons. The BDC2.5mi/I-Ag7-NP-induced Tet+ and KLH-DNP-induced TFH cell subsets share significantly more differentially methylated active enhancers among each other than with Tconv cells (Pearson’s Chi-squared test with Yates' continuity correction; p<2.2e-16). (B) Jitter plot of differentially methylated active enhancers in BDC2.5mi/I- Ag7-NP-induced Tet+ cells (Tet+) and KLH-DNP-induced TFH (TFH) vs. Tconv cells vs. differential gene expression along the TFH.1-TR1 axis as determined by single-cell Multiome (scMultiome). Plot corresponds to genes that remain accessible as TFH.1 cells transdifferentiate into TR1/TR1-like cells. The differentially methylated enhancers linked to these genes were classified as being specific for BDC2.5mi/I-Ag7-NP-induced Tet+ cells (only Tet+), exclusive for KLH-DNP-induced TFH cells (only TFH) or shared by both Tet+ and TFH cells. Gene bubble color depicts -log10 of adjusted p-value from scRNAseq differential analysis, and bubble size depicts the number of regions associated per gene. Gene names are displayed for all the genes except when more than 20 dots are in the same region of the plot. No statistically significant associations between the presence of differentially hypo- or hypermethylated active enhancers and gene expression differences were found (Chi-square test: p=0.32). (C) Overlap of active enhancers with Tox2, IRF4, and c-MAF binding sites. Histogram plot compares the relative proportion of the active enhancers linked to genes that are accessible in both TR1/TR1-like and TFH.1 cells (as defined via scMultiome) and that are upregulated in TR1/TR1-like vs. TFH.1 cells (as determined via scMultiome), which overlap with binding sites for Tox-2 in TFH cells, and IRF4 or c-MAF in Th17 cells. Bars correspond from left to right, to: (1) binding sites shared by both BDC2.5mi/I-Ag7-NP-induced Tet+ and KLH-DNP-induced TFH cells (shared Tet+ & TFH); (2) exclusively found in the BDC2.5mi/I- Ag7-NP-induced Tet+ pool (only Tet+); (3) shared by BDC2.5mi/I-Ag7-NP-induced Tet+, KLH-DNP-induced TFH and Tconv cells (shared Tet+ & TFH & Tconv); and (4) shared by BDC2.5mi/I-Ag7-NP-induced Tet+ and Tconv cells (shared Tet+ & Tconv). KLH, keyhole limpet hemocyanin; TR1, T-regulatory type 1; NP, nanoparticle.
-
Figure 7—source data 1
Methylation status of mapped active enhancers in pMHCII-NP-induced Tet+ and KLH-induced TFH cells.
- https://cdn.elifesciences.org/articles/97665/elife-97665-fig7-data1-v1.xlsx
-
Figure 7—source data 2
Overlapping of TOX-2, IRF4, and c-MAF binding sites with active enhancers sharing open chromatin between TR1 and TFH and associated to genes upregulated at the TR1 cell stage.
- https://cdn.elifesciences.org/articles/97665/elife-97665-fig7-data2-v1.xlsx
Tables
Key resources table
| Reagent type (species) or resource | Designation | Source or reference | Identifiers | Additional information |
|---|---|---|---|---|
| Gene (Mus musculus) | Mouse reference genome | UCSC; http://hgdownload.soe.ucsc.edu/goldenPath/mm10/bigZips/ | Mouse reference genome NCBI build 38, GRCm38/mm10 | |
| Strain, strain background (Mus musculus) | Mouse: NOD/ShiLtJ | The Jackson Laboratory | Cat#001976 | |
| Cell line (Cricetulus griseus) | Chinese hamster: CHO-S cells | ThermoFisher | Cat#R80007 | |
| Antibody | Monoclonal Anti-mouse CD4-FITC | BD Biosciences | Cat#553047 | 5 ug/ml |
| Antibody | Monoclonal Anti-mouse CD4-PB | BioLegend | Cat#100428 | 5 ug/ml |
| Antibody | Monoclonal Anti-mouse CD45R/B220-PerCP | BD Biosciences | Cat#553093 | 2 ug/ml |
| Antibody | Monoclonal Anti-mouse CD16/32 | BD Biosciences | Cat#553141 | 1/100 |
| Antibody | Monoclonal Anti-mouse CD16/32 | BioLegend | Cat#101320 | 1/100 |
| Antibody | Monoclonal Anti-mouse CXCR5-biotin | BD Biosciences | Cat#551960 | 1/100 |
| Antibody | Monoclonal Anti-mouse CD44-FITC | BD Biosciences | Cat#553133 | 1/100 |
| Antibody | Monoclonal Anti-mouse CD279 (PD1) | BD Biosciences | Cat#562584 | 1/100 |
| Antibody | Polyclonal Anti-mouse Histone 3 (acetyl K27) | Abcam | Cat#ab4729 | 1/200 |
| Antibody | Polyclonal Anti-mouse Histone 3 (trimethyl K4) | Sigma-Aldrich | Cat#04–745 | 1/1200 |
| Antibody | Polyclonal Anti-mouse Histone 3 (trimethyl K27) | CellSignaling | Cat#9733 S | 1/1200 |
| Sequence-based reagent | Ad1_noMx | Conda | ||
| Sequence-based reagent | Ad2.1 | Conda | Ad2.1: TAAGGCGA | |
| Sequence-based reagent | Ad2.2 | Conda | Ad2.2: CGTACTAG | |
| Sequence-based reagent | Ad2.3 | Conda | Ad2.3: AGGCAGAA | |
| Sequence-based reagent | Ad2.4 | Conda | Ad2.4: TCCTGAGC | |
| Sequence-based reagent | Ad2.5 | Conda | Ad2.5: GGACTCCT | |
| Sequence-based reagent | Ad2.6 | Conda | Ad2.6: TAGGCATG | |
| Recombinant protein | BDC2.5mi/IAg7 tetramer | Clemente-Casares et al., 2016 | Not applicable | |
| Recombinant protein, fluorochrome labelled | Streptavidin-PE | Life Technologies | Cat#SNN1007 | 1:4 molar ratio with pMHCII monomers |
| Commercial assay or kit | Anti-mCD4 microbeads | Milteny Biotec | Cat#130-049-201 | |
| Commercial assay or kit | Nextera XT | Illumina | Cat#FC-131–1024 | |
| Commercial assay or kit | RNeasy Plus Mini Kit | Qiagen | Cat#74134 | |
| Commercial assay or kit | TruSeq Stranded mRNA Sample Prep Kit v2 | Illumina | Cat#RS-122-2101/2 | |
| Commercial assay or kit | Reverse transcriptase SuperScript II | Invitrogen | Cat#18064–014 | |
| Commercial assay or kit | Agencourt AMPure XP Beads | Beckman Coulter | Cat#A63881 | |
| Commercial assay or kit | KAPA Library Quantification Kit | KapaBiosystems | Cat#KK4835 | |
| Commercial assay or kit | BirA500 biotinylation kit | Avidity | Cat#BirA500 | |
| Commercial assay or kit | EZ DNA Methylation-Gold kit | ZYMO | Cat#D5005 | |
| Commercial assay or kit | MinElute PCR purification kit | Qiagen | Cat#28004 | |
| Commercial assay or kit | MinElute Reaction Cleanup kit | Qiagen | Cat#28204 | |
| Commercial assay or kit | NEBNext High Fidelity PCR kit | New England BioLabs | Cat#M0541S | |
| Commercial assay or kit | NEBNext Ultra DNA Library Prep kit | Illumina | Cat#E7645S | |
| Commercial assay or kit | Nextera DNA Library Preparation kit | Illumina | Cat#FC-121–1030 | |
| Commercial assay or kit | Pierce Comassie (Bradford) Kit | Thermo Fisher Scientific | Cat#23200 | |
| Commercial assay or kit | Cat#23200 | Thermo Fisher Scientific | Pierce Comassie (Bradford) Kit | |
| Commercial assay or kit | Pierce Monomeric Avidin Kit | Thermo Fisher Scientific | Cat#20227 | |
| Commercial assay or kit | Tagment DNA TDE1 Enzyme and Buffer kit | Illumina | Cat#20034197 | |
| Commercial assay or kit | PCR cleanup | Qiagen | Cat#28104 | |
| Commercial assay or kit | Dynabeads Protein A | Invitrogen | Cat#10001D | |
| Commercial assay or kit | MACS separation LS columns | Miltenyi Biotec | Cat#130-042-401 | |
| Commercial assay or kit | Chromium Next GEM single cell 3’ reagent v3.1 | 10 x Genomics | Cat#PN-1000128 | |
| Commercial assay or kit | Amicon Ultra-15 100 kDa cut-off | Millipore | Cat#UFC910024 | |
| Commercial assay or kit | DNA LoBind 1.5 ml tubes | Eppendorf | Cat#0030108051 | |
| Commercial assay or kit | PD-10 Desalting Columns | GE Healthcare | Cat#52-1308-00 BB | |
| Commercial assay or kit | Pierce BCA Assay Kit | Thermo Fisher Scientific | Cat#23225 | |
| Commercial assay or kit | Cat#23225 | Thermo Fisher Scientific | Pierce BCA Assay Kit | |
| Commercial assay or kit | Protein LoBind 1.5 ml tubes | Eppendorf | Cat#0030108442 | |
| Commercial assay or kit | Ultra-Fine 30 G insulin syringes | BD | Cat#320927 | |
| Chemical compound, drug | L-Glutamine Solution (200 mM) | Cultek | Cat#H3BE17-605E | |
| Chemical compound, drug | Penicillin/Streptomycin | Sigma-Aldrich | Cat#P4333 | |
| Chemical compound, drug | Gentamycin | Lonza | Cat#91 L0012-010 | |
| Chemical compound, drug | Keyhole Limpet Hemocyanin (KLH) | Sigma-Aldrich | Cat#H7017 | |
| Chemical compound, drug | DNP-Keyhole Limpet Hemocyanin Conjugate, (DNP-KLH) | Sigma-Aldrich | Cat#324121 | |
| Chemical compound, drug | Freund’s Adjuvant, Complete | Sigma-Aldrich | Cat#F5881-10ML | |
| Chemical compound, drug | Freund’s Adjuvant, Incomplete | Sigma-Aldrich | Cat#F5506-10ML | |
| Chemical compound, drug | Avidin | Thermo Scientific | Cat#21121 | |
| Chemical compound, drug | Maleimide-PEG 2 kDa | Jenkem Tech | Cat#MAL-PEG2000-MAL | |
| Chemical compound, drug | Cell Boost 7 a | HyClone | Cat#SH31026.07 | |
| Chemical compound, drug | Cell Boost 7b | HyClone | Cat#SH31027.01 | |
| Chemical compound, drug | Dulbecco’s Phosphate Buffered Saline (DPBS) | Sigma-Aldrich | Cat#D8573-1L | |
| Chemical compound, drug | Paraformaldehyde | Electron Microscopy Sciences | Cat#15710 | |
| Chemical compound, drug | Protease Inhibitor Cocktail | Roche | Cat#4693132001 | |
| Chemical compound, drug | Proteinase K | Roche | Cat#03 115 879 001 | |
| Chemical compound, drug | DMEM | Sigma-Aldrich | Cat#D6429−6X1 L | |
| Chemical compound, drug | RNAse A | Qiagen | Cat# 19101 | |
| Chemical compound, drug | Fetal Bovine Serum (FBS) | Sigma-Aldrich | Cat#F7524 | |
| Software, algorithm | BiocManager (v1.30.16) | https://cran.r-project.org/package=BiocManager%0A%0A | ||
| Software, algorithm | biomaRt (v2.48.3) | Durinck et al., 2009 | ||
| Software, algorithm | Bowtie2 (v2.4.2) | Langmead and Salzberg, 2012 | ||
| Software, algorithm | BSMAP (v3.0) | Xi and Li, 2009 | ||
| Software, algorithm | BWA (v0.0.) | Li and Durbin, 2010 | ||
| Software, algorithm | Cellranger (v6.0) | https://support.10xgenomics.com/single-cell-gene-expression/software/pipelines/latest/what-is-cell-ranger | ||
| Software, algorithm | Cellranger-arc (v2.0) | https://support.10xgenomics.com/single-cell-multiome-atac-gex/software/pipelines/latest/what-is-cell-ranger-arc | ||
| Software, algorithm | Cellranger-atac (v2.1) | https://support.10xgenomics.com/single-cell-atac/software/pipelines/latest/what-is-cell-ranger-atac | ||
| Software, algorithm | ChipSeeker (v1.28.3) | Yu et al., 2015 | ||
| Software, algorithm | clusterProfiler (v4.0.5) | Wu et al., 2021 | ||
| Software, algorithm | Deeptools (v3.5.0) | Ramírez et al., 2014 | ||
| Software, algorithm | Deseq2 (v1.32.0) | Love et al., 2014 | ||
| Software, algorithm | DiffBind (v3.2.7) | Ross-Innes et al., 2012 | ||
| Software, algorithm | FastQC | http://www.bioinformatics.babraham.ac.uk/projects/fastqc/ | ||
| Software, algorithm | FlowJo v9 | Becton, Dickinson and Company; https://www.flowjo.com | ||
| Software, algorithm | Gene Ontology | http://geneontology.org | ||
| Software, algorithm | Genomic Ranges (v1.44.0) | Lawrence et al., 2013 | ||
| Software, algorithm | MACS2 (v2.2.7.1) | Zhang et al., 2008 | ||
| Software, algorithm | Monocle3 (v1.0.1) | Cao et al., 2019 | ||
| Software, algorithm | org.Mm.eg.db (v3.13.0) | https://bioconductor.org/packages/release/data/annotation/html/org.Mm.eg.db.html | ||
| Software, algorithm | Partek Flow software | https://www.partek.com/partek-flow/ | ||
| Software, algorithm | Picard (v2.25.0) | https://broadinstitute.github.io/picard/ | ||
| Software, algorithm | R (v4.1.0) | https://www.eea.europa.eu/data-and-maps/indicators/oxygen-consuming-substances-in-rivers/r-development-core-team-2006 | ||
| Software, algorithm | Rstudio (v1.4.1103) | https://www.rstudio.com/ | ||
| Software, algorithm | R- trackViewer Bioconductor package | https://github.com/jianhong/trackViewer (jianhong, 2024) | ||
| Software, algorithm | Samtools | http://samtools.sourceforge.net | ||
| Software, algorithm | Seurat (v4.0.3) | Hao et al., 2021 | ||
| Software, algorithm | Signac (v1.3.0) | Stuart et al., 2021 | ||
| Software, algorithm | STAR (v2.7.10a) | Dobin et al., 2013 | ||
| Software, algorithm | Tidyverse (v1.3.1) | https://www.tidyverse.org | ||
| Software, algorithm | Trackviewer (v1.31.1) | Ou and Zhu, 2019 | ||
| Software, algorithm | Trimmomatic (v.03) | Bolger et al., 2014 | ||
| Other | ÄKTA Pure 25 FPLC | GE Healthcare | FPLC equipment used to purify proteins | |
| Other | BD FACSAria II | BD Biosciences | Flow cytometer | |
| Other | BD FACSAria SORP | BD Biosciences | Flow cytometer | |
| Other | Bioruptor | Diagenode | Sonicator | |
| Other | Covaris S220 | Covaris | Sonicator | |
| Other | Zetasizer dynamic light scatter (DLS) equipment | Malvern | Equipment used to measure hydrodynamic diameter and monodispersion of nanoparticles | |
| Other | HiSeq2500 | Illumina | DNA sequencing apparatus | |
| Other | NovaSeq 6000 | Illumina | DNA sequencing apparatus | |
| Other | Qubit fluorometer | Invitrogen | DNA/RNA/protein quantification apparatus | |
| Other | TapeStation 4200 | Agilent | Automated electrophoresis apparatus for DNA/RNA sample quality control |
Additional files
-
Supplementary file 1
Differential expression of T-regulatory type 1 (TR1)/T-follicular helper (TFH)/regulatory T-cell (Treg)-relevant genes in peptide-major histocompatibility complex class II (pMHCII)-nanoparticle (NP)-induced Tet+ vs. vaccine-induced TFH cells.
- https://cdn.elifesciences.org/articles/97665/elife-97665-supp1-v1.docx
-
MDAR checklist
- https://cdn.elifesciences.org/articles/97665/elife-97665-mdarchecklist1-v1.pdf
Download links
A two-part list of links to download the article, or parts of the article, in various formats.
Downloads (link to download the article as PDF)
Open citations (links to open the citations from this article in various online reference manager services)
Cite this article (links to download the citations from this article in formats compatible with various reference manager tools)
T-follicular helper cells are epigenetically poised to transdifferentiate into T-regulatory type 1 cells
eLife 13:RP97665.
https://doi.org/10.7554/eLife.97665.3


