Katanin, kinesin-13, and ataxin-2 inhibit premature interaction between maternal and paternal genomes in C. elegans zygotes
- Department of Molecular and Cellular Biology, University of California, United States
Figures
Figure 1 with 1 supplement
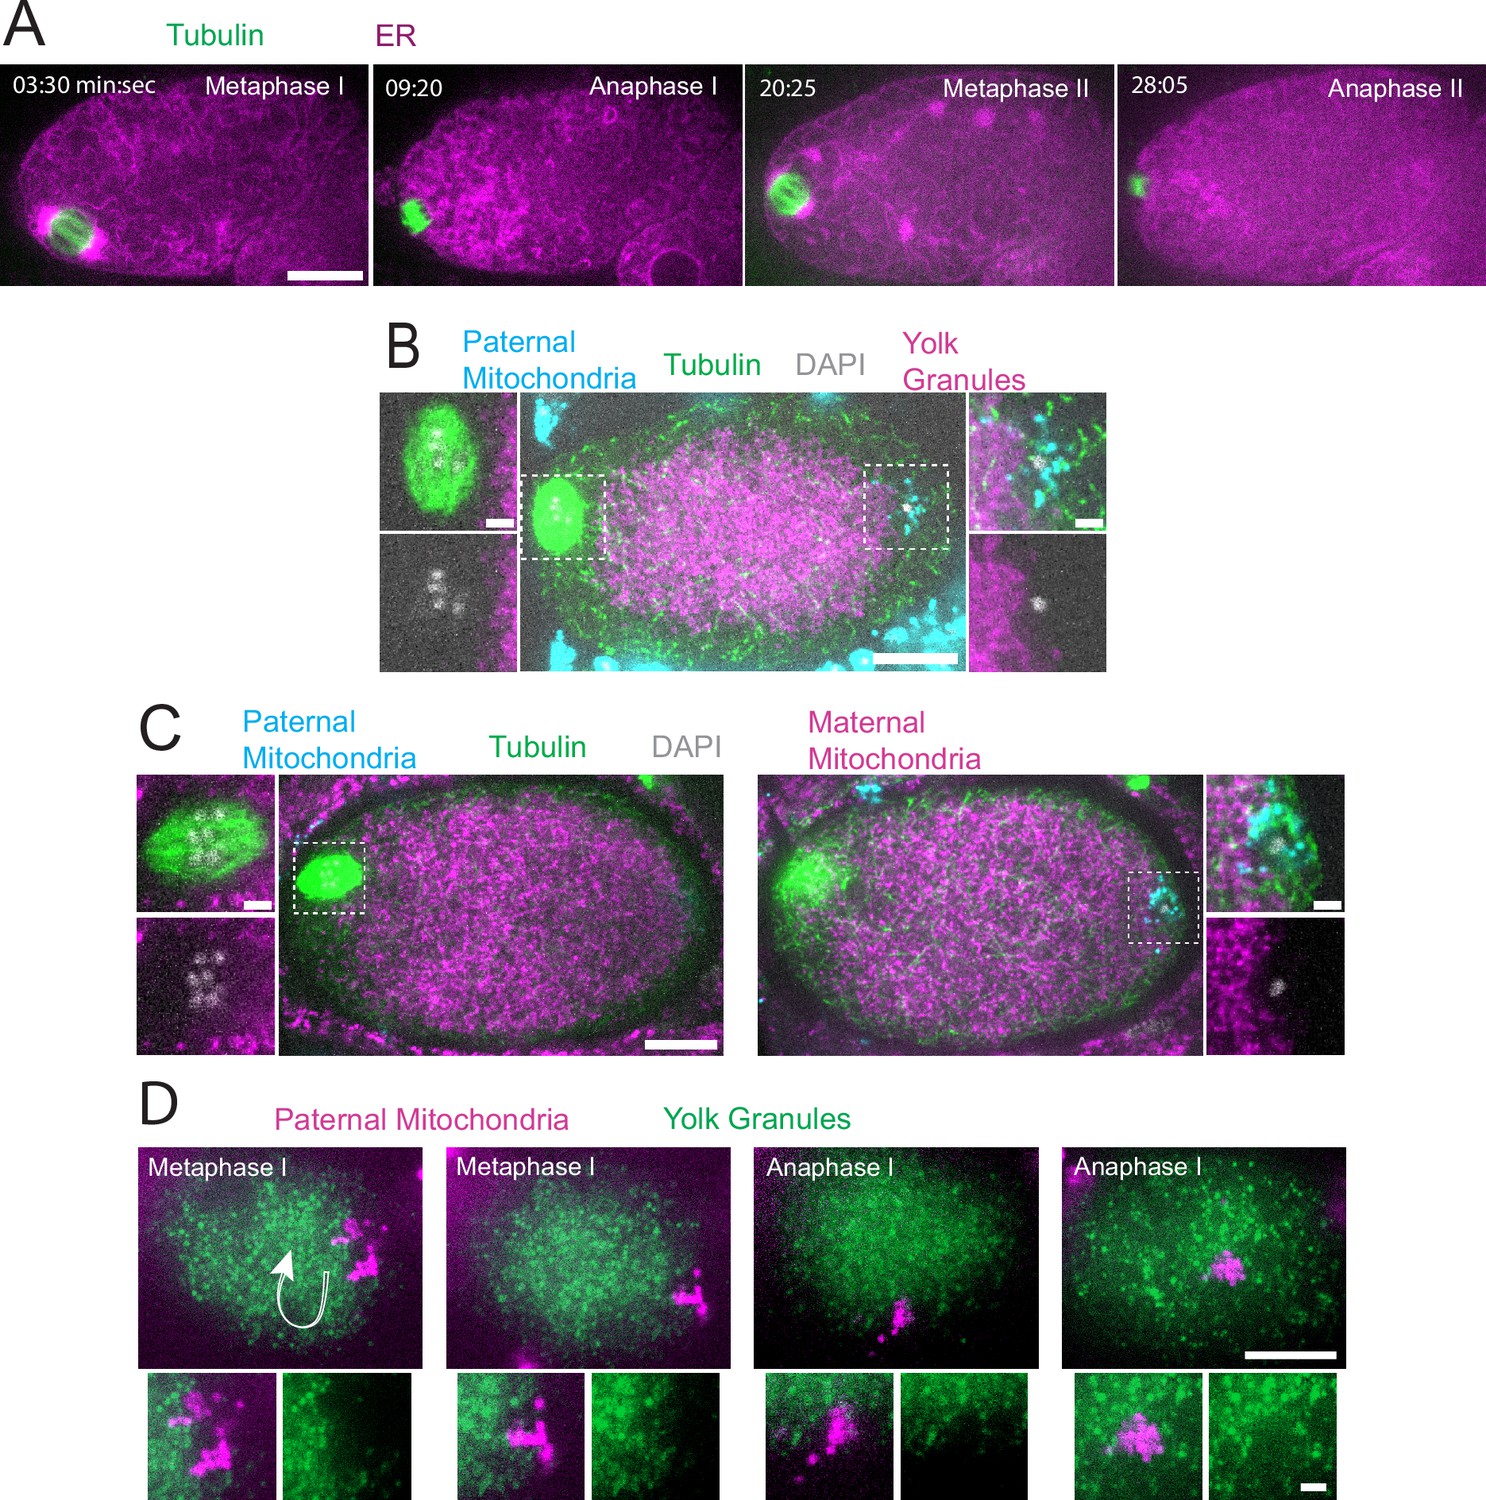
Sperm contents exclude maternal yolk granules and mitochondria.
(A) Time-lapse in utero images of a control embryo expressing GFP::SPCS-1 (signal peptidase/ER) and mKate::TBA-2 (tubulin). ER morphology transitions from sheet-like during metaphase I and metaphase II to dispersed during anaphase I and anaphase II. (B) Image of a fixed metaphase I embryo expressing VIT-2::GFP (maternal yolk granules), paternal mitochondria labeled with MitoTracker Deep Red FM, and stained with alpha tubulin antibody and DAPI. n=9 metaphase I embryos with packed yolk. (C) Image of a fixed metaphase I embryo expressing COX-4::GFP (maternal mitochondria), paternal mitochondria labeled with MitoTracker Deep Red FM, and stained with alpha tubulin antibody and DAPI. n=5 embryos with packed maternal mitochondria. (D) Time-lapse in utero images of an embryo expressing VIT-2::GFP and paternal mitochondria labeled with SDHC-1::mCherry (succinate dehydrogenase). Images demonstrate sperm contents streaming in the short-axis of the embryo. Arrow indicates direction of streaming. (A–D) Bars: whole embryos 10 µm; insets 2 µm.
Figure 1—video 1
In utero time-lapse sequence of control embryo expressing GFP::SPCS-1 (endoplasmic reticulum, ER in magenta) and mKate::tubulin (in green).
Figure 2
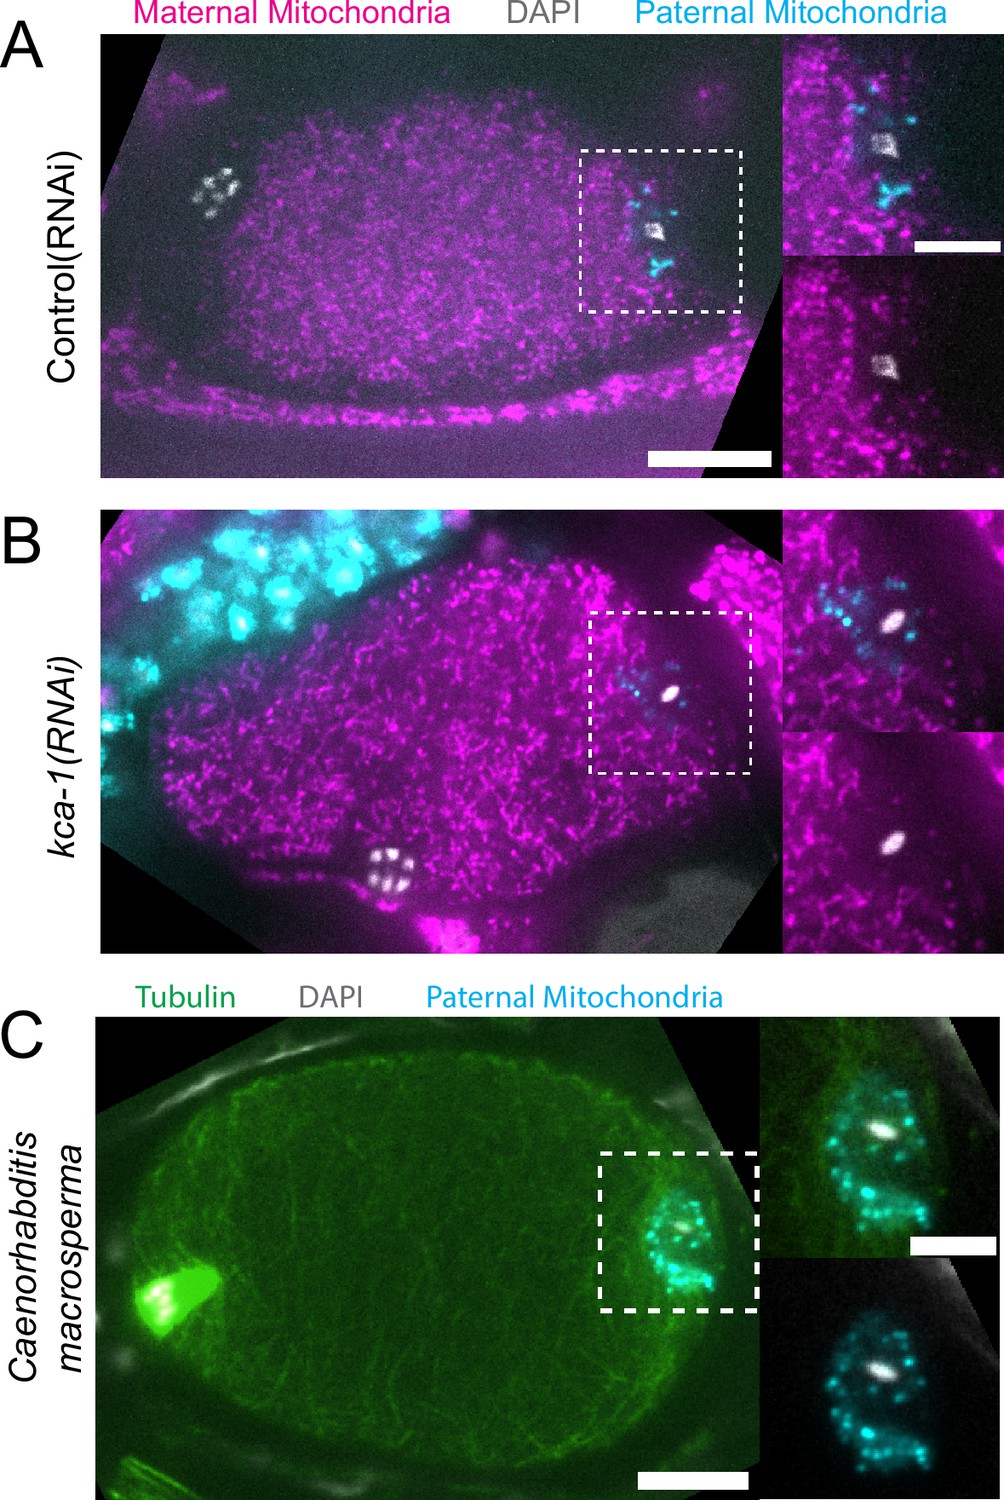
Paternal organelle cloud is impermeable to maternal mitochondria regardless of yolk packing and is conserved in Nematoda.
(A) Fixed image of a meiotic embryo expressing COX-4::GFP (maternal mitochondria) and MitoTracker Deep Red FM (paternal mitochondria). Paternal mitochondria take up a volume excluding maternal mitochondria (n=11). (B) Upon depletion of the kinesin cargo adapter, KCA-1, maternal mitochondria extend to the plasma membrane but paternal mitochondria remain sequestered (n=8). (C) Fixed image of a Caenorhabditis macrosperma (C. macrosperma wild isolate) meiotic embryo mated with MitoTracker Deep Red FM stained males. The paternal mitochondria are in a larger volume than in C. elegans but the cohesion of mitochondria near paternal DNA is conserved between species (n=4). (A–C) Bars: whole embryo 10 µm; inset 5 µm. White dotted boxes denote area of insets.
Figure 3
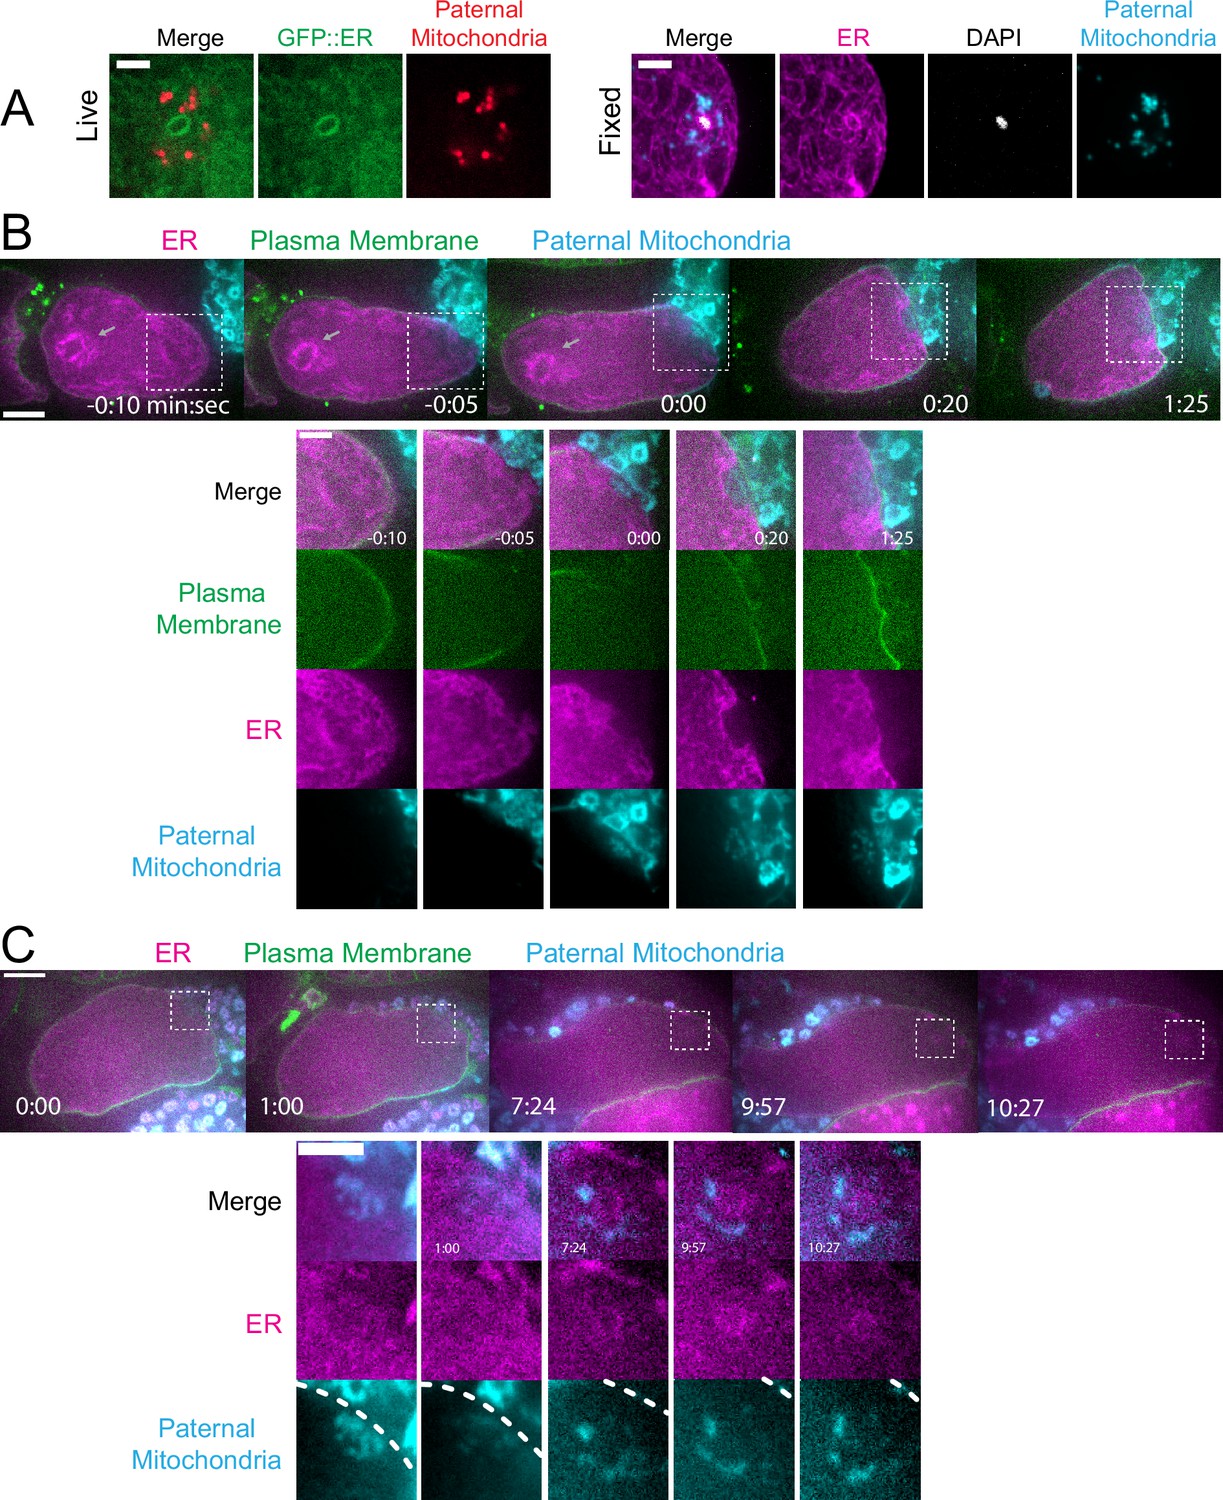
Maternal endoplasmic reticulum (ER) enters the sperm cytoplasm after a delay and forms a ring around sperm DNA.
(A) Live and fixed images of anaphase I and metaphase I embryos show an ER ring within the sperm cytoplasm (as indicated by sperm mitochondria). The fixed image also shows DAPI staining within the ER ring. Live, n=10, fixed n=10. Bars: 3 µm (B) Time-lapse images of a strain expressing TMCO-1::GFP (maternal ER) and mCH::PH (maternal plasma membrane) and fertilized by a sperm labeled with MitoTracker Deep Red FM (paternal mitochondria). At fertilization, a gap appears in the mCH::PH as the sperm’s membrane fuses with that of the oocyte. Paternal mitochondria are seen inside the oocyte at time 0:00. A ‘pocket’ in the maternal ER contains the paternal mitochondria (n=7). At time 1:25 the mCH::PH gap has closed and fertilization is complete. Arrows denote prometaphase spindle. (C) Time-lapse images of an embryo as it enters the spermatheca and exits into the uterus. ER can be seen forming a ring within the mass of paternal mitochondria at 7:24 (n=2). Dotted lines denote cell membrane. White dotted boxes denote area of insets. (B–C) Bars: whole embryos 10 µm; insets 5 µm.
Figure 4
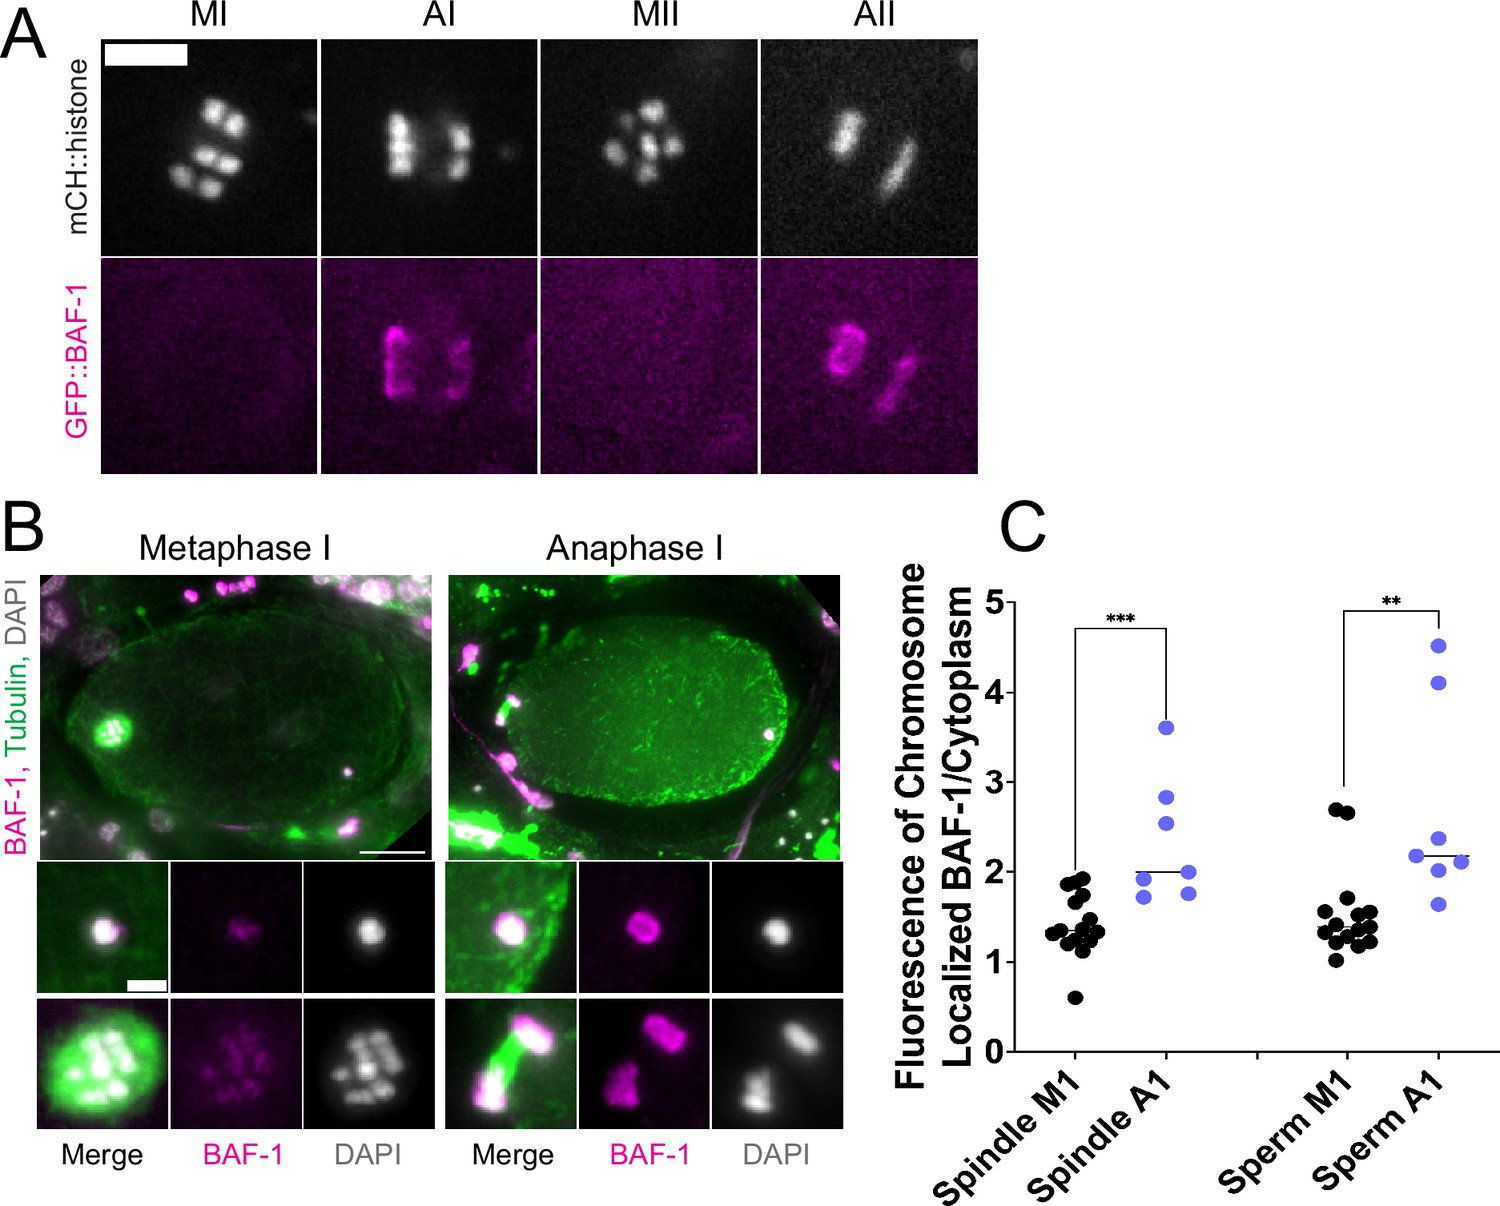
Endoplasmic reticulum (ER) surrounding the sperm DNA is permeable to the chromatin-binding protein BAF-1.
(A) Time-lapse images of maternal chromosomes in an embryo expressing mCH::HIS and GFP::BAF-1. Maternal BAF-1 localizes to chromosomes during anaphase, after the assembly of the ER envelope. Bar, 5 µm. (B) In fixed embryos, maternal GFP::BAF-1 strongly localizes to both maternal and paternal chromosomes during anaphase I, but not metaphase I. Bars: whole embryo, 10 µm; inset, 2 µm. (C) Ratios of chromosomal to cytoplasmic GFP::BAF-1 show that, during anaphase I, there is an increase in GFP::BAF-1 on both the maternal and paternal chromosomes. **p<0.01, ***p<0.001 by Mann-Whitney U Test.
Figure 5 with 5 supplements
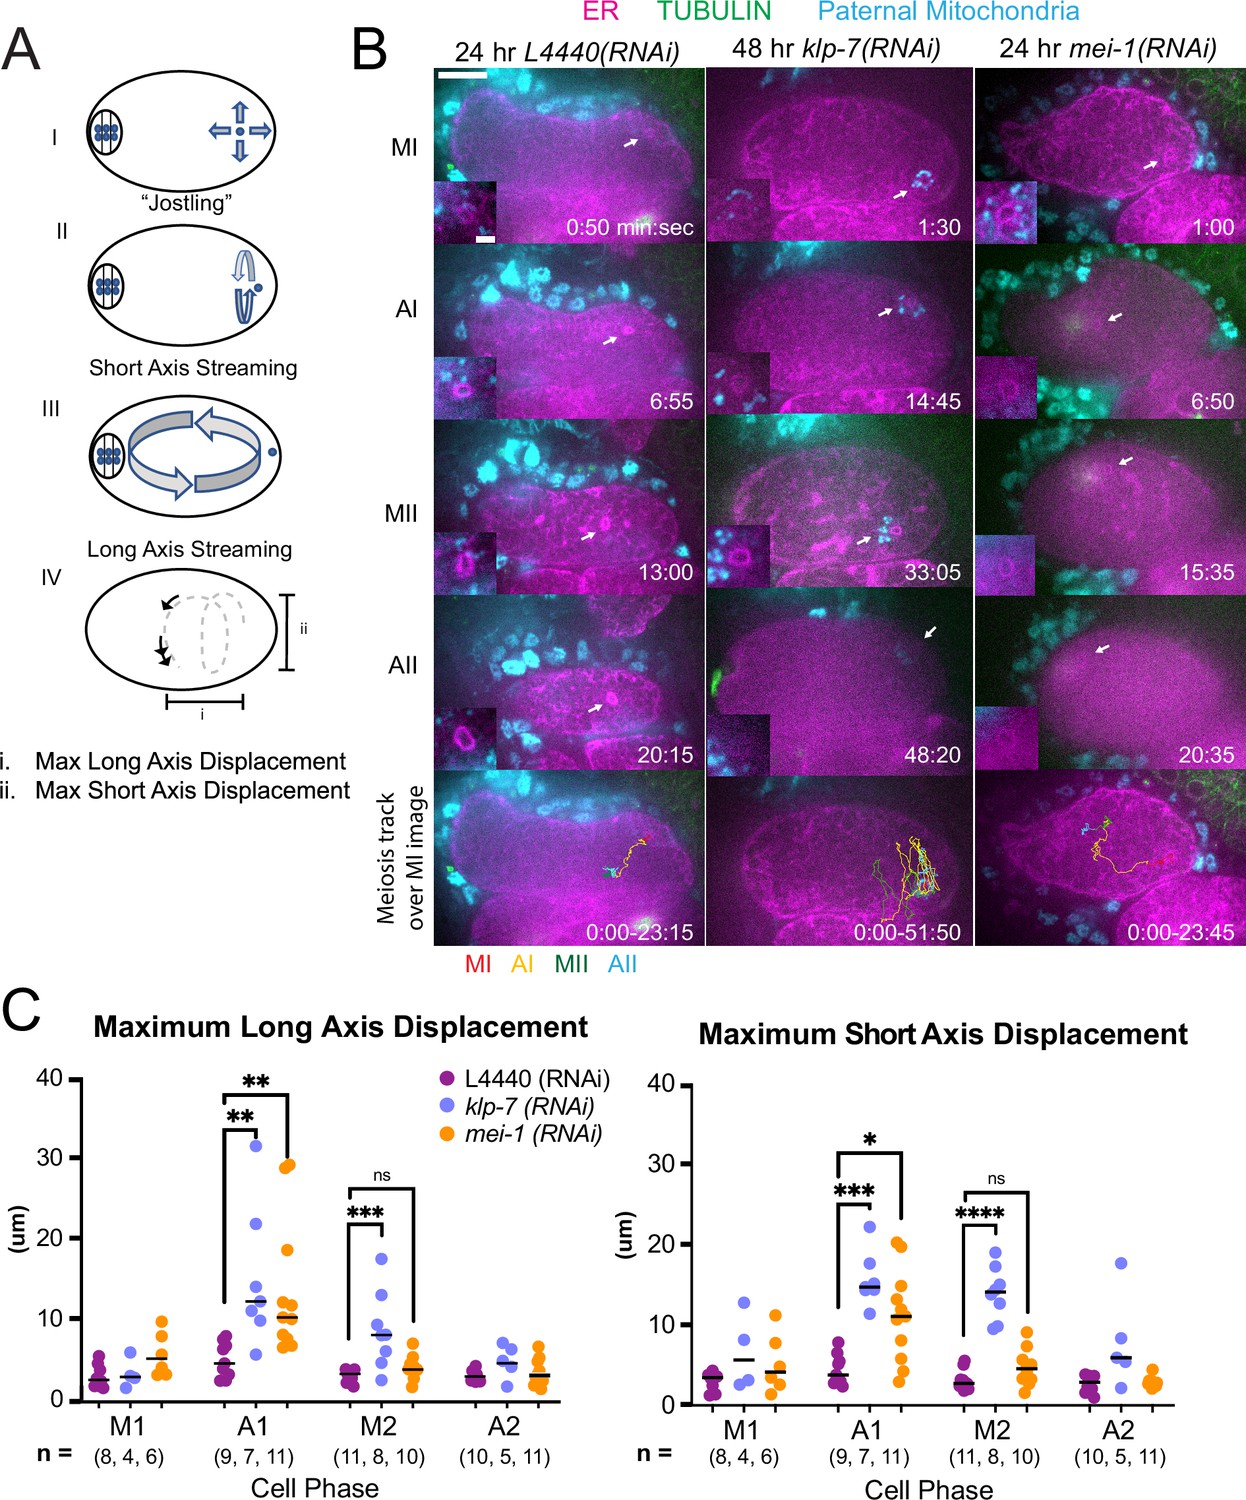
MEI-1katanin and KLP-7kinesin-13 limit meiotic cytoplasmic streaming of the sperm contents.
(A) Illustration of paternal DNA dynamics in meiotic embryo. (I) ‘Jostling’ denotes random movements without specific direction. (II), (III) Short-axis and long-axis streaming refers to rotation around short and long-axis, respectively. (IV) Illustration of measurements taken from tracks following course of paternal DNA. (B) Live imaging of GFP::SP12 (ER); mKATE::TUBULIN embryos with Deep Red MitoTracker stained paternal mitochondria from fog-2(q71) males. Timelapse frames after control treatment with L4440(RNAi). Timelapse images after treatment with klp-7(RNAi) showing sperm streaming in the short-axis of the embryo. Timelapse images after treatment with mei-1(RNAi) showing sperm contents streaming long-axis of the embryo. Tracks show movement of paternal DNA throughout each cell phase. Arrows denote endoplasmic reticulum (ER) ring around paternal DNA. 5 s intervals. Time zero is once embryo fully exited the spermatheca into the uterus. Bars: (whole embryo) 10 µm; (inset) 2 µm. MI, metaphase I; AI, anaphase I; MII, metaphase II; AII, anaphase II. (C) Measurements of max x-axis and y-axis displacement of tracks following course of paternal DNA throughout different phases. *p<0.05, **p<0.01, ***p<0.001 ****p<0.0001 Kruskal Wallis Test.
Figure 5—figure supplement 1

Distance of the sperm contents from the cortex of control embryos at metaphase I vs anaphase I.
Figure 5—video 1
Movement of sperm contents in control L4440(RNAi) meiotic embryo expressing GFP::SPCS-1 (endoplasmic reticulum, ER in magenta), mKate::tubulin (not in focal plane), and paternal mitochondria labeled with Mitotracker Deep Rd (cyan).
Track colors indicate cell-cycle phase as shown in Figure 5B.
Figure 5—video 2
Movement of sperm contents in mei-1(RNAi) meiotic embryo expressing GFP::SPCS-1 (endoplasmic reticulum, ER in magenta), mKate::tubulin (green), and paternal mitochondria labeled with Mitotracker Deep Rd (cyan).
Track colors indicate cell-cycle phase as shown in Figure 5B.
Figure 5—video 3
Movement of sperm contents in klp-7(RNAi) meiotic embryo expressing GFP::SPCS-1 (endoplasmic reticulum, ER in magenta), mKate::tubulin (green), and paternal mitochondria labeled with Mitotracker Deep Rd (cyan).
Figure 5—video 4
Movement of sperm contents, maternal endoplasmic reticulum (ER), and maternal yolk granules increases at anaphase onset when sheet-like ER disperses.
In utero time-lapse sequence of meiotic embryo transitioning from metaphase I to anaphase I. ER labeled with HALO-ER (green), yolk granules labeled with GFP::VIT-2 (cyan), paternal mitochondria labeled with SDHC-1::mCherry (red).
Figure 6 with 1 supplement
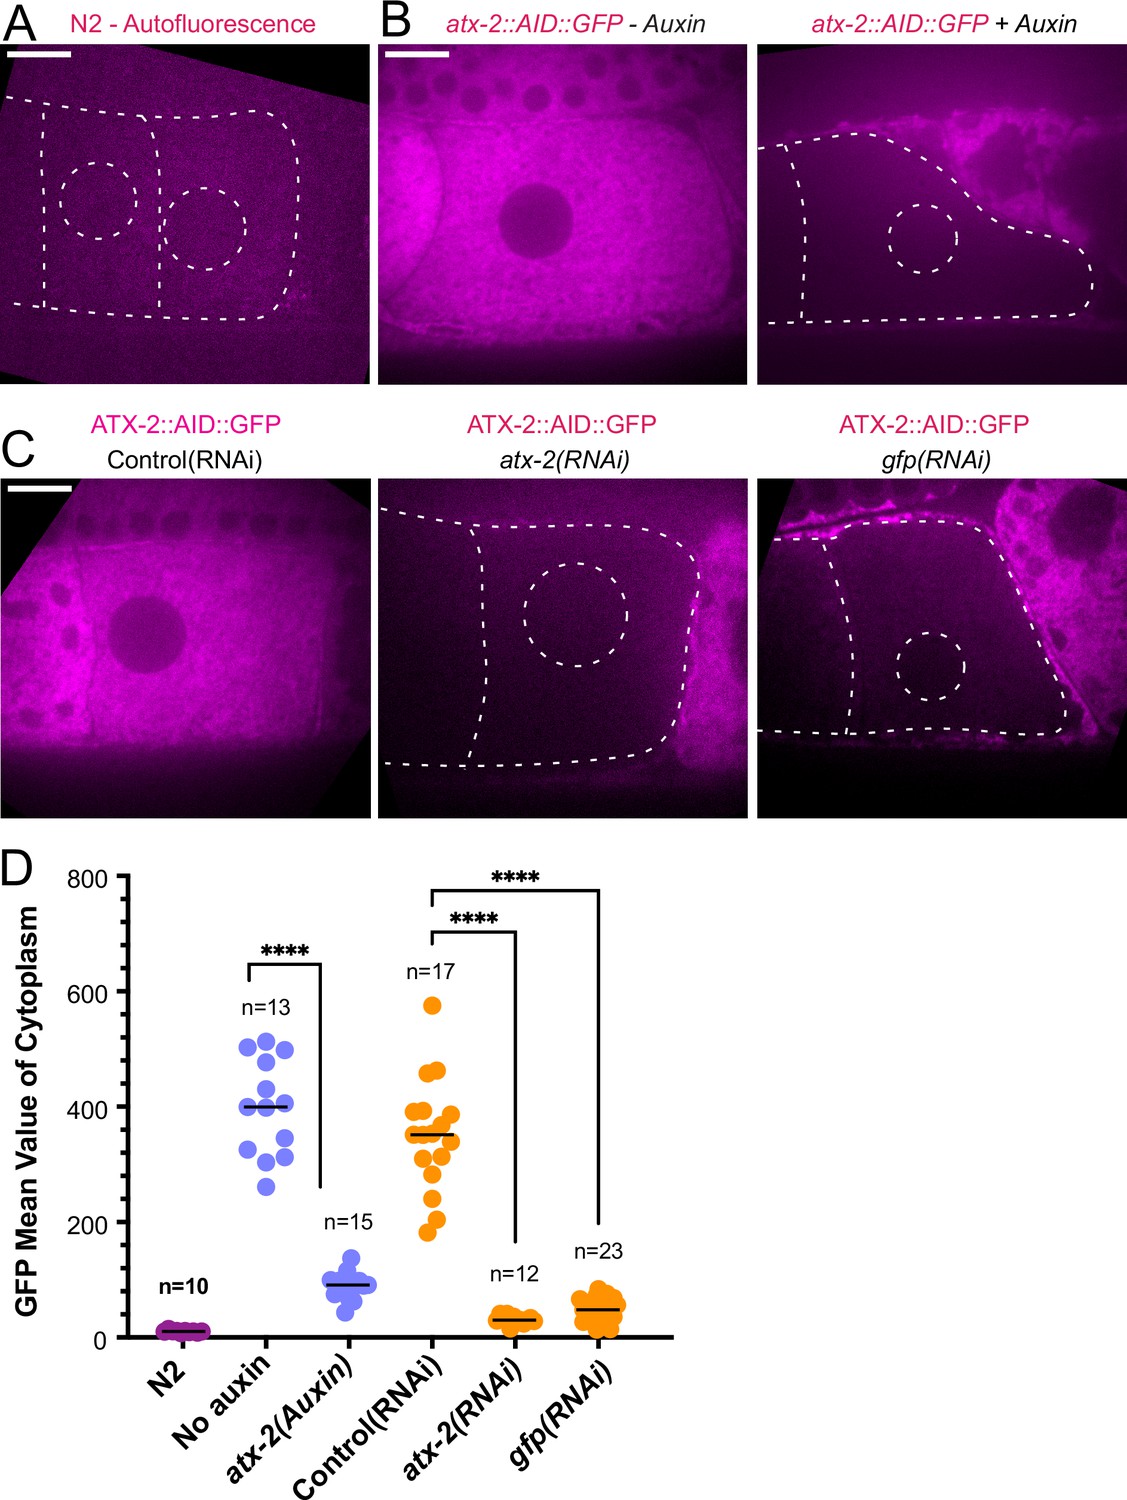
ATX-2 is depleted by three different methods.
(A) Single plane live image of N2 (no GFP). Autofluorescence shows dim outline of oocytes and germinal vesicle. (B–C) Single plane live images of –1 oocytes in strain with ATX-2::AID::GFP. No auxin treatment shows endogenous GFP-tagged ATX-2 fluorescence throughout the cytoplasm. Auxin treatment results in depletion of ATX-2 in oocytes. (C) Live images of –1 oocytes in strain with ATX-2::AID::GFP. Control L4440(RNAi) shows ATX-2 throughout the cytoplasm, but ATX-2 is depleted after 27 hr atx-2(RNAi) or 24 hr gfp(RNAi). (A–C) Bars, 10 µm. (D) Mean GFP fluorescence in the cytoplasm of –1 oocytes after each treatment. ****p<0.0001 by Welch’s t-test and Brown-Forsythe test.
Figure 6—figure supplement 1
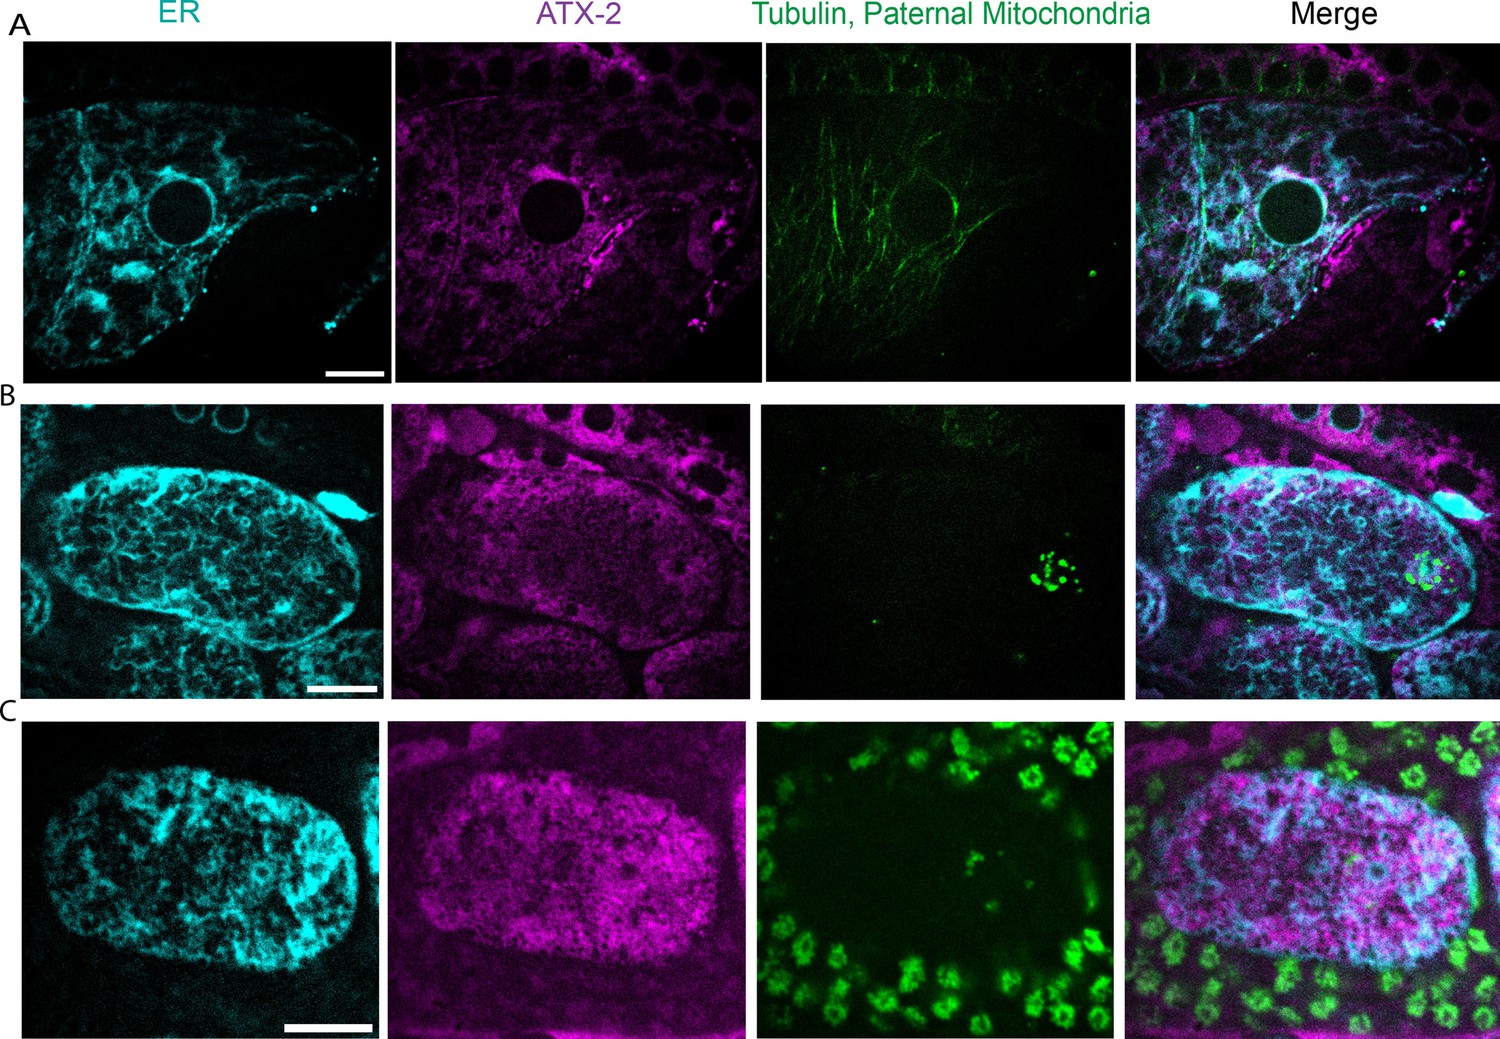
Localization of ATX-2 in –1 oocyte and +1 meiotic embryo.
Deconvolved single plane images from z-stacks acquired on a spinning-disk confocal. (A) –1 oocyte (n=10). (B) Metaphase meiotic embryo (n=10). (C) Anaphase meiotic embryo (n=4). Endoplasmic reticulum (ER) labeled with HALO-tag with the signal peptide and ER retention signal from HSP-3. Endogenous ATX-2::AID::GFP. mKate::Tubulin. Paternal mitochondria labeled with SDHC-1::mCherry. All Bars = 10 µm.
Figure 7
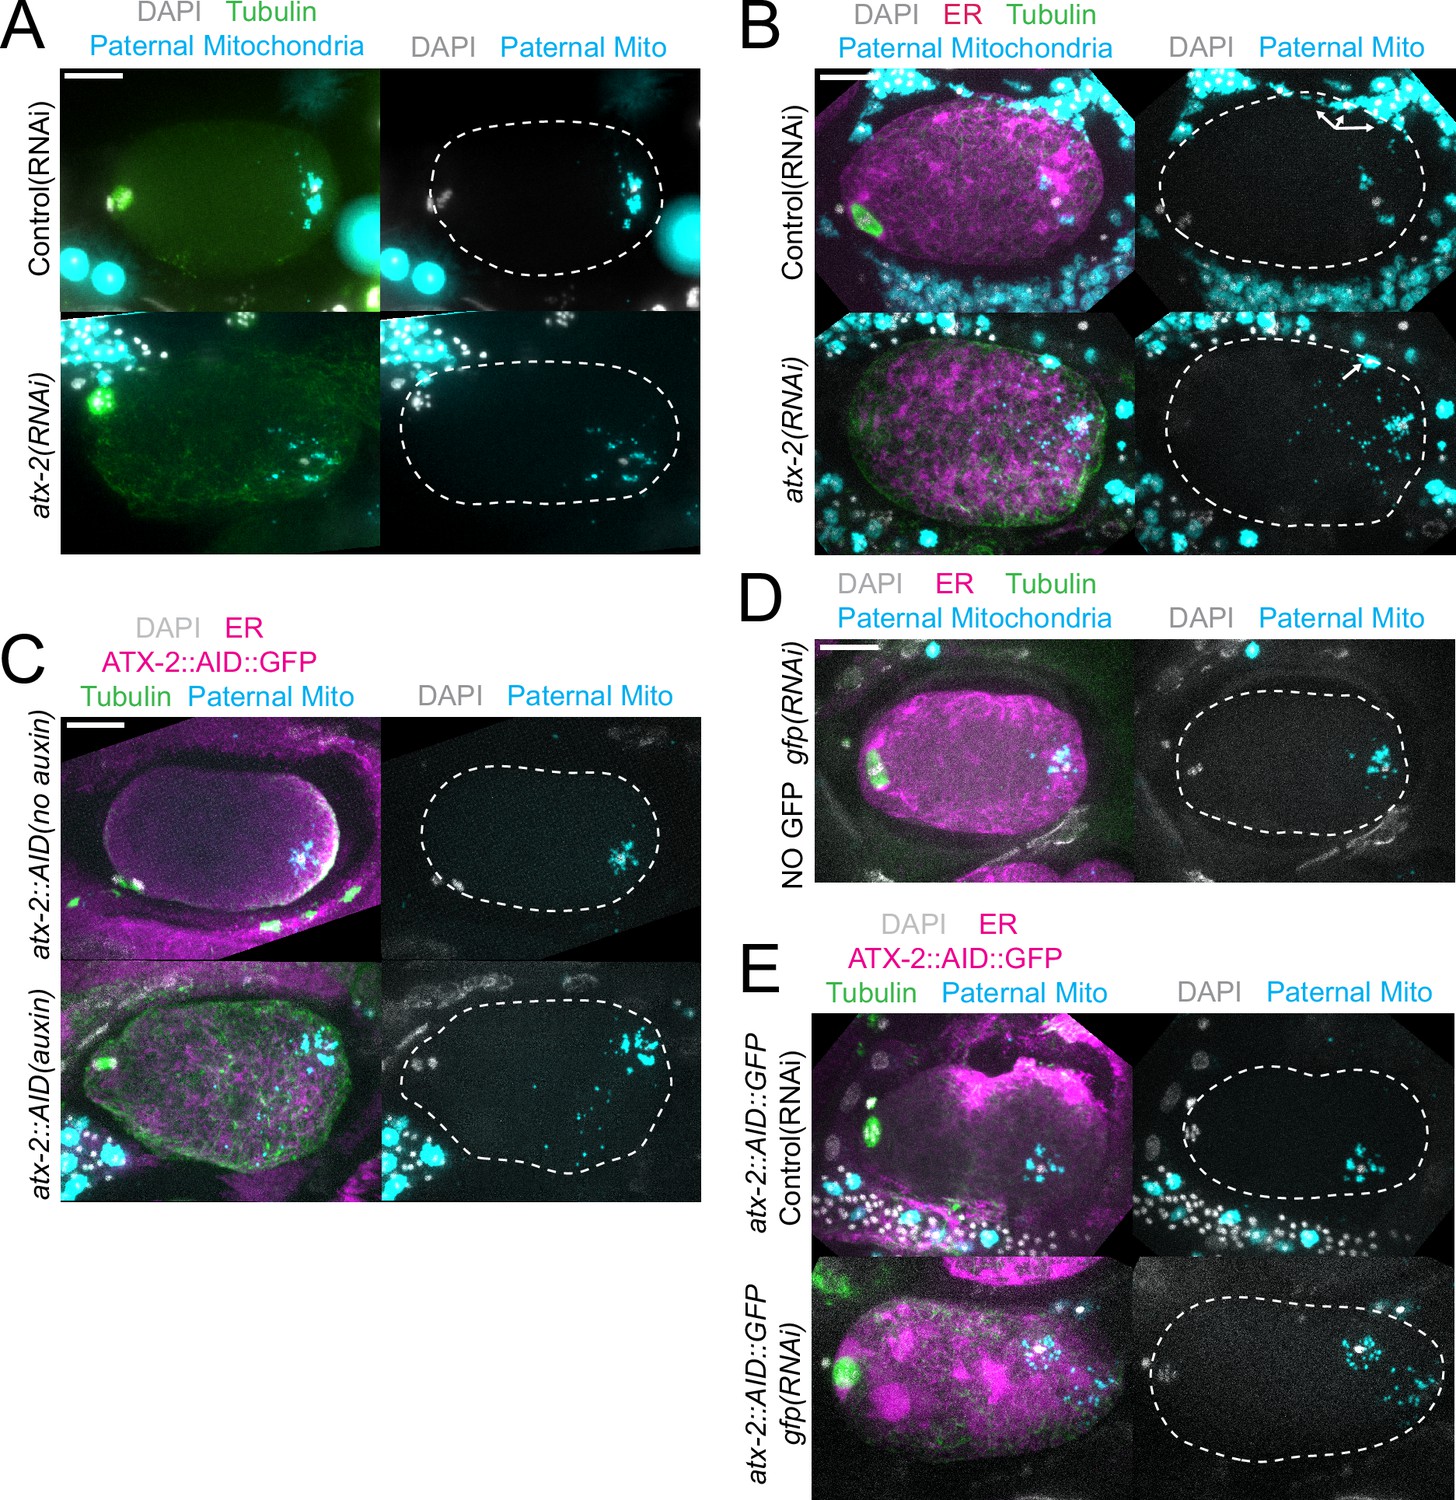
Paternal mitochondria scatter during meiosis after ATX-2 depletion.
(A–E) Maximum intensity projections of z-stacks of fixed meiotic embryos stained with tubulin antibodies and DAPI and with paternal mitochondria labeled by mating with MitoTracker Deep Red FM treated fog-2(q71) males. (A) N2 wild-type embryos treated with control L4440(RNAi) or atx-2(RNAi). (B, C, E) Embryos expressing TIR1, GFP::SPCS-1/ER, mKate::TBA-2, and with endogenously tagged ATX-2::AID::GFP. (B) 27 hr control L4440(RNAi) or atx-2(RNAi). Arrows denote mitochondrial fluorescence from sperm outside the embryo overlapping with the embryo as a result of the maximum intensity projection. (C) No auxin or 1 hr auxin treatment. (D) GFP(RNAi) on strain with no tag on ATX-2 but expressing GFP::SPCS-1/ER and mKate::TBA-2. GFP::SPCS-1/ER fluorescence remains because SPCS-1 and ATX-2 are tagged with GFPs with different sequences. (E) Control L4440(RNAi) or gfp(RNAi) of ATX-2::AID::GFP strain. Bars, 10 µm. White dotted outlines indicate the cortex of the cell.
Figure 8
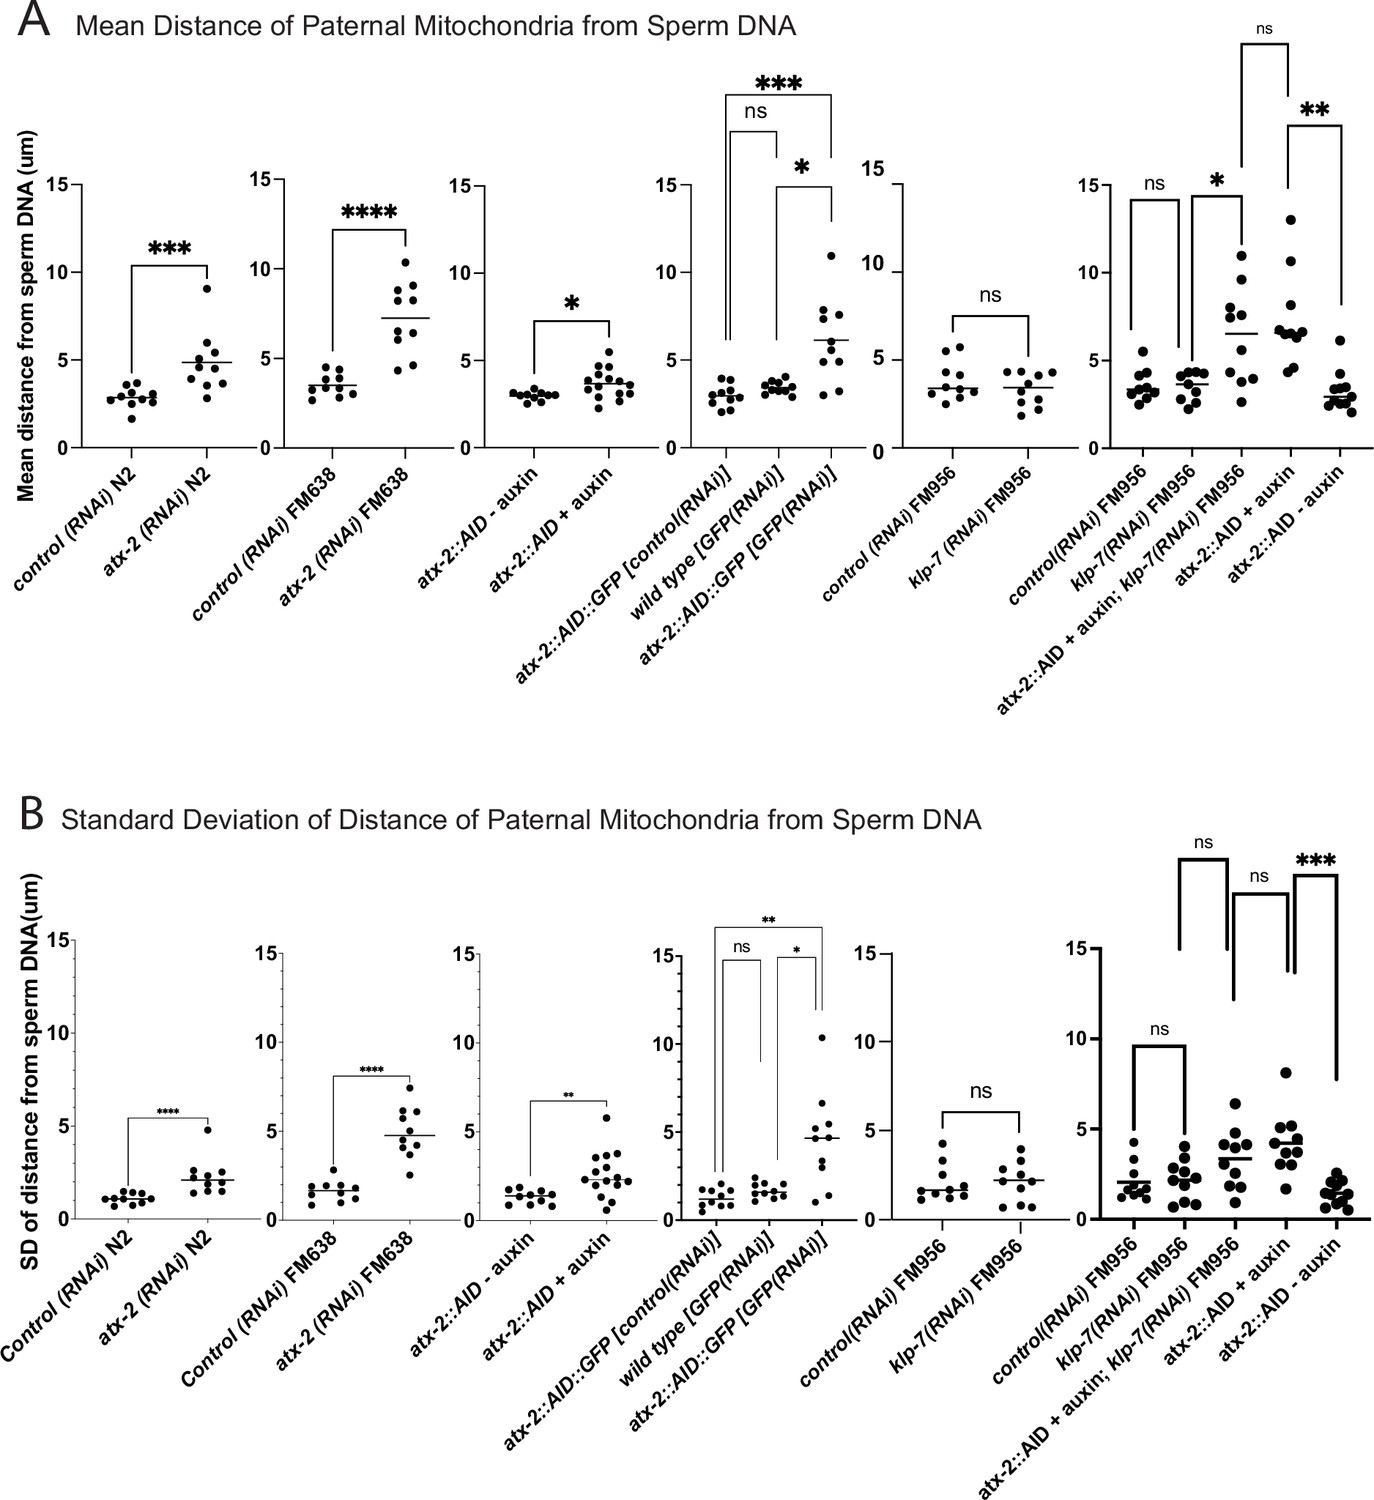
Quantification of paternal mitochondrial scatter in ATX-2-depleted anaphase I meiotic embryos.
(A) Mean and (B) standard deviation of the distance of individual paternal mitochondria from the sperm DNA determined from Z-stacks of fixed anaphase I embryos. Each dot represents one embryo. Distances for individual mitochondria are in Supplementary data file.
Figure 9 with 1 supplement
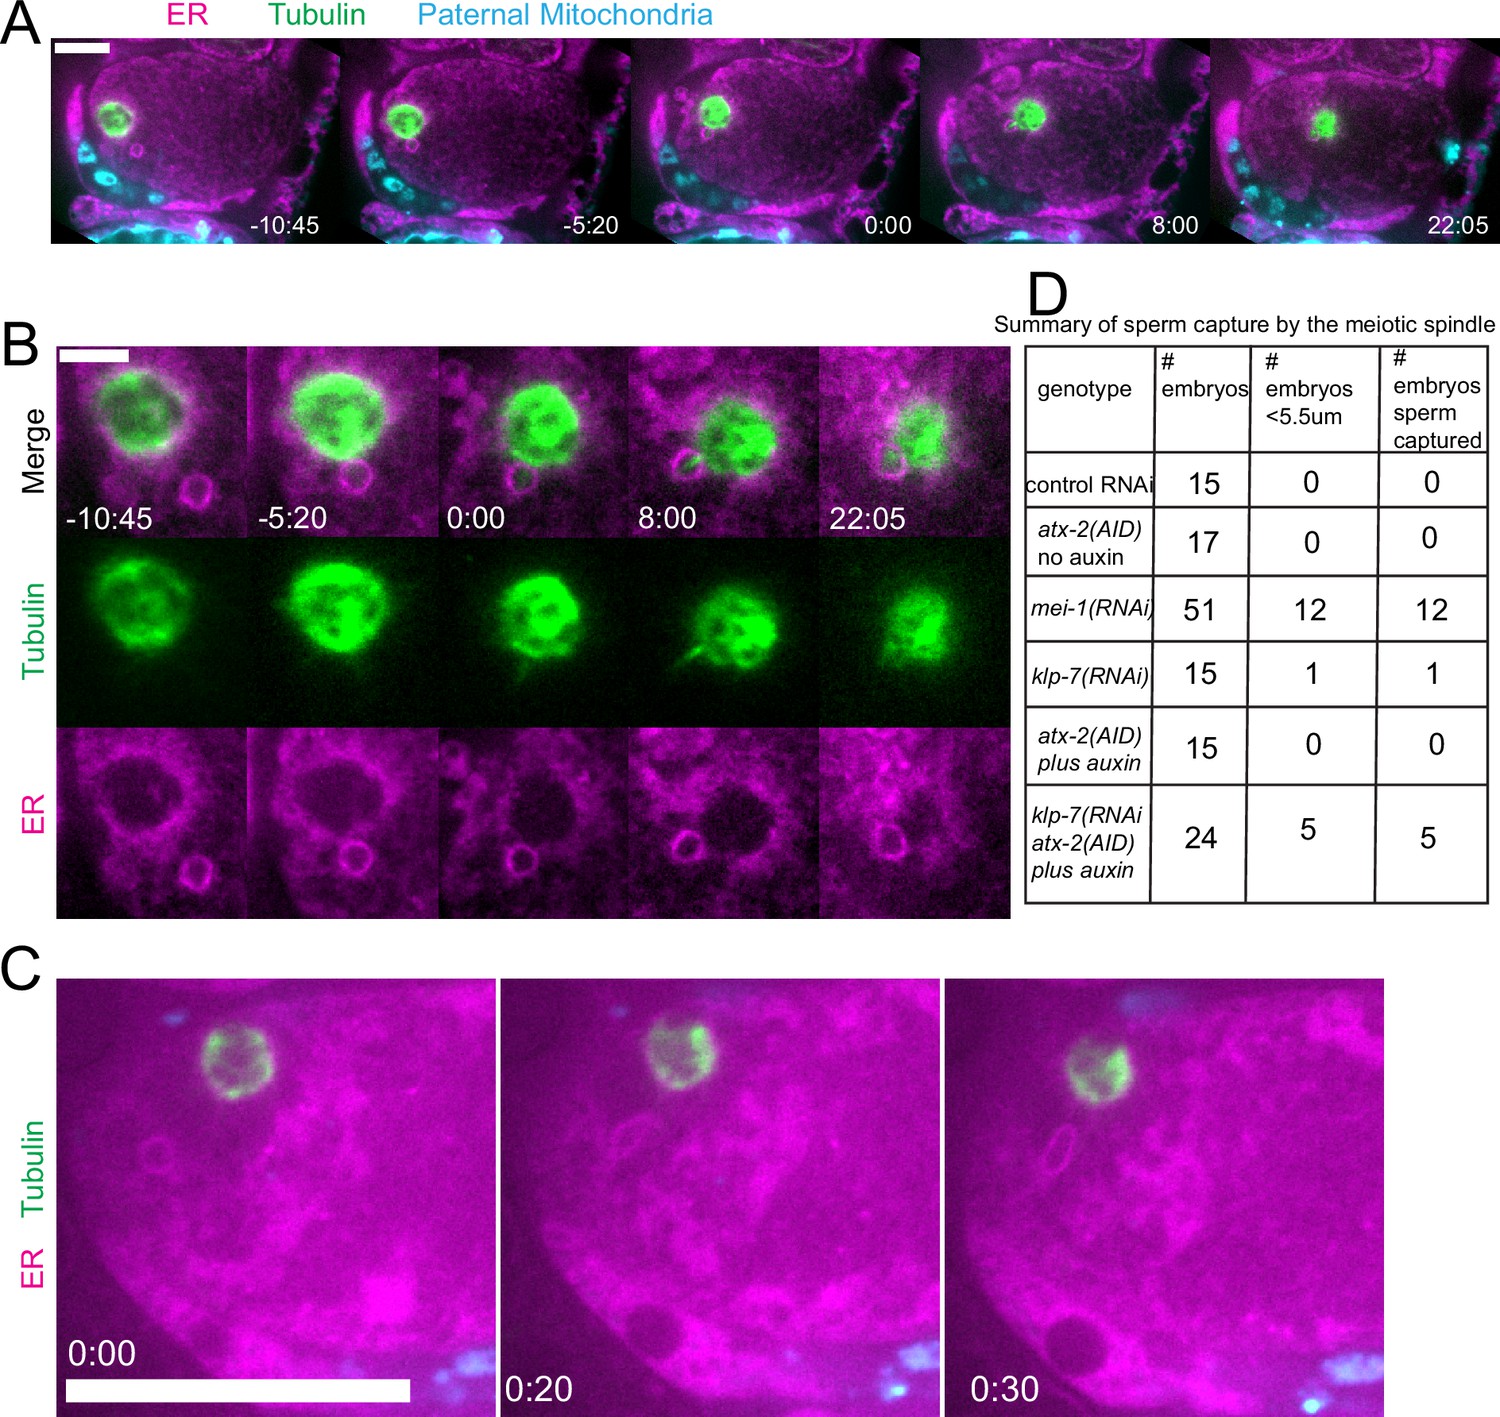
Capture of the sperm DNA by the meiotic spindle in KLP-7 ATX-2 double depleted meiotic embryos.
(A) Live imaging of GFP::SP12/ER; mKATE::TUB; ATX-2::AID::GFP meiotic embryo with Deep Red MitoTracker stained paternal mitochondria from fog-2(q71) males mated in. Hermaphrodites were treated with atx-2/klp-7 (auxin/RNAi). 5/24 videos had sperm ring travel within <5.5 µm of spindle (measured center to center). Of those videos, 5/5 resulted in a microtubule bridge between the spindle and the middle of the sperm ring. (B) Higher magnification of (A). (C) Example of endoplasmic reticulum (ER) ring around the sperm DNA stretching toward the spindle. (D) Summary of capture events. Bars: (whole embryo) 10 µm; (inset) 5 µm.
Figure 9—figure supplement 1

Cytoplasmic streaming after ATX-2 depletion.
Maximum displacement of the sperm contents during any meiotic cell-cycle phase in ATX-2::AID::GFP embryos with or without 1 hr auxin.
Additional files
-
Supplementary file 1
C. elegans strains used in this study.
- https://cdn.elifesciences.org/articles/97812/elife-97812-supp1-v1.docx
-
Source data 1
Excel spreadsheet of all numerical data values.
- https://cdn.elifesciences.org/articles/97812/elife-97812-data1-v1.xlsx
-
MDAR checklist
- https://cdn.elifesciences.org/articles/97812/elife-97812-mdarchecklist1-v1.pdf
Download links
A two-part list of links to download the article, or parts of the article, in various formats.
Downloads (link to download the article as PDF)
Open citations (links to open the citations from this article in various online reference manager services)
Cite this article (links to download the citations from this article in formats compatible with various reference manager tools)
Katanin, kinesin-13, and ataxin-2 inhibit premature interaction between maternal and paternal genomes in C. elegans zygotes
eLife 13:RP97812.
https://doi.org/10.7554/eLife.97812.3


