CPT1A mediates radiation sensitivity in colorectal cancer
- Department of Microbiology, Guangdong Provincial Key Laboratory of Tropical Disease Research, School of Public Health, Southern Medical University, China
- Department of Radiation Oncology, Nanfang Hospital, Southern Medical University, China
- State Key Laboratory of Organ Failure Research, Key Laboratory of Infectious Diseases Research in South China, Ministry of Education, Guangdong Provincial Key Laboratory of Viral Hepatitis Research, Guangdong Provincial Clinical Research Center for Viral Hepatitis, Department of Infectious Diseases, Nanfang Hospital, Southern Medical University, China
- Department of Pathology, Nanfang Hospital and School of Basic Medical Science, Southern Medical University, China
- HuiQiao Medical Center, Nanfang Hospital, Southern Medical University, China
Figures
Figure 1
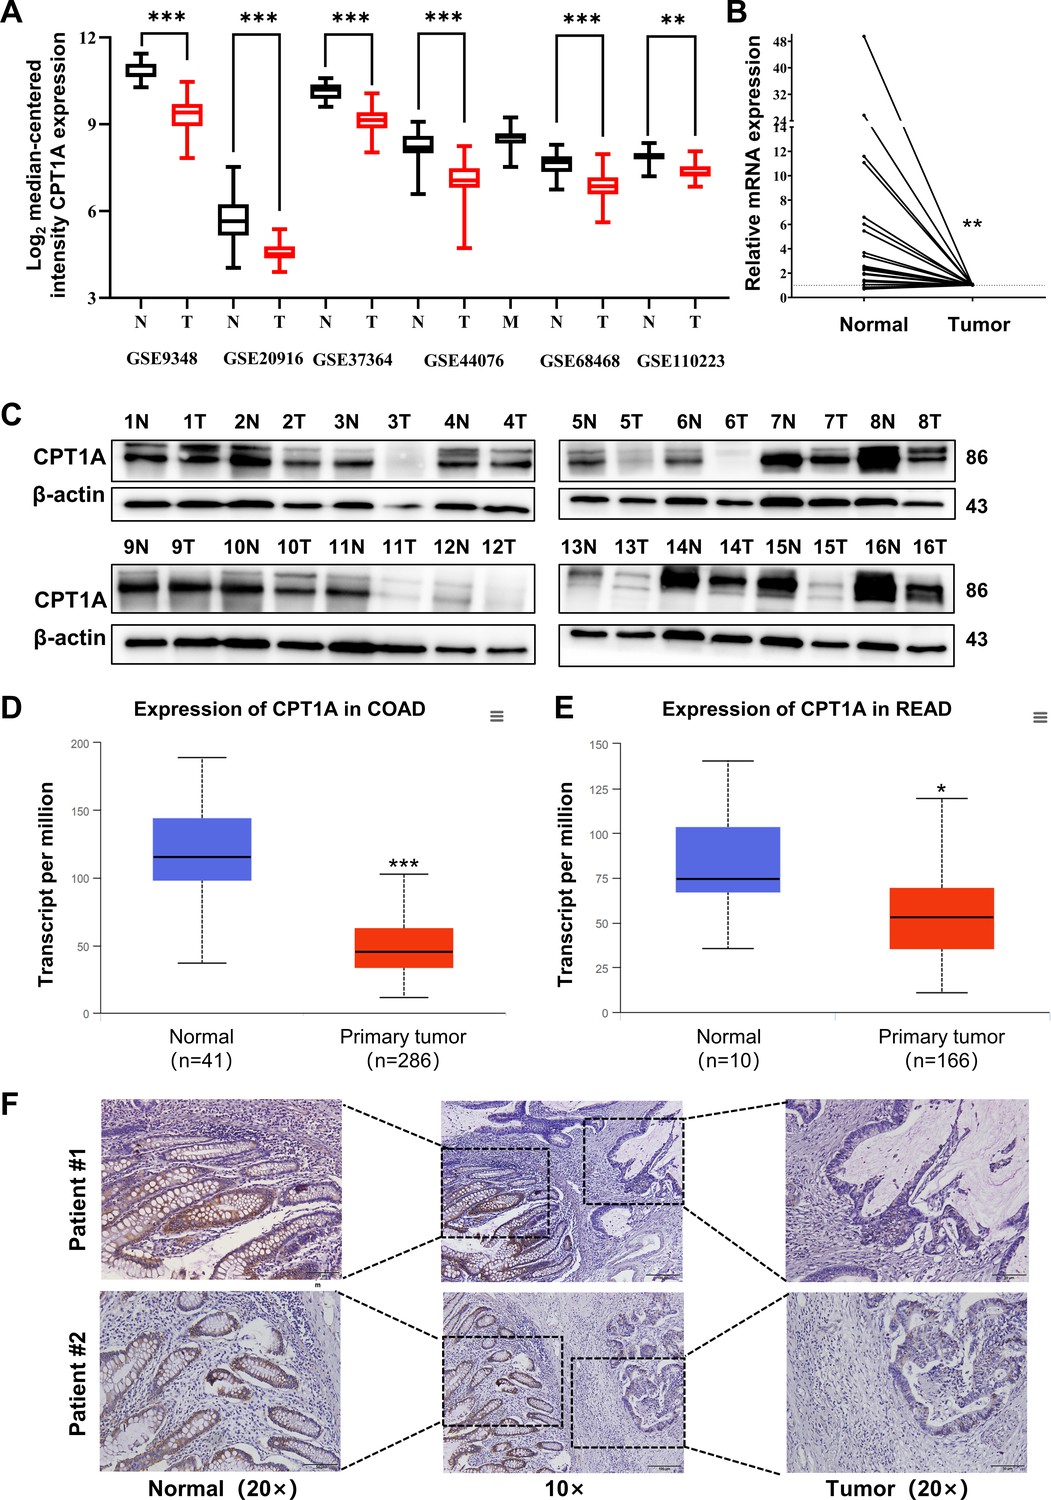
Aberrant CPT1A mRNA level in colorectal cancer (CRC).
(A) The expression of CPT1A in six GEO microarrays. (B) Real-time PCR for CPT1A in 24-paired CRC and adjacent non-tumour tissues. (C) Western blot for CPT1A in 16-paired CRC and adjacent non-tumour tissues. (D) Lower CPT1A mRNA level in colon adenocarcinoma (COAD) than the normal counterparts from TCGA in UALCAN database. (E) Lower CPT1A mRNA level in rectal adenocarcinoma (READ) than the normal counterparts from TCGA in UALCAN database. (F) Immunohistochemistry (IHC) assay for CPT1A in two patients, scale bar = 100μm. ***p<0.001, **p<0.01, *p<0.05.
-
Figure 1—source data 1
Original files for western blot analysis displayed in Figure 1C.
- https://cdn.elifesciences.org/articles/97827/elife-97827-fig1-data1-v1.zip
-
Figure 1—source data 2
PDF file containing original western blots for Figure 1C.
- https://cdn.elifesciences.org/articles/97827/elife-97827-fig1-data2-v1.zip
Figure 2
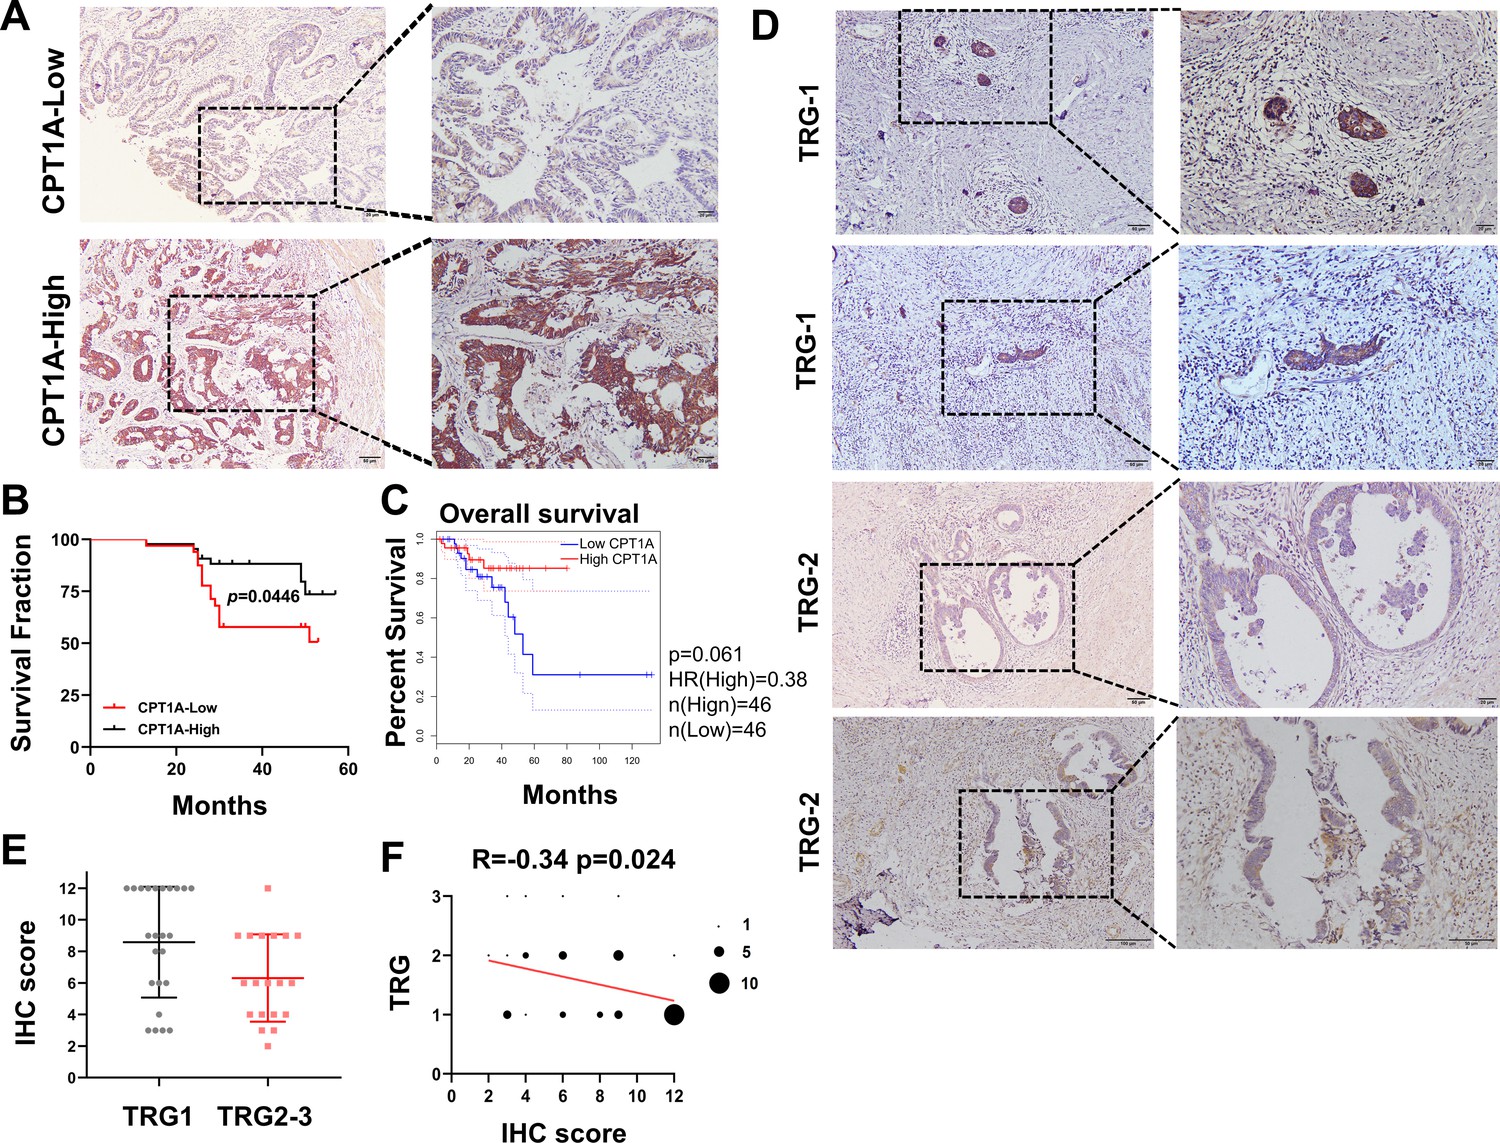
Correlation of CPT1A with overall survival (OS) and neoadjuvant therapy response in rectal cancer patients.
(A) Immunohistochemistry (IHC) assay for CPT1A in two groups of patients, upper with low CPT1A expression and lower with high CPT1A expression (IHC score≥6). (B) The OS was estimated by the Kaplan-Meier method in rectal cancer patients with low (n=33) or high CPT1A expression (n=43). (C) The OS was estimated by the Kaplan-Meier method in rectal cancer patients in TCGA database with low (n=46) or high CPT1A expression (n=46). (D) IHC assay for CPT1A in two groups of patients, upper with TRG-1 and lower with TRG-2 (TRG means tumour regression grade, AJCC standard, 0, complete response: no remaining viable cancer cells; 1, moderate response: only small clusters or single cancer cells remaining; 2, minimal response: residual cancer remaining, but with predominant fibrosis), scale bar = 100μm. . (E) Dot plot showing the IHC score and TRG score of patients. (F) Correlation of CPT1A with TRG score, size of dot represents the number. ***p<0.001, **p<0.01, *p<0.05.
Figure 3 with 2 supplements
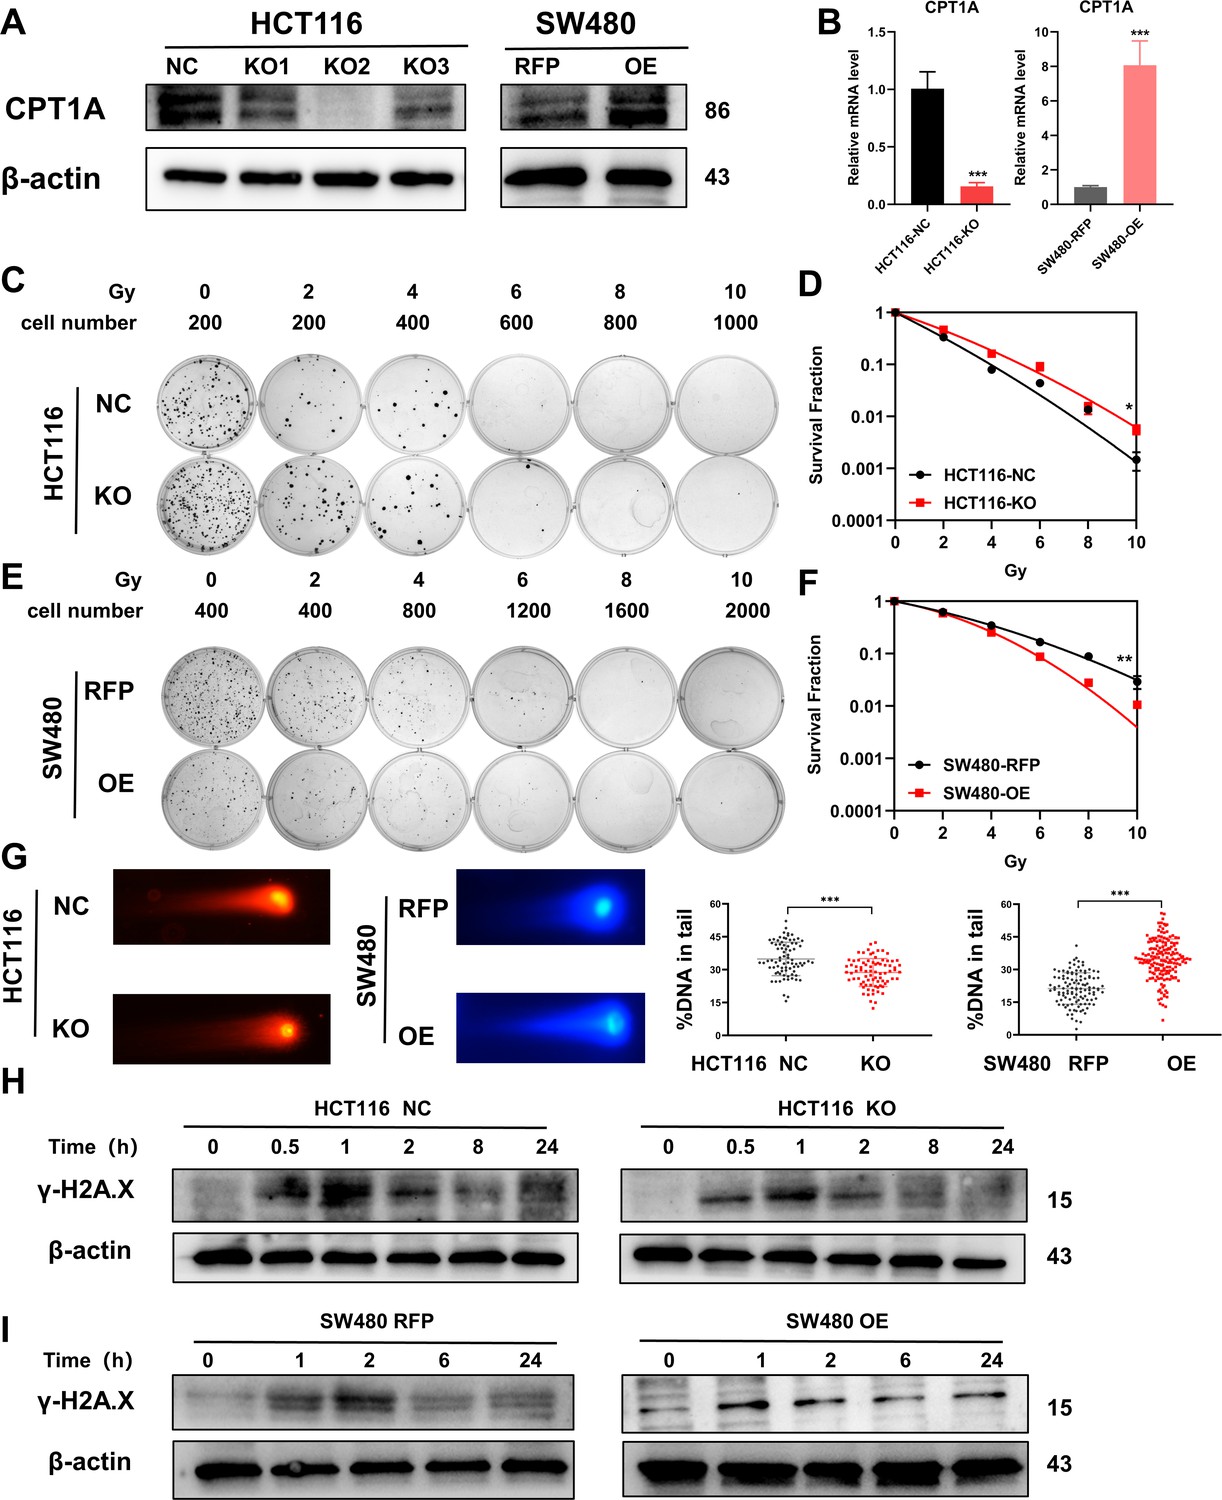
Radiosensitivity of stable knockout or overexpression of CPT1A.
(A) The protein level of CPT1A in HCT 116-NC, HCT 116-KO1, HCT 116-KO2, HCT 116-KO3, SW480-RFP, and SW480-OE cell lines. (B) The mRNA level of CPT1A in HCT 116-NC, HCT 116-KO (KO2), SW480-RFP, and SW480-OE cell lines. (C) Colony-forming assay of HCT 116-NC and HCT 116-KO cell lines. (D) The map of multi-target single-hit model. (E) Colony-forming assay of SW480-RFP and SW480-OE cell lines. (F) The map of multi-target single-hit model. (G) Comet assay of HCT 116-NC, HCT 116-KO, SW480-RFP, and SW480-OE. (H) Protein expression of γ-H2A.X in HCT 116-NC and HCT 116-KO cell lines. (I) Protein expression of γ-H2A.X in SW480-RFP and SW480-OE cell lines. ***p<0.001, **p<0.01, *p<0.05.
-
Figure 3—source data 1
Original files for western blot analysis displayed in Figure 3.
- https://cdn.elifesciences.org/articles/97827/elife-97827-fig3-data1-v1.zip
-
Figure 3—source data 2
PDF file containing original western blots for Figure 3.
- https://cdn.elifesciences.org/articles/97827/elife-97827-fig3-data2-v1.zip
Figure 3—figure supplement 1
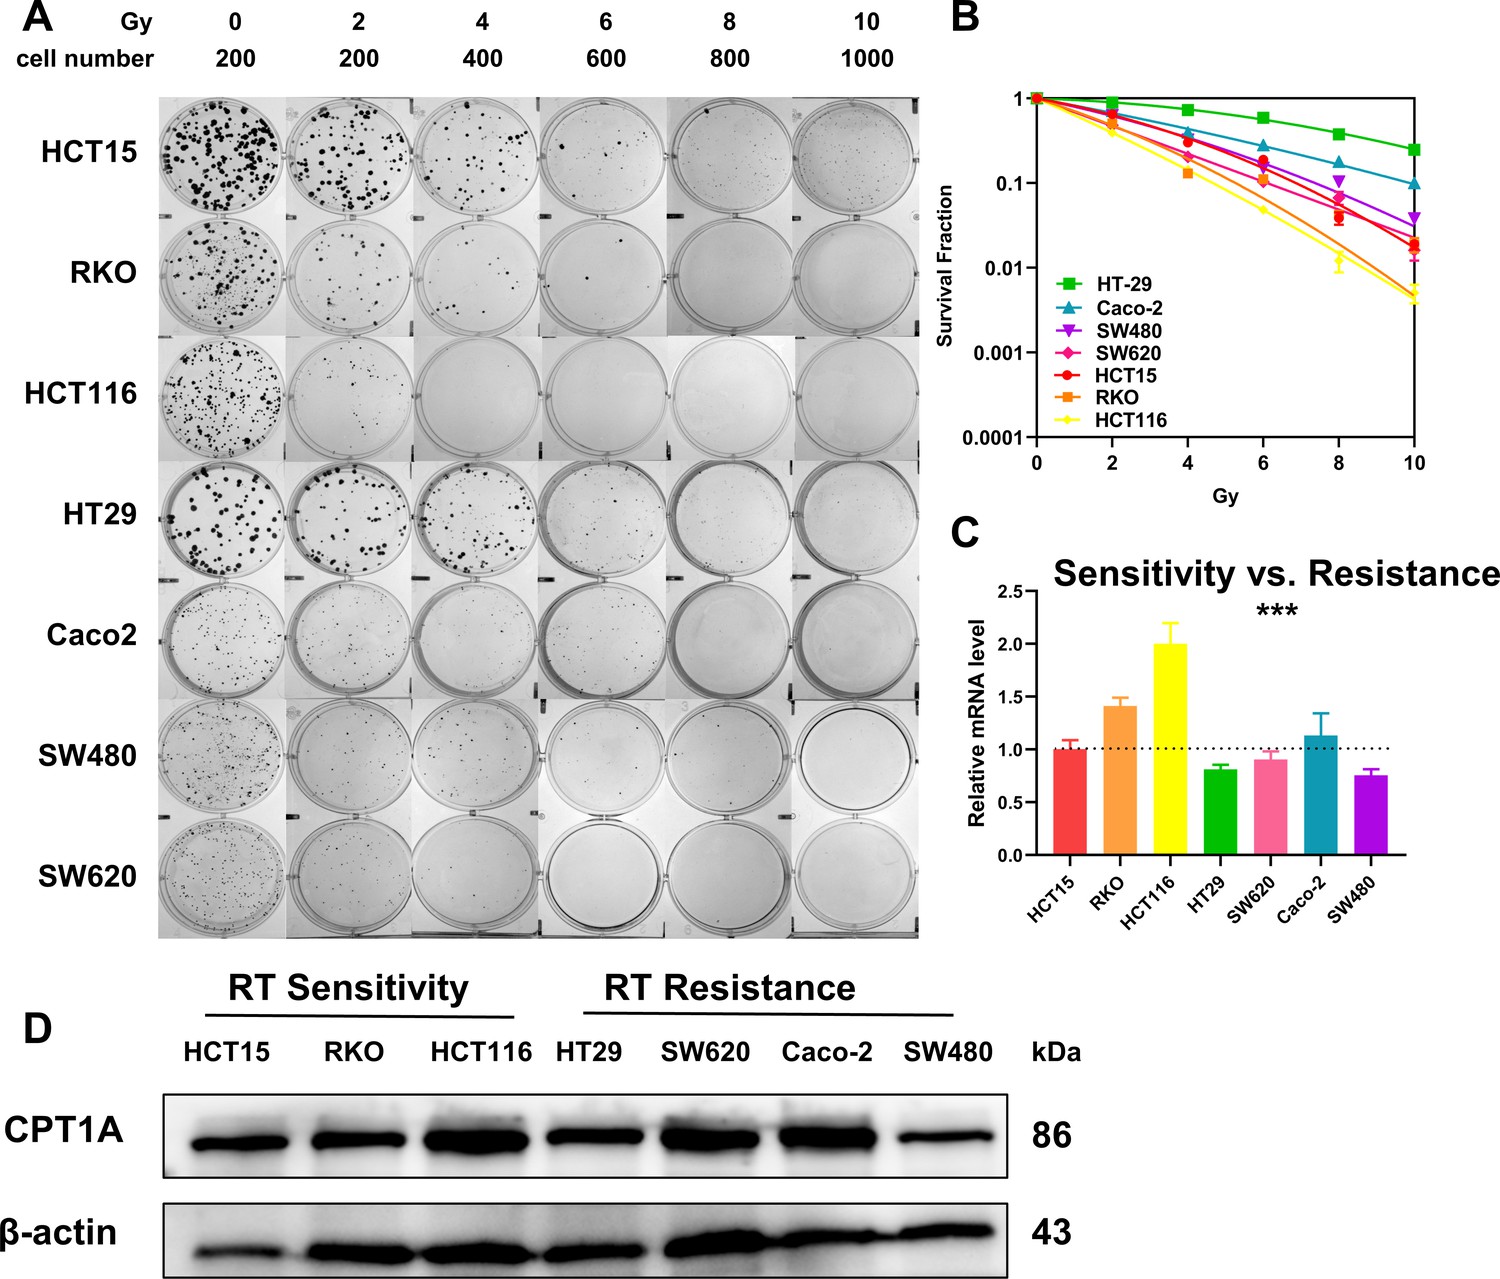
The level of CPT1A in different colorectal cancer (CRC) cell lines.
(A) Colony-forming assay in different cell lines. (B) The map of multi-target single-hit model. (C) The mRNA level of CPT1A in different cell lines. (D) The protein level of CPT1A in different cell lines. ***p<0.001.
-
Figure 3—figure supplement 1—source data 1
Original files for western blot analysis displayed in Figure 3—figure supplement 1.
- https://cdn.elifesciences.org/articles/97827/elife-97827-fig3-figsupp1-data1-v1.zip
-
Figure 3—figure supplement 1—source data 2
PDF file containing original western blots for Figure 3—figure supplement 1.
- https://cdn.elifesciences.org/articles/97827/elife-97827-fig3-figsupp1-data2-v1.zip
Figure 3—figure supplement 2
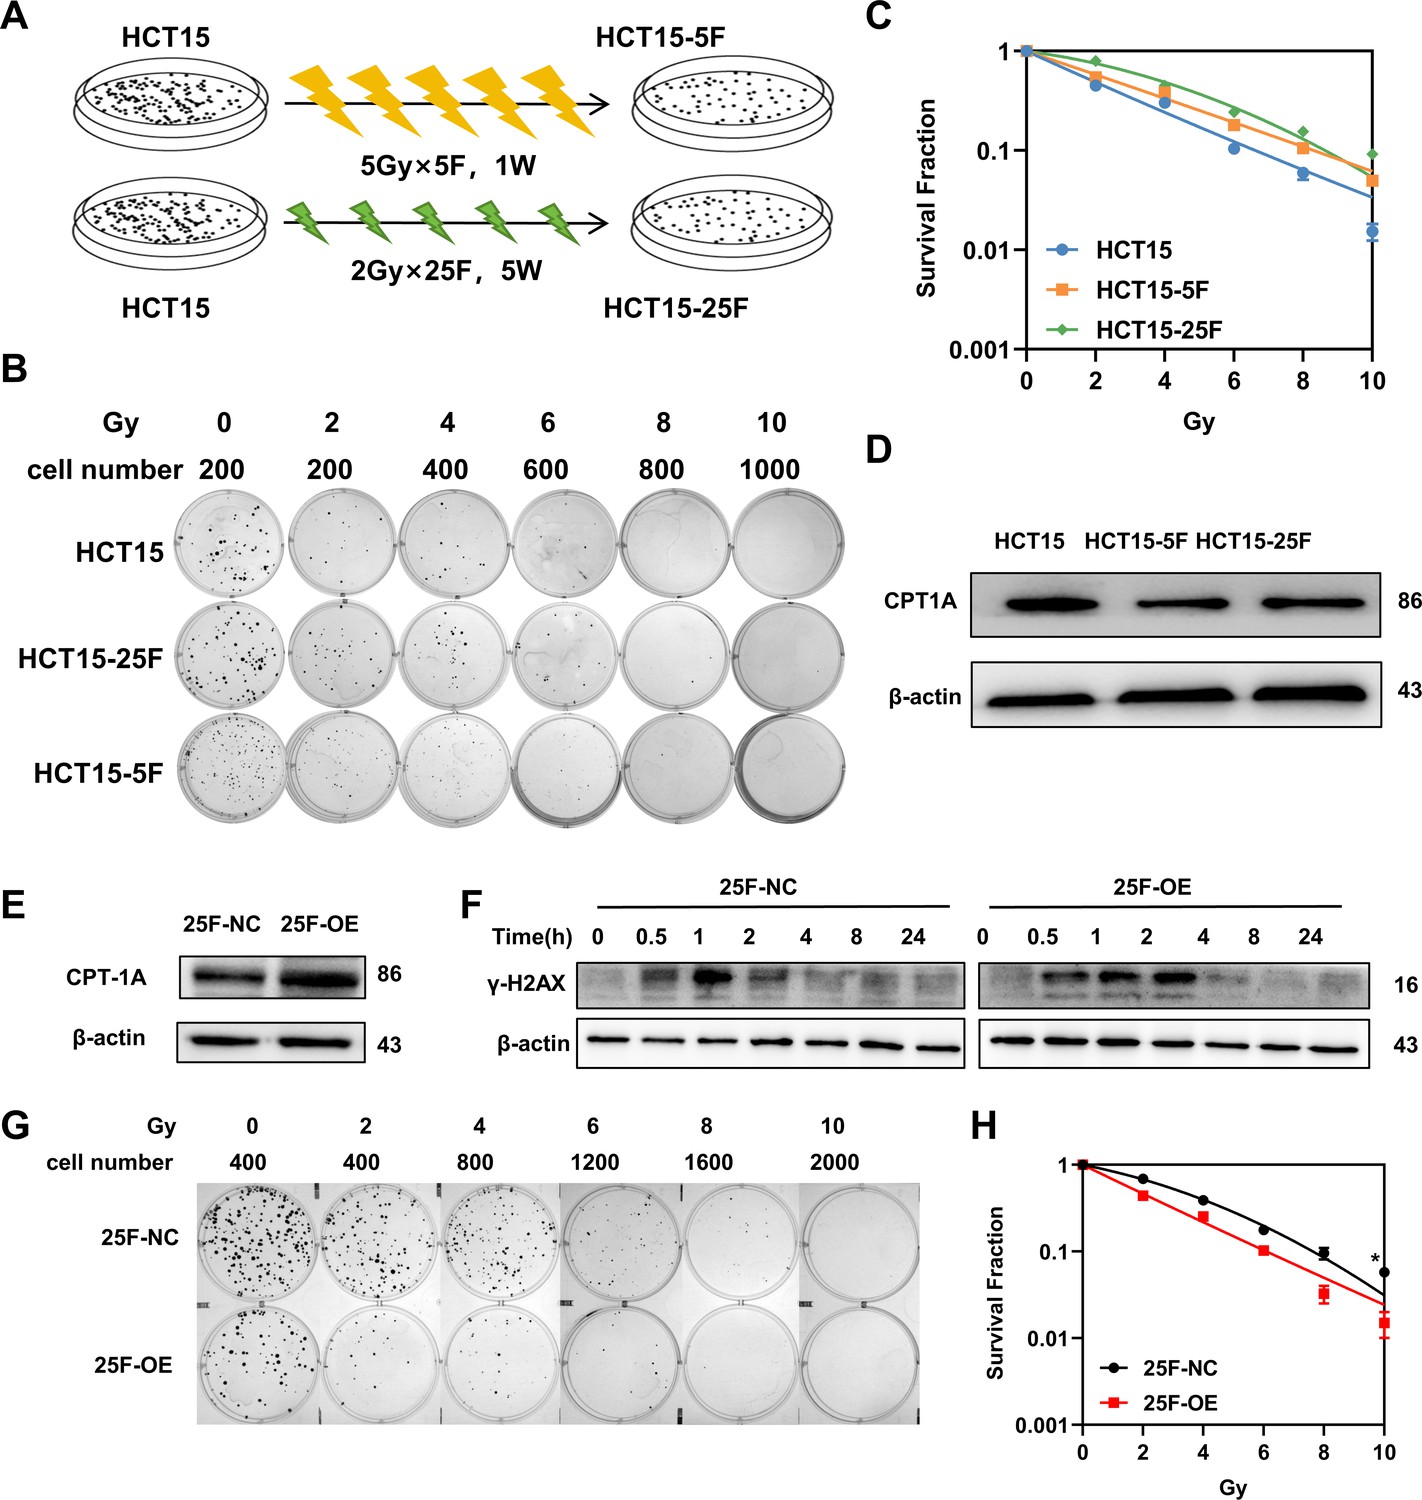
Establishment of radioresistance cells and overexpression of CPT1A rescues the radiation resistance of HCT-15-25F cells.
(A) Workflow of establishment of radioresistance cells. F, fraction; W, week. (B) Colony-forming assay in different cell lines. (C) The map of multi-target single-hit model. (D) The protein level of CPT1A in radioresistance cells. (E) Western blot for CPT1A in HCT-15-25F cell line after transfected with overexpression lentivirus. (F) Protein expression of γ-H2A.X in HCT-15-25F-NC and HCT-15-25F-OE cell lines. (G) Colony-forming assay in different cell lines. (H) The map of multi-target single-hit model. ***p<0.001, **p<0.01, *p<0.05.
-
Figure 3—figure supplement 2—source data 1
Original files for western blot analysis displayed in Figure 3—figure supplement 2.
- https://cdn.elifesciences.org/articles/97827/elife-97827-fig3-figsupp2-data1-v1.zip
-
Figure 3—figure supplement 2—source data 2
PDF file containing original western blots for Figure 3—figure supplement 2.
- https://cdn.elifesciences.org/articles/97827/elife-97827-fig3-figsupp2-data2-v1.zip
Figure 4
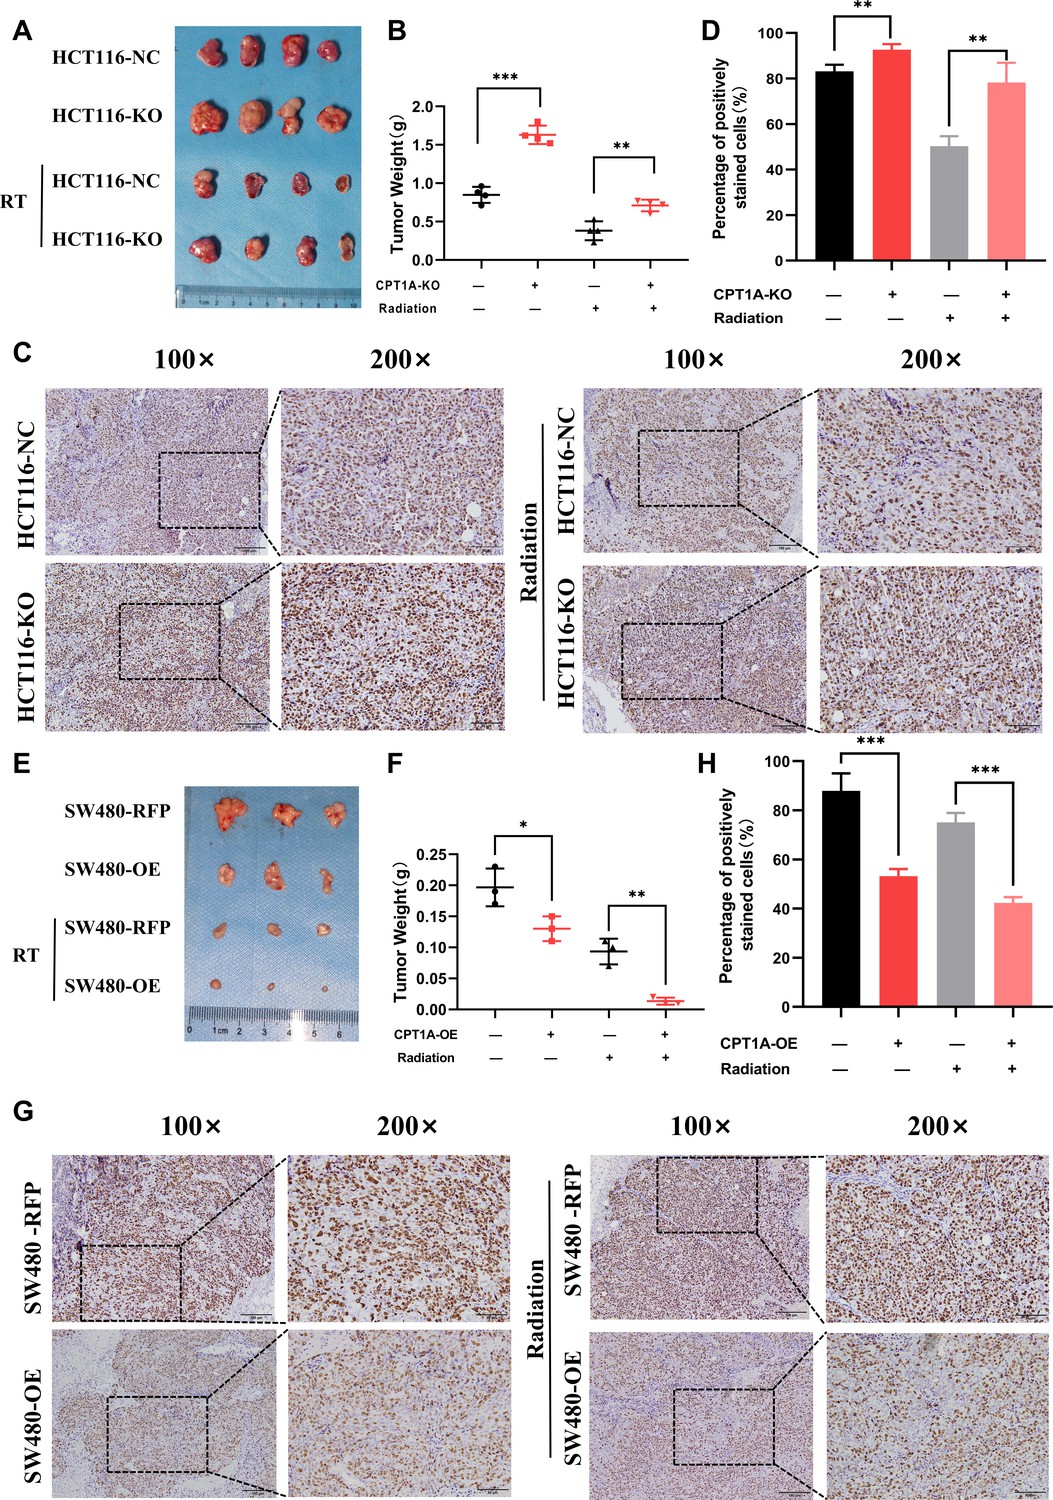
CPT1A inhibited proliferation and radioresistance in nude mice.
(A) Image of tumours formed in nude mice, with knockout of CPT1A and radiation. (B) Scattergram showing the weight of tumours. (C) Immunohistochemical staining of Ki67 in tumours, scale bar = 100μm. . (D) Bar chart demonstrating the percentage of positively stained Ki67 cells. (E) Image of tumours formed in nude mice, with overexpression of CPT1A and radiation. (F) Scattergram showing the weight of tumours. (G) Immunohistochemical staining of Ki67 in tumours, scale bar = 100μm. (H) Bar chart demonstrating the percentage of positively stained Ki67 cells. ***p<0.001, **p<0.01, *p<0.05.
Figure 5 with 2 supplements
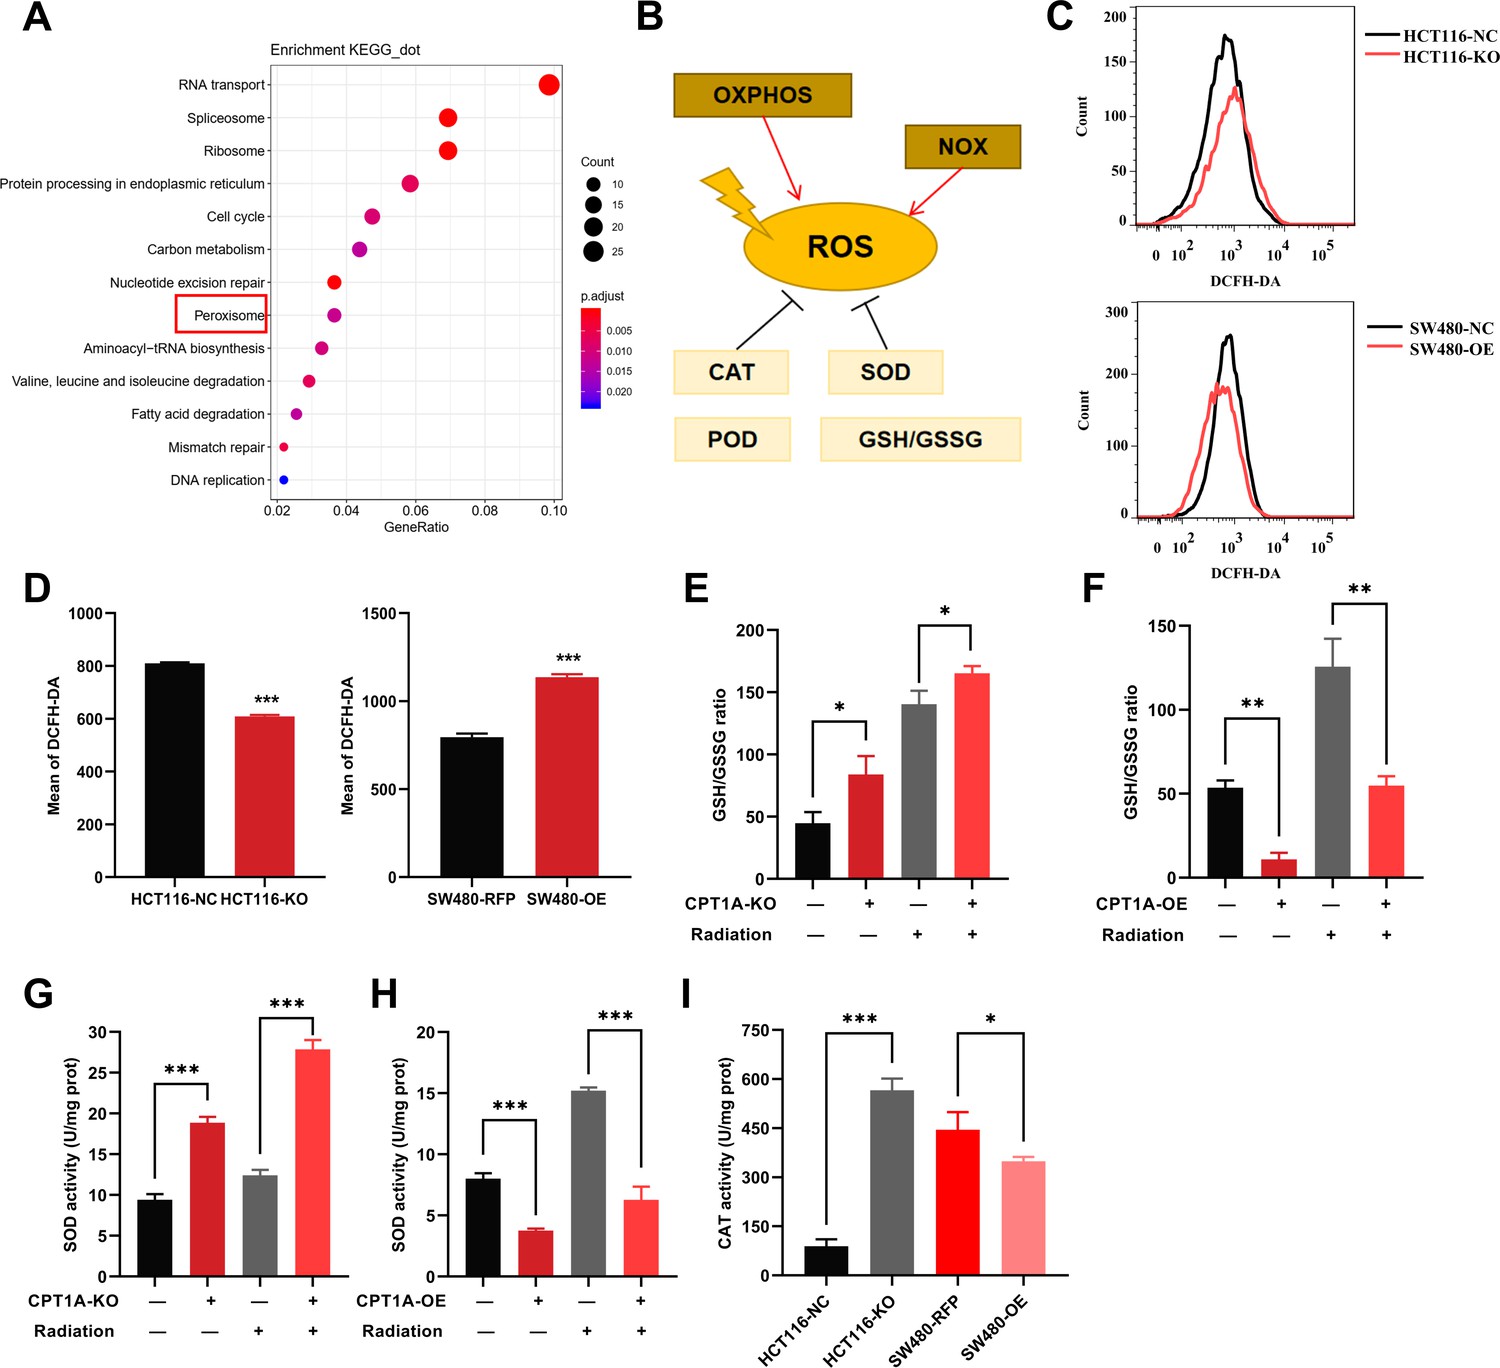
The effect of CPT1A on reactive oxygen species (ROS) related enzyme activity.
(A) Enriched Kyoto Encyclopedia of Genes and Genomes (KEGG) pathway of differentially expressed genes (DEGs) in mRNA sequencing. (B) Generation and scavenging of ROS in cell. (C) ROS of HCT 116-KO cell, SW480-OE cell and their control with 2',7'-dichlorodihydrofluorescein diacetate (DCFH-DA) by flow cytometry. (D) Bar graph to show the mean of DCFH-DA in HCT 116-KO, HCT 116-NC cells, SW480-NC, and SW480-OE cells. (E) GSH/GSSG ratio measurement under CPT1A knockout and radiation. (F) GSH/GSSG ratio measurement under CPT1A overexpression and radiation. (G) Effect of the CPT1A knockout on SOD activity. (H) Effect of the CPT1A overexpression on SOD activity. (I) Effect of the CPT1A on catalase (CAT) activity. ***p<0.001, **p<0.01, *p<0.05.
Figure 5—figure supplement 1
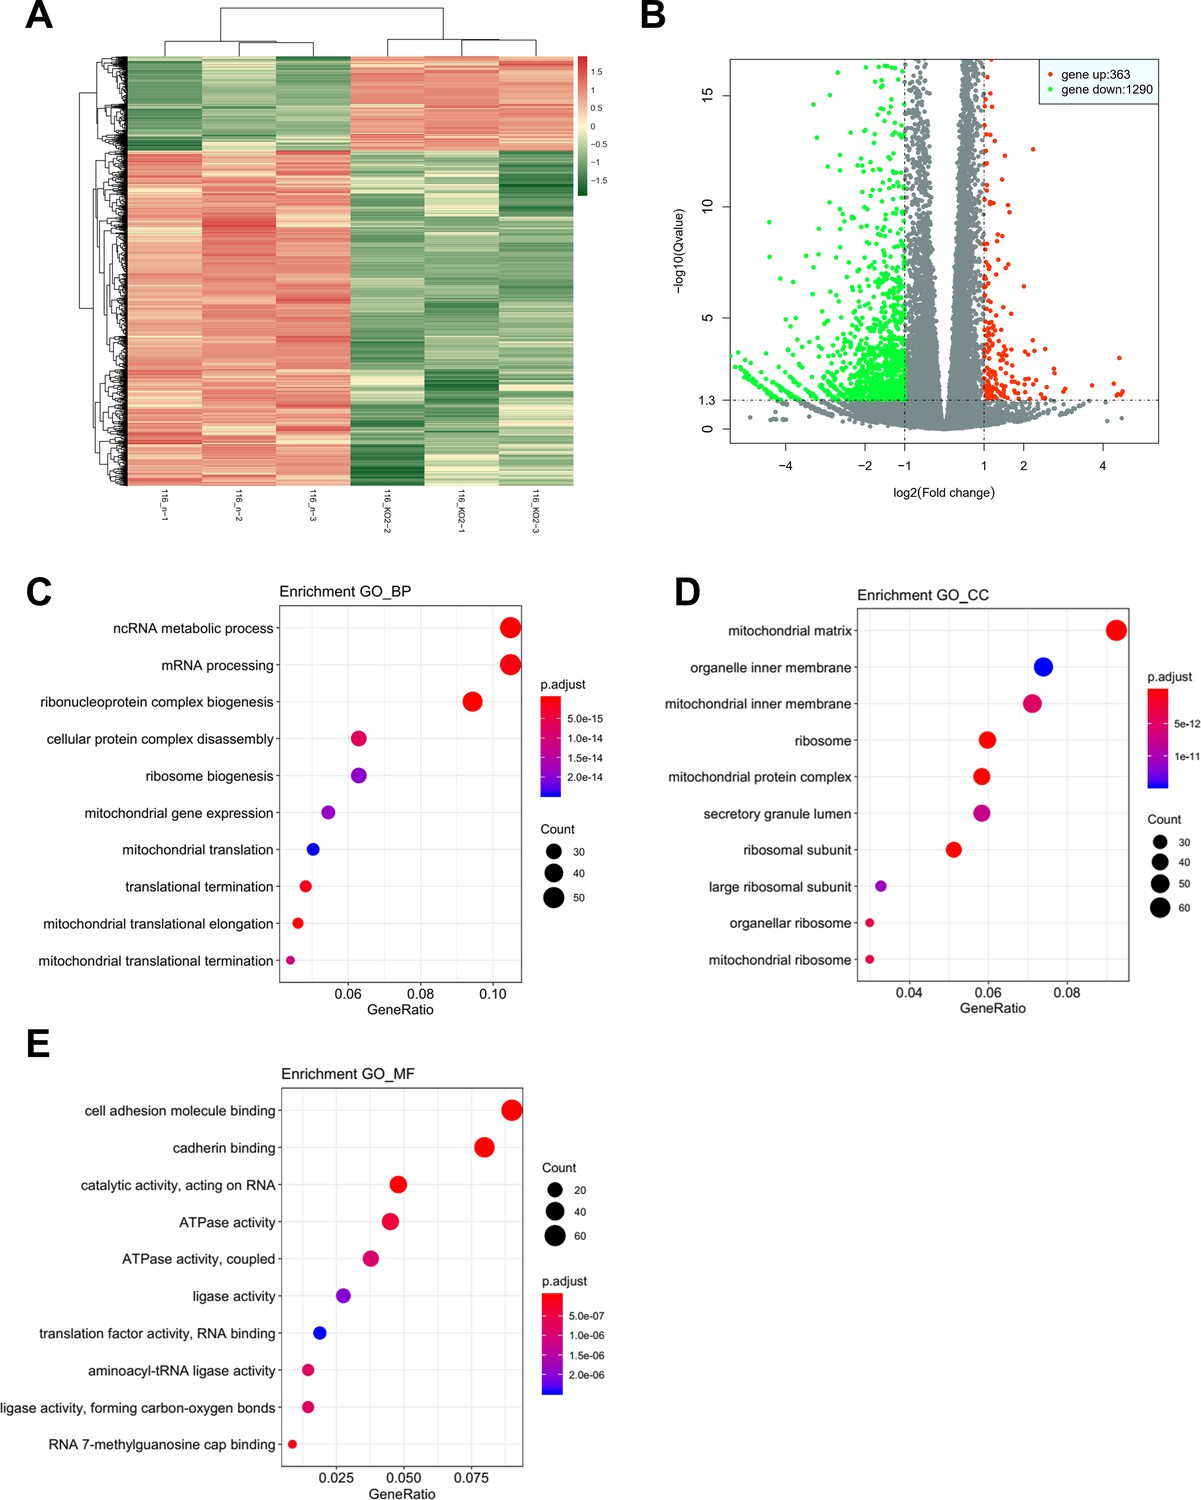
The result of mRNA sequencing after CPT1A knockout.
(A) Heatmap of all genes. (B) Volcanic map of all genes. (C) Enriched Gene Ontology (GO) terms of biological process. (D) Enriched GO terms of cellular component. (E) Enriched GO terms of molecular function.
Figure 5—figure supplement 2
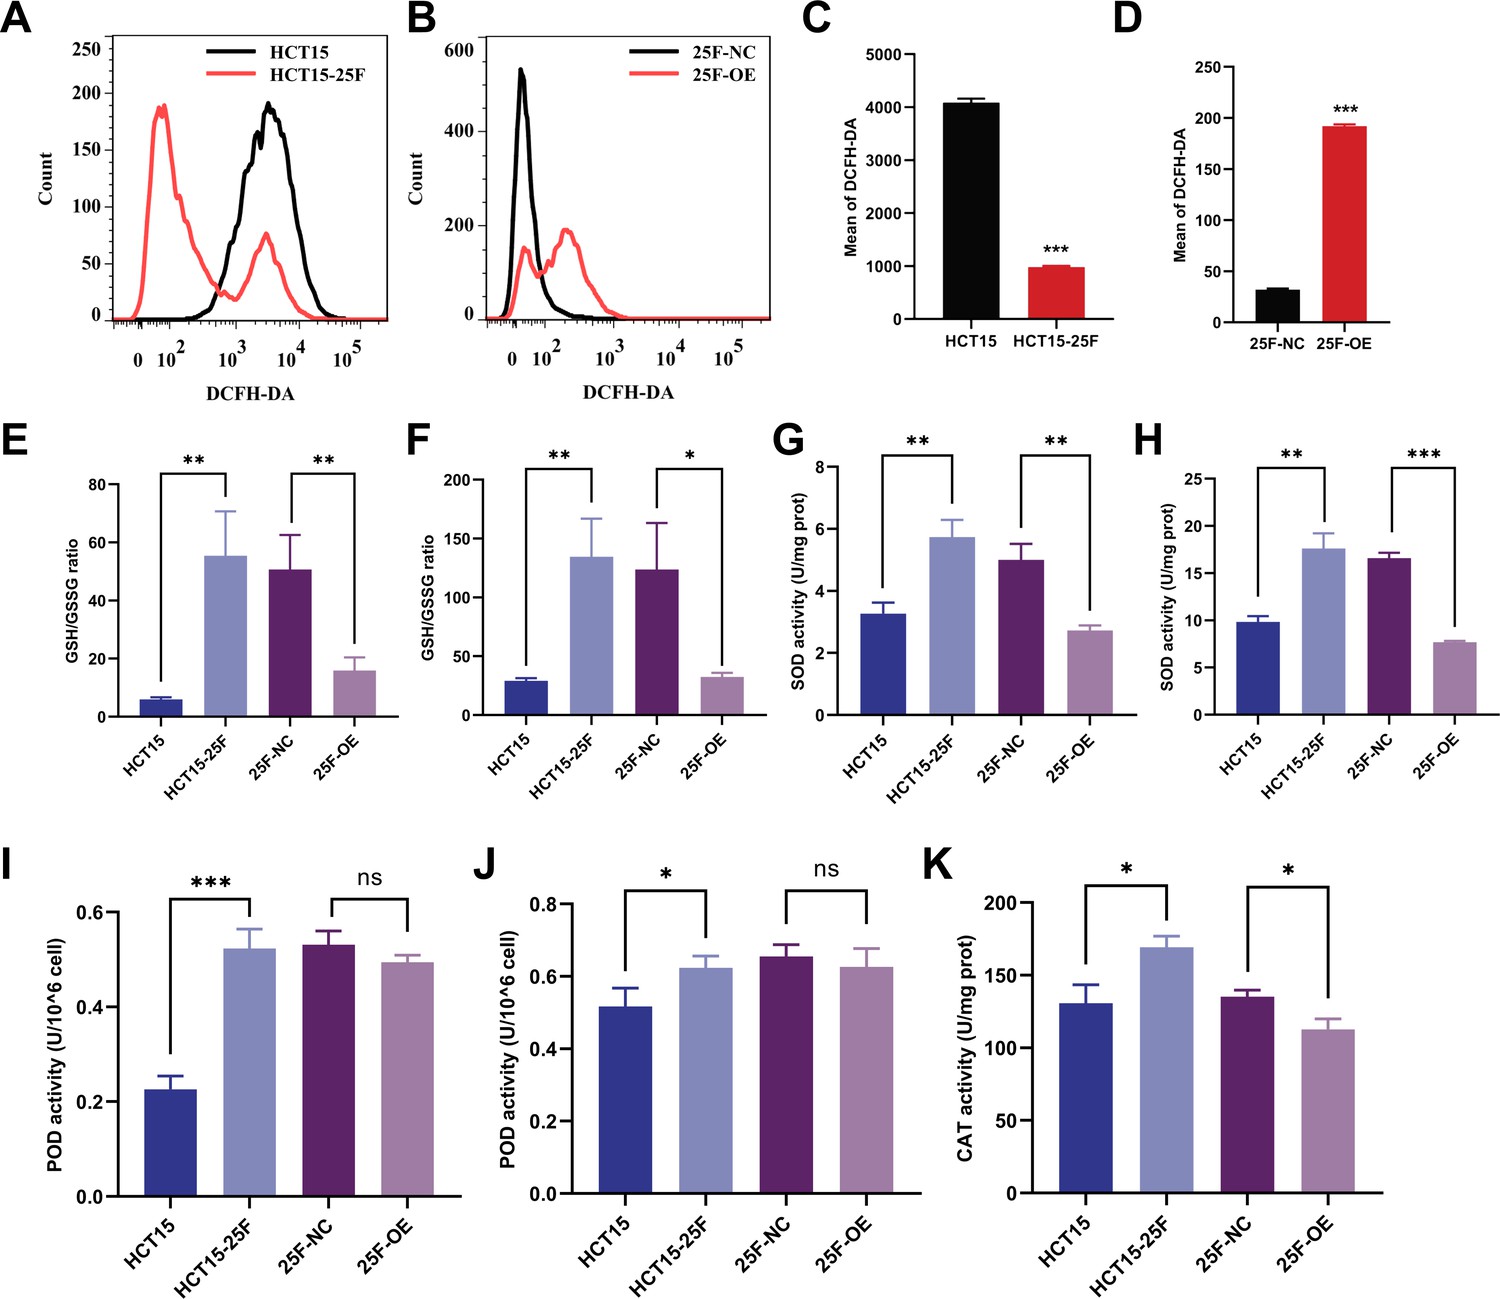
The effect of CPT1A on reactive oxygen species (ROS) and enzyme activity in radioresistance cell after 6 Gy radiation.
(A) ROS of HCT-15-25F and HCT-15 with 2',7'-dichlorodihydrofluorescein diacetate (DCFH-DA) by flow cytometry. (B) ROS of HCT-15-25F-OE cell and its control with DCFH-DA by flow cytometry. (C) Bar graph to show the mean of DCFH-DA in HCT-15-25F and HCT-15 cells. (D) Bar graph to show the mean of DCFH-DA in HCT-15-25F-OE and HCT-15-25F-NC cells. (E) GSH/GSSG ratio after CPT1A overexpression. (F) GSH/GSSG ratio after CPT1A overexpression and 6 Gy radiation. (G) Effect of the CPT1A overexpression on SOD activity. (H) Effect of the CPT1A overexpression on SOD activity after 6 Gy radiation. (I) Effect of the CPT1A overexpression on peroxidase (POD) activity. (J) Effect of the CPT1A overexpression on POD activity after 6 Gy radiation. (K) Effect of the CPT1A on catalase (CAT) activity. ***p<0.001, **p<0.01, *p<0.05.
Figure 6 with 1 supplement
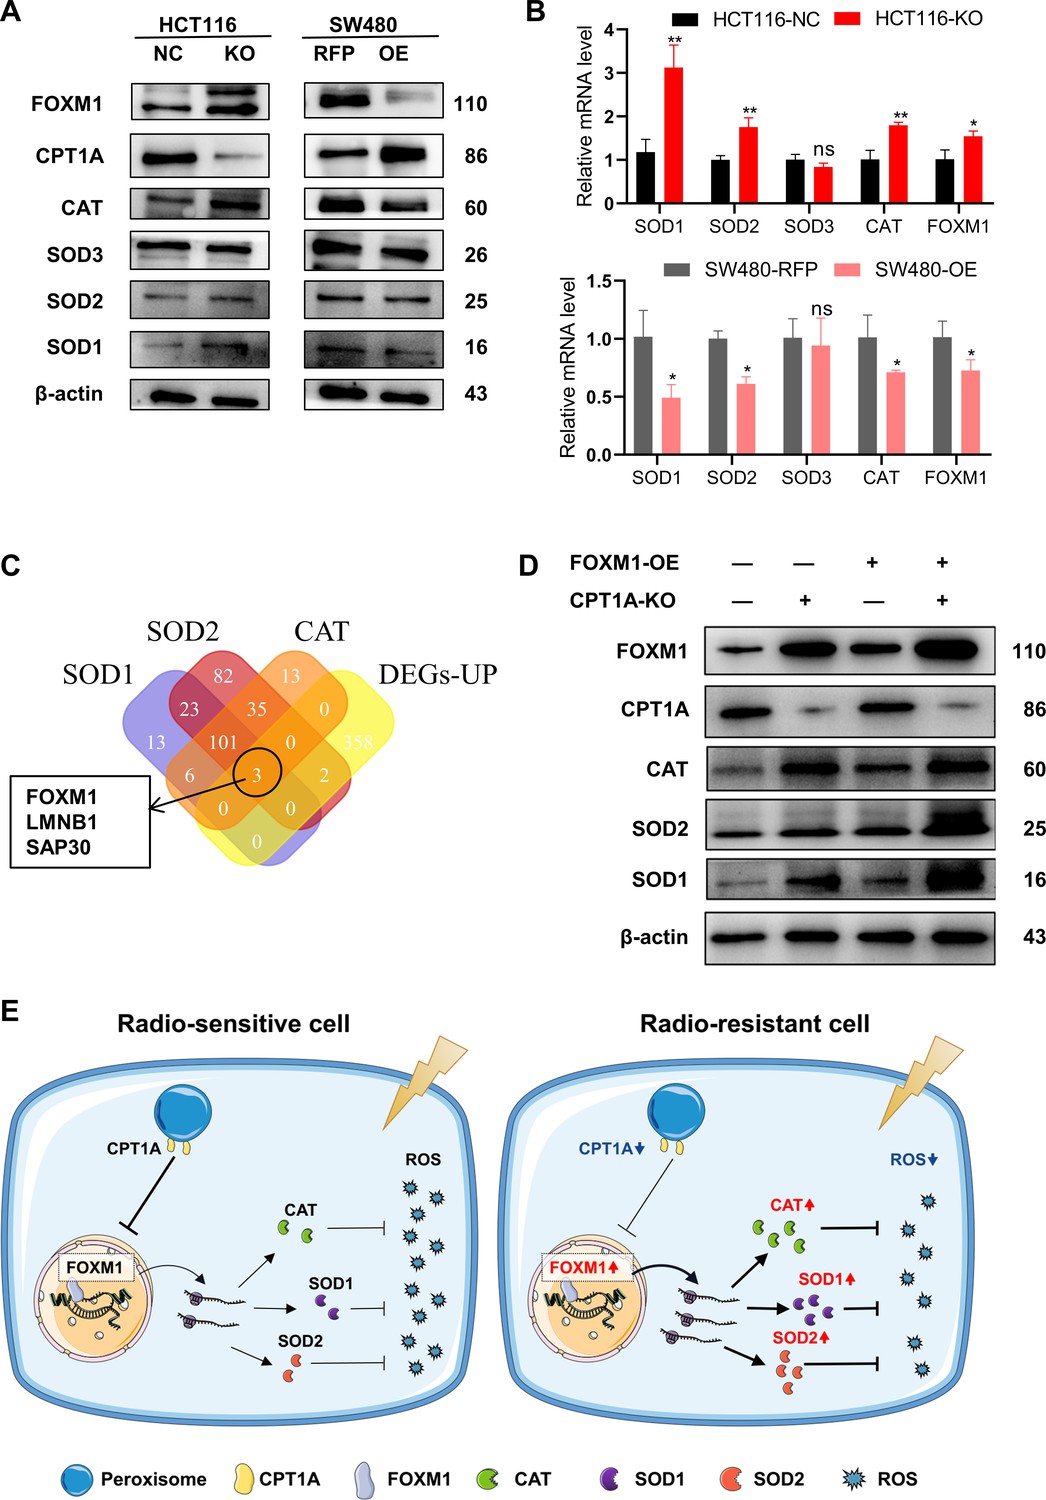
CPT1A increases the transcription and protein of reactive oxygen species (ROS) scavenge-related genes by regulating the transcription factor activity of FOXM1.
(A) The protein level of FOXM1, CPT1A, catalase (CAT), SOD1, SOD2, SOD3 after knockout and overexpression of CPT1A. (B) The mRNA level of FOXM1, CAT, SOD1, SOD2, SOD3 after knockout and overexpression of CPT1A. (C) Venn diagram showing the potential transcription factor of SOD1, SOD2, and CAT. (D) The protein level of FOXM1, CPT1A, CAT, SOD1, SOD2 after overexpression of FOXM1 in HCT116-CPT1AKO cells. (E) Schematic diagram summarising our working model, namely, decreased CPT1A promotes the transcription factor activity of FOXM1, increasing the mRNA and protein level of CAT, SOD1, and SOD2, followed by increasing ROS scavenge after irradiation and therefore colorectal cancer (CRC) cells become radioresistance. ***p<0.001, **p<0.01, *p<0.05.
-
Figure 6—source data 1
Original files for western blot analysis displayed in Figure 6.
- https://cdn.elifesciences.org/articles/97827/elife-97827-fig6-data1-v1.zip
-
Figure 6—source data 2
PDF file containing original western blots for Figure 6.
- https://cdn.elifesciences.org/articles/97827/elife-97827-fig6-data2-v1.zip
Figure 6—figure supplement 1
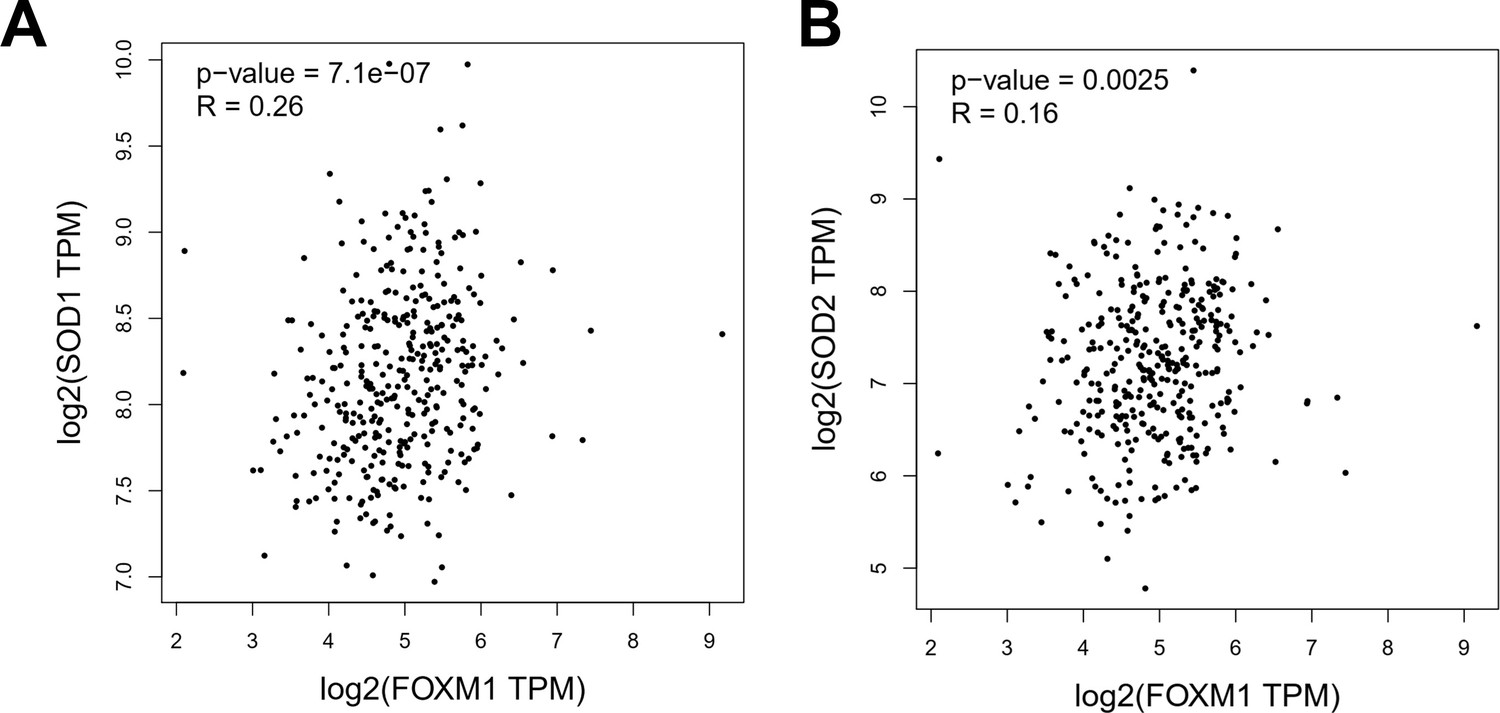
The correlation of FOXM1 with reactive oxygen species (ROS) scavenge gene.
(A) The correlation of FOXM1 with SOD1. (B) The correlation of FOXM1 with SOD2.
Author response image 1
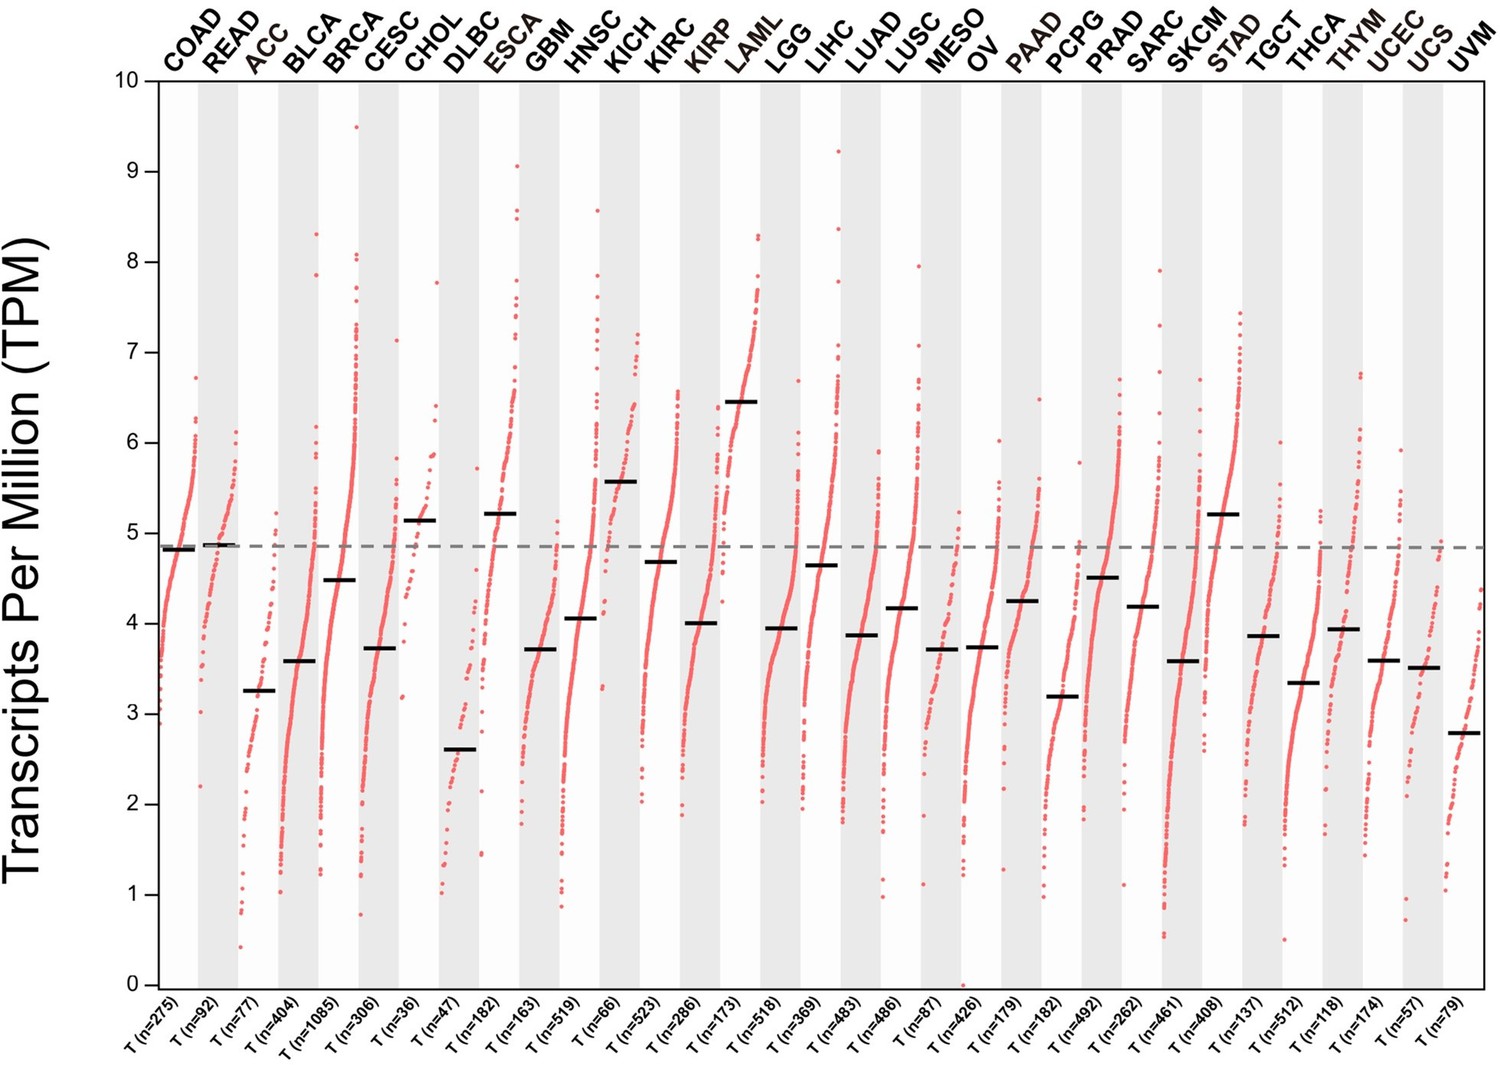
The mRNA level of CPT1A across all cancer types in the TCGA dataset.
Author response image 2
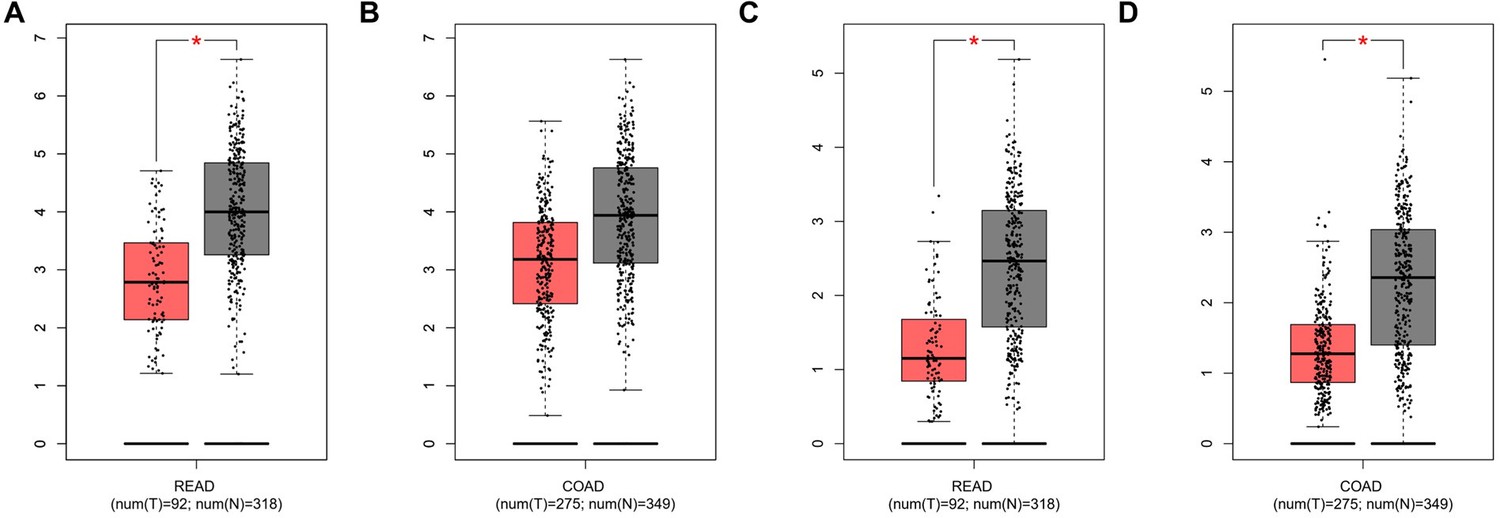
The mRNA expression levels of CPT1B and CPT1C in rectal adenocarcinoma (READ) and colon adenocarcinoma (COAD) based on data from the TCGA database.
A. CPT1B expression in READ. B. CPT1B expression in COAD. C. CPT1C expression in READ. D. CPT1C expression in COAD.
Tables
Table 1
Potential binding site of SOD1, SOD2, catalase (CAT) promoter predicted by hTFtarget and JASPAR.
| TF | Target gene | Sequence name | Start | Stop | Strand | Score | p-Value | q-Value | Matched motif |
|---|---|---|---|---|---|---|---|---|---|
| FOXM1 | SOD1 | NC_000021.9:31657693–31659693 | 1166 | 1178 | - | 14.4412 | 0.00000152 | 0.00599 | TTTGTTTGATTTT |
| FOXM1 | SOD2 | NC_000006.12:c159669069-159667069 | 1152 | 1160 | + | 12.685 | 0.00000403 | 0.0159 | AGATGGAGT |
| FOXM1 | CAT | NC_000011.10:34436934–34438934 | 1410 | 1422 | + | 11.3333 | 0.0000499 | 0.197 | TCAGAGTGTTTTT |
Key resources table
| Reagent type (species) or resource | Designation | Source or reference | Identifiers | Additional information |
|---|---|---|---|---|
| Cell line (human) | HCT-15 | ATCC (USA) | CCL-225 | |
| Cell line (human) | RKO | ATCC (USA) | CRL-2577 | |
| Cell line (human) | HCT 116 | ATCC (USA) | CCL-247 | |
| Cell line (human) | HT-29 | ATCC (USA) | HTB-38 | |
| Cell line (human) | Caco-2 | ATCC (USA) | HTB-37 | |
| Cell line (human) | SW480 | ATCC (USA) | CCL-228 | |
| Cell line (human) | SW620 | ATCC (USA) | CCL-227 | |
| Transfected construct (human) | pLV[Exp]-Puro-CMV>hCPT1A | VectorBuilder (China) | ||
| Transfected construct (human) | pLV[CRISPR]-hCas9:T2A:Puro-U6>hCPT1A | VectorBuilder (China) | Including 3 gRNA | |
| Transfected construct (human) | pLV[Exp]-G418-CMV>hFOXM1 | VectorBuilder (China) | ||
| Antibody | CPT1A (D3B3) Rabbit mAb | Cell Signaling Technology (USA) | 12252 | |
| Antibody | β-Actin (8H10D10) Mouse mAb | Cell Signaling Technology (USA) | 3770 | |
| Antibody | Mouse anti-Ki67 monoclonal antibody | Cell Signaling Technology (USA) | 9449 | |
| Antibody | PPARA Rabbit Polyclonal antibody | Proteintech (China) | 15540-1-AP | |
| Antibody | PPAR gamma Rabbit Polyclonal antibody | Proteintech (China) | 22061-1-AP | |
| Antibody | PGC1a Mouse Monoclonal antibody | Proteintech (China) | 66369-1-Ig | |
| Antibody | SOD1 Rabbit Polyclonal antibody | Proteintech (China) | 10269-1-AP | |
| Antibody | SOD2 Rabbit Polyclonal antibody | Proteintech (China) | 24127-1-AP | |
| Antibody | SOD3 Rabbit Polyclonal antibody | Proteintech (China) | 14316-1-AP | |
| Antibody | Catalase Rabbit Polyclonal antibody | Proteintech (China) | 21260-1-AP | |
| Antibody | FOXM1 Rabbit Polyclonal antibody | Proteintech (China) | 13147-1-AP | |
| Antibody | Anti-rabbit IgG, HRP-linked Antibody | Cell Signaling Technology (USA) | 7074 | |
| Chemical compound, drug | TRIzol | TakaraBio (Japan) | 9108 | |
| Commercial assay or kit | Evo M-MLV RT Mix Kit | Accurate Biotechnology (China) | AG11728 | |
| Commercial assay or kit | SYBR Green Premix Pro Taq HS qPCR Kit | Accurate Biotechnology (China) | AG11701 | |
| Commercial assay or kit | Protein extraction kit | KeyGen BioTech (China) | KGP113-SDS | |
| Commercial assay or kit | Comet assay kit | KeyGen BioTech (China) | KGA240 | |
| Chemical compound, drug | PI | Beyotime (China) | ST511 | |
| Chemical compound, drug | DAPI | Beyotime (China) | C1002 | |
| Commercial assay or kit | ROS detection kit | Beyotime (China) | S0033S | |
| Commercial assay or kit | GSH detection kit | Solarbio (China) | BC1175 | |
| Commercial assay or kit | GSSG detection kit | Solarbio (China) | BC1180 | |
| Commercial assay or kit | SOD enzyme activity kit | Solarbio (China) | BC0170 | |
| Commercial assay or kit | CAT enzyme activity kit | Solarbio (China) | BC0200 | |
| Commercial assay or kit | POD enzyme activity kit | Solarbio (China) | BC0090 |
Table 2
Correlation between clinicopathological features and the expression of CPT1A in tumour paraffin section.
| Variables | Categories | CPT1A | p-Value | ||
|---|---|---|---|---|---|
| Low | High | Total (n) | |||
| Age | <50 | 13 | 13 | 26 | 0.411 |
| ≥50 | 20 | 30 | 50 | ||
| Gender | Male | 13 | 18 | 31 | 0.831 |
| Female | 20 | 25 | 45 | ||
| Histological grade | Well differentiated | 3 | 5 | 8 | 0.640 |
| Moderately differentiated | 26 | 32 | 58 | ||
| Poorly differentiated | 4 | 6 | 10 | ||
| UICC/ AJCC Stage | Stage I | 3 | 1 | 4 | 0.379 |
| Stage II | 14 | 16 | 30 | ||
| Stage III | 14 | 24 | 38 | ||
| Stage IV | 2 | 2 | 4 | ||
| T-class | T1 | 1 | 1 | 2 | 0.272 |
| T2 | 3 | 3 | 6 | ||
| T3 | 15 | 15 | 30 | ||
| T4 | 14 | 24 | 38 | ||
| N-class | N0 | 18 | 17 | 35 | 0.189 |
| N1 | 10 | 16 | 26 | ||
| N2 | 5 | 10 | 15 | ||
| M-class | M0 | 31 | 41 | 72 | 0.788 |
| M1 | 2 | 2 | 4 | ||
Additional files
-
Supplementary file 1
The and N value of multi-target single-hit model in all cell lines.
- https://cdn.elifesciences.org/articles/97827/elife-97827-supp1-v1.docx
-
Supplementary file 2
Primers used for the real-time PCR.
- https://cdn.elifesciences.org/articles/97827/elife-97827-supp2-v1.docx
-
MDAR checklist
- https://cdn.elifesciences.org/articles/97827/elife-97827-mdarchecklist1-v1.docx
Download links
A two-part list of links to download the article, or parts of the article, in various formats.
Downloads (link to download the article as PDF)
Open citations (links to open the citations from this article in various online reference manager services)
Cite this article (links to download the citations from this article in formats compatible with various reference manager tools)
CPT1A mediates radiation sensitivity in colorectal cancer
eLife 13:RP97827.
https://doi.org/10.7554/eLife.97827.3


