Chemogenetic stimulation of phrenic motor output and diaphragm activity
- Department of Physical Therapy, University of Florida, United States
- Breathing Research and Therapeutics Center, University of Florida, United States
- McKnight Brain Institute, University of Florida, United States
- Department of Electrical and Computer Engineering, University of Florida, United States
Figures
Figure 1
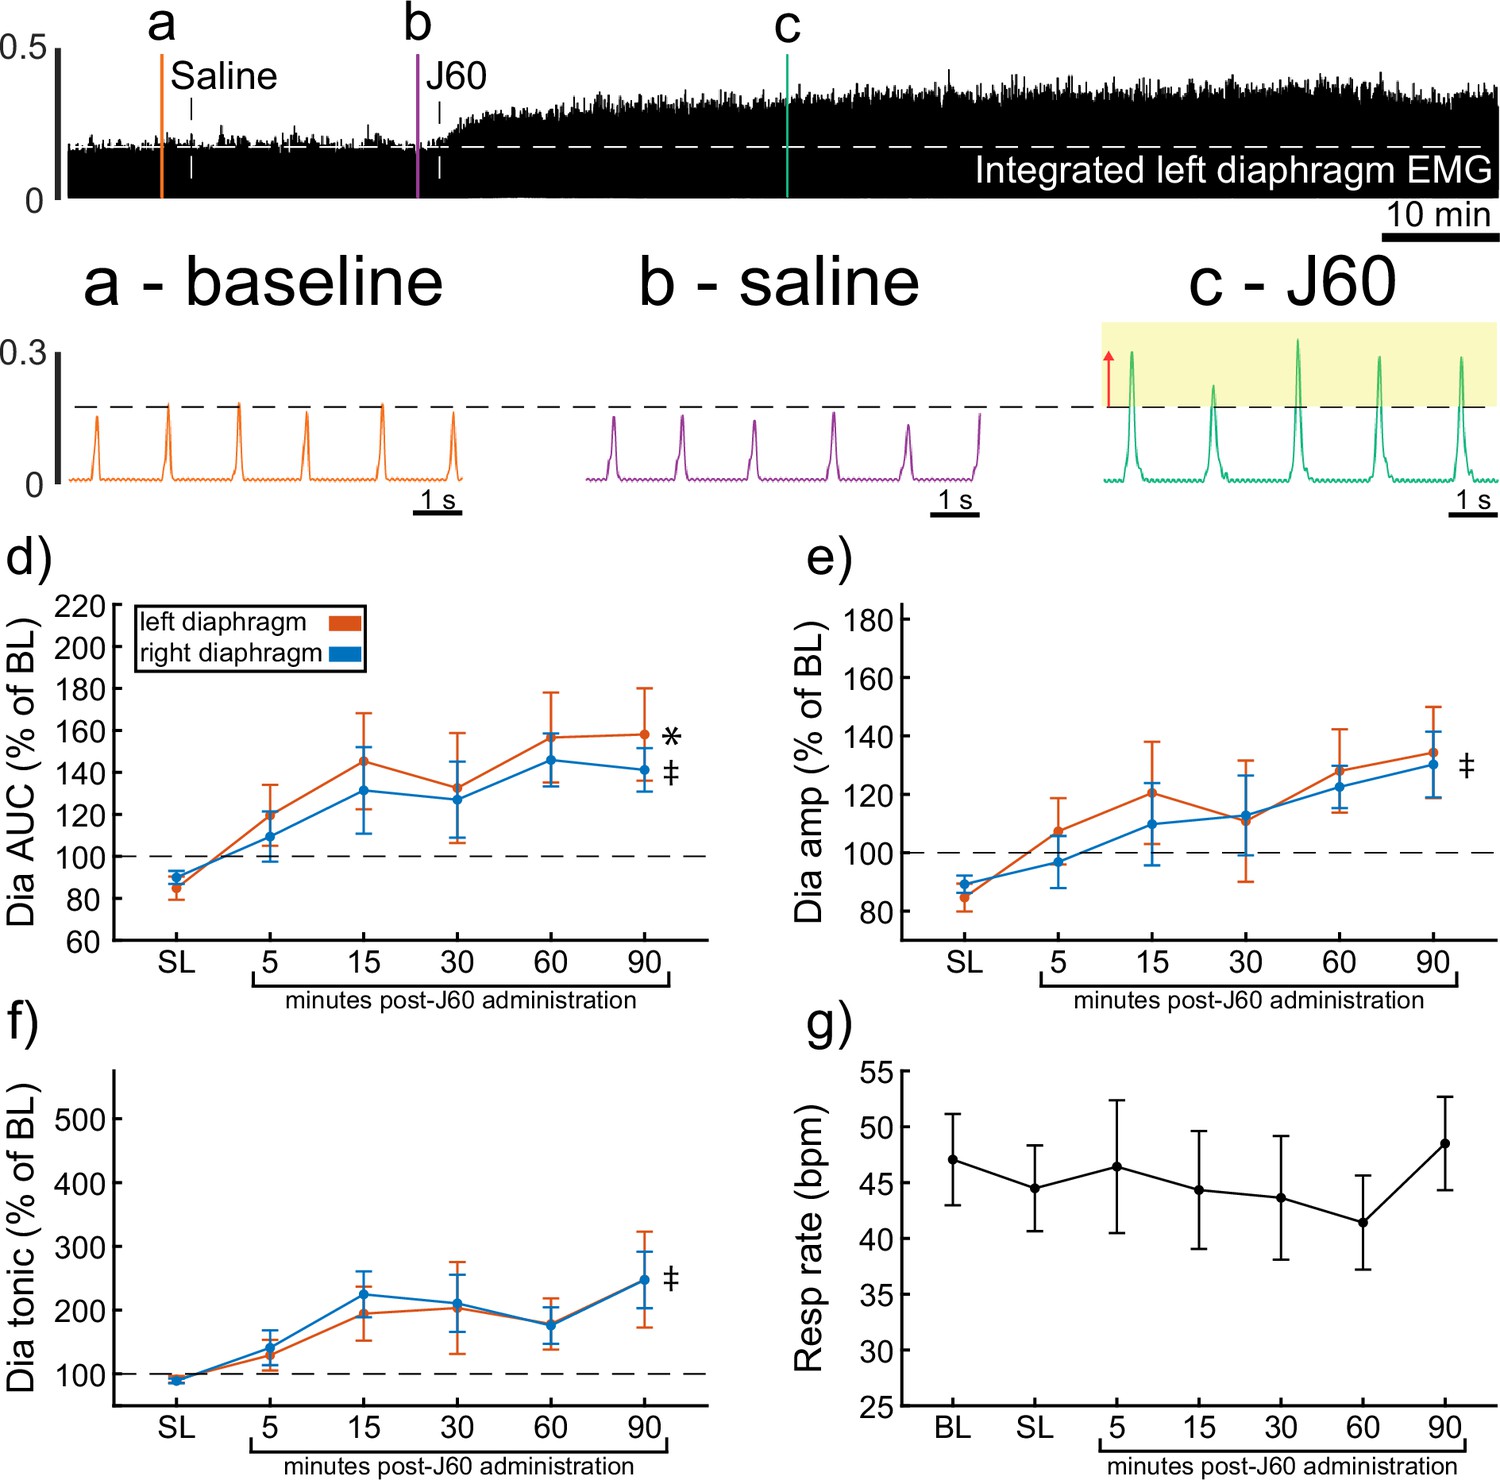
DREADD activation increases diaphragm electromyogram (EMG) output in wild-type mice.
A representative example of diaphragm EMG activity before and after application of the J60 DREADD ligand is shown in the top panel. Examples of the individual inspiratory EMG bursts at baseline (a), after vehicle (b), and after J60 (c) are shown in call out panels below. The J60 ligand increased diaphragm output but did not impact respiratory rate. The mean responses (n = 11; n = 7 females) for EMG AUC, peak-to-peak amplitude, tonic activity, and respiratory rate are shown in panels d–g. For diaphragm EMG data (panels d–f), left hemidiaphragm EMG is represented in orange, while right hemidiaphragm EMG is blue. Error bars depict ±1 SEM. Statistical reports for all panels are provided in Supplementary file 1. * and ‡ symbols indicate significant main effects (p < 0.05) on one-way RM ANOVA for the left and right hemidiaphragm, respectively. Dia = diaphragm, AUC = area under the curve, amp = peak amplitude, BL = baseline, SL = saline (sham injection).
Figure 2 with 1 supplement
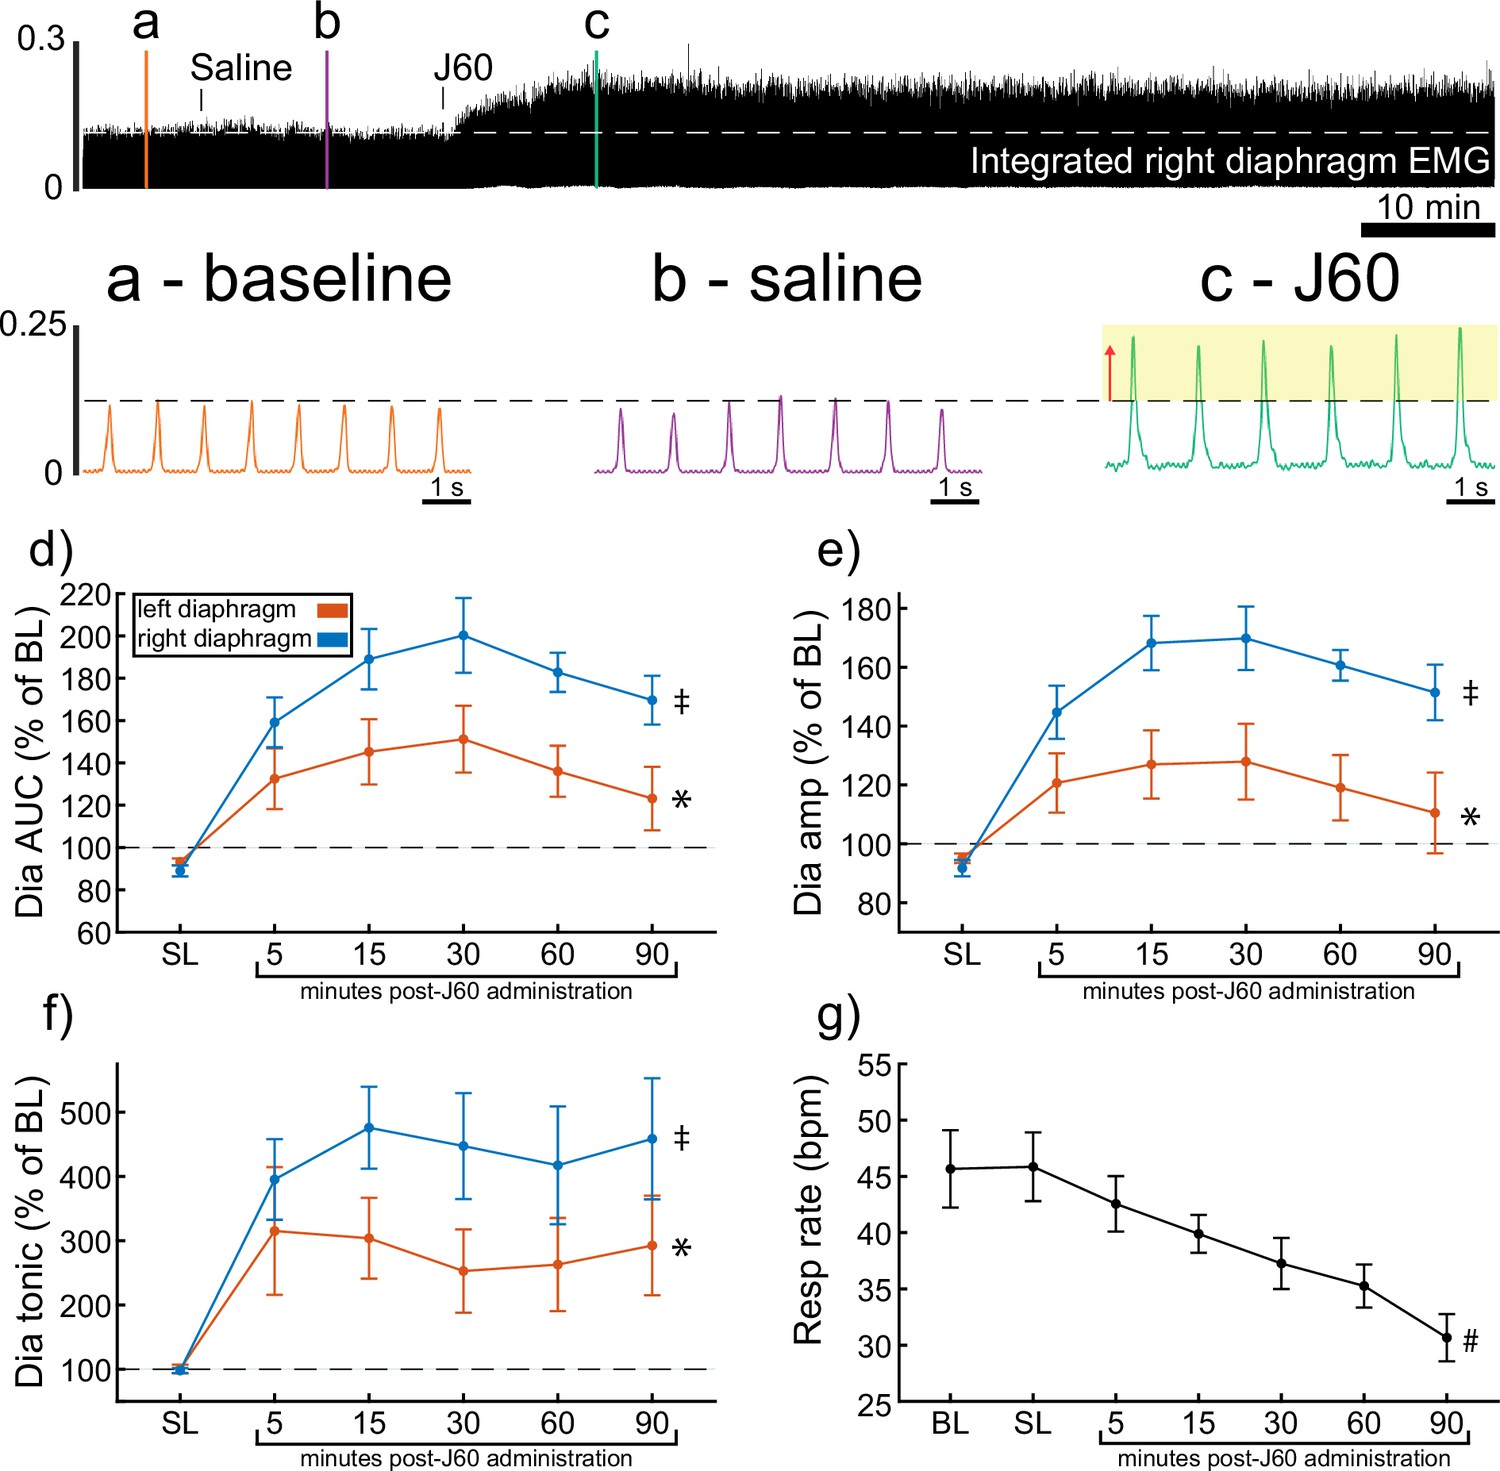
DREADD activation increases diaphragm electromyogram (EMG) output in ChAT-Cre mice.
A representative example of diaphragm EMG activity before and after application of the J60 DREADD ligand is shown in the top panel. Examples of the individual inspiratory EMG bursts at baseline (a), after vehicle (b), and after J60 (c) are shown in the call out panels below. Mean responses (n = 9; n = 6 females) for EMG AUC, peak-to-peak amplitude, tonic activity, and respiratory rate are shown in panels d–g. The DREADD ligand caused a bilateral increase in diaphragm EMG AUC, peak-to-peak amplitude, and tonic activity. For all EMG parameters, the responses were greater on the right versus left hemidiaphragm. Respiratory rate decreased over time. For panels d–f, the left hemidiaphragm EMG is represented in orange, while right hemidiaphragm EMG is blue. Error bars depict ±1 SEM. Statistical reports for all panels are provided in Supplementary file 2. * and ‡ symbols indicate significant main effects (p < 0.05) on one-way RM ANOVA for the left and right hemidiaphragm, respectively. # indicates a significant main effect (p < 0.05) on one-way RM ANOVA for respiratory rate data. Dia = diaphragm, AUC = area under the curve, amp = peak amplitude, BL = baseline, SL = saline (sham injection).
Figure 2—figure supplement 1

mCherry expression in the mid-cervical ventral horn corresponds with the laterality of the diaphragm electromyogram (EMG) DREADD response.
Example spinal histology (left) from two ChAT-Cre mice showing unilateral (a) and bilateral (b) expression of mCherry (red) in the ventral horn(s) and corresponding diaphragm EMG traces. Unilateral ventral horn mCherry expression (a) results in DREADD responses that were limited to the ipsilateral hemidiaphragm. Animals with bilateral ventral horn DREADD expression responded to DREADD activation with a bilateral increase in diaphragm output.
Figure 3

Wild-type versus ChAT-Cre mouse responses to DREADD activation.
Direct comparisons of diaphragm electromyogram (EMG) response parameters (a–f) and respiratory rate (g) at 30-min post-J60 application (wild-type, n = 11; n = 7 females; ChAT-Cre, n = 9; n = 6 females). Left hemidiaphragm EMG AUC (a), peak-to-peak amplitude (b), and tonic activity (c) were similar between groups. However, the same parameters on the right hemidiaphragm (d–f) were greater in ChAT-Cre mice. Respiratory rate was similar between groups. Error bars depict ±1 SEM. Statistical reports for all panels are provided in Supplementary file 3. * indicates significant p value (p < 0.05) on paired t-test. AUC = area under the curve, amp = peak EMG amplitude, Dia = diaphragm, BL = baseline, resp rate = respiratory rate.
Figure 4
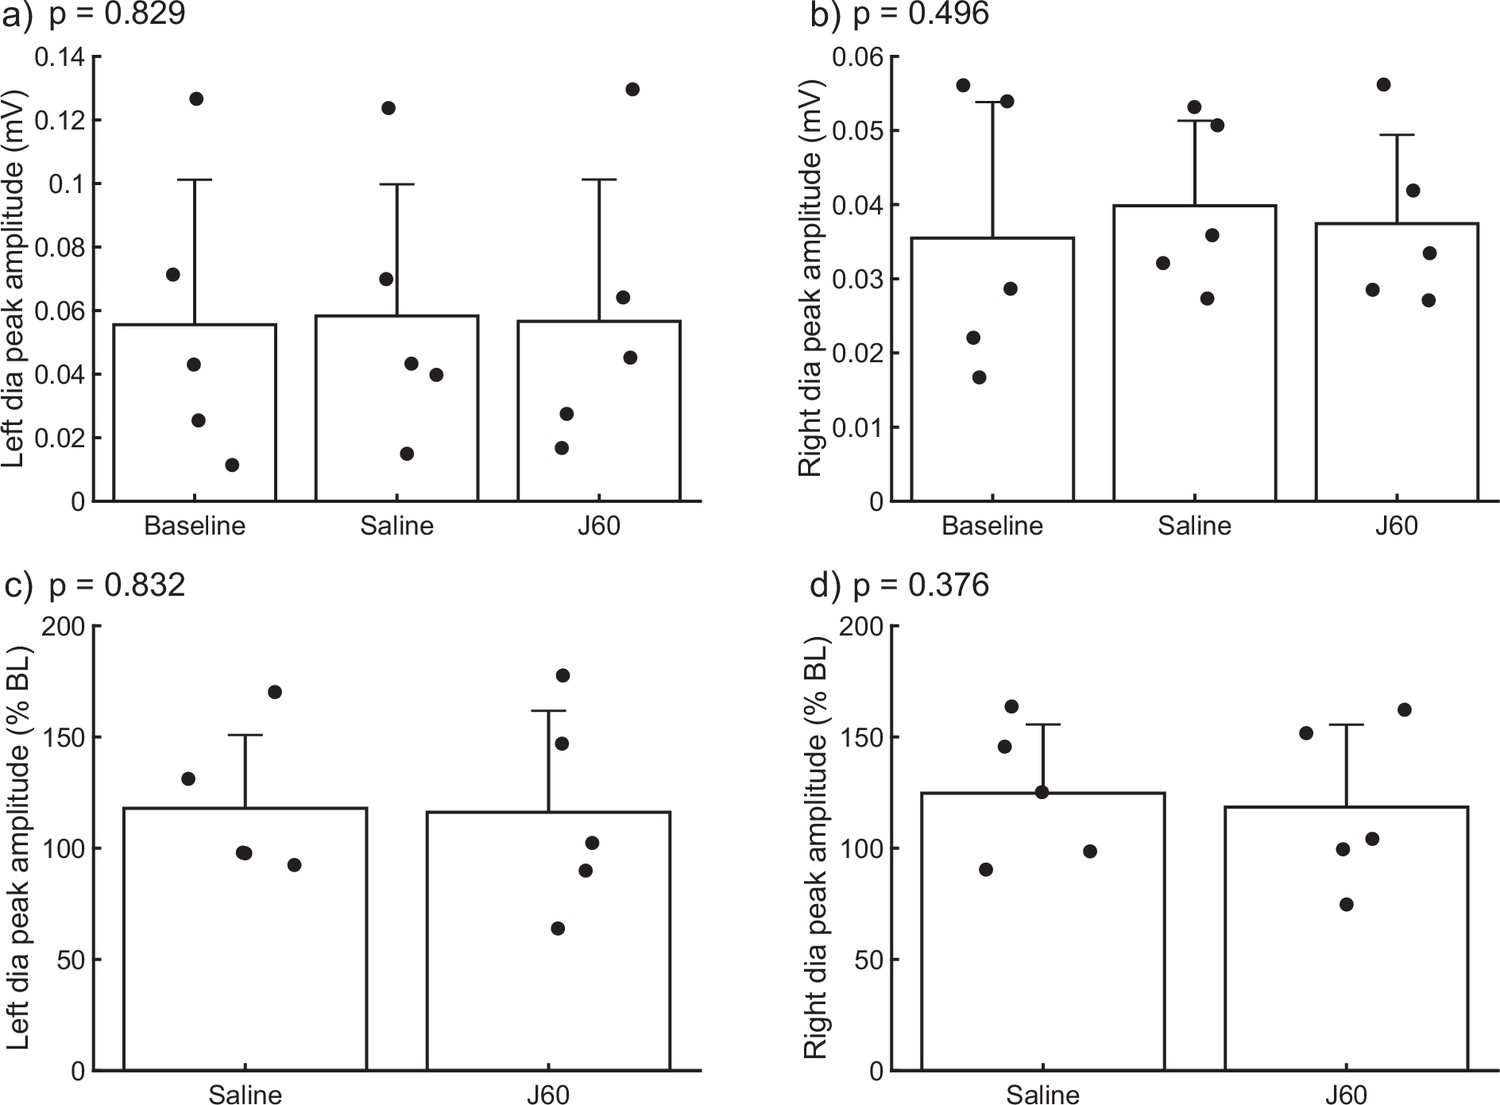
Impact of J60 application on diaphragm electromyogram (EMG) in the absence of hM3D(Gq) expression.
Summary plots of a combined mouse (n = 2) and rat (n = 3) data showing the impact of J60 application (0.1 mg/kg) on diaphragm EMG peak amplitude in animals not expressing the hM3D(Gq) DREADD. Mean diaphragm EMG responses during baseline, saline (sham injection), and following J60 administration for the left hemidiaphragm are shown in panels a and b, respectively. Mean values normalized to baseline are shown in panels c (left hemidiaphragm) and d (right hemidiaphragm). Raw values (a, b) were assessed by one-way RM ANOVA while baseline normalized values (c, d) were assessed via paired t-tests. No statistically significant differences (p < 0.05) were detected in either hemidiaphragm across experimental periods. p-values are displayed next to each panel legend. Error bars depict ±1 SEM.
Figure 5 with 1 supplement
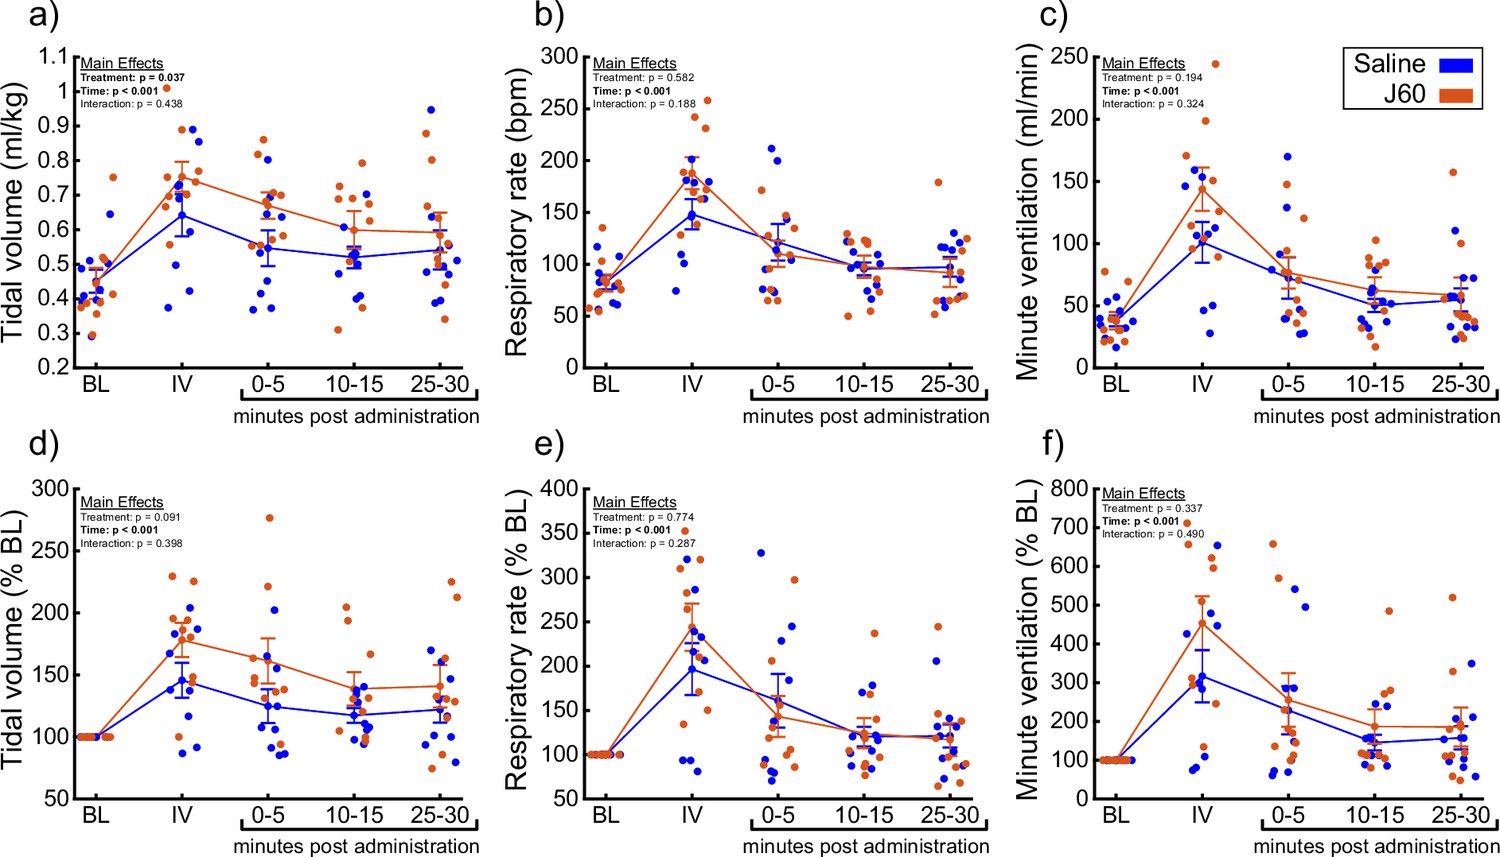
DREADD activation increases ventilation in unanesthetized ChAT-Cre rats.
Summary plots (n = 9; n = 3 females) showing the impact of the J60 DREADD ligand on tidal volume, respiratory rate, and minute ventilation are shown in panels a–c. The normalized values (% of baseline) are shown in panels d–f. The DREADD ligand increased tidal volume compared to sham infusion (saline). Error bars depict ±1 SEM. Data were analyzed using two-way RM ANOVAs with alpha = 0.05. Statistical reports for all panels are provided in Supplementary file 4. BL = baseline, IV = intravenous infusion period.
Figure 5—figure supplement 1

Ventilatory responses to hypercapnic–hypoxic respiratory challenge.
Summary plots (n = 9; n = 3 females) showing the impact of the J60 DREADD ligand on tidal volume, respiratory rate, and minute ventilation during a hypercapnic–hypoxic ventilatory challenge (panels a–c). The normalized values (% of baseline) are shown in panels d–f. No significant differences (p < 0.05) were detected in any of the ventilatory parameters across the sham versus J60 condition during the hypercapnic–hypoxic ventilatory challenge. Paired t-tests were performed on the data in each panel. p-values are displayed next to each panel legend. Error bars depict ±1 SEM.
Figure 6 with 1 supplement
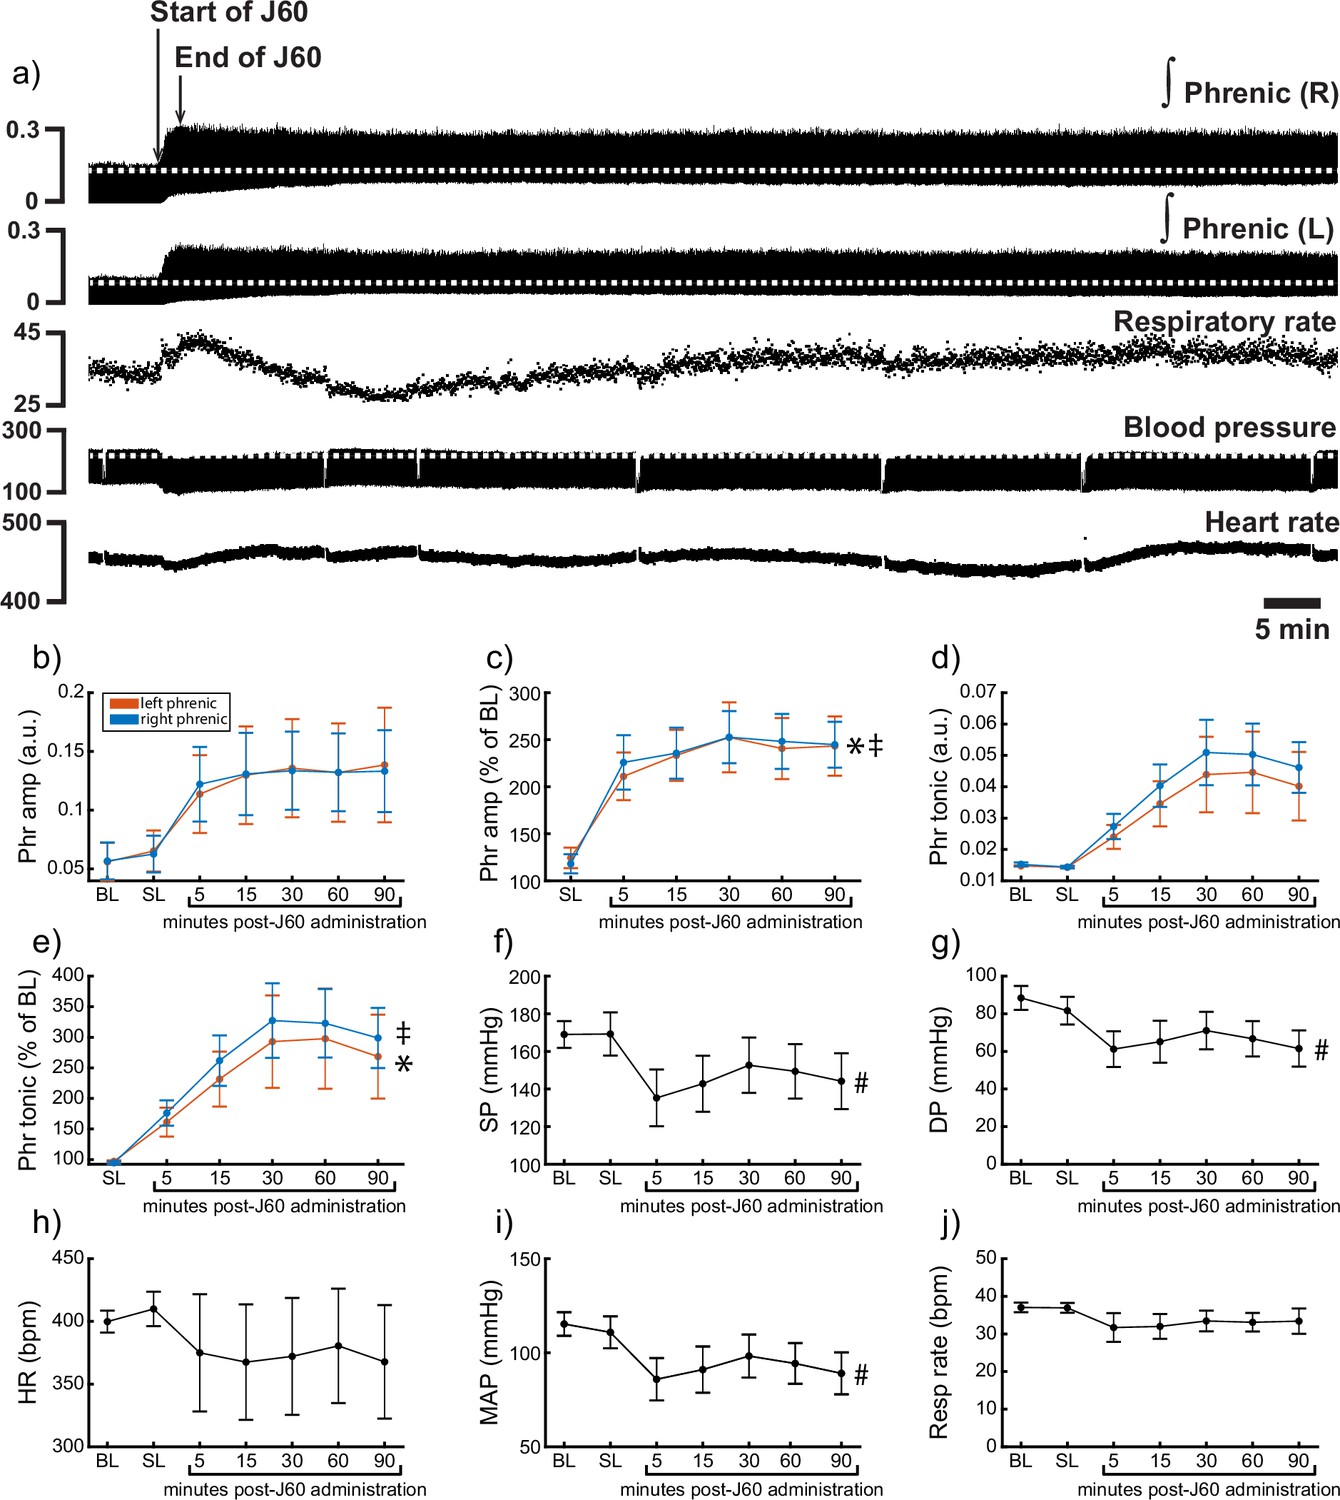
DREADD activation increases phrenic nerve output in ChAT-Cre rats.
Representative data showing that the J60 DREADD ligand causes a rapid increase in phrenic nerve output (a). Mean data (n = 9; n = 3 females) showing the impact of J60 application on phrenic nerve raw (b) and normalized (c) peak-to-peak amplitude, raw (d) and normalized (e) tonic activity, systolic blood pressure (f), diastolic blood pressure (g), heart rate (h), mean arterial blood pressure (i), and respiratory rate (j). The J60 ligand caused an increase in phrenic peak-to-peak amplitude and tonic activity. Systolic, diastolic, and mean arterial blood pressure all decreased after J60 application. Heart rate and respiratory rate were not statistically different after J60 administration. In panels b–e, the left phrenic is represented in orange, while right phrenic is blue. Error bars depict ±1 SEM. Statistical reports for all panels are provided in Supplementary file 5. * and ‡ symbols indicate significant main effects (p < 0.05) on one-way RM ANOVA for the left and right hemidiaphragm, respectively. # indicates a significant (p < 0.05) effect on one-way RM ANOVA for respiratory rate data. Phr = phrenic, amp = amplitude, BL = baseline, SP = systolic pressure, DP = diastolic pressure, HR = heart rate, MAP = mean arterial pressure.
Figure 6—figure supplement 1

Impact of DREADD activation on diaphragm electromyogram (EMG) in ChAT-Cre rats.
Example trace of rectified and integrated diaphragm EMG activity from a ChAT-Cre rat that had previously undergone injections of AAV9-hSyn-DIO-hM3D(Gq)-mCherry into the C4 ventral horns before and after application of the DREADD ligand, J60. Callout panels below show example activity at baseline (a), after injection of vehicle (b), and after application of the DREADD ligand, J60 (c).
Figure 7
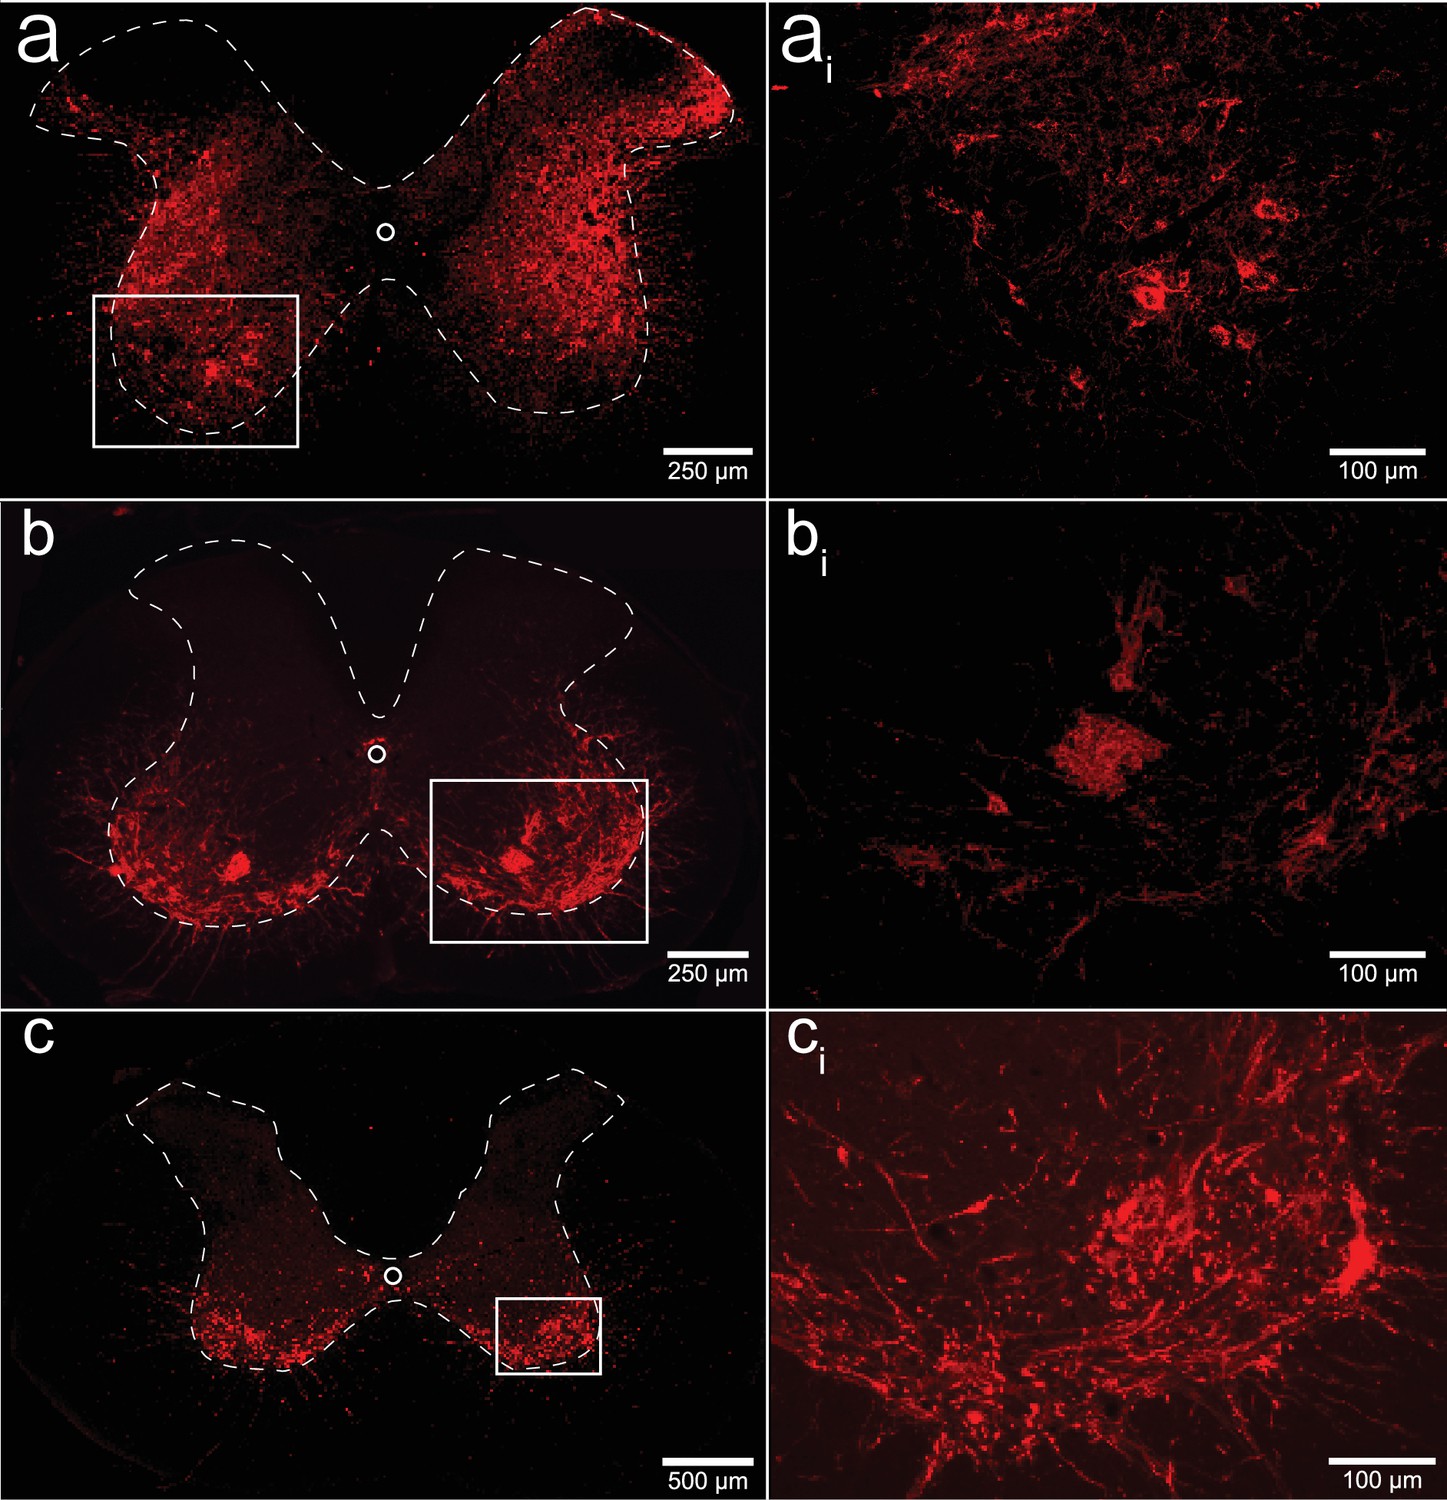
Histological assessment of mCherry expression in the C4/C5 spinal segments.
Representative photomicrographs of mid-cervical spinal sections from a wild-type mouse (a, ai), a ChAT-Cre mouse (b, bi), and a ChAT-Cre rat (c, ci). Wild-type mice (a, ai) showed a non-specific pattern of expression throughout the mid-cervical gray matter. ChAT-Cre mice and rats (b–ci) showed expression limited to neurons in the ventral horns. Red color indicates positive and mCherry fluorescence. Dashed white line indicates the approximate white–gray matter demarcation.
Figure 8 with 1 supplement
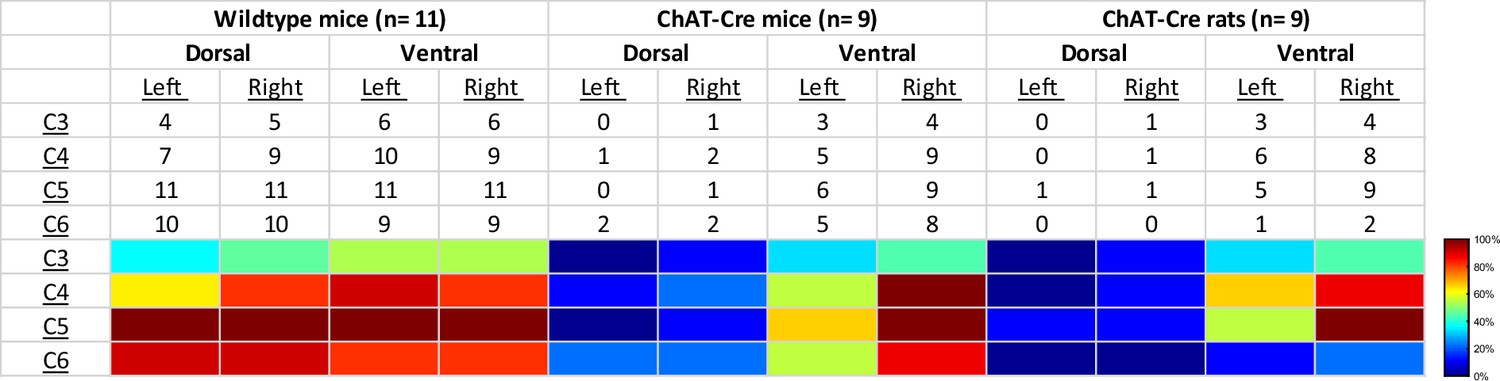
Qualitative assessment of mCherry expression in the mid-cervical spinal cord.
Spinal segments C3–C6 were assessed in quadrants broken into dorsal, ventral, left, and right. Spinal segments were counted as ‘positive’ if they showed any evidence of mCherry expression in neuronal soma or fibers. The counts therefore indicate the number of animals of a given cohort that were mCherry positive for a given spinal segment quadrant. All animals showed a slight trend for more mCherry expression moving rostral to caudal and for more expression in the ventral versus the dorsal lamina. This trend was more prominent in the ChAT-Cre animals. At the bottom of the table, a heatmap is provided for easier assessment of the distribution of positive mCherry counts across quadrants and spinal segments.
Figure 8—figure supplement 1

Example quantification of mCherry expression in the C3–C6 spinal cord.
Mid-cervical spinal cord images from ChAT-Cre animal (left) with positive mCherry expression. A grid has been placed on each image to highlight the quadrant system (i.e., left dorsal, right dorsal, left ventral, right ventral) used to score the tissue. The right column shows an outline of each section on the left with a score for each quadrant based on mCherry expression. A given quadrant was scored with a ‘+’ if it contained any mCherry-positive neurons or fibers else it was given a ‘−’ signifying no mCherry expression.
Figure 9

Experimental timelines.
Timelines of mouse (a) and rat (b) studies. Both cohorts of animals underwent an initial surgery to introduce an AAV vector encoding the excitatory DREADD, hM3D(Gq) in the ventral mid-cervical spinal cord bilaterally. Mice incubated for 4–9 weeks before undergoing terminal diaphragm electromyogram (EMG) recordings. Rats incubated for 14–16 weeks before undergoing plethysmography recordings, 2–8 weeks later rats underwent terminal phrenic nerve recordings. In all experiments, baseline parameters were established followed by an infusion of vehicle, and subsequently the selective DREADD ligand, J60.
Author response image 1

Plots of diaphragm EMG peak amplitude, (a-b) and area under the curve (c-d) vs. days post-AAV injection for wild-type (blue) and ChAT-Cre (orange) mice.
Pearson correlation analyses were performed to assess the relationship between time post-AAV injection and diaphragm EMG DREADD response in wild-type and ChAT-Cre mouse cohorts. r2, r, and p-values are shown in each panel for both cohorts. Panels a and c display peak amplitude and AUC, respectively, including all animals. Panels b and d present the same variables with the n = 1 wild-type mouse at the 9-week time point excluded; ChAT-Cre data is unchanged between corresponding panels. Scatter points represent data from individual animals. Polynomial trendlines are displayed for each cohort with wild-type in blue and ChAT-Cre in orange.
Author response image 2

Diaphragm EMG response to J60 administrated to naïve rats and mice.
Panel a-b show raw EMG values at baseline, following vehicle (saline) and J60 administration for the left and right hemidiaphragm. Panel c-d shows EMG values normalized to baseline. Neither One-way RM ANOVA (panel a-b) nor paired t-test (panel c-d) returned significant p values (p < 0.05).
Tables
Key resources table
| Reagent type (species) or resource | Designation | Source or reference | Identifiers | Additional information |
|---|---|---|---|---|
| Recombinant DNA reagent | pAAV-hSyn-hM3D(Gq)-mCherry | Addgene | RRID:Addgene_50474 | AAV transgene plasmid |
| Recombinant DNA reagent | pAAV-hSyn-DIO-hM3D(Gq)-mCherry | Addgene | RRID:Addgene_44361 | AAV transgene plasmid |
| Chemical compound, drug | JHU37160 | HelloBio | HB6261 | DREADD agonist |
| Software, algorithm | MATLAB | MathWorks | Version R2019a (9.6.1072779) RRID:SCR_001622 | |
| Software, algorithm | SigmaPlot | Systat Software | Version 14 RRID:SCR_003210 | |
| Software, algorithm | R | The R Foundation for Statistical Computing | Version 4.3.1 – ‘Beagle Scouts’ RRID:SCR_001905 |
Additional files
-
Supplementary file 1
Statistical summary for the impact of DREADD activation on diaphragm EMG in wild-type mice.
Time points are in reference to minutes passed since J60 infusion. Summary data are presented in Figure 1. EMG = electromyography, AUC = area under the curve, RM = repeated measures, df = degrees of freedom. Bolded p-values indicate p < 0.05.
- https://cdn.elifesciences.org/articles/97846/elife-97846-supp1-v1.docx
-
Supplementary file 2
Statistical summary for the impact of DREADD activation on diaphragm EMG in ChAT-Cre mice.
Time points are in reference to minutes passed since J60 infusion. Summary data are presented in Figure 2. EMG = electromyography, AUC = area under the curve, RM = repeated measures, df = degrees of freedom. Bolded p-values indicate p < 0.05.
- https://cdn.elifesciences.org/articles/97846/elife-97846-supp2-v1.docx
-
Supplementary file 3
Statistical summary for the impact of DREADD activation on diaphragm EMG in wild-type mice versus ChAT-Cre mice at the 30-min post-J60 infusion time point.
Summary data are presented in Figure 3. EMG = electromyography, AUC = area under the curve, df = degrees of freedom. Bolded p-values indicate p < 0.05.
- https://cdn.elifesciences.org/articles/97846/elife-97846-supp3-v1.docx
-
Supplementary file 4
Statistical summary for the impact of DREADD activation on plethysmography outcomes in unanesthetized ChAT-Cre rats using two-way repeated measures ANOVAs.
Each outcome measure is presented normalized to body weight (with the exception of respiratory rate) and normalized to values at baseline. Summary data are presented in Figure 5. RM = repeated measures, ml/kg = milliliters of air per kilogram of animal’s body weight, df = degrees of freedom. Bolded p-values indicate p < 0.05.
- https://cdn.elifesciences.org/articles/97846/elife-97846-supp4-v1.docx
-
Supplementary file 5
Statistical summary for the impact of DREADD activation on phrenic nerve activity in ChAT-Cre rats.
Time points are in reference to minutes passed since J60 infusion. Summary data are presented in Figure 6. RM = repeated measures, df = degrees of freedom. Bolded p-values indicate p < 0.05.
- https://cdn.elifesciences.org/articles/97846/elife-97846-supp5-v1.docx
-
MDAR checklist
- https://cdn.elifesciences.org/articles/97846/elife-97846-mdarchecklist1-v1.docx
Download links
A two-part list of links to download the article, or parts of the article, in various formats.
Downloads (link to download the article as PDF)
Open citations (links to open the citations from this article in various online reference manager services)
Cite this article (links to download the citations from this article in formats compatible with various reference manager tools)
Chemogenetic stimulation of phrenic motor output and diaphragm activity
eLife 13:RP97846.
https://doi.org/10.7554/eLife.97846.3


