Mechano-regulation of GLP-1 production by Piezo1 in intestinal L cells
- Department of Physiology, School of Medicine, Jinan University, China
- Department of Pathology, School of Basic Medicine, Guangzhou Medical University, China
- Biotherapy Center, Cell-gene Therapy Translational Medicine Research Center, The Third Affiliated Hospital of Sun Yat-Sen University, China
- School of Medicine, The Chinese University of Hong Kong, China
- Endoscopy Center, The First Affiliated Hospital of Jinan University, China
- Department of Pharmacology, School of Medicine, Jinan University, China
- Key Laboratory of Viral Pathogenesis & Infection Prevention and Control (Jinan University), Ministry of Education, China
Figures
Figure 1 with 8 supplements
Generation, validation, and characterization of Piezo1 IntL-CKO mice.
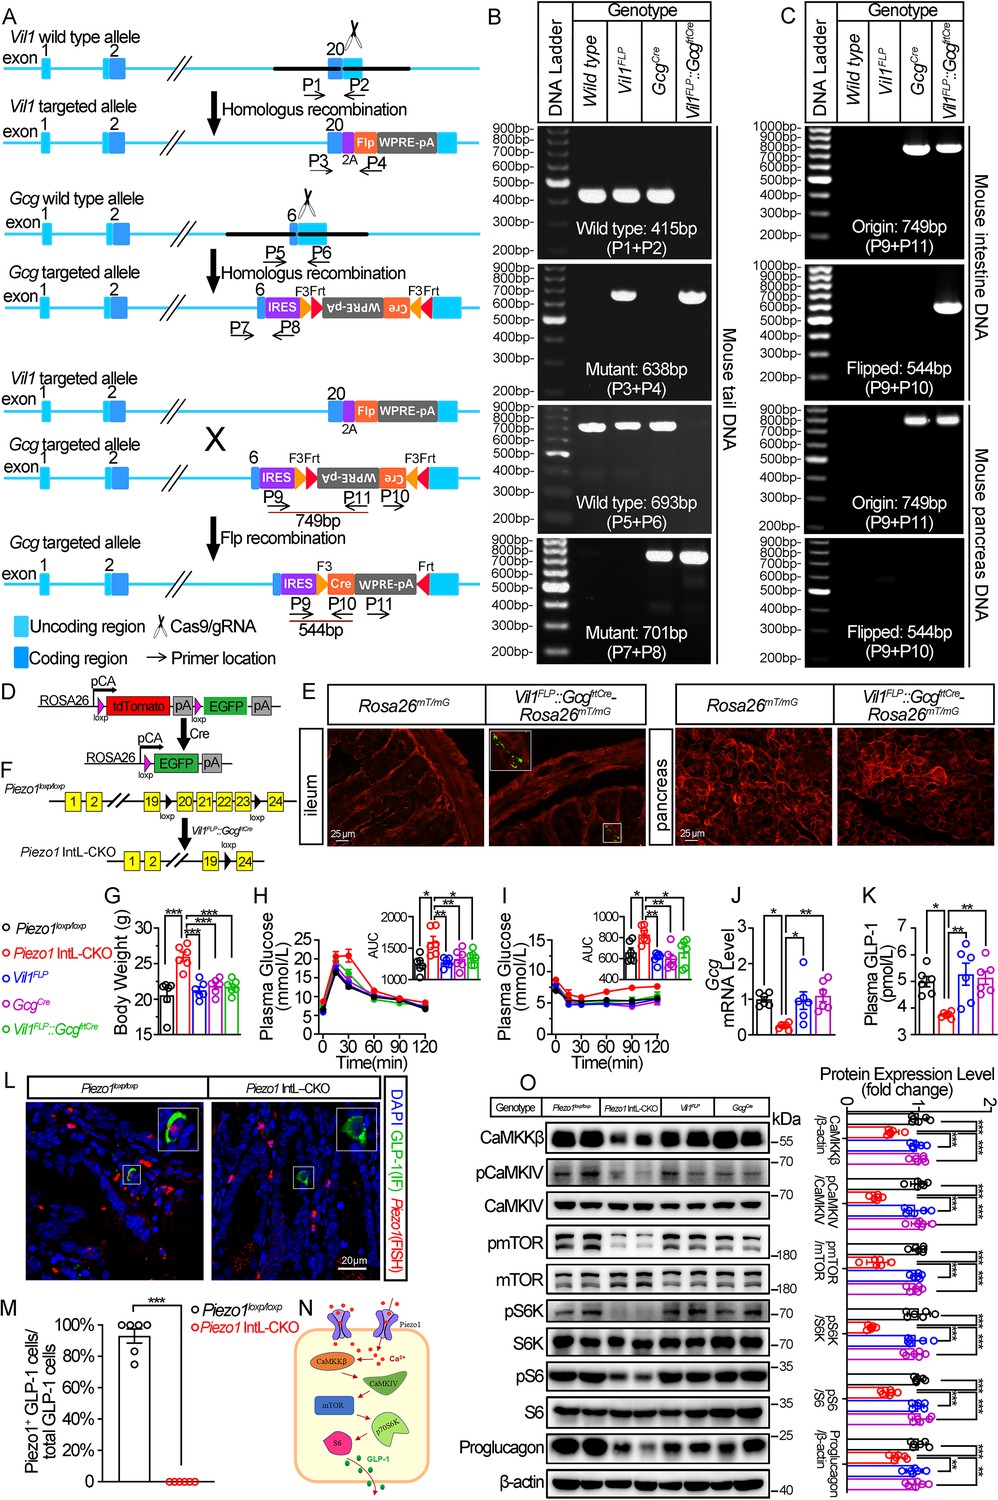
(A) Schematic description for the generation of Vil1FLP and Flippase-dependent GcgCre mice. Vil1FLP flip the inverted Cre gene in the GcgCre cassette in Vil1FLP::GcgfrtCre mice to restrict Cre expression in intestinal L cells. As shown, locations of genotyping primers are also indicated. (B) Tail DNA genotyping PCR results using genotyping primer for Vil1FLP, GcgCre and Flippase-activated Cre (Vil1FLP::GcgfrtCre) mice. (C) Intestine and pancreas DNA genotyping results. The ‘Original’ band represents the original GcgCre cassette with inverted Cre, while the ‘Flipped’ band represents recombined GcgCre cassette with Cre flipped into the correct direction. (D) Schematic description for the validation of Vil1FLP::GcgfrtCre efficacy by crossing with Rosa26mT/mG reporter mice. (E) Fluorescence was detected in the ileal and pancreatic tissues from Rosa26mT/mG and Vil1FLP::GcgfrtCre-Rosa26mT/mG mice by frozen tissue confocal microscopy. Green fluorescence represents successful deletion of TdTomato and reactivation of EGFP in the Cre-expressing cells. (F) Schematic description for the generation of Intestinal L cell-Piezo1-/- mice (Piezo1 IntL-CKO) by crossing Piezo1loxp/loxp mice with Vil1FLP::GcgfrtCre mice. (G) Body weight of 14- to 16-week-old male mice of the indicated genotypes fed with NCD (n=6/group). (H, I) IPGTT (H) and ITT (I) and associated area under the curve (AUC) values of 14- to 16-week-old male mice of the indicated genotypes fed with NCD (n=6/group). (J) Gcg mRNA levels in ileum of 14- to 16-week-old male mice of the indicated genotypes fed with NCD (n=6/group). (K) The plasma GLP-1 levels in 14- to 16-week-old male mice of the indicated genotypes fed with NCD (n=6/group). (L) Representative images for Piezo1 RNA-FISH and GLP-1 immunofluorescent staining in the ileum of 14-week-old male mice of indicated genotypes fed with NCD (n=6/group). (M) Percentage of Piezo1-positive GLP-1 cells in total GLP-1 cells in the ileal mucosa of 14-week-old male mice of indicated genotypes fed with NCD (n=6/group). (N) A schematic diagram depicting the potential mechanisms linking the CaMKKβ/CaMKIV-mTOR signaling pathway and GLP-1 production. (O) Representative western blots are shown for indicated antibodies in the ileal mucosa (n=6/group). Data are represented as mean ± SEM. Significance was determined by Student’s t test for comparison between two groups, and by one-way ANOVA for comparison among three groups or more, *p<0.05, **p<0.01, ***p<0.001.
-
Figure 1—source data 1
PDF file containing original gels and blots for Figure 1B, C and O, indicating the relevant bands and treatments.
- https://cdn.elifesciences.org/articles/97854/elife-97854-fig1-data1-v1.zip
-
Figure 1—source data 2
Original files for gel and western blot analysis displayed in Figure 1B, C and O.
- https://cdn.elifesciences.org/articles/97854/elife-97854-fig1-data2-v1.zip
-
Figure 1—source data 3
Original data for Figure 1.
- https://cdn.elifesciences.org/articles/97854/elife-97854-fig1-data3-v1.zip
Figure 1—figure supplement 1
Assessment of Piezo1 and GLP-1 in mouse and human ilea.
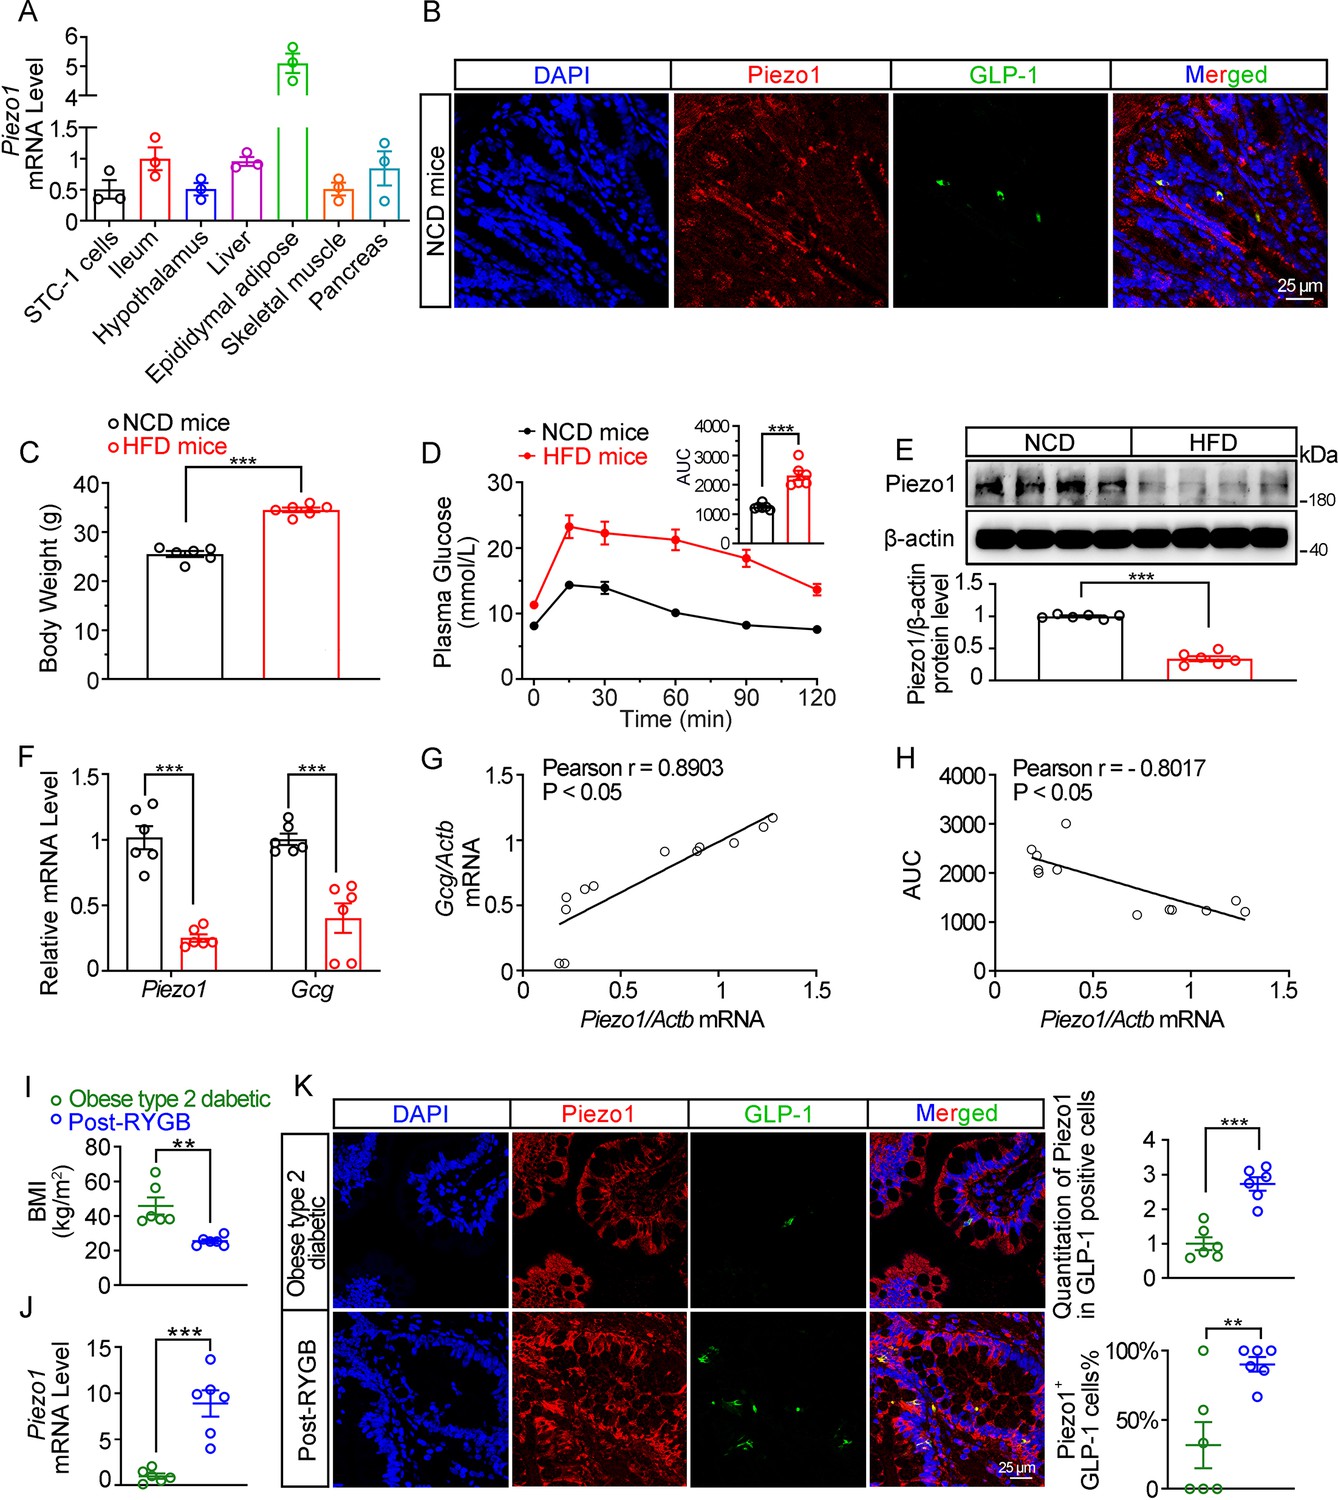
(A) Piezo1 mRNA levels in STC-1 cells and various tissues of 14-week-old male C57BL/6 J mice fed with normal chow diet (NCD). (B) Double immunofluorescent staining of Piezo1 (red) and GLP-1 (green) in the NCD mouse ileum. (C) Body weight of 14-week-old male C57BL/6 J mice were fed with either normal chow diet (NCD) or high-fat diet (HFD) (n=6/group). (D) IPGTT and associated area under the curve (AUC) values of 14-week-old male C57BL/6 J mice fed with NCD or HFD (n=6/group). (E) Representative western blots are shown for Piezo1 and β-actin protein levels in the ileal mucosa of 14-week-old male C57BL/6 J mice fed with NCD or HFD (n=6/group). (F) Piezo1 and Proglucagon (Gcg) mRNA levels in the ileal mucosa of 14-week-old male C57BL/6 J mice fed with NCD or HFD detected by qPCR (n=6/group). (G) Pearson’s correlation analysis of the correlation between ileal mucosal Piezo1 and Gcg mRNA levels in 14-week-old male C57BL/6 J mice fed with NCD or HFD. (H) Pearson’s correlation analysis of the correlation between area under the curve (AUC) for glucose excursion and ileal mucosal Piezo1 mRNA level in 14-week-old male C57BL/6 J mice fed with NCD or HFD. (I) Body mass index (BMI) of post-RYGB subjects and obese type 2 diabetics (n=6/group). (J) Piezo1 mRNA levels in the ileal mucosa of post-RYGB subjects and obese type 2 diabetics by qPCR (n=6/group). (K) Double immunofluorescent staining of Piezo1 and GLP-1 in the ileum of post-RYGB patients and obese type 2 diabetic patients. (n=6/group). Data are represented as mean ± SEM. Significance was determined by Student’s t test for comparison between two groups, and by one-way ANOVA for comparison among three groups or more. *p<0.05, **p<0.01, ***p<0.001.
-
Figure 1—figure supplement 1—source data 1
PDF file containing original western blots for Figure 1—figure supplement 1E, indicating the relevant bands and treatments.
- https://cdn.elifesciences.org/articles/97854/elife-97854-fig1-figsupp1-data1-v1.zip
-
Figure 1—figure supplement 1—source data 2
Original files for western blot analysis displayed in Figure 1—figure supplement 1E.
- https://cdn.elifesciences.org/articles/97854/elife-97854-fig1-figsupp1-data2-v1.zip
-
Figure 1—figure supplement 1—source data 3
Original data for Figure 1—figure supplement 1.
- https://cdn.elifesciences.org/articles/97854/elife-97854-fig1-figsupp1-data3-v1.zip
Figure 1—figure supplement 2
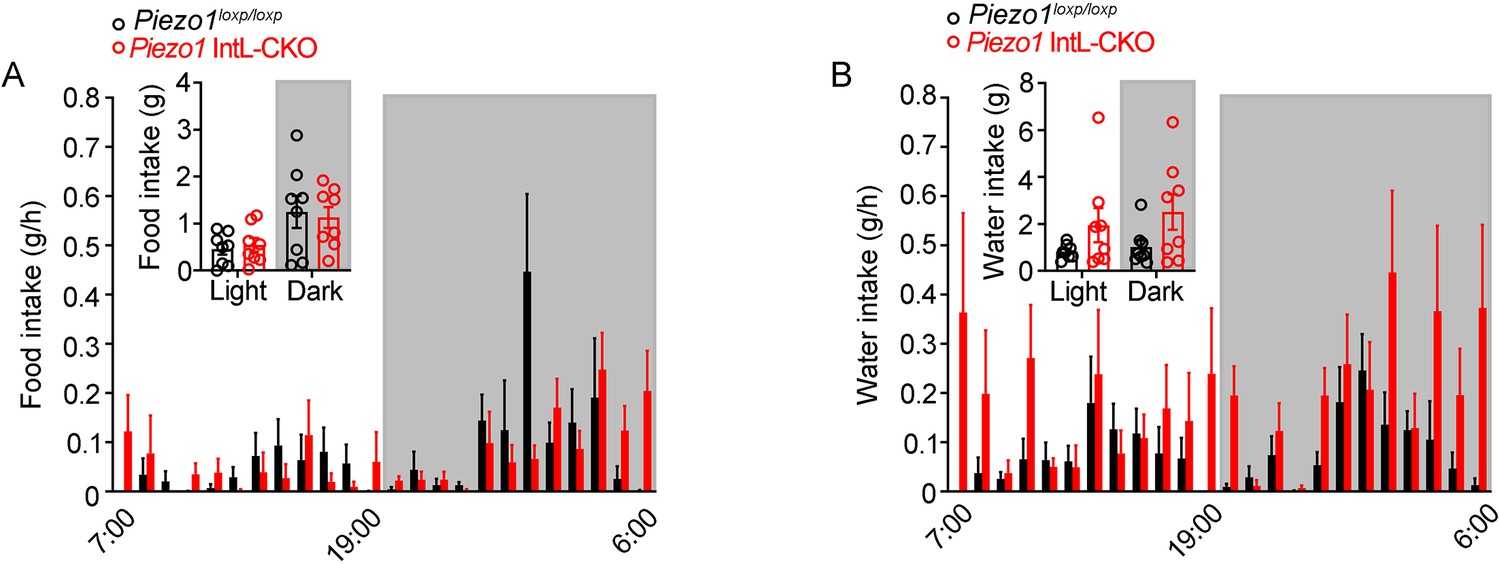
Food intake and water intake of Piezo1 IntL-CKO mice.
(A) Food intake and (B) water intake of 12- to 14-week-old male Piezo1loxp/loxp and Piezo1 IntL-CKO mice fed with normal chow diet (n=8/group). Data are represented as mean ± SEM. Significance was determined by Student’s t test. *p<0.05, **p<0.01, ***p<0.001.
-
Figure 1—figure supplement 2—source data 1
Original files for food intake analysis displayed in Figure 1—figure supplement 2.
- https://cdn.elifesciences.org/articles/97854/elife-97854-fig1-figsupp2-data1-v1.zip
Figure 1—figure supplement 3
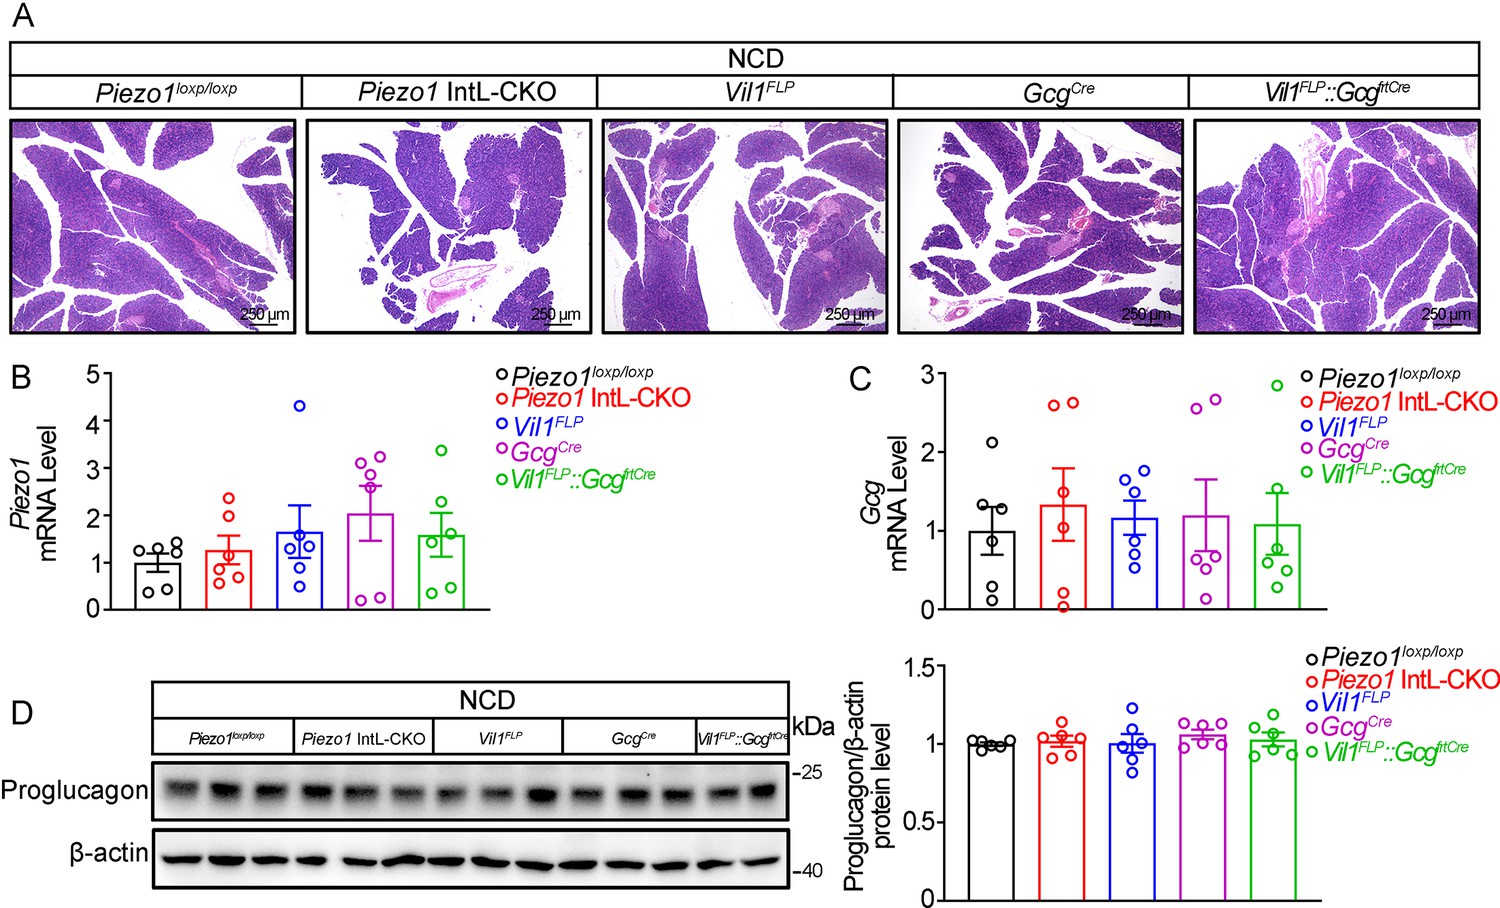
Piezo1 IntL-CKO mice preserve normal pancreatic morphology and Proglucagon expression under normal diet feeding.
(A) HE staining of pancreatic sections from 14- to 16-week-old male mice of the indicated genotypes fed with NCD. (B, C) Piezo1 (B) and Gcg (C) mRNA levels in pancreas of 14- to 16-week-old male mice of the indicated genotypes fed with NCD. (n=6/group). (D) Western blot analysis of Proglucagon protein levels in pancreas of 14- to 16-week-old male mice of the indicated genotypes fed with NCD (n=6/group). Data are represented as mean ± SEM. Significance was determined by Student’s t test for comparison between two groups, and by one-way ANOVA for comparison among three groups or more, *p<0.05, **p<0.01, ***p<0.001.
-
Figure 1—figure supplement 3—source data 1
PDF file containing original western blots for Figure 1—figure supplement 3D, indicating the relevant bands and treatments.
- https://cdn.elifesciences.org/articles/97854/elife-97854-fig1-figsupp3-data1-v1.zip
-
Figure 1—figure supplement 3—source data 2
Original files for western blot analysis displayed in Figure 1—figure supplement 3D.
- https://cdn.elifesciences.org/articles/97854/elife-97854-fig1-figsupp3-data2-v1.zip
-
Figure 1—figure supplement 3—source data 3
Original data for Figure 1—figure supplement 3.
- https://cdn.elifesciences.org/articles/97854/elife-97854-fig1-figsupp3-data3-v1.zip
Figure 1—figure supplement 4
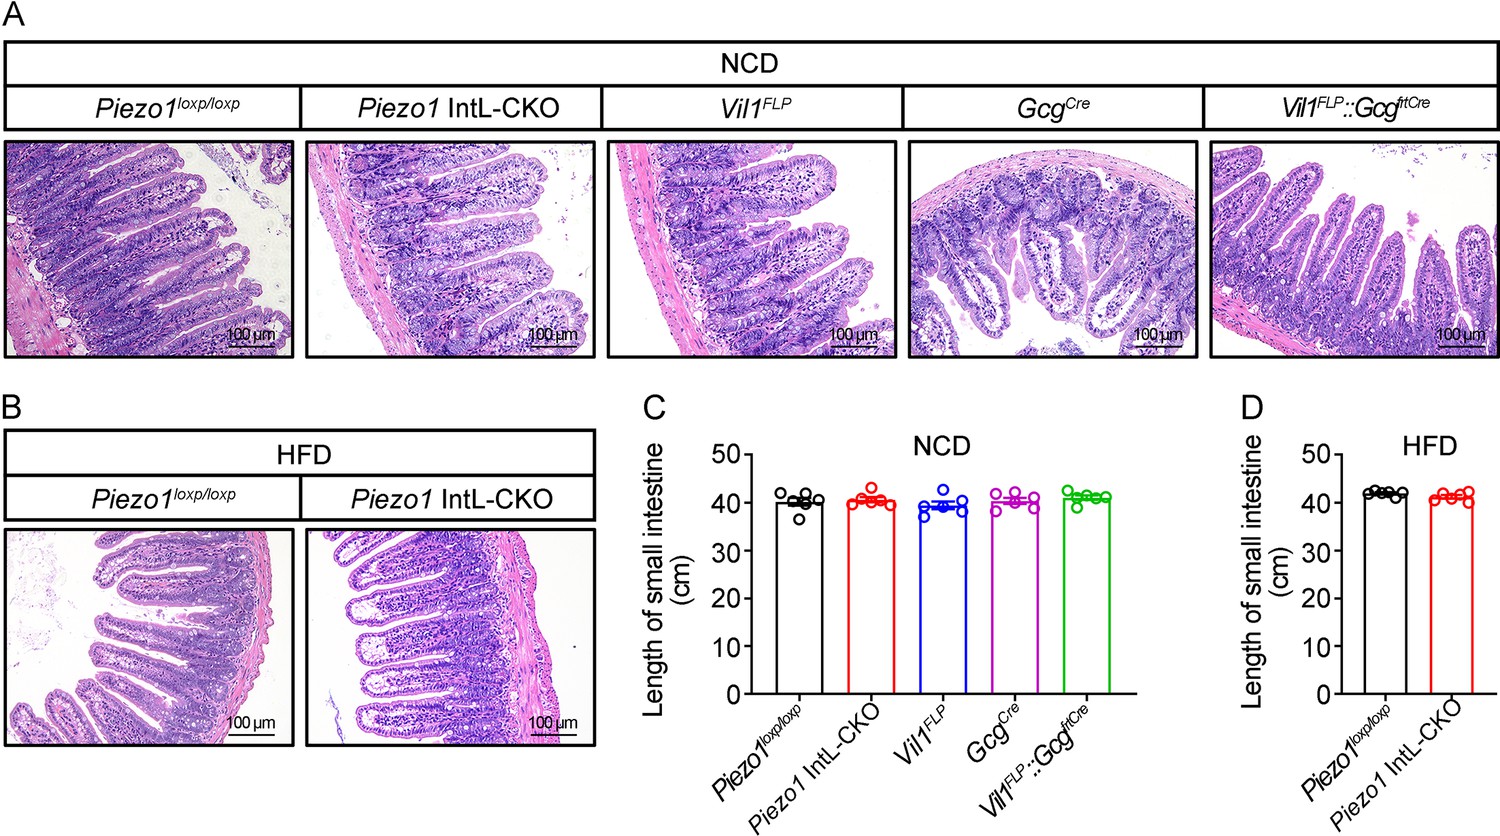
Intestinal morphology of Piezo1 IntL-CKO mice.
(A, B) HE staining of ileal sections from 14- to 16-week-old male mice of the indicated genotypes fed with NCD (A) or HFD (B). (C, D) The length of small intestine from male mice of the indicated genotypes fed with NCD (C) or HFD (D) (n=6/group). Data are represented as mean ± SEM. Significance was determined by Student’s t test for comparison between two groups, and by one-way ANOVA for comparison among three groups or more.
-
Figure 1—figure supplement 4—source data 1
Original files for length of small intestine analysis displayed in Figure 1—figure supplement 4C, D.
- https://cdn.elifesciences.org/articles/97854/elife-97854-fig1-figsupp4-data1-v1.zip
Figure 1—figure supplement 5
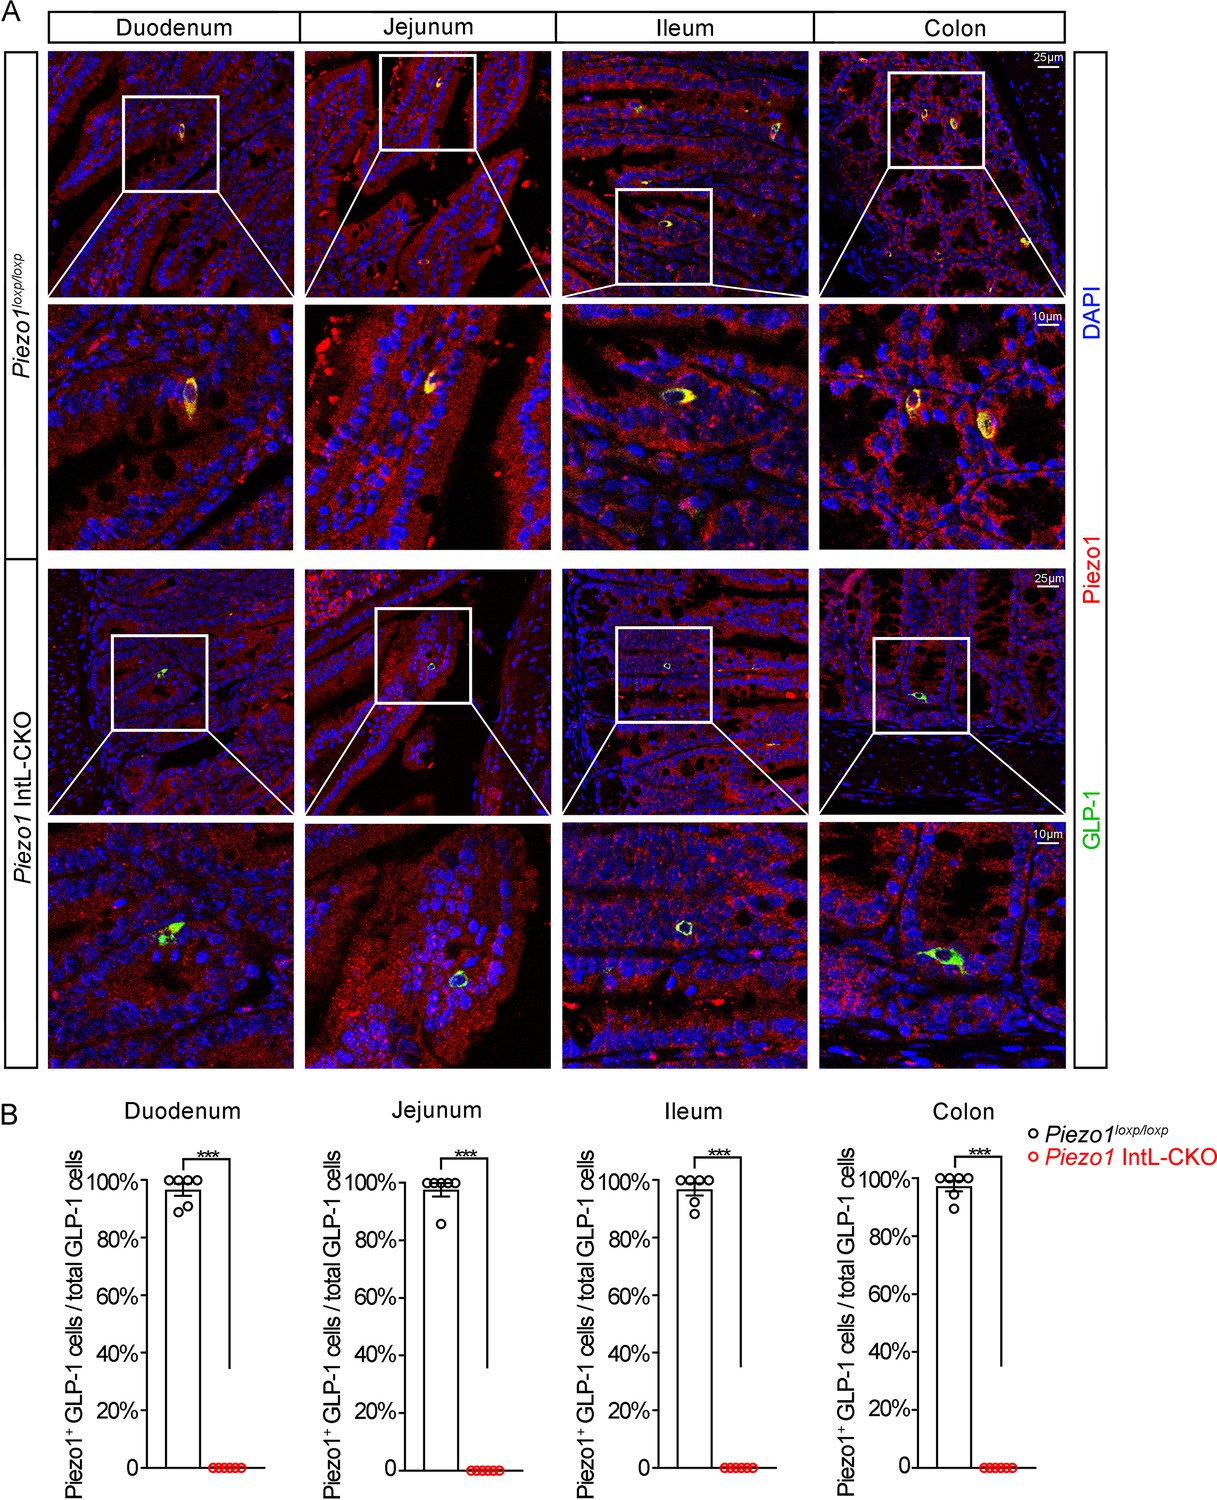
Double immunostaining of Piezo1 and GLP-1 in the intestines of Piezo1 IntL-CKO mice.
(A) Representative images for Piezo1 and GLP-1 immunofluorescent staining from different regions of the intestine of 14-week-old male mice of the indicated genotypes fed with NCD (n=6/group). (B) Percentage of Piezo1-positive GLP-1 cells in total GLP-1 cells in the different regions of intestinal mucosa of 14-week-old male mice of the indicated genotypes fed with NCD (n=6/group).
-
Figure 1—figure supplement 5—source data 1
Original files for the analysis of the percentage of Piezo1-positive GLP-1 cells among total GLP-1 cells in various regions of the intestinal mucosa are shown in Figure 1—figure supplement 5.
- https://cdn.elifesciences.org/articles/97854/elife-97854-fig1-figsupp5-data1-v1.zip
Figure 1—figure supplement 6
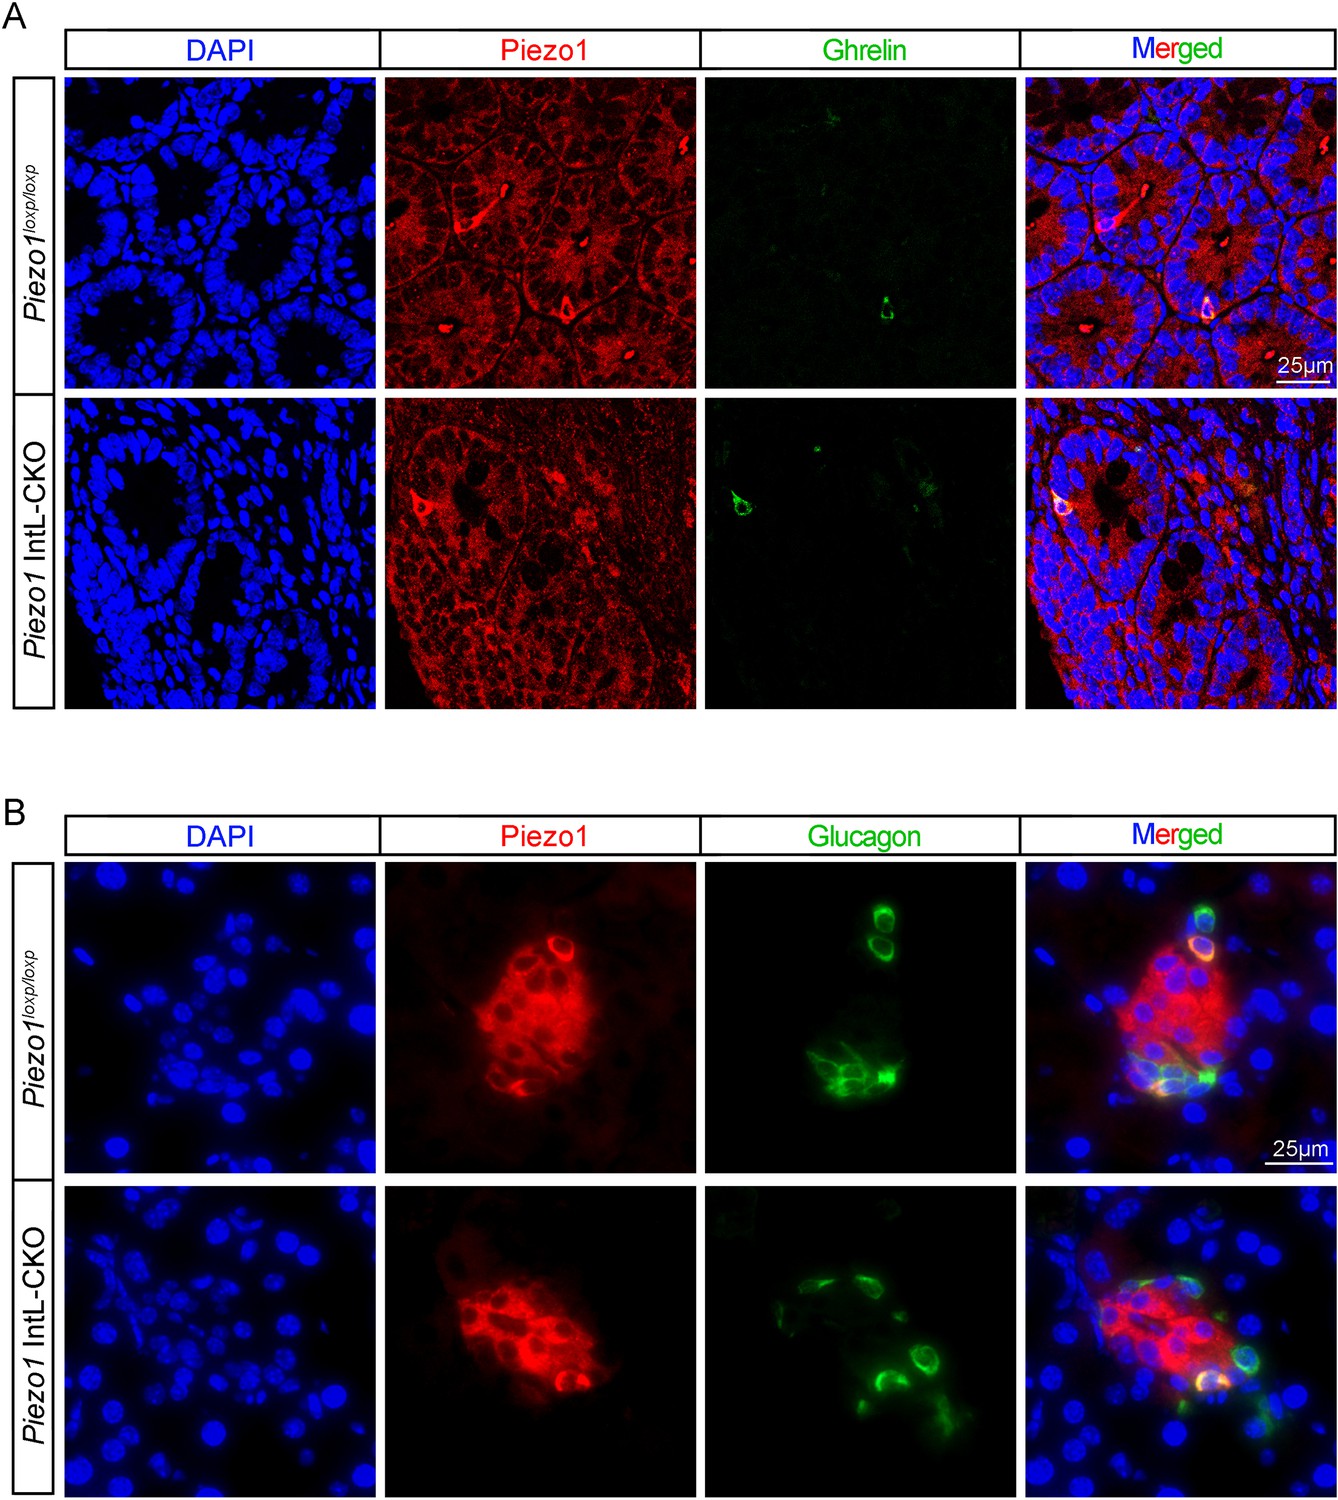
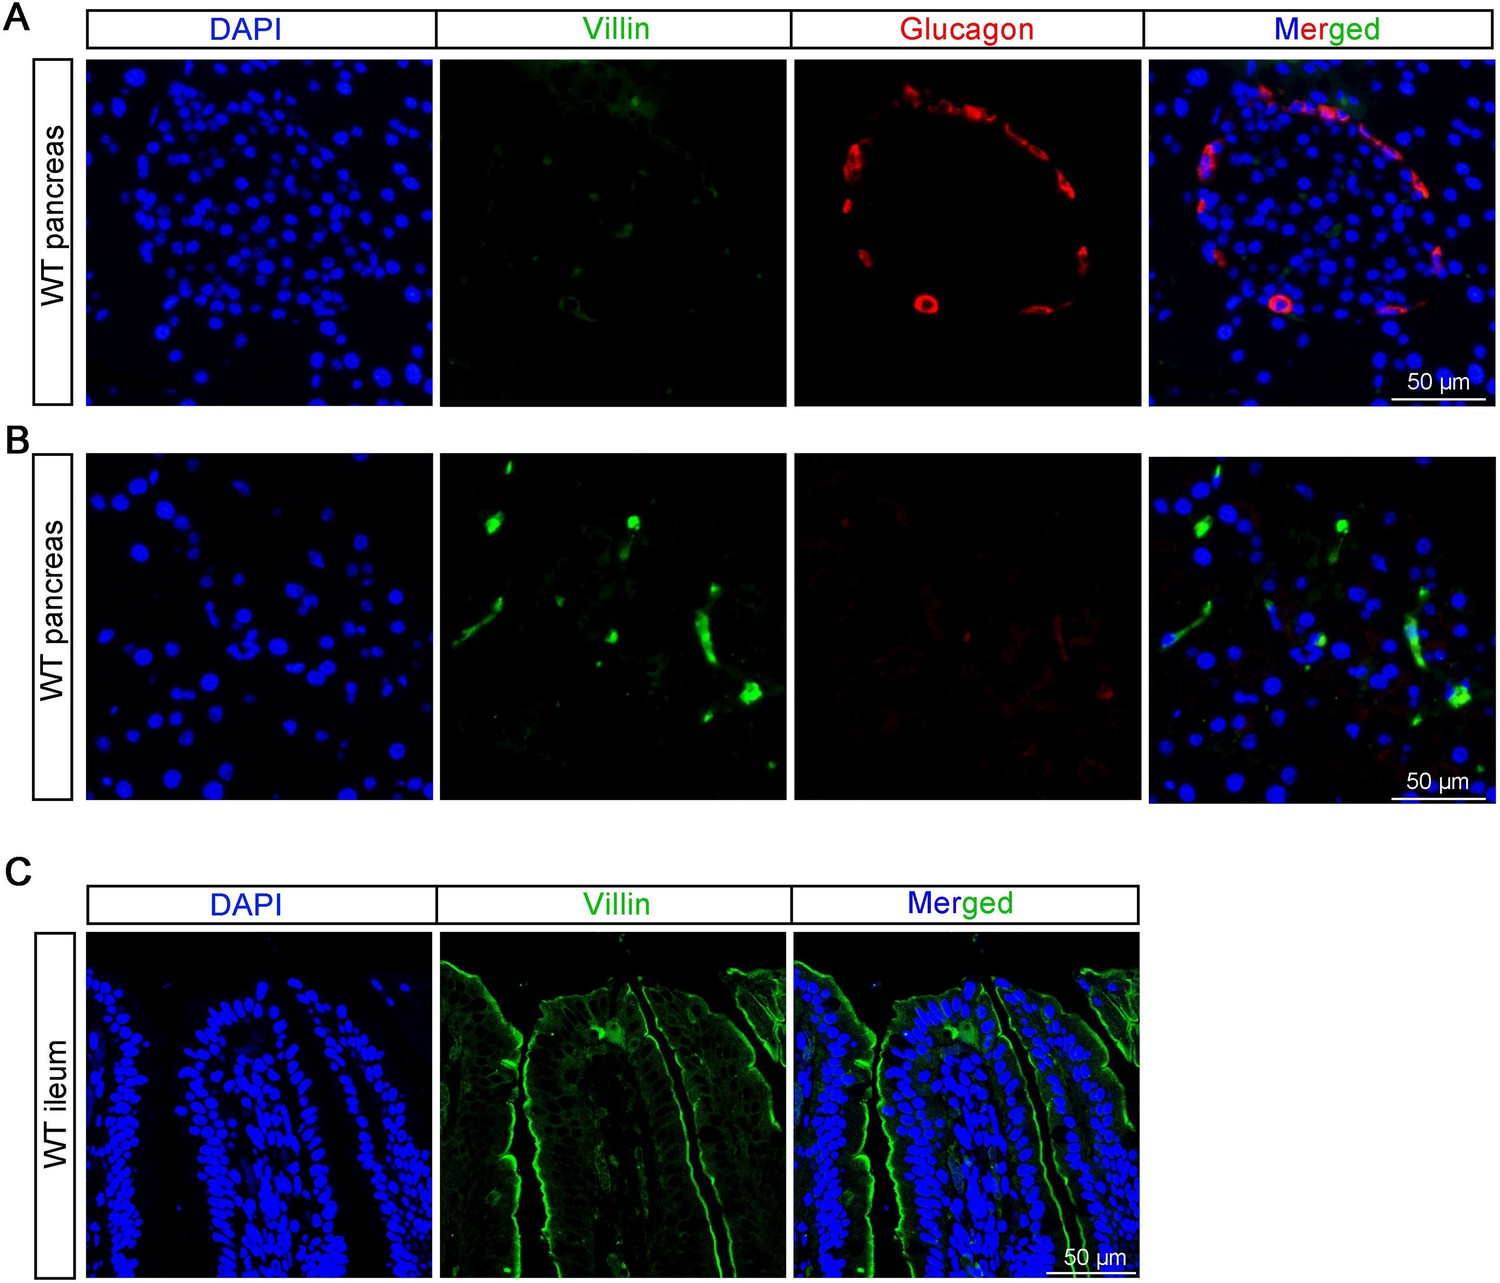
Expression of Piezo1 in intestinal ghrelin cells and pancreatic α cells.
(A) Representative images for Piezo1 and Ghrelin immunofluorescent staining in the ileum of 14-week-old male mice of the indicated genotypes fed with NCD (n=6/group). (B) Representative images for Piezo1 and Glucagon immunofluorescent staining in the pancreas of 14-week-old male mice of the indicated genotypes fed NCD (n=6/group).
Figure 1—figure supplement 7
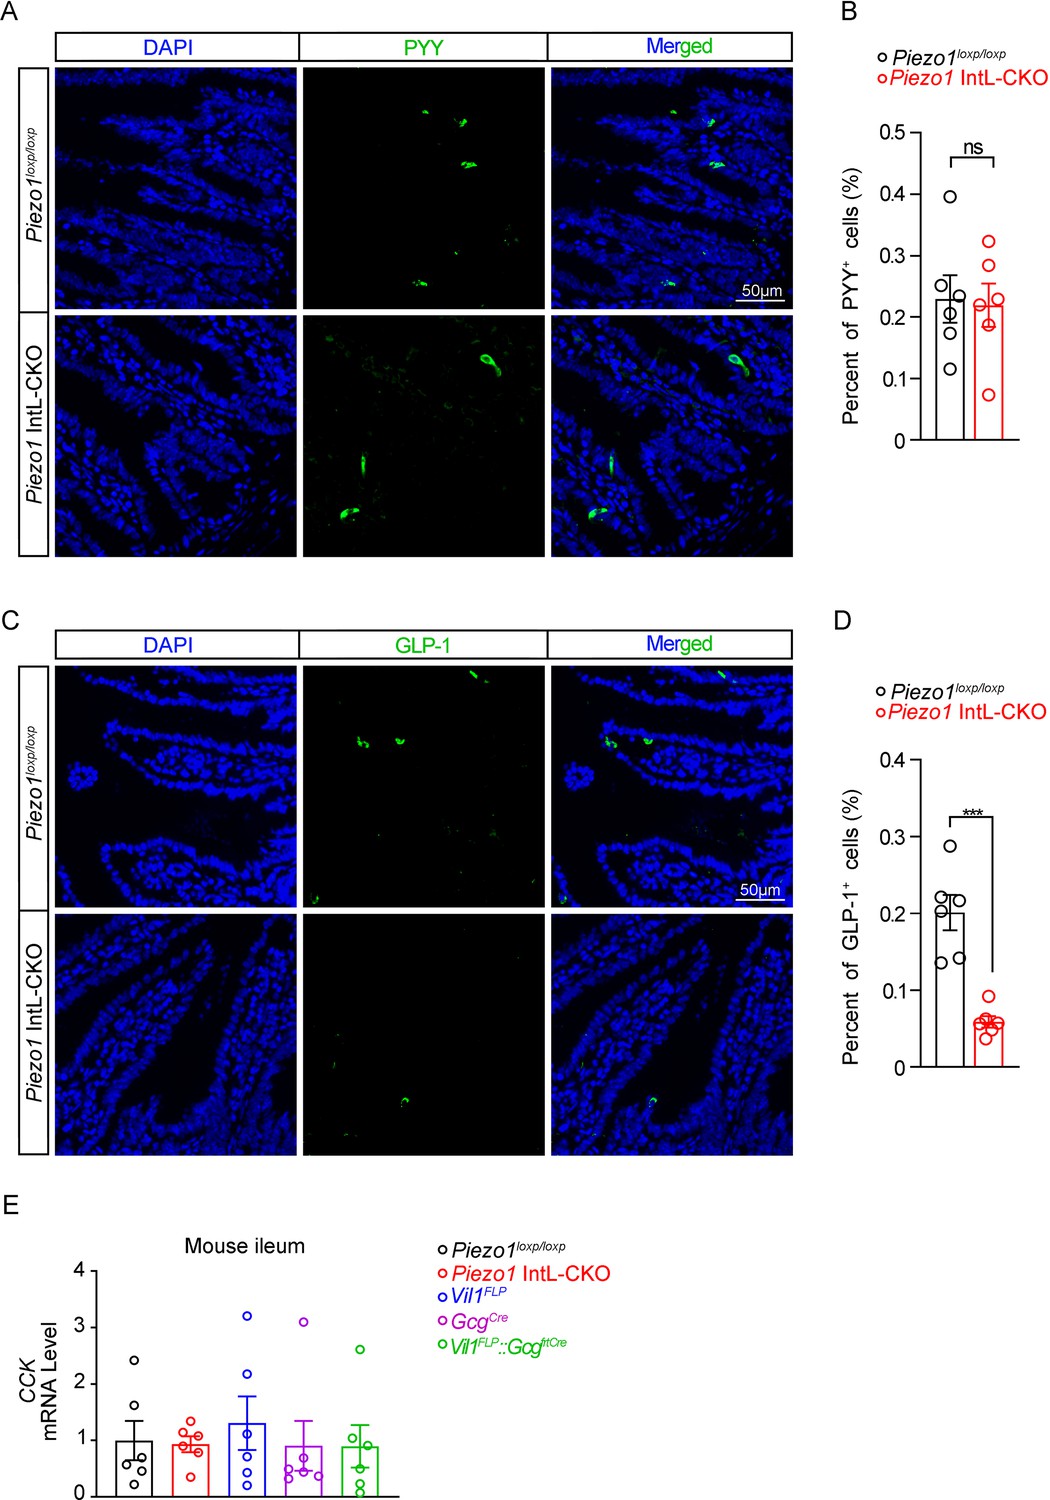
Assessment of L cell hormones and CCK in the ileum of Piezo1 IntL-CKO mice.
(A) Representative images for Peptide YY (PYY) immunofluorescent staining in the ileum of 14-week-old male mice of the indicated genotypes fed with NCD (n=6/group). (B) Percentage of PYY-positive cells in ileal mucosal cells (n=6/group). (C) Representative images for GLP-1 immunofluorescent staining in the ileum of 14-week-old male mice of the indicated genotypes fed with NCD (n=6/group). (D) Percentage of GLP-1-positive cells in ileal mucosal cells (n=6/group). (E) Ileal mucosal CCK mRNA levels of 14- to 16-week-old male mice of the indicated genotypes fed with NCD (n=6/group).
-
Figure 1—figure supplement 7—source data 1
Original data for Figure 1—figure supplement 7B, D and E.
- https://cdn.elifesciences.org/articles/97854/elife-97854-fig1-figsupp7-data1-v1.zip
Figure 1—figure supplement 8
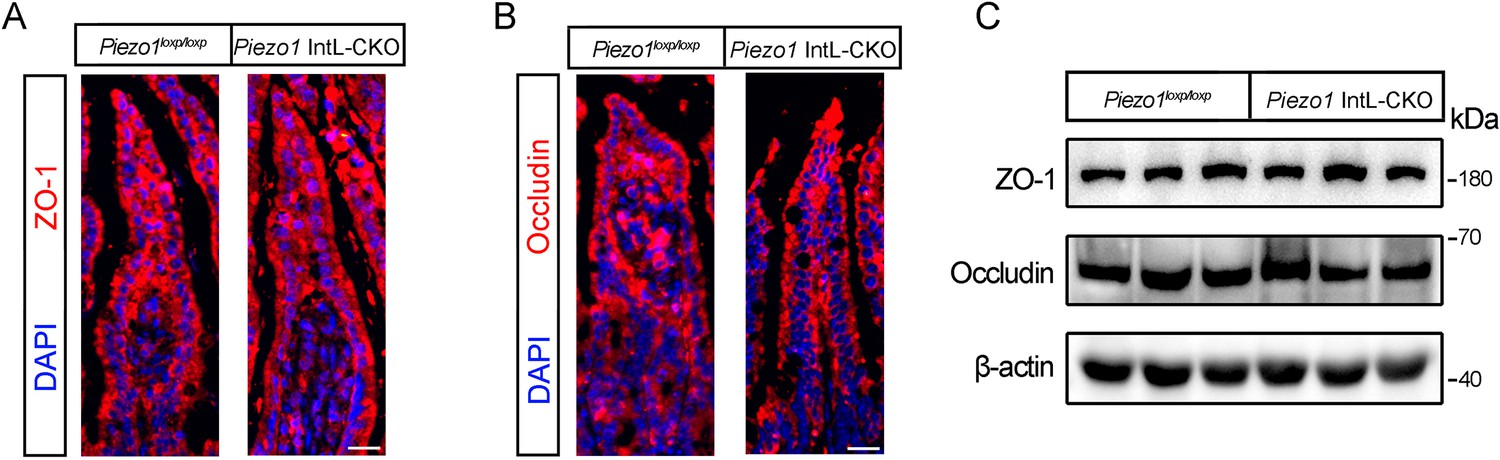
Effect of L cell-specific Piezo1 deletion on intestinal barrier function and tight junction proteins.
(A) Representative images for ZO-1 immunofluorescent staining in the ileum of 14-week-old male mice of the indicated genotypes fed with NCD (n=6/group). (B) Representative images for Occludin immunofluorescent staining in the ileum of 14-week-old male mice of the indicated genotypes fed with NCD (n=6/group). (C) Representative western blots are shown for ZO-1, Occludin and β-actin protein levels in the ileal mucosa of 14-week-old male mice of the indicated genotypes fed with NCD or HFD (n=6/group).
-
Figure 1—figure supplement 8—source data 1
PDF file containing original western blots for Figure 1—figure supplement 8C, indicating the relevant bands and treatments.
- https://cdn.elifesciences.org/articles/97854/elife-97854-fig1-figsupp8-data1-v1.zip
-
Figure 1—figure supplement 8—source data 2
Original files for western blot analysis displayed in Figure 1—figure supplement 8C.
- https://cdn.elifesciences.org/articles/97854/elife-97854-fig1-figsupp8-data2-v1.zip
Figure 2 with 1 supplement
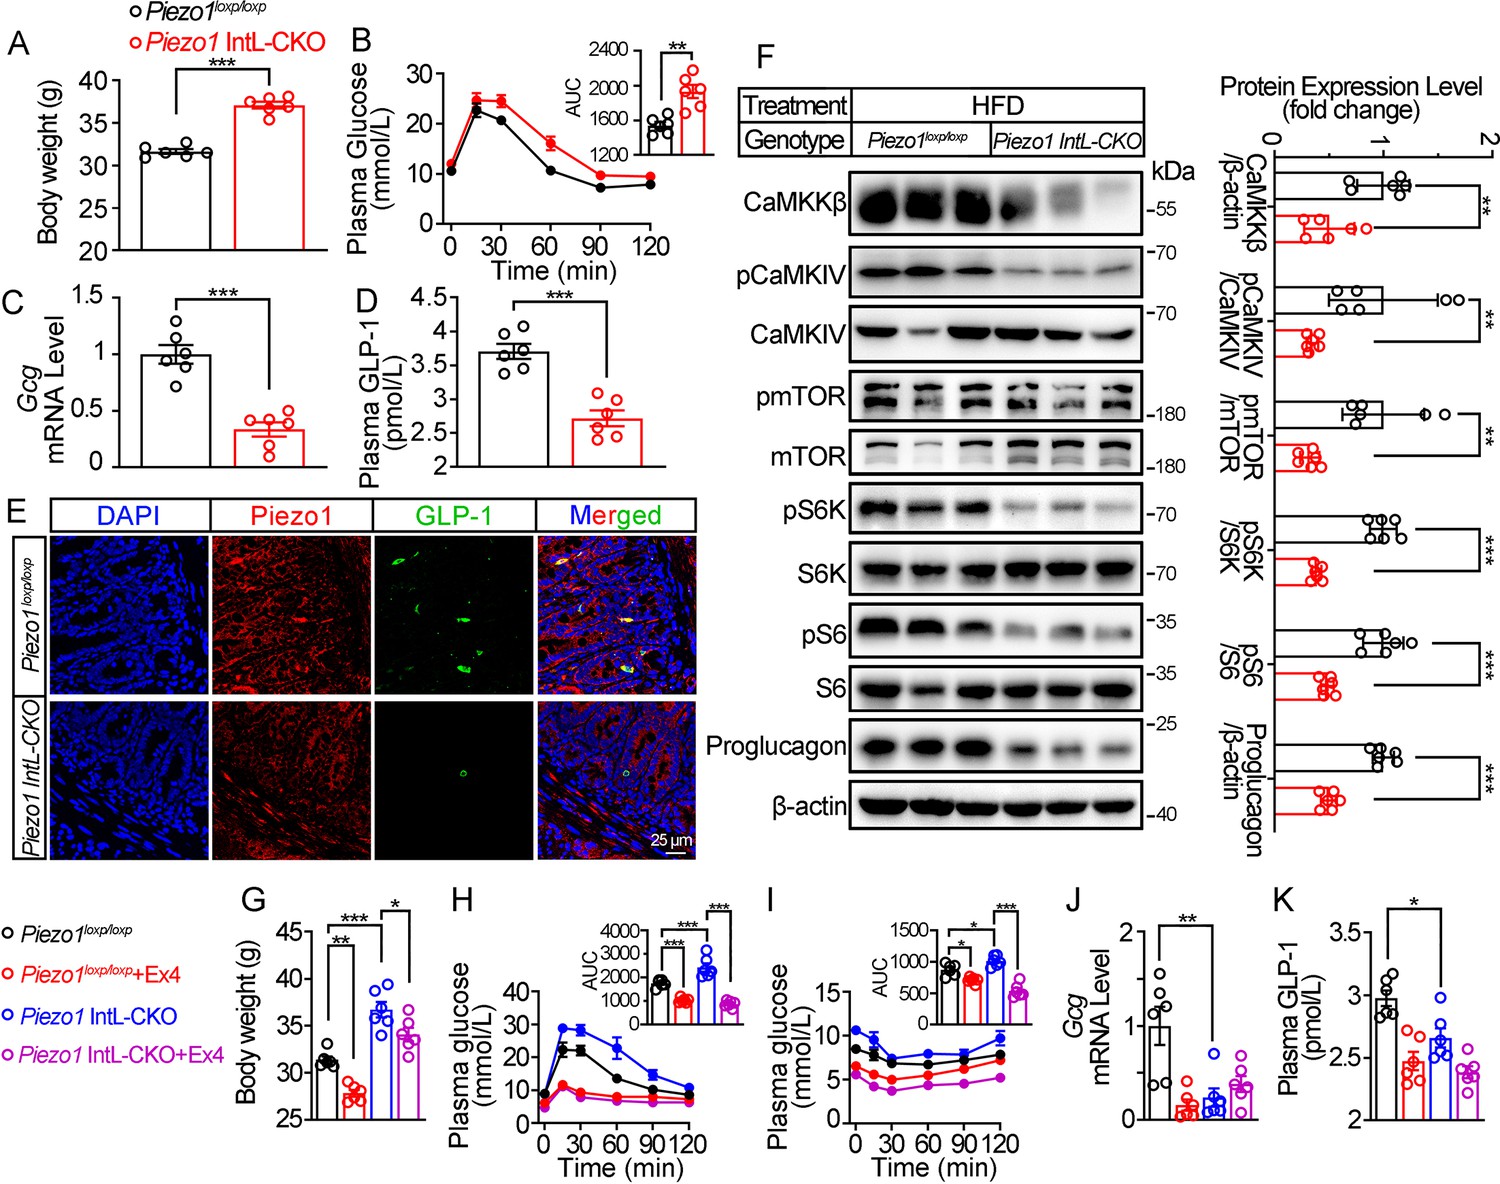
Validation and phenotype of Piezo1 IntL-CKO mice fed with high-fat diet.
(A) Body weight of 14- to 16-week-old male Piezo1loxp/loxp and Piezo1 IntL-CKO mice fed with HFD for 10 weeks (n=6/group). (B) IPGTT and associated area under the curve (AUC) values of 14- to 16-week-old male Piezo1loxp/loxp and Piezo1 IntL-CKO mice fed with HFD (n=6/group). (C) Gcg mRNA levels in the ileal mucosa of 14- to 16-week-old male Piezo1loxp/loxp and Piezo1 IntL-CKO mice fed with HFD (n=6/group). (D) The plasma GLP-1 level in 14- to 16-week-old male Piezo1loxp/loxp and Piezo1 IntL-CKO mice fed with HFD (n=6/group). (E) Double immunofluorescent staining of Piezo1, and GLP-1 in the ilea of 14- to 16-week-old male Piezo1loxp/loxp and Piezo1 IntL-CKO mice fed with HFD (n=6/group). (F) Representative western blots are shown for indicated antibodies in the ileal mucosa (n=6/group). (G) Body weight after 7 consecutive days infusion of saline or Ex-4 (100 µg/kg body weight) in 14- to 16-week-old male Piezo1loxp/loxp and Piezo1 IntL-CKO mice fed with HFD (n=6/group). (H, I) IPGTT (H) and ITT (I) and associated area under the curve (AUC) values after consecutive infusion of saline or Ex-4. (J) Gcg mRNA levels in the ileal mucosa (n=6/group) after consecutive infusion of saline or Ex-4. (K) The plasma GLP-1 level after consecutive infusion of saline or Ex-4 (n=6/group). Data are represented as mean ± SEM. Significance was determined by Student’s t test for comparison between two groups, and by one-way ANOVA for comparison among three groups or more, *p<0.05, **p<0.01, ***p<0.001.
-
Figure 2—source data 1
PDF file containing original western blots for Figure 2F, indicating the relevant bands and treatments.
- https://cdn.elifesciences.org/articles/97854/elife-97854-fig2-data1-v1.zip
-
Figure 2—source data 2
Original files for western blot analysis displayed in Figure 2F.
- https://cdn.elifesciences.org/articles/97854/elife-97854-fig2-data2-v1.zip
-
Figure 2—source data 3
Original data for Figure 2.
- https://cdn.elifesciences.org/articles/97854/elife-97854-fig2-data3-v1.zip
Figure 2—figure supplement 1
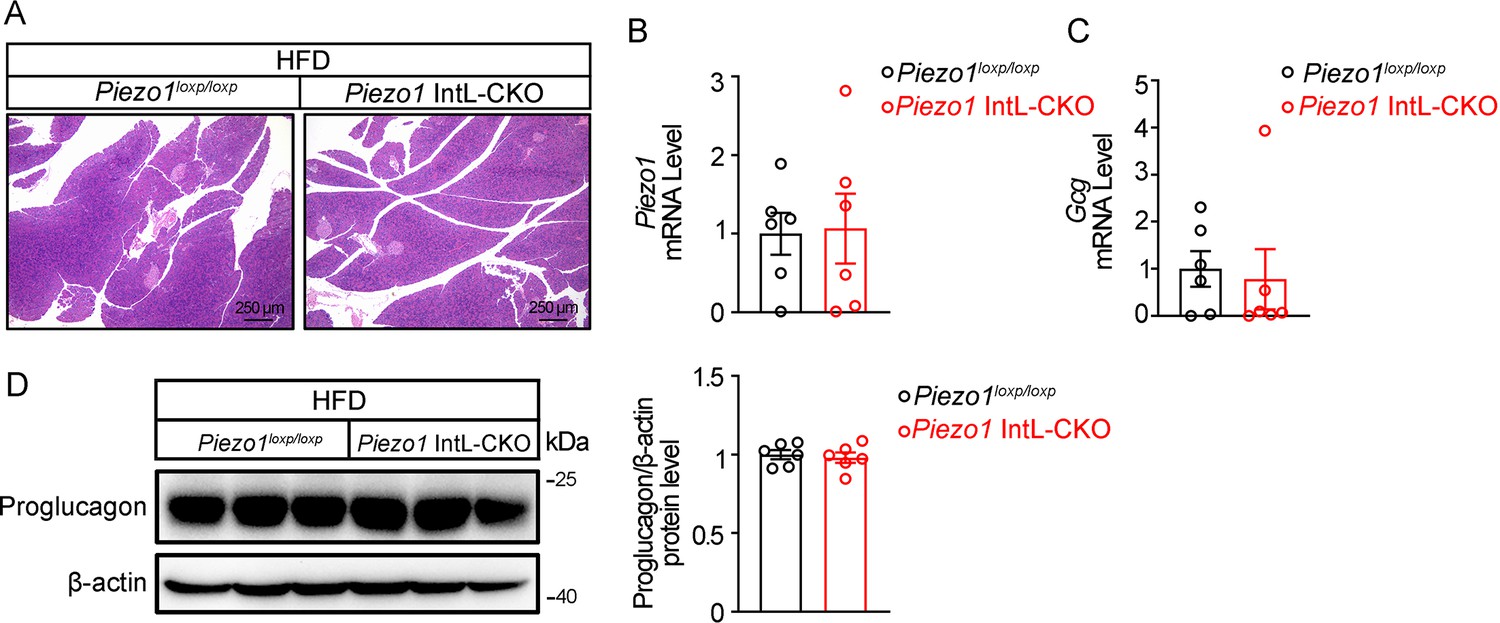
Piezo1 IntL-CKO mice preserve normal pancreatic morphology and proglucagon expression under HFD.
(A) HE staining of pancreatic sections from 14- to 16-week-old male Piezo1loxp/loxp and Piezo1 IntL-CKO mice fed with HFD. (B) Piezo1 and (C) Gcg mRNA levels in pancreas of 14- to 16-week-old male Piezo1loxp/loxp and Piezo1 IntL-CKO mice fed with HFD (n=6/group). (D) Western blot analysis of Proglucagon protein levels in pancreas of 14- to 16-week-old male Piezo1loxp/loxp and Piezo1 IntL-CKO mice fed with HFD (n=6/group). Data are represented as mean ± SEM. Significance was determined by Student’s t test for comparison between two groups, and by one-way ANOVA for comparison among three groups or more, *p<0.05, **p<0.01, ***p<0.001.
-
Figure 2—figure supplement 1—source data 1
PDF file containing original western blots for Figure 2—figure supplement 1D, indicating the relevant bands and treatments.
- https://cdn.elifesciences.org/articles/97854/elife-97854-fig2-figsupp1-data1-v1.zip
-
Figure 2—figure supplement 1—source data 2
Original files for western blot analysis displayed in Figure 2—figure supplement 1D.
- https://cdn.elifesciences.org/articles/97854/elife-97854-fig2-figsupp1-data2-v1.zip
-
Figure 2—figure supplement 1—source data 3
Original data for Figure 2—figure supplement 1.
- https://cdn.elifesciences.org/articles/97854/elife-97854-fig2-figsupp1-data3-v1.zip
Figure 3 with 1 supplement
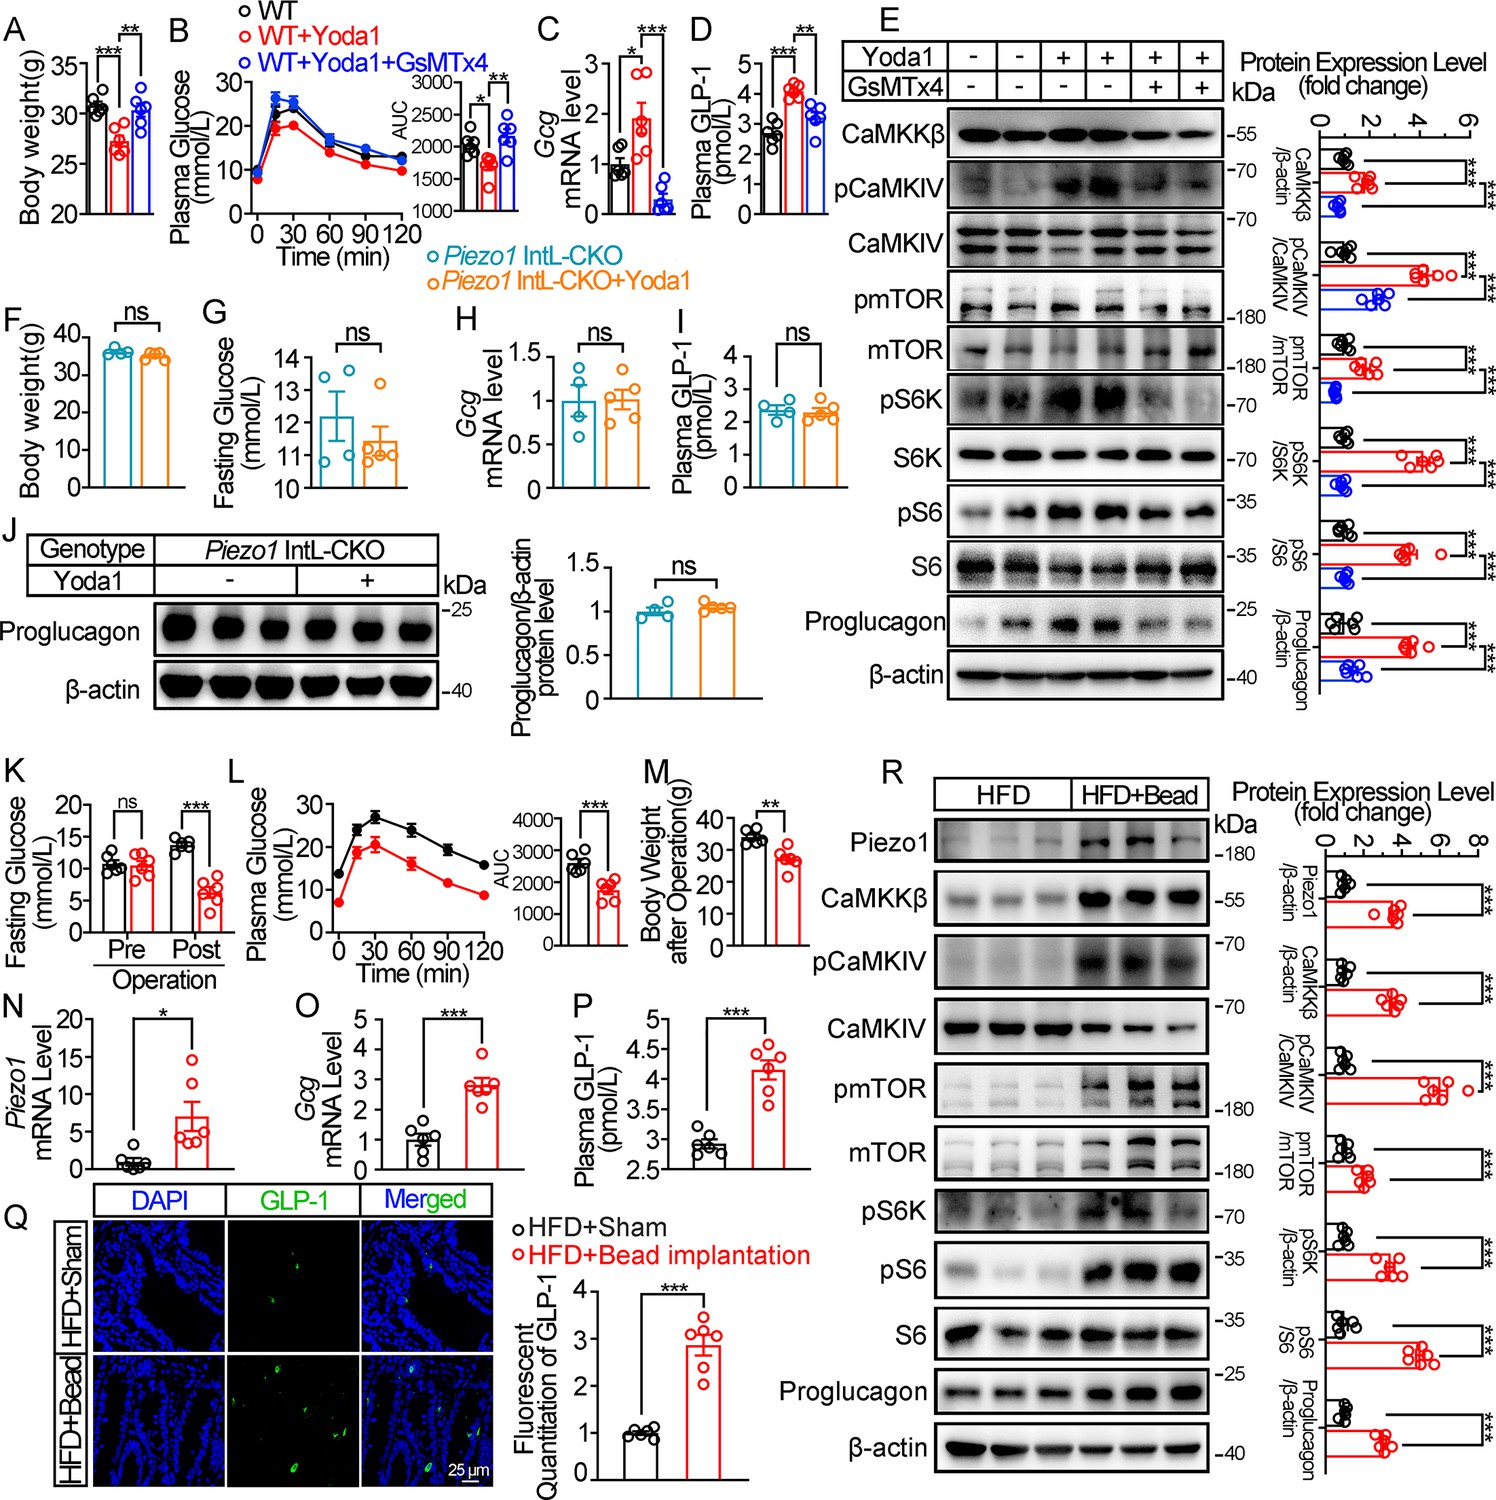
Chemical and mechanical interventions of Piezo1 regulate GLP-1 synthesis in mice.
(A–E) 14- to 16-week-old male C57BL/6 J mice fed with HFD for 10 weeks were infused with vehicle, Yoda1 (2 μg per mouse) or GsMTx4 (250 μg/kg) by i.p. for 7 consecutive days. (n=6/group). (A) Body weight after consecutive drug infusion. (B) IPGTT and associated area under the curve (AUC) values. (C) Gcg mRNA levels in the ileal mucosa. (D) Plasma GLP-1. (E) Representative western blots are shown for indicated antibodies in the ileal mucosa. (F–J) 14- to 16-week-old male Piezo1 IntL-CKO mice fed with HFD for 10 weeks were infused with vehicle, Yoda1 (2 μg per mouse) by i.p. for 7 consecutive days. (n=4 or 5/group). (F) Body weight after 7 consecutive days’ drug infusion. (G) Fasting blood glucose levels. (H) Ileal mucosal Gcg mRNA levels. (I) Plasma GLP-1 levels. (J) Ileal mucosal Proglucagon protein levels. (K–R) 14- to 16-week-old male C57BL/6 J mice fed with HFD were subjected to sham operation, or intestinal bead implantation (n=6/group). (K) Fasting blood glucose levels. (L) IPGTT and associated area under the curve (AUC) values. (M) Body weight. (N, O) Piezo1 (N) and Gcg (O) mRNA levels in the ileal mucosa. (P) The plasma GLP-1 levels. (Q) Immunofluorescence staining of GLP-1 in ileum and quantification of GLP-1-positive cells. (R) Representative western blots images and densitometry quantification for indicated antibodies in the ileal mucosa. Data are represented as mean ± SEM. Significance was determined by Student’s t test for comparison between two groups, and by one-way ANOVA for comparison among three groups or more, *p<0.05, **p<0.01, ***p<0.001.
-
Figure 3—source data 1
PDF file containing original western blots for Figure 3E, J and R, indicating the relevant bands and treatments.
- https://cdn.elifesciences.org/articles/97854/elife-97854-fig3-data1-v1.zip
-
Figure 3—source data 2
Original files for western blot analysis displayed in Figure 3E, J and R.
- https://cdn.elifesciences.org/articles/97854/elife-97854-fig3-data2-v1.zip
-
Figure 3—source data 3
Original data for Figure 3.
- https://cdn.elifesciences.org/articles/97854/elife-97854-fig3-data3-v1.zip
Figure 3—figure supplement 1
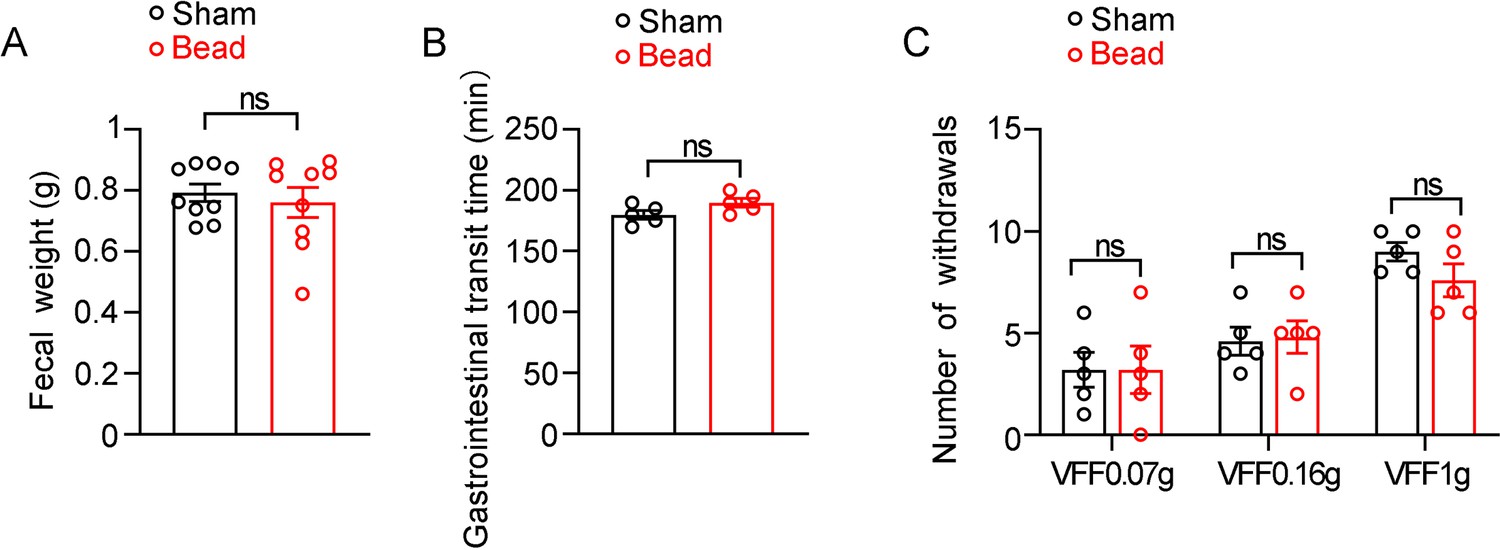
Effect of intestinal bead implantation on fecal weight, gastrointestinal transit time and abdominal pain in C57BL/6 J mice.
(A) Fecal weight of sham and bead implanted mice fed with HFD. (n=9/group). (B) Gastrointestinal transit time of sham and bead-implanted mice fed with HFD. (n=5/group). (C) Assessment of abdominal mechanical sensitivity. Mechanical sensitivity of the abdomen was assessed using calibrated von Frey filaments (0.07 g, 0.16 g, and 1 g) in sham and bead-implanted mice (n=5 per group). Data are represented as mean ± SEM. Significance was determined by Student’s t test for comparison between two groups, and by one-way ANOVA for comparison among three groups or more, *p<0.05, **p<0.01, ***p<0.001.
-
Figure 3—figure supplement 1—source data 1
Original data for Figure 3—figure supplement 1.
- https://cdn.elifesciences.org/articles/97854/elife-97854-fig3-figsupp1-data1-v1.zip
Figure 4
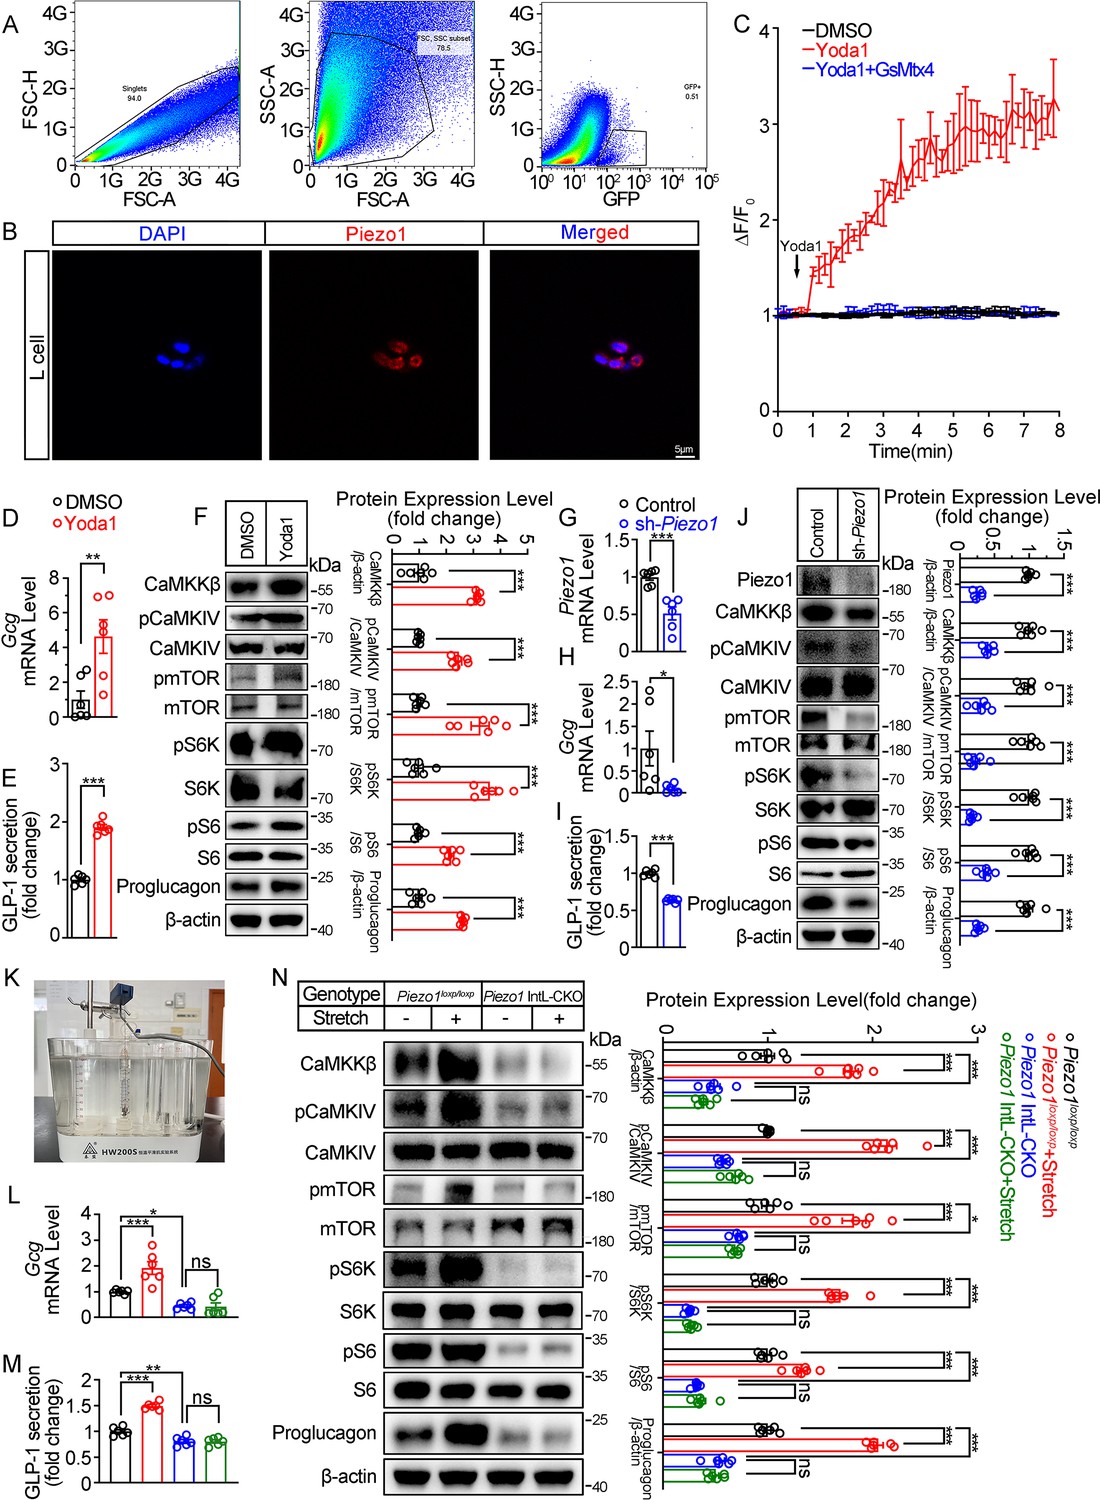
Piezo1 regulates GLP-1 synthesis and secretion in primary cultured mouse L cells and isolated mouse ileum.
(A) Isolation of mouse L cells (GFP positive) from ileal tissue by FACS. The gating in flowcytometry for sorting of GFP-positive cells. (B) Immunofluorescent staining of Piezo1 in sorted GFP-positive L cells. (C) Intracellular Ca2+ imaging by fluo-4-AM calcium probe. The change of fluorescent intensity (ΔF/F0) was plotted against time. (D–F) L cells were treated with vehicle or Yoda1 (5 μM) for 24 hr. (D) Gcg mRNA expression. (E) GLP-1 concentrations in the culture medium. (F) Western blot images and densitometry quantification for the indicated antibodies. (G–J) Knockdown of Piezo1 in L cells by shRNA for 48 hours. (G) Piezo1 mRNA expression. (H) Gcg mRNA expression. (I) GLP-1 levels in the culture medium. (J) Western blot images and densitometry quantification for the indicated antibodies. (K–N) Ileal tissues from Piezo1loxp/loxp and Piezo1 IntL-CKO mice were subjected to tension force (n=6/group). (K) A representative photograph showing the traction of isolated ileum. (L) Gcg mRNA levels. (M) GLP-1 concentrations in the medium. (N) Western blot images and densitometry quantification for the indicated antibodies. Data are represented as mean ± SEM and are representative of six biological replicates. Significance was determined by Student’s t test for comparison between two groups, and by one-way ANOVA for comparison among three groups or more, *p<0.05, **p<0.01, ***p<0.001.
-
Figure 4—source data 1
PDF file containing original western blots for Figure 4F, J and N, indicating the relevant bands and treatments.
- https://cdn.elifesciences.org/articles/97854/elife-97854-fig4-data1-v1.zip
-
Figure 4—source data 2
Original files for western blot analysis displayed in Figure 4F, J and N.
- https://cdn.elifesciences.org/articles/97854/elife-97854-fig4-data2-v1.zip
-
Figure 4—source data 3
Original data for Figure 4.
- https://cdn.elifesciences.org/articles/97854/elife-97854-fig4-data3-v1.zip
Figure 5
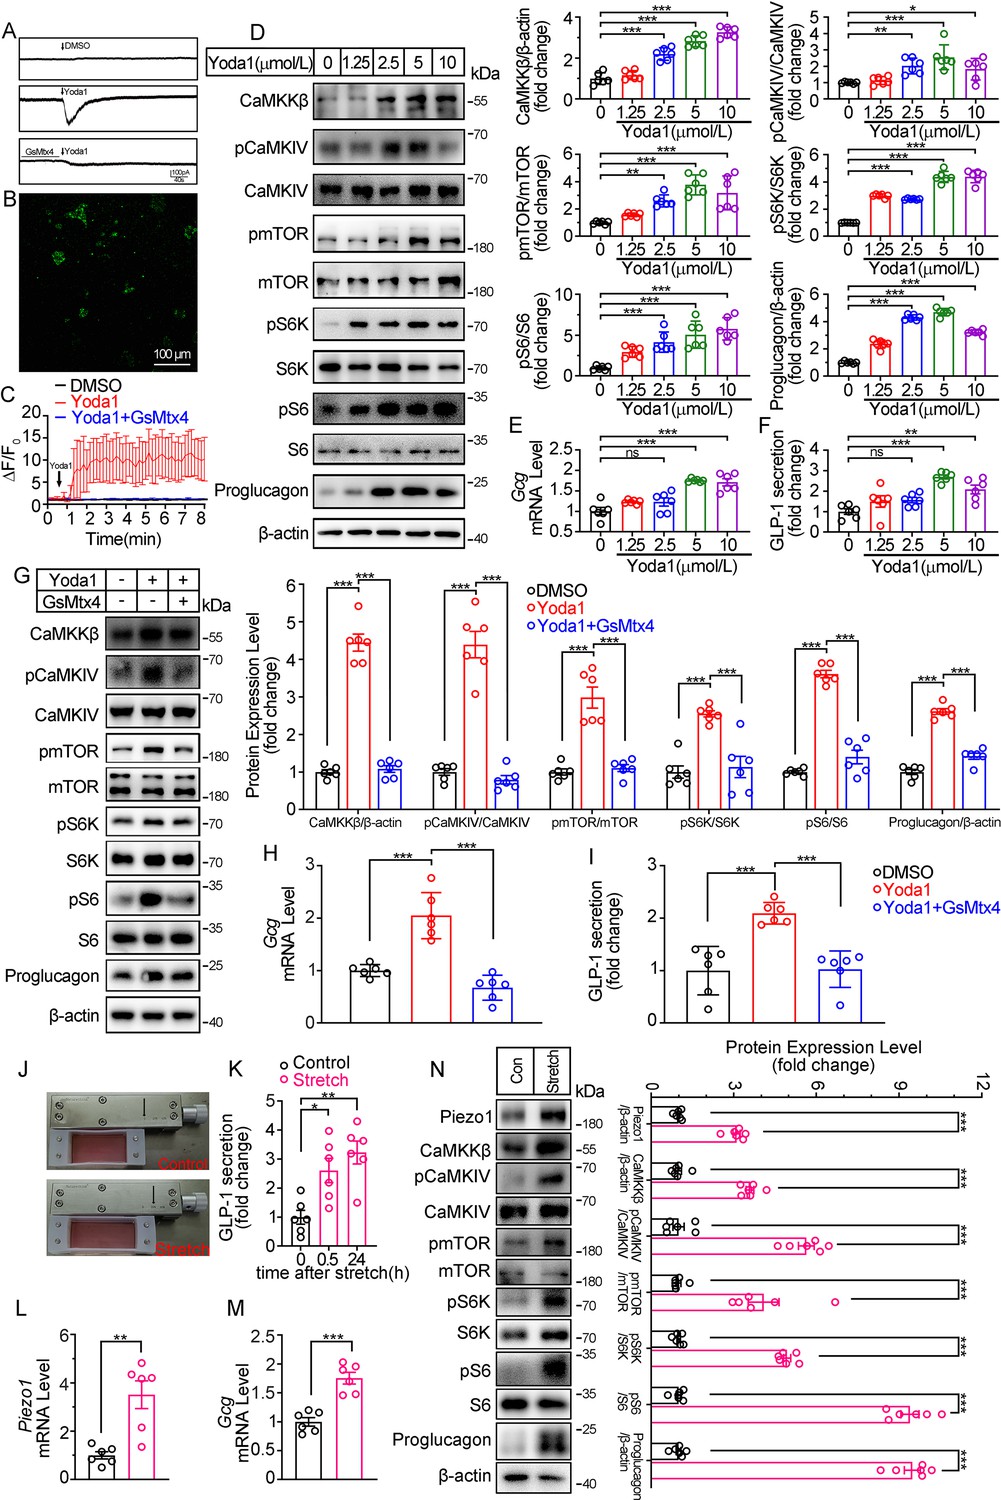
Modulation of GLP-1 synthesis and secretion by pharmacological and mechanical activation of Piezo1 in STC-1 cells.
(A) Whole-cell currents induced by Yoda1 (5 μM) were recorded from STC-1 cells or STC-1 cells pretreated with GsMTx4 for 30 min. (B, C) Intracellular calcium imaging in STC-1 cells. (B) STC-1 cells were loaded with fluo-4 AM for 1 hr. The representative time-lapse image showing the intracellular Ca2+ signals. (C) The change of fluorescent intensity (ΔF/F0) was plotted against time. (D–F) STC-1 cells were treated with various concentrations of Yoda1 for 24 hr. (D) Whole-cell extracts underwent western blot with indicated antibodies. (E) Gcg mRNA levels. (F) GLP-1 concentrations in the culture medium. (G–I) STC-1 cells were treated with Yoda1 (5 μM) in the presence or absence of GsMTx4 (0.1 μM) for 24 hr. (G) Whole-cell extracts underwent western blot with indicated antibodies. (H) Gcg mRNA levels. (I) GLP-1 concentrations in the culture medium. (J–N) STC-1 were subjected to mechanical stretch. (J) STC-1 cells were cultured in elastic chambers and the chambers were subjected to mechanical stretch by 120% extension of their original length. (K) The medium GLP-1 concentrations were detected at indicated time. (L) Piezo1 mRNA levels. (M) Gcg mRNA levels. (N) Whole-cell extracts underwent western blot with indicated antibodies. Data are represented as mean ± SEM and are representative of six biological replicates. Significance was determined by Student’s t test for comparison between two groups, and by one-way ANOVA for comparison among three groups or more, *p<0.05, **p<0.01, ***p<0.001.
-
Figure 5—source data 1
PDF file containing original western blots for Figure 5D, G and N, indicating the relevant bands and treatments.
- https://cdn.elifesciences.org/articles/97854/elife-97854-fig5-data1-v1.zip
-
Figure 5—source data 2
Original files for western blot analysis displayed in Figure 5D, G and N.
- https://cdn.elifesciences.org/articles/97854/elife-97854-fig5-data2-v1.zip
-
Figure 5—source data 3
Original data for Figure 5.
- https://cdn.elifesciences.org/articles/97854/elife-97854-fig5-data3-v1.zip
Figure 6
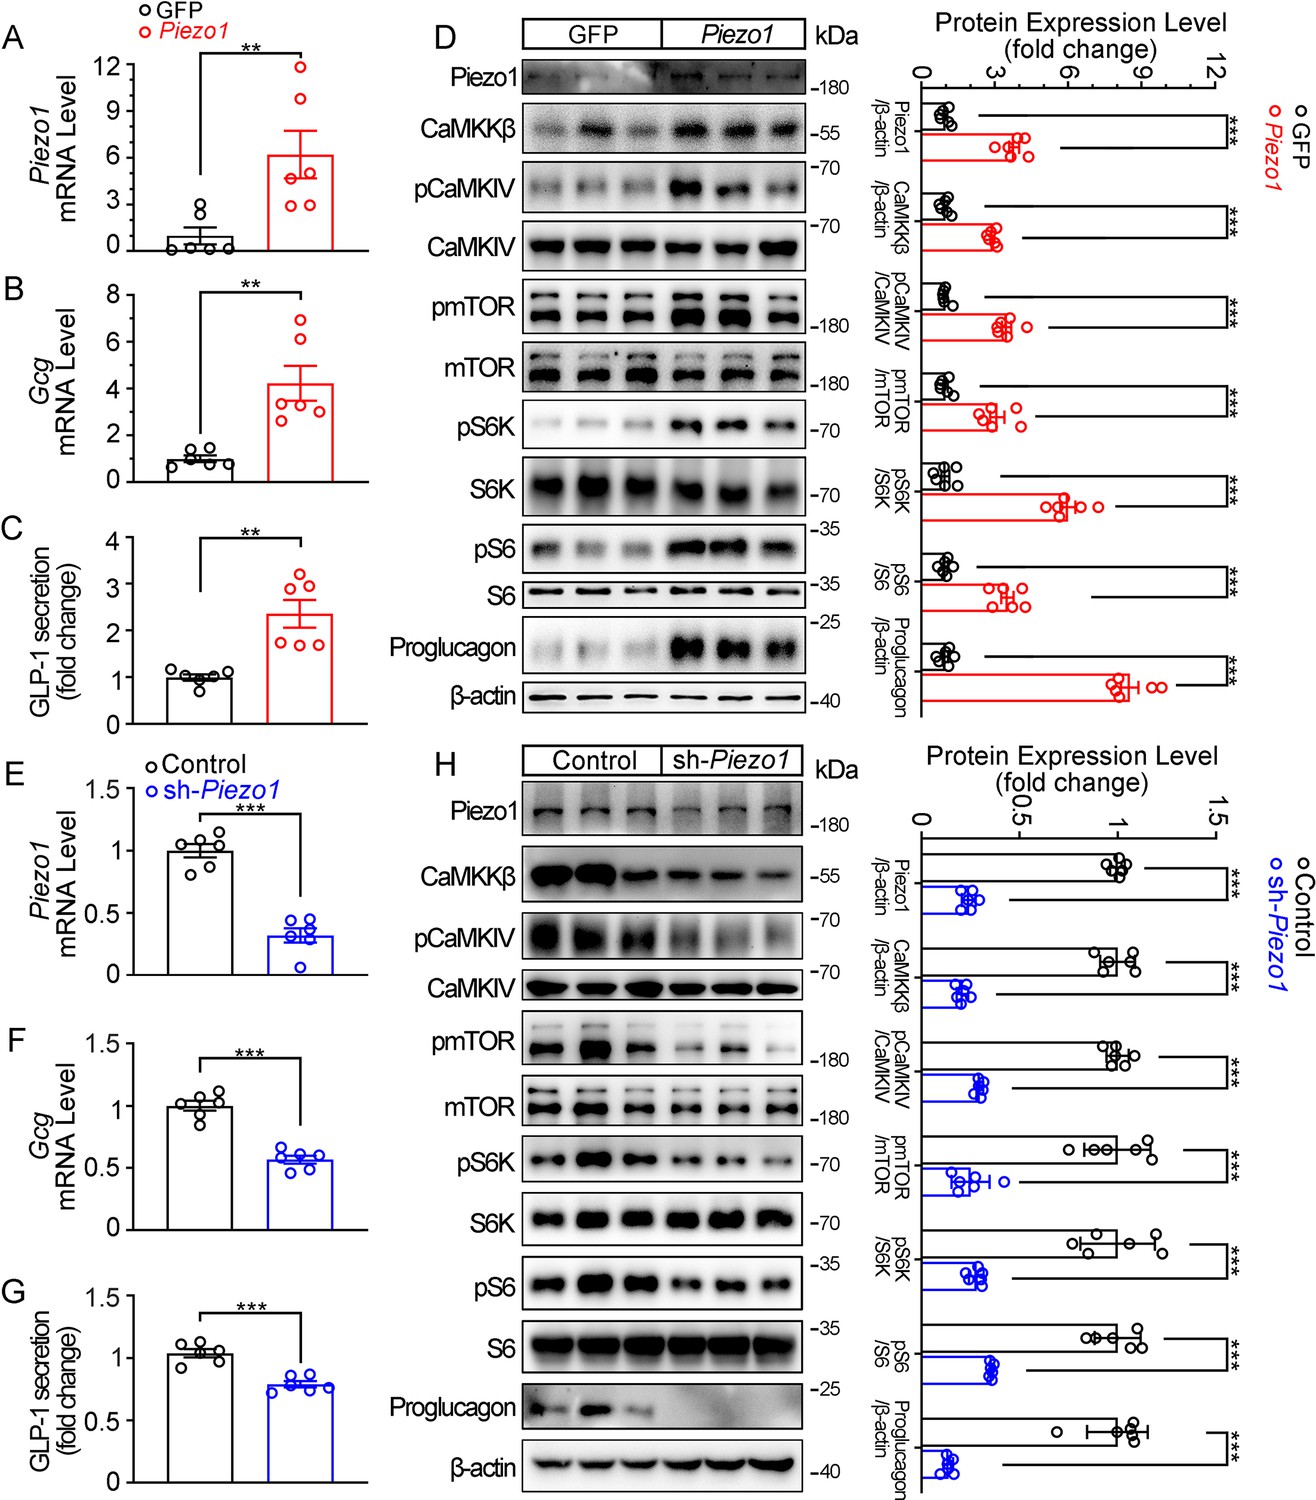
Genetic interference of Piezo1 regulates GLP-1 production in STC-1 cells.
(A–D) STC-1 cells were transfected with mouse control or Piezo1 expression plasmids for 48 hr. Piezo1 (A) and Gcg (B) mRNA levels in STC-1 cells. (C) GLP-1 concentrations in culture medium. (D) Whole-cell extracts underwent western blot with indicated antibodies. (E–H) Stable knockdown of Piezo1 in STC-1 cells. Piezo1 (E) and Gcg (F) mRNA levels in STC-1 cells. (G) GLP-1 concentrations in culture medium. (H) Whole-cell extracts underwent western blot with indicated antibodies. Data are represented as mean ± SEM Data are represented as mean ± SEM and are representative of six biological replicates. Significance was determined by Student’s t test, *p<0.05, **p<0.01, ***p<0.001.
-
Figure 6—source data 1
PDF file containing original western blots for Figure 6D and H, indicating the relevant bands and treatments.
- https://cdn.elifesciences.org/articles/97854/elife-97854-fig6-data1-v1.zip
-
Figure 6—source data 2
Original files for western blot analysis displayed in Figure 6D and H.
- https://cdn.elifesciences.org/articles/97854/elife-97854-fig6-data2-v1.zip
-
Figure 6—source data 3
Original data for Figure 6.
- https://cdn.elifesciences.org/articles/97854/elife-97854-fig6-data3-v1.zip
Figure 7
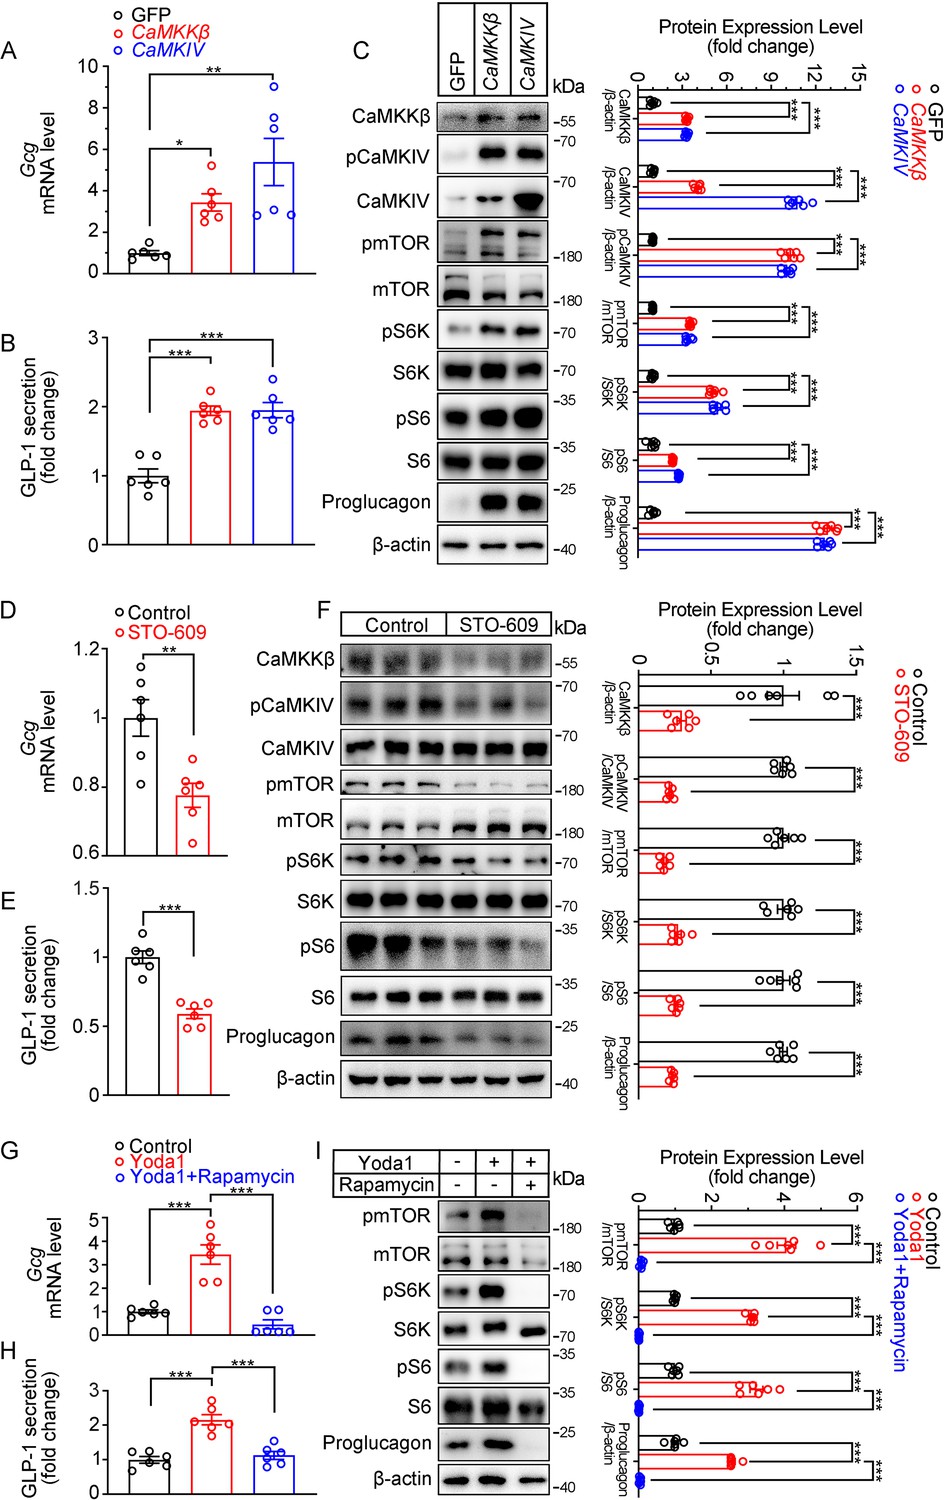
Modulation of GLP-1 production by CaMKKβ/CaMKIV and mTOR signaling activity in STC-1 cells.
(A–C) STC-1 cells were transfected with GFP, CaMKKβ or CaMKIV plasmids for 48 hr. (A) Gcg mRNA levels in STC-1 cells. (B) GLP-1 concentrations in culture medium. (C) Whole-cell extracts underwent western blot with indicated antibodies. (D–F) STC-1 cells were treated with CaMKKβ inhibitor STO-609 (10 μmol/L) for 24 hr. (D) Gcg mRNA levels in STC-1 cells. (E) GLP-1 concentrations in culture medium. (F) Whole-cell extracts underwent western blot with indicated antibodies. (G–I) STC-1 cells were pretreated with Rapamycin (50 nmol/L) for 1 hr, then treated with Yoda1 (5 μmol/L) for 24 hr. (G) Gcg mRNA levels in STC-1 cells. (H) GLP-1 concentrations in the culture medium. (I) Whole-cell extracts underwent western blot with indicated antibodies. Data are represented as mean ± SEM and are representative of six biological replicates. Significance was determined by Student’s t test for comparison between two groups, and by one-way ANOVA for comparison among three groups or more, *p<0.05, **p<0.01, ***p<0.001.
-
Figure 7—source data 1
PDF file containing original western blots for Figure 7C, F and I, indicating the relevant bands and treatments.
- https://cdn.elifesciences.org/articles/97854/elife-97854-fig7-data1-v1.zip
-
Figure 7—source data 2
Original files for western blot analysis displayed in Figure 7C, F and I.
- https://cdn.elifesciences.org/articles/97854/elife-97854-fig7-data2-v1.zip
-
Figure 7—source data 3
Original data for Figure 7.
- https://cdn.elifesciences.org/articles/97854/elife-97854-fig7-data3-v1.zip
Author response image 1
Tables
Key resources table
| Reagent type (species) or resource | Designation | Source or reference | Identifiers | Additional information |
|---|---|---|---|---|
| Strain, strain background (Mus musculus, C57BL/6 J) | Vil1FLP, GcgCre | Shanghai Model Organisms Center | N/A | |
| Strain, strain background (M. musculus, C57BL/6 J) | Vil1FLP::GcgfrtCre | This paper | N/A | Please refer to the "Genetic mouse generation" section. |
| Strain, strain background (M. musculus, C57BL/6 J) | Rosa26mTmG | Jackson Laboratory | Stock No. 007676 | |
| Strain, strain background (M. musculus, C57BL/6 J) | B6.Cg-Piezo1tm2.1Apat/J | Jackson laboratory | RRID:IMSR_JAX:029213 | |
| Cell line (M. musculus, mouse) | STC-1 | ATCC | CRL-3254 | |
| Biological sample (Mouse) | Primary mouse ileal L cells, Ileum, Pancreas, Liver, Skeletal muscle, Epididymal adipose, Hypothalamus | This paper | N/A | Freshly isolated from Mice. |
| Transfected construct (M. musculus) | pLKO.1-shPiezo1 | This paper | N/A | Lentiviral construct to transfect and express the shRNA. |
| Antibody | Anti-Piezo1 (Rabbit polyclonal) | Affinity Biosciences | Cat# DF12083, RRID:AB_2844888 | WB: 1:1000 IF: 1:400 |
| Antibody | Anti-CaMKKβ (mouse monoclonal) | Santa Cruz Biotechnology | Cat# sc-271674, RRID:AB_10708844 | WB: 1:1000 |
| Antibody | Anti-Phospho- CaMKIV (Thr200) (Rabbit polyclonal) | Affinity Biosciences | Cat# AF3460, RRID:AB_2834898 | WB: 1:1000 |
| Antibody | Anti-CaMKIV (Rabbit polyclonal) | Cell Signaling Technology | Cat# 4032, RRID:AB_2068389 | WB: 1:1000 |
| Antibody | Anti-Phospho- mTOR (Ser2448) (Rabbit Monoclonal) | Cell Signaling Technology | Cat# 5536, RRID:AB_10691552 | WB: 1:1000 |
| Antibody | Anti-mTOR (Rabbit monoclonal) | Cell Signaling Technology | Cat# 2983, RRID:AB_2105622 | WB: 1:1000 |
| Antibody | Anti-phospho-p70 S6 Kinase (Thr389) (Rabbit monoclonal) | Cell Signaling Technology | Cat# 9234, RRID:AB_2269803 | WB: 1:1000 |
| Antibody | Anti-p70 S6 Kinase (Rabbit Monoclonal) | Cell Signaling Technology | Cat# 2903, RRID:AB_1196657 | WB: 1:1000 |
| Antibody | Anti-phospho-S6 Ribosomal Protein (Ser235/236) (Rabbit Monoclonal) | Cell Signaling Technology | Cat# 4858, RRID:AB_916156 | WB: 1:1000 |
| Antibody | Anti-S6 Ribosomal Protein (Rabbit monoclonal) | Cell Signaling Technology | Cat# 2217, RRID:AB_331355 | WB: 1:1000 |
| Antibody | Anti-GLP-1 (Mouse monoclonal) | Abcam | Cat# ab23468, RRID:AB_470325 | WB: 1:1000 IF: 1:500 |
| Antibody | Anti-β-actin (Mouse monoclonal) | Cell Signaling Technology | Cat# 3700, RRID:AB_2242334 | WB: 1:1000 |
| Antibody | Horseradish peroxidase‐conjugated, Goat Anti-Rabbit IgG | Jackson ImmunoResearch Labs | Cat# 111-035-003, RRID:AB_2313567 | 1:10,000 |
| Antibody | Horseradish peroxidase‐conjugated, Goat Anti-Mouse IgG | Jackson ImmunoResearch Labs | Cat# 115-035-003, RRID:AB_10015289 | 1:10,000 |
| Antibody | Goat anti-mouse fluorescein isothiocyanate-conjugated IgG | EarthOx LLC | Cat# E031210-01 | 1:100 |
| Antibody | Dylight 594 affinipure donkey anti-rabbit IgG | EarthOx LLC | Cat# E032421-01 | 1:100 |
| Recombinant DNA reagent | pcDNA3.1-mPiezo1-IRES-GFP | Addgene | Cat# 80925 | |
| Recombinant DNA reagent | pcDNA3.1-IRES-GFP | Addgene | Cat# 51406 | |
| Recombinant DNA reagent | CaMKKβ (Plasmid) | This paper | N/A | Gifted by Professor Koji Murao from Kagawa University |
| Recombinant DNA reagent | CaMKIV (Plasmid) | This paper | N/A | Gifted by Professor Koji Murao from Kagawa University |
| Sequence-based reagent | P1 | This paper | PCR primers | GACCTTTGCCCTCTGGTCTC |
| Sequence-based reagent | P2 | This paper | PCR primers | GAGTGACGGTGCCAGAGAAA |
| Sequence-based reagent | P3 | This paper | PCR primers | GACTCCAGCTGCCTTCTCTG |
| Sequence-based reagent | P4 | This paper | PCR primers | CGGTGATCTCCCAGATGCTC |
| Sequence-based reagent | P5 | This paper | PCR primers | CCCTAACTCAGTCTCCAGCA |
| Sequence-based reagent | P6 | This paper | PCR primers | CGGTTACCAGGTGGTCATGT |
| Sequence-based reagent | P7 | This paper | PCR primers | CCCTAACTCAGTCTCCAGCA |
| Sequence-based reagent | P8 | This paper | PCR primers | CTGCAAAGGGTCGCTACAGA |
| Sequence-based reagent | P9 | This paper | PCR primers | AATGGCTCTCCTCAAGCGTAT |
| Sequence-based reagent | P10 | This paper | PCR primers | ACAGGAGGTAGTCCCTCACAT |
| Sequence-based reagent | P11 | This paper | PCR primers | TGTCGGGGAAATCATCGTCC |
| Sequence-based reagent | Piezo1_F (Human) | This paper | PCR primers | ATCGCCATCATCTGGTTCCC |
| Sequence-based reagent | Piezo1_R (Human) | This paper | PCR primers | TGGTGAACAGCGGCTCATAG |
| Sequence-based reagent | GCG_F (Human) | This paper | PCR primers | GCACATTCACCAGTGACTACAGCA |
| Sequence-based reagent | GCG_R (Human) | This paper | PCR primers | TGGCAGCTTGGCCTTCCAAATA |
| Sequence-based reagent | β-actin_F (Human) | This paper | PCR primers | TCATGAAGATCCTCACCGAG |
| Sequence-based reagent | β-actin_R (Human) | This paper | PCR primers | CATCTCTTGCTCGAAGTCCA |
| Sequence-based reagent | Piezo1_F (Mouse) | This paper | PCR primers | GCAGTGGCAGTGAGGAGATT |
| Sequence-based reagent | Piezo1_R (Mouse) | This paper | PCR primers | GATATGCAGGCGCCTATCCA |
| Sequence-based reagent | Gcg_F (Mouse) | This paper | PCR primers | ATTGCCAAACGTCATGATGA |
| Sequence-based reagent | Gcg_R (Mouse) | This paper | PCR primers | GGCGACTTCTTCTGGGAAGT |
| Sequence-based reagent | CCK_F (Mouse) | This paper | PCR primers | TAGCGCGATACATCCAGCAGGT |
| Sequence-based reagent | CCK_R (Mouse) | This paper | PCR primers | GGTATTCGTAGTCCTCGGCACT |
| Sequence-based reagent | Actb_F (Mouse) | This paper | PCR primers | CCACAGCTGAGAGGGAAATC |
| Sequence-based reagent | Actb_R (Mouse) | This paper | PCR primers | AAGGAAGGCTGGAAAAGAGC |
| Commercial assay or kit | Mouse Glucagon-Like Peptide 1 (GLP-1) ELISA Kit | Millipore | Cat# EGLP-35K | Mouse Glucagon-Like Peptide 1 (GLP-1) ELISA Kit |
| Commercial assay or kit | RT-PCR kit | Takara | Cat# RR014A | RT-PCR kit |
| Chemical compound, drug | 0.1% gelatine | Biological Industries | Cat# 01-944-1B | |
| Chemical compound, drug | DMEM high sugar medium | Gibco | Cat# 11965092 | |
| Chemical compound, drug | Fetal bovine serum | Gibco | Cat# 12484028 | |
| Chemical compound, drug | Equine serum | Gibco | Cat# 16050122 | |
| Chemical compound, drug | Immobilon western chemiluminescent HRP substrate | Millipore | Cat# WBKLS0500 | |
| Chemical compound, drug | Diprotin A | Sigma-Aldrich | Cat# 90614-48-5 | |
| Chemical compound, drug | Thermo Scientific TurboFect Transfection Reagent | Thermo Fisher Scientific | Cat# R0531 | |
| Chemical compound, drug | TRIzol | Thermo Fisher Scientific | Cat# 15596026 | |
| Chemical compound, drug | RIPA Lysis Buffer | Beyotime Biotechnology | Cat# P0013B | |
| Chemical compound, drug | GsMTx4 | Alomone Labs | Cat# STG-100 | |
| Chemical compound, drug | Rapamycin | Santa Cruz Biotechnology | Cat# sc-3504B | |
| Chemical compound, drug | STO-609 | Selleck | Cat# S8274 | |
| Chemical compound, drug | Yoda1 | Sigma-Aldrich | Cat# SML1558 | |
| Chemical compound, drug | Dimethyl sulfoxide | Sigma-Aldrich | Cat# D2650 | |
| Chemical compound, drug | Exendin-4 | Sigma-Aldrich | Cat# E7144 | |
| Chemical compound, drug | Fluo-4 AM | Thermo Fisher Scientific | Cat# F14201 | |
| Software, algorithm | GraphPad Prism | GraphPad Software, https://www.graphpad.com/ | RRID:SCR_002798 | |
| Software, algorithm | ImageJ | ImageJ, https://imagej.nih.gov/ij/ | RRID:SCR_003070 | |
| Software, algorithm | Adobe photoshop | Adobe, https://www.adobe.com/creativecloud/desktop-app.html | RRID:SCR_014199 | |
| Other | Normal chow diet | Research Diets | Cat# D12450B | Feed for feeding mice. |
| Other | High fat diet | Research Diets | Cat# D12492 | Feed for feeding mice. |
Additional files
Download links
A two-part list of links to download the article, or parts of the article, in various formats.
Downloads (link to download the article as PDF)
Open citations (links to open the citations from this article in various online reference manager services)
Cite this article (links to download the citations from this article in formats compatible with various reference manager tools)
Mechano-regulation of GLP-1 production by Piezo1 in intestinal L cells
eLife 13:RP97854.
https://doi.org/10.7554/eLife.97854.3


