Mapping serotonergic dynamics using drug-modulated molecular connectivity in rats
- Werner Siemens Imaging Center, Department of Preclinical Imaging and Radiopharmacy, Eberhard Karls University Tuebingen, Germany
- Department of Biomedical Engineering, New Jersey Institute of Technology, United States
Figures
Figure 1 with 1 supplement
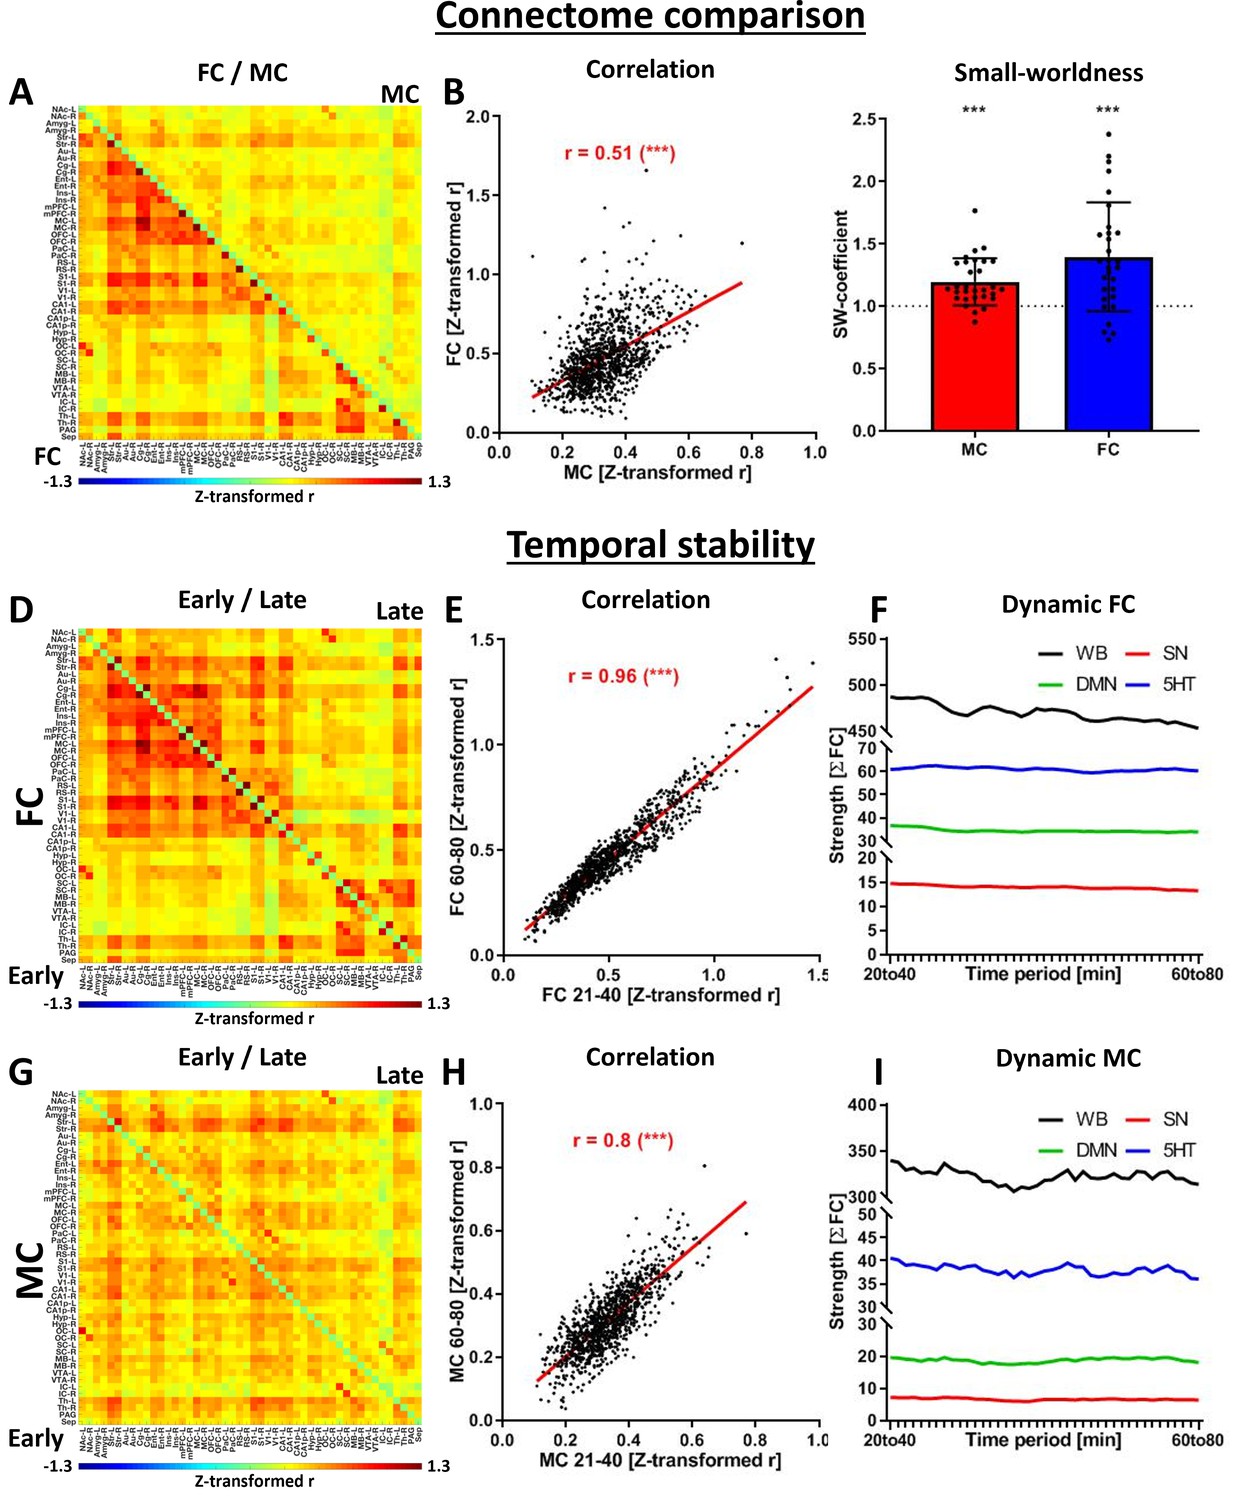
Evaluation of the seed-based molecular connectivity (MC).
(A) Correlation matrix indicating whole-brain functional connectivity (FC) (beneath the diagonal) and MC (above the diagonal). Correlations not significant with multiple comparison corrections were set to zero (p<0.05, FWE correction). (B) Scatter plot and correlation between MC and FC edges. (C) Small-world coefficients for all subjects and group-level one-sample t-test against the value of 1 (SW >1 indicates small-world properties, data provided as mean ± SD, one-sample t-test to 1, *** p < 0.001). Comparison of (D) FC and (G) MC early (20–40 min after the start of the scan, below the diagonal) and late (60–80 min after the start of the scan, above the diagonal). The similarities of early and late readouts were quantified for both (E) FC and (H) MC. The temporal stability of both (F) FC and (I) MC was evaluated using a sliding window approach, including 20 min windows between 20 and 80 min after the start of the scan. Abbreviations: FC = fMRI-derived hemodynamic functional connectivity, MC = [11C]DASB PET-derived molecular connectivity.
Figure 1—figure supplement 1
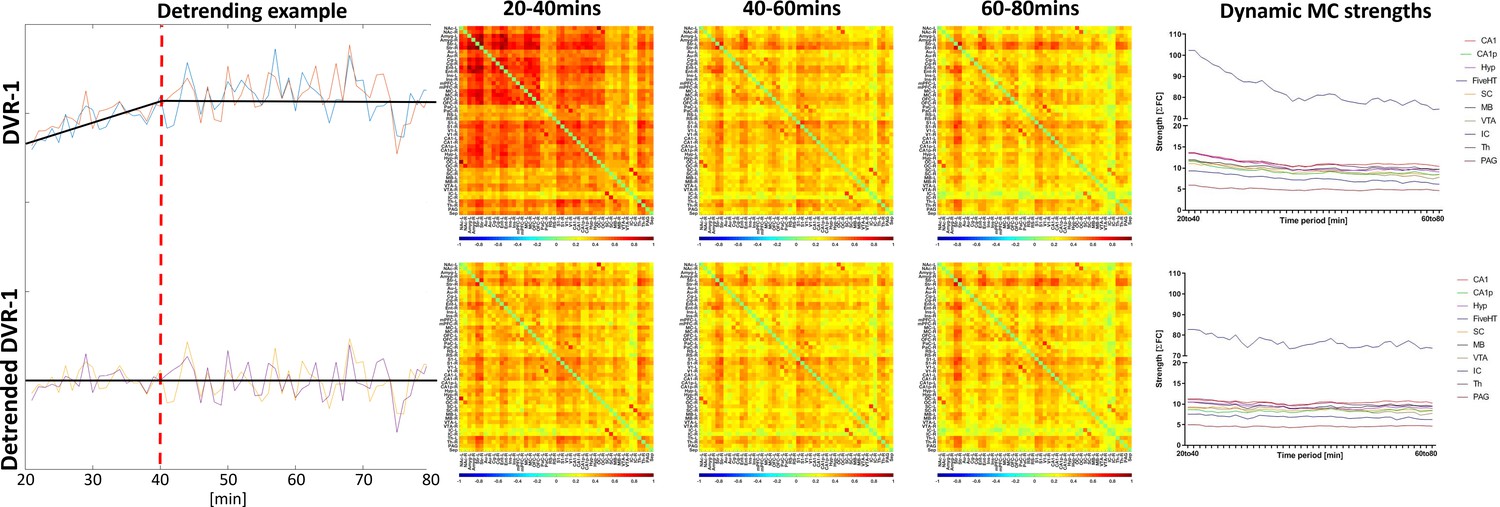
Detrending procedure of DVR-1 time courses.
Left panel: exemplary dynamic DVR-1 time courses between minute 20 and 80 after scan start. An increasing trend can be observed until minute 40 for the raw DVR-1 time courses. After detrending the segments 20–40 and 40–80 separately, a linear time series can be obtained. Middle panel: group-level molecular connectivity (MC) correlation matrices before and after detrending of the DVR-1 time series. Without detrending, MC values between minutes 20 and 40 are strongly inflated, this aspect being solved by the applied detrending procedure. Right panel: without detrending, the MC strengths only reach temporally constant values towards the end of the scans, therefore, not allowing the detection of a potential intervention prior to that timepoint. When applying detrending, the strengths remain already from the time period 20–40 min onward.
Figure 2
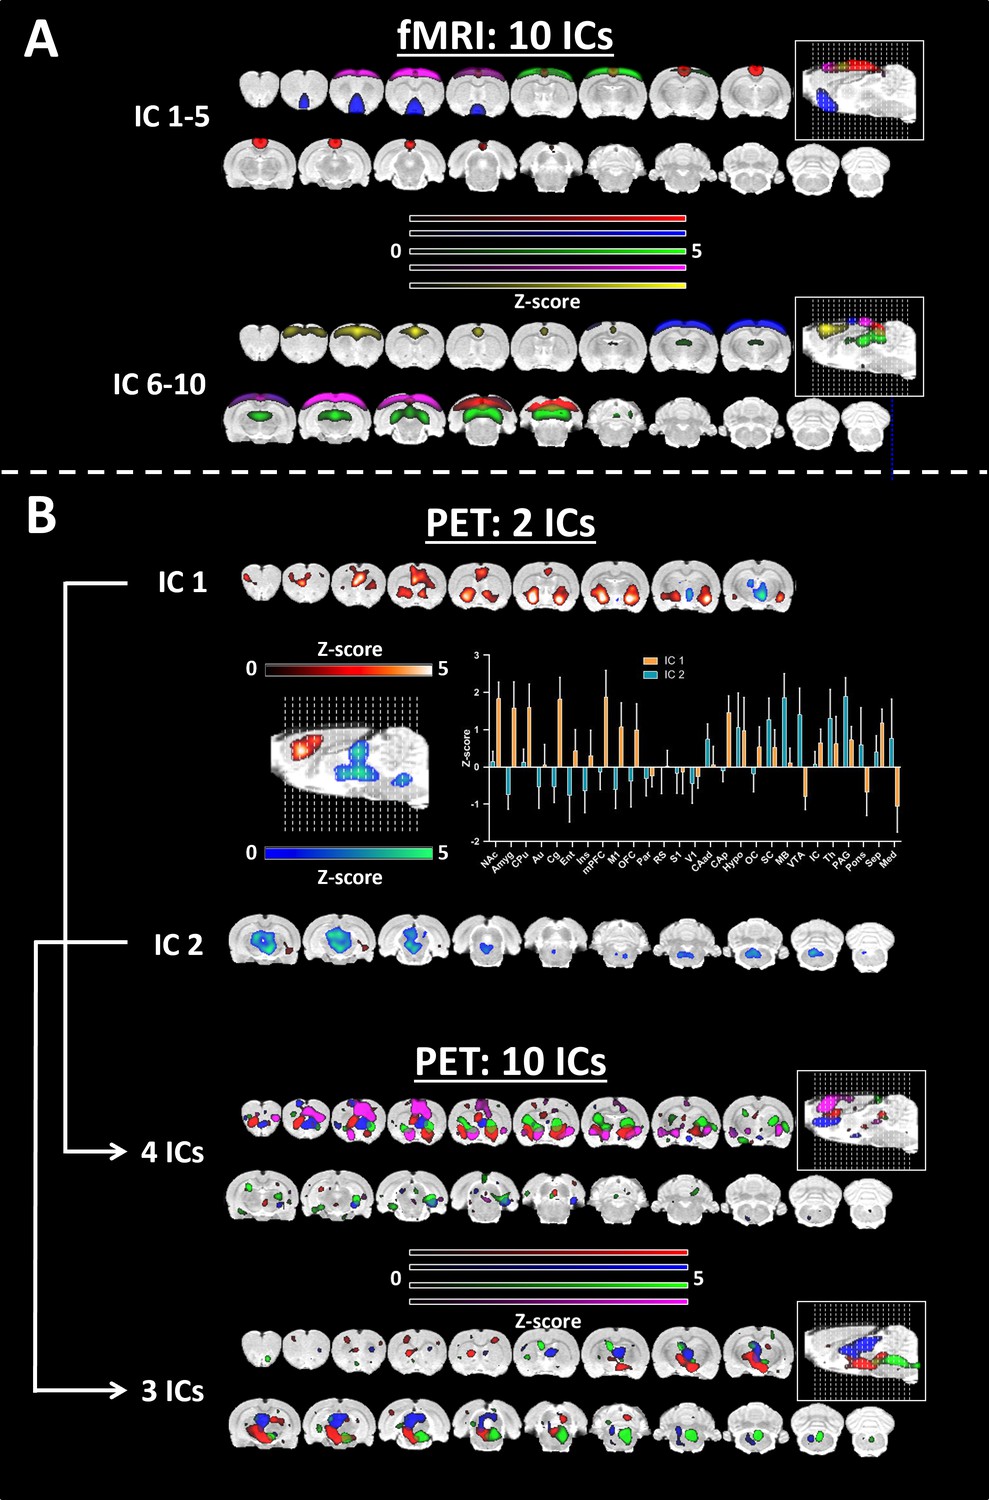
Group independent component analysis for functional connectivity (FC) and molecular connectivity (MC).
(A) Independent component analysis (ICA) was performed over 10 components for functional magnetic resonance imaging (fMRI). (B) ICA performed over two components for [11C]DASB PET and regional quantification of the two derived components (mean ± SD over voxels). The ICA was repeated over 10 components. Four and three components showed good overlap with the two components defined above. All the components were thresholded at z>1.96 (p≤0.05). Abbreviations: FC = fMRI-derived hemodynamic functional connectivity, MC = [11C]DASB PET-derived molecular connectivity.
Figure 3

Comparison of methylenedioxymethamphetamine (MDMA)-induced [11C]DASB alterations.
(A) Left panel: Dynamic binding potentials of regions comprising the SERT subcortical network, defined by IC 1 in the validation cohort. Right panel: Dynamic binding potentials of regions comprising the SERT salience network, defined by IC 2 in the validation cohort (continuous lines indicate the means, and dotted lines indicate standard deviations). (B) Overlap between independent components extracted from the validation cohort (IC 1=SERT subcortical network, IC 2=SERT salience network) and the early and late effects of MDMA. (C) Pairwise correlations between regional z scores of the ICs extracted from the validation cohort and regional t scores of early and late MDMA effects. (*** indicates p<0.001, ns = not significant). Abbreviations: SERT = serotonin transporter, ICA = independent component analysis; for abbreviations of regions, please refer to the Supplementary information.
Figure 4
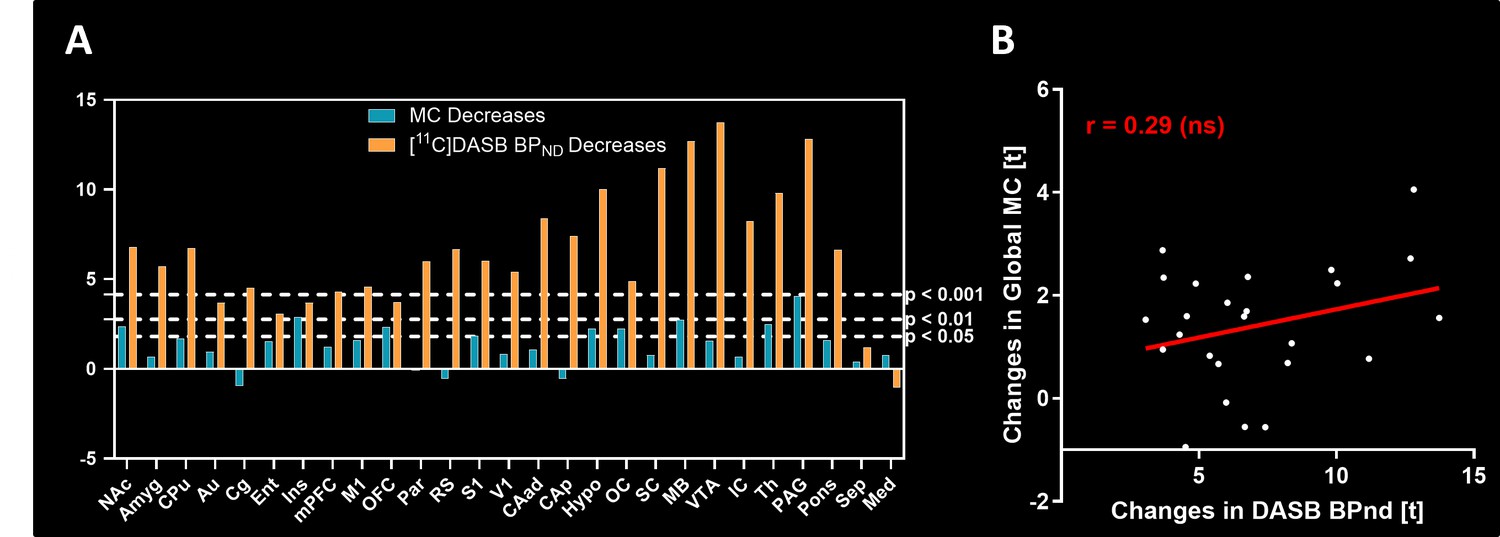
Comparison of molecular connectivity (MC) and BPND changes following methylenedioxymethamphetamine (MDMA).
(A) Reductions in BPND following MDMA (orange) and MC strength (blue) were compared. (B) The correlation coefficient of the regional T scores was low (r=0.29).
Figure 5
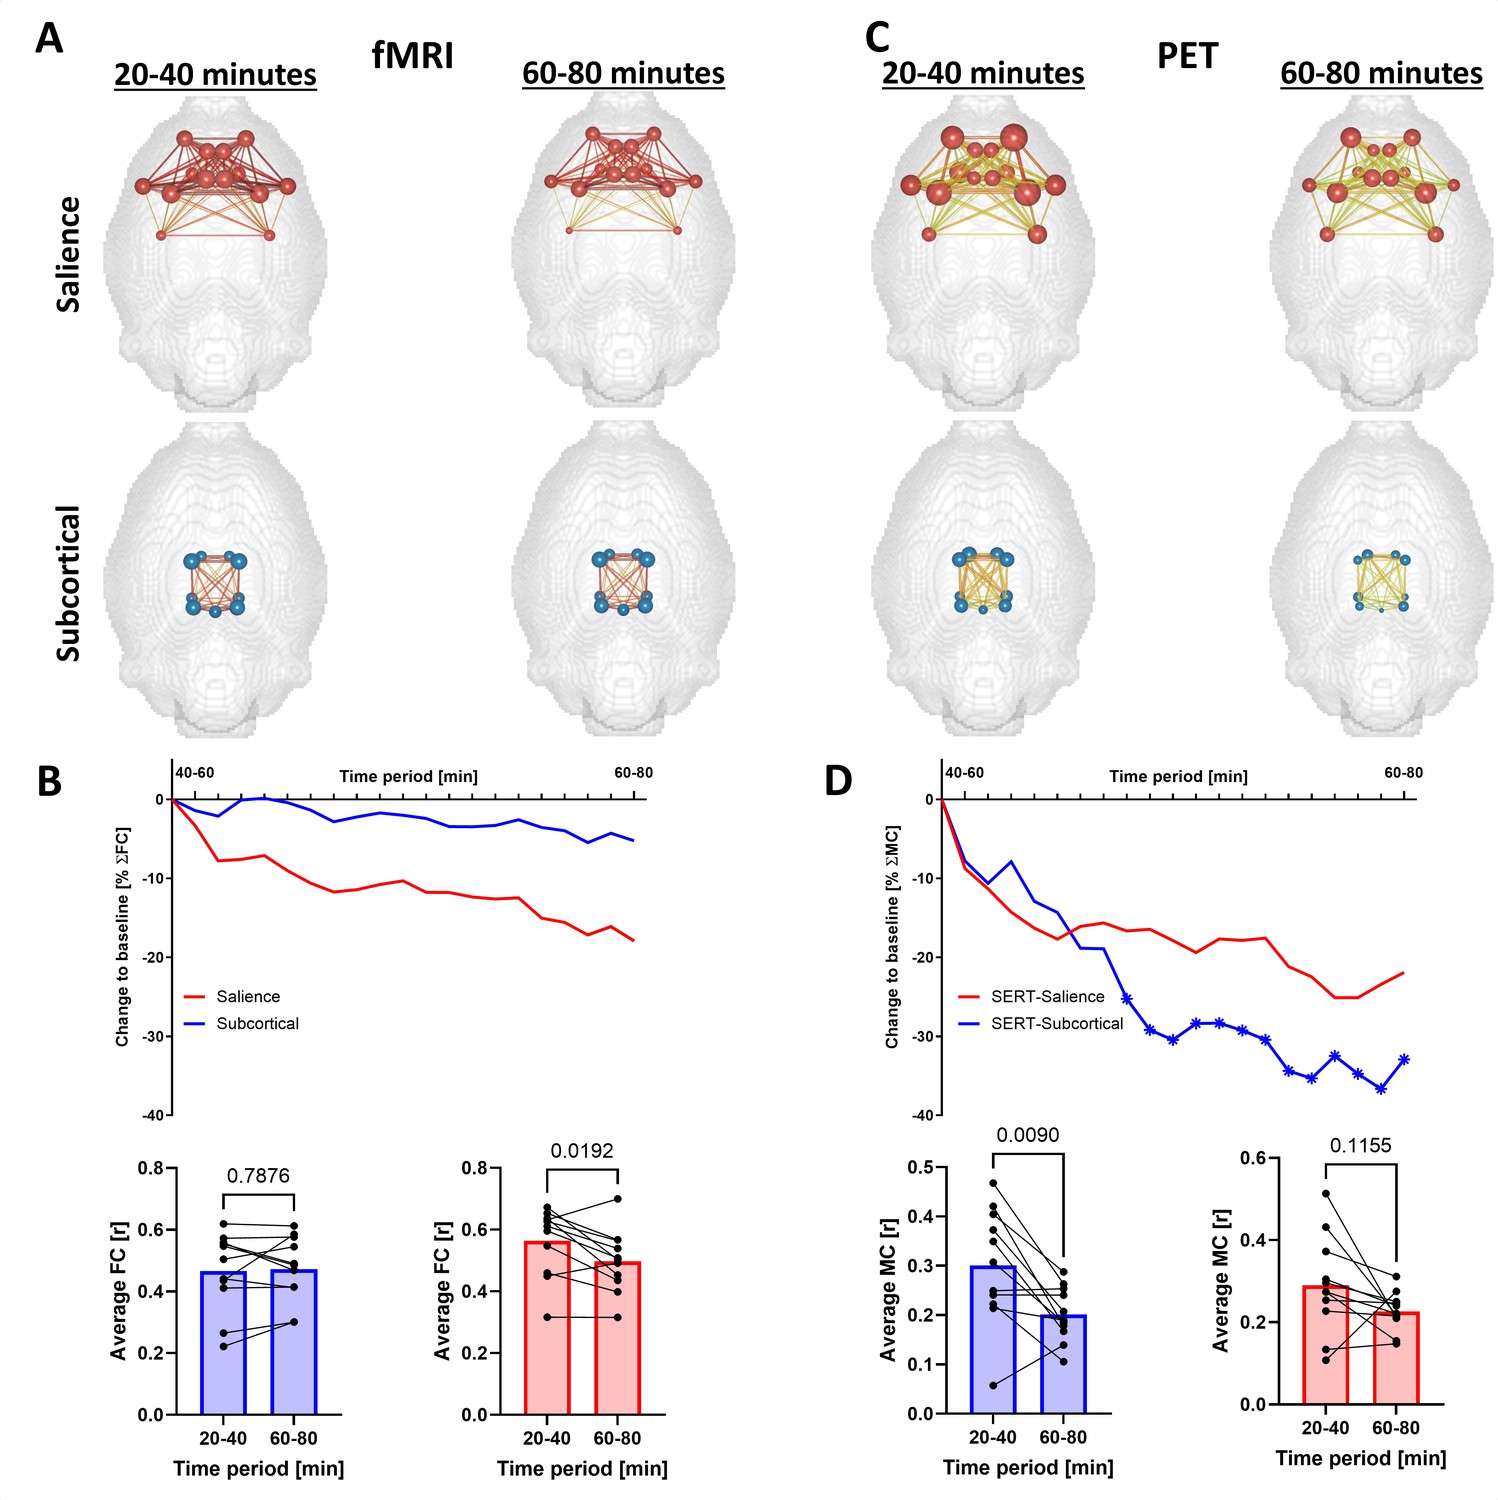
Methylenedioxymethamphetamine (MDMA) effects on seed-based functional connectivity (FC) and molecular connectivity (MC) of the salience and subcortical networks.
(A) FC and (C) MC brain networks depicting the edge and node strengths of the salience network and subcortical network at baseline (20–40 min after the start of the scan) and after MDMA (60-80 min after the start of the scan). (B) FC and (D) MC time-resolved salience and subcortical network strengths computed by sliding windows. Individual values are provided in the bar graphs for the baseline and final post-MDMA periods (paired t-tests, numbers indicate p-values). Asterisks indicate significant (p<0.05, FDR-corrected) changes from baseline (time point zero, corresponding to 20–40 min after the start of the scan).
Tables
Table 1
Brain regions included in the Schiffer rat brain atlas, including their respective volumes and abbreviations.
| Brain region (ROI) | Hemisphere | ROI volume [mm3] | Position on the correlation matrix | Abbreviation |
|---|---|---|---|---|
| Nucleus Accumbens | left | 7.944 | 1 | NAc |
| right | 2 | |||
| Amygdala | left | 21.120 | 3 | Amyg |
| right | 4 | |||
| Dorsal Striatum | left | 43.552 | 5 | Str |
| right | 6 | |||
| Auditory Cortex | left | 27.520 | 7 | Au |
| right | 8 | |||
| Cingulate Cortex | left | 14.480 | 9 | Cg |
| right | 10 | |||
| Entorhinal Cortex | left | 59.016 | 11 | Ent |
| right | 12 | |||
| Insular Cortex | left | 21.128 | 13 | Ins |
| right | 14 | |||
| Medial Prefrontal Cortex | left | 6.304 | 15 | mPFC |
| right | 16 | |||
| Motor Cortex | left | 32.608 | 17 | M1 |
| right | 18 | |||
| Orbitofrontal Cortex | left | 18.936 | 19 | OFC |
| right | 20 | |||
| Parietal Cortex | left | 7.632 | 21 | PaC |
| right | 22 | |||
| Retrosplenial Cortex | left | 18.920 | 23 | RS |
| right | 24 | |||
| Somatosensory Cortex | left | 71.600 | 25 | S1 |
| right | 26 | |||
| Visual Cortex | left | 36.136 | 27 | V1 |
| right | 28 | |||
| Anterodorsal Hippocampus | left | 25.064 | 29 | CA1 |
| right | 30 | |||
| Posterior Hippocampus | left | 9.784 | 31 | CA1-p |
| right | 32 | |||
| Hypothalamus | left | 18.352 | 33 | Hyp |
| right | 34 | |||
| Olfactory Cortex | left | 14.008 | 35 | OC |
| right | 36 | |||
| Superior Colliculus | left | 7.136 | 37 | SC |
| right | 38 | |||
| Midbrain | left | 11.448 | 39 | MB |
| right | 40 | |||
| Ventral Tegmental Area | left | 5.528 | 41 | VTA |
| right | 42 | |||
| Inferior Colliculus | left | 5.744 | 43 | IC |
| right | 44 | |||
| Thalamus | left | 30.712 | 45 | Th |
| right | 47 | |||
| Periaqueductal Gray | - | 9.904 | 47 | PAG |
| Septum | - | 9.36 | 48 | Sep |
Additional files
Download links
A two-part list of links to download the article, or parts of the article, in various formats.
Downloads (link to download the article as PDF)
Open citations (links to open the citations from this article in various online reference manager services)
Cite this article (links to download the citations from this article in formats compatible with various reference manager tools)
Mapping serotonergic dynamics using drug-modulated molecular connectivity in rats
eLife 13:RP97864.
https://doi.org/10.7554/eLife.97864.3


