Adaptive chunking improves effective working memory capacity in a prefrontal cortex and basal ganglia circuit
- Brown University, United States
Figures
Figure 1
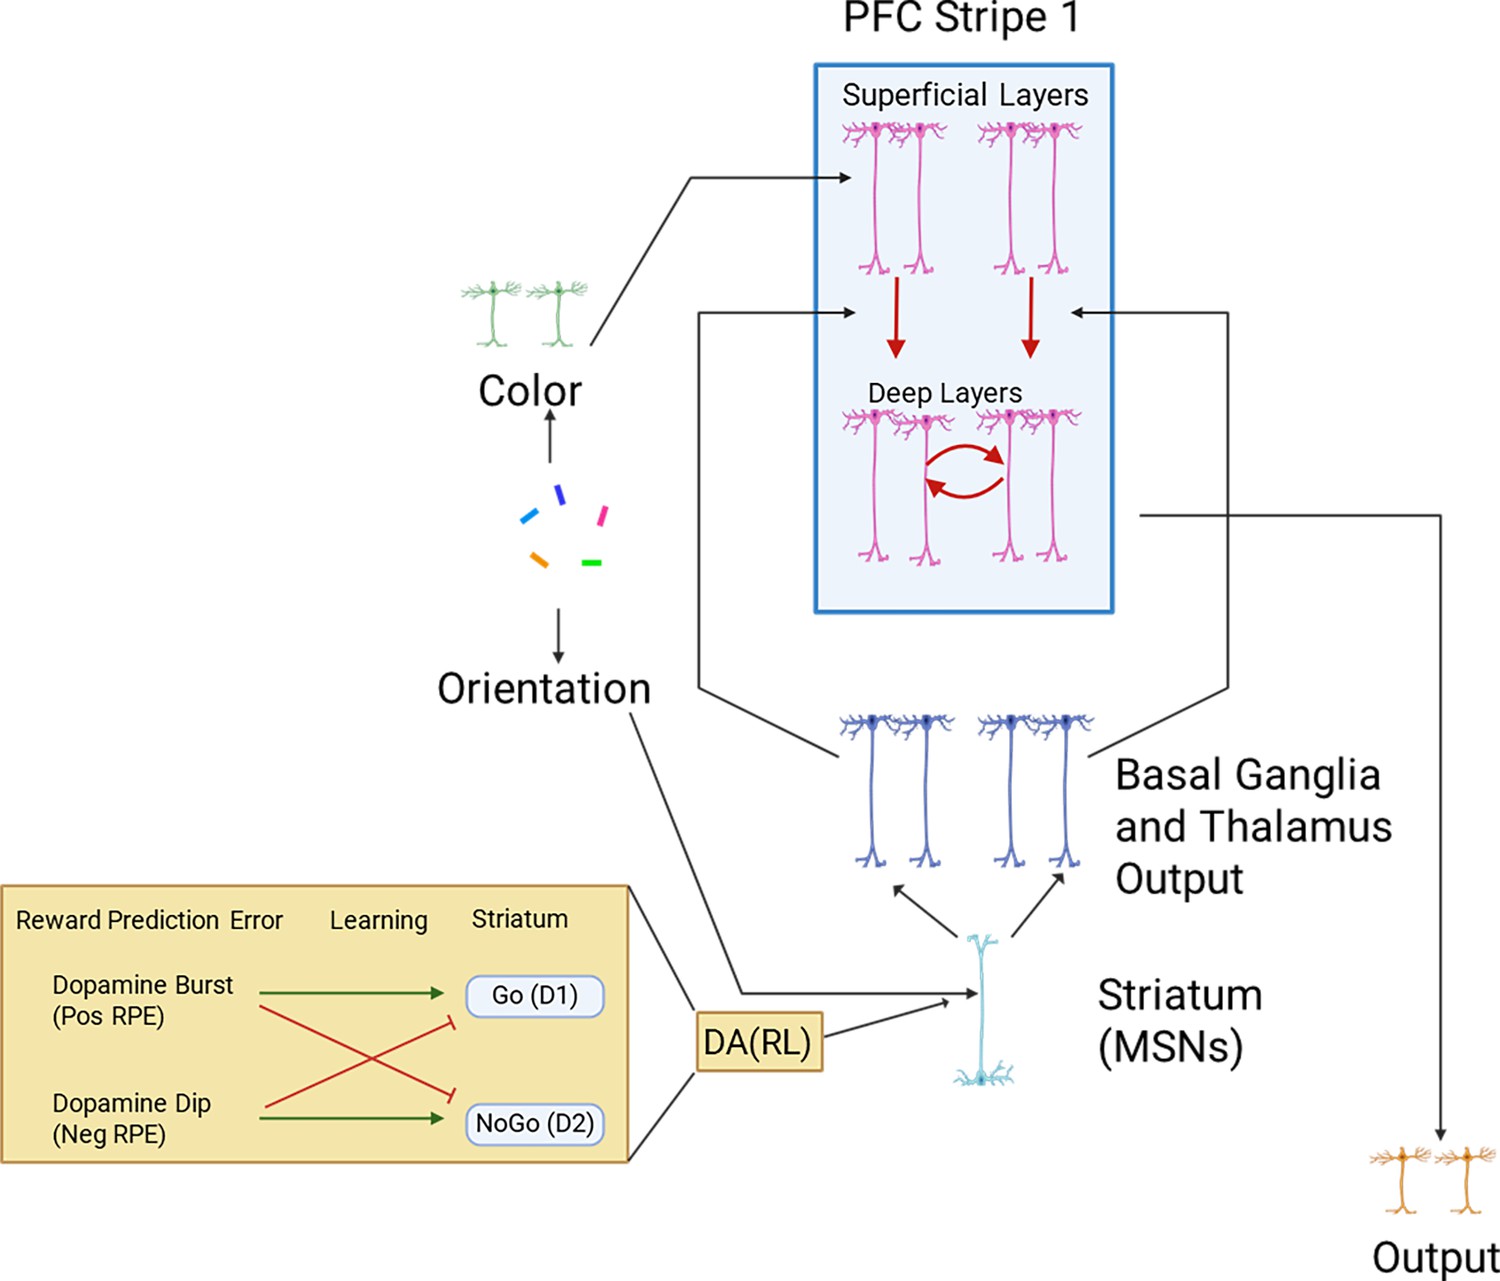
Base model sensory inputs (reflecting visual cortical representations) project to PFC superficial layers, which transiently represent those inputs.
Activity is maintained in prefrontal cortex (PFC) after stimulus offset (and into subsequent trials) only when gated. Red arrows indicate gating, supporting transfer of information from superficial layers to deep layers, triggered by striatal disinhibition of dorsomedial thalamocortical activity. Maintenance is represented by recursive red arrows in deep layer. Green insert shows how striatum D1 and D2 neural populations (which have opposite effects on gating) are modulated by dopaminergic reward prediction errors (RPEs). Over the course of learning, synaptic weights evolve to support effective gating strategies that increase rewards.
Figure 2
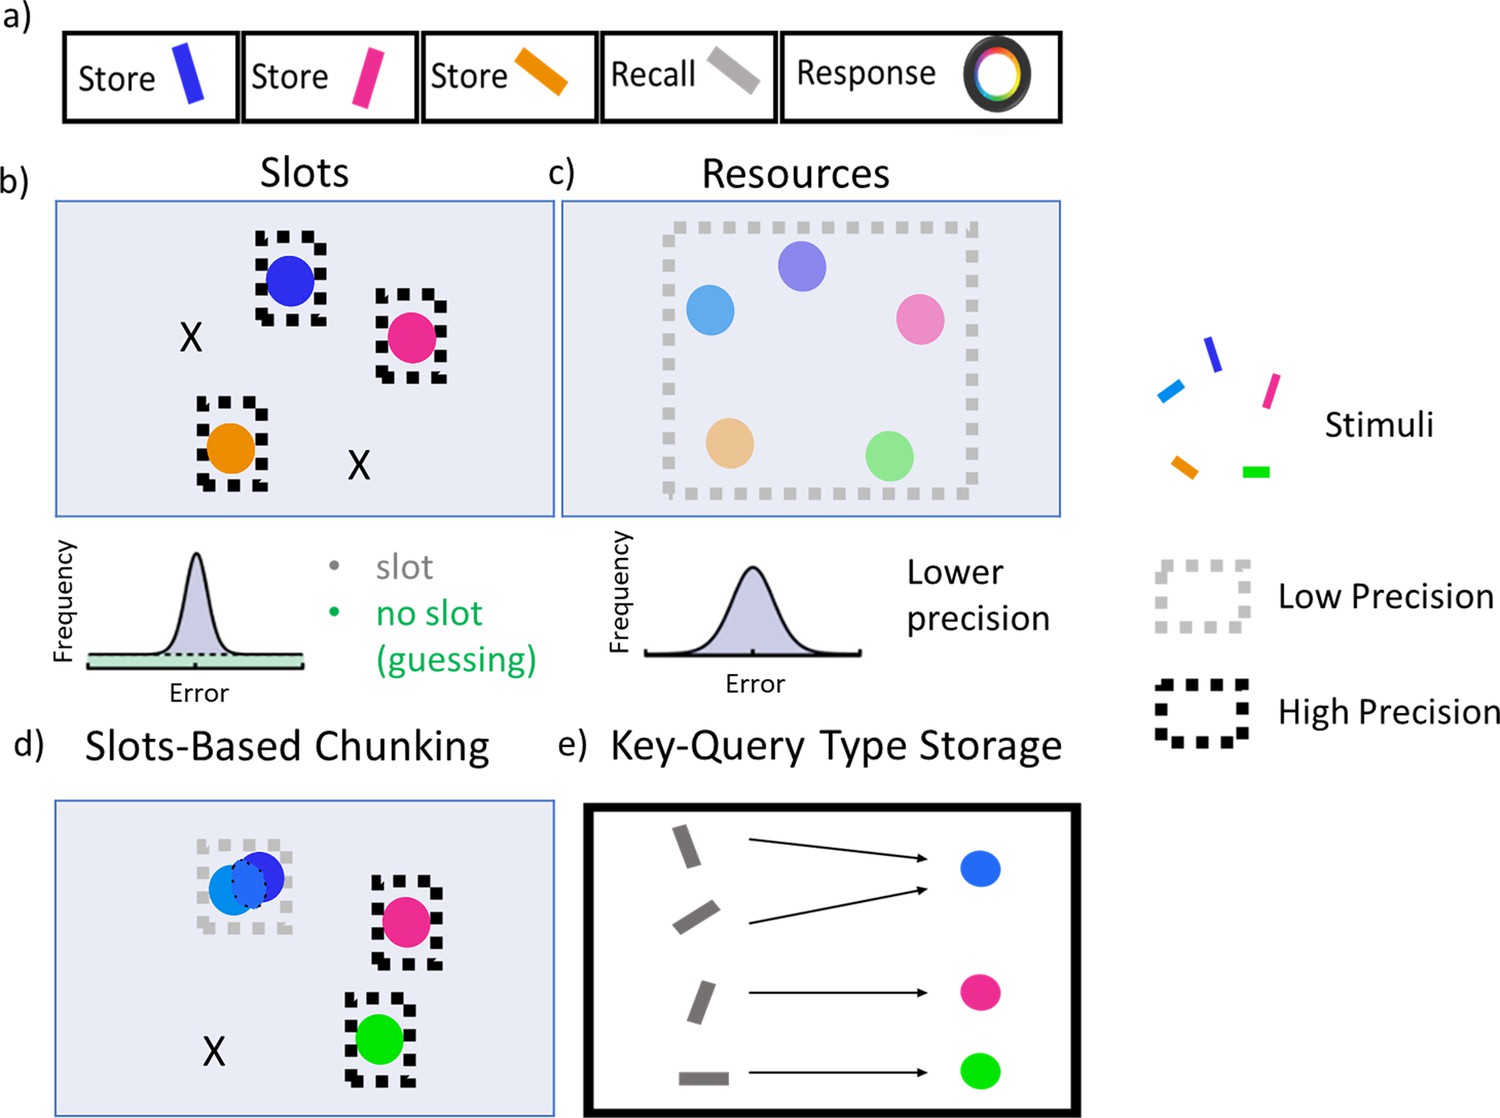
Visual working memory task.
(a) The color wheel task is commonly used to study the nature of capacity limitations in VWM. During encoding, participants are presented multiple randomly generated oriented and colored bars. After a delay they are shown a recall probe trial in which one of the previously seen orientations is presented in gray. The participant responds by using a color wheel in an attempt to reproduce the color associated with that probe orientation. The number of store items are dictated by set size. (b) Slots models suggest that WM capacity is limited by a fixed number of slots. When set size exceeds capacity, some items are stored in memory with high precision while the rest are forgotten, resulting in an error histogram that is a mixture of high precision memory (for items in a slot) and guessing (for items not in a slot). (c) Resource models state that all items can be stored in a common pool, but as the number of items increase, the precision of each representation decreases, resulting in an error histogram with a large variance (but no guessing). Adapted from Ma et al., 2014. (d) A hybrid chunking model containing discrete slots, but with resource-like constraints within each slot. Here, the two bluish items are merged together within a slot, reducing their precision but freeing up other slots to represent pink and green items with high precision. The orange item is forgotten. The criterion for chunking can be adapted such that error histograms will look more like the slots theory or resource theory depending on task demands (WM load and chunkability of the stimulus array; Nassar et al., 2018). (e) Storage in the PBWM-chunk model is like a key-query. The colors are stored as continuous representations in prefrontal cortex (PFC) and can be merged. The orientations are the queries used to probe where information should be stored and where to read it out from.
Figure 3
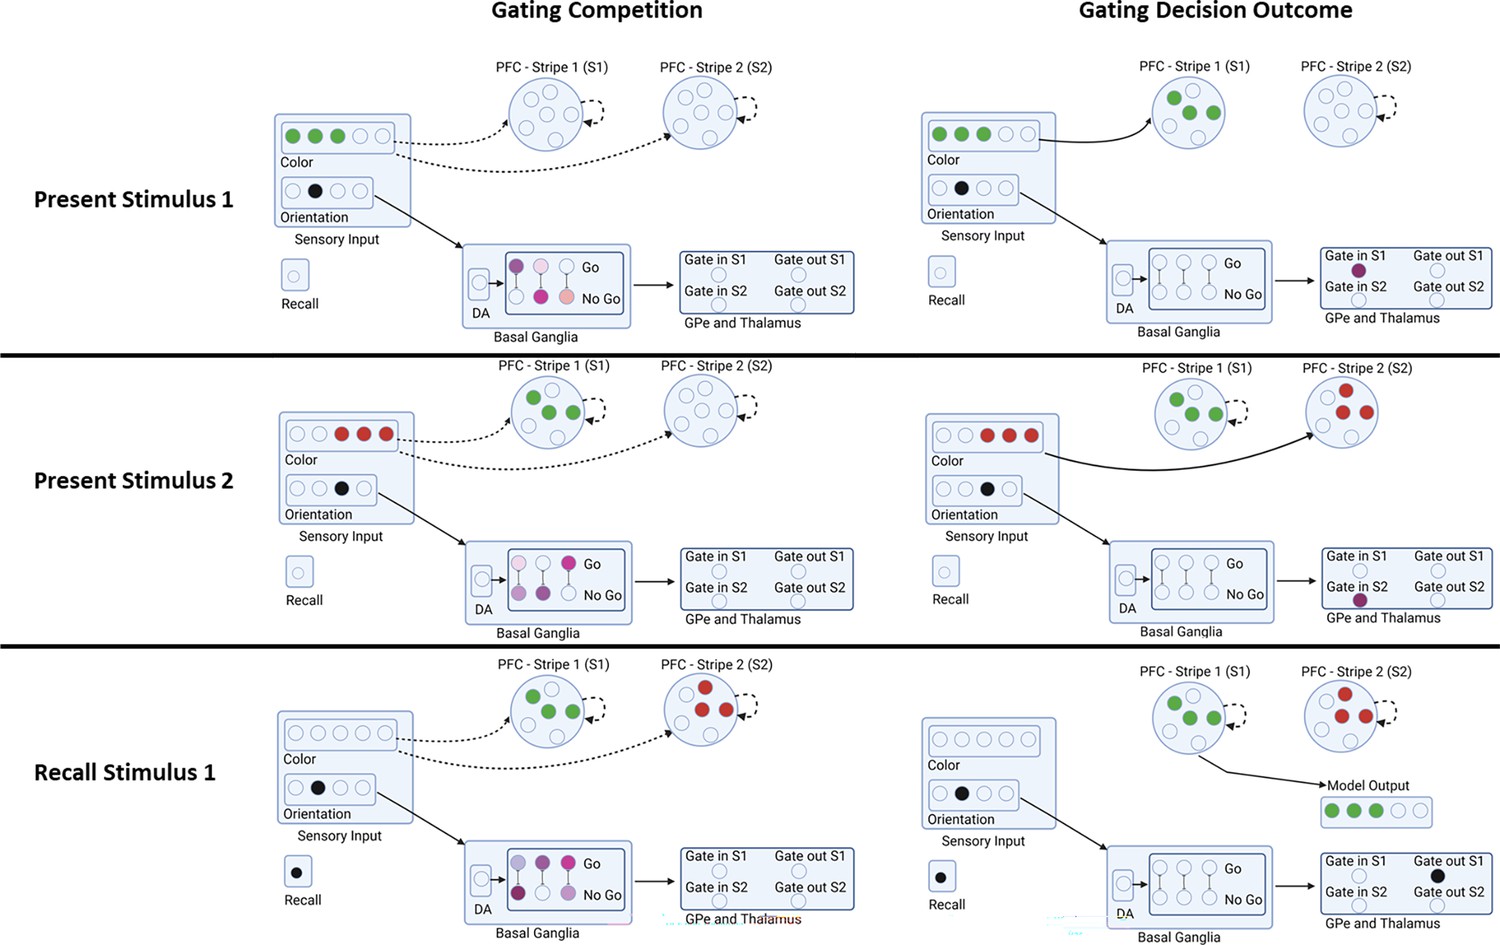
Example sequence of network gating decisions.
In this example trial, the network is presented with stimulus 1 (color and orientation), stimulus 2, and is then asked to recall the color of stimulus 1 based on just its orientation. Each step is broken into a gating competition that involves the Basal Ganglia (striatal Go/NoGo units, Gpe/Gpi) and Thalamus units. The outcome of this internal competition determines the gating decision and the model output. When the first stimulus is presented, the relative activities determine if and where the stimulus is gated in (stripe 1 or stripe 2). The network gates stimulus 2 in a different stripe based on its orientation. During recall, the network uses a gating policy to output gate the stripe corresponding to the probed orientation. A reward is delivered to the network proportional to the accuracy in reporting the original color. A negative reward is delivered if the color is not sufficiently close (see Methods). Rewards translate into dopaminergic reward prediction error signals that serve to reinforce or punish recent gating operations. This schematic is illustrative; the actual network contains a broader population code and the prefrontal cortex (PFC) stripes are divided into input and output representations, each with deep and superficial layers (see Text).
Figure 4
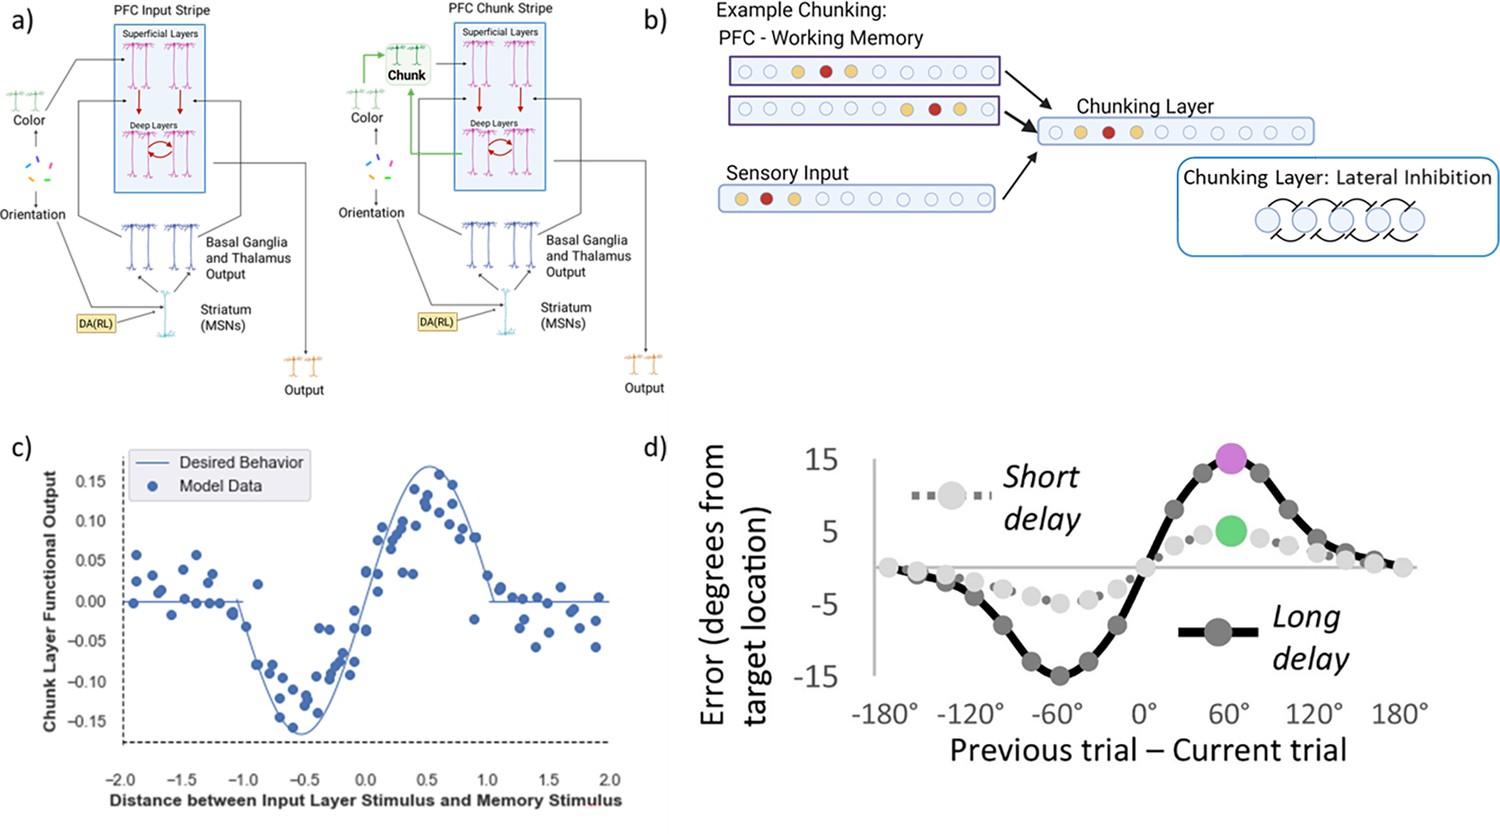
Prefrontal cortex basal ganglia working memory (PBWM) model and chunking layer details.
(a) Network diagram in the minimal case of two stripes: the first prefrontal cortex (PFC) stripe receives projections from the input layer (‘PFC Input Stripe’); the second PFC stripe receives projections from the chunk layer (‘PFC Chunk Stripe’). The network can be scaled to include more stripes of either type. We will refer to this model as the ‘chunk model.’ The control ‘no chunk’ model has two stripes that are both of the type ‘PFC Input Stripe’ (but it can use them to store separate inputs). (b) Chunking schematic. A posterior ring attractor layer receives both bottom up sensory input and top-down input from the two PFC stripes (maintaining separate stimuli/representations). Overlap between the sensory input and the first PFC representation leads to convergent excitatory input in the chunking layer, resulting in a merged attractor. The impact of the more distant PFC representation is suppressed due to lateral inhibition. (c) Chunking profile based on similarity. The x-axis shows the difference (in arbitrary units - comparable to radians) between the incoming stimulus and the nearest stimulus in PFC. The y-axis shows the deviation in the decoded chunk layer representation from the input stimulus. If the sensory input is close to a PFC representation, the chunk layer is attracted toward it. If the difference between the input stimulus and the nearest PFC representation is too large, the chunk layer largely mirrors the input (due to stronger input than PFC projections and lateral inhibition). This chunking profile closely matches that seen human memory representations, whereby memory reports are biased toward recent stimuli Kiyonaga et al., 2017.
© 2017, Elsevier. Figure 4d is reprinted from Figure 1 from Kiyonaga et al., 2017, with permission from Elsevier. It is not covered by the CC-BY 4.0 licence and further reproduction of this panel would need permission from the copyright holder.
Figure 5 with 1 supplement

Model recall error histograms.
The binned error in degrees is plotted on the x-axis, and the number of trials for that error bin on the y-axis. The blue and orange histograms show errors from all recall trials across all 80 random weight initializations from the chunk and no chunk models, each allocated with two stripes. The red histogram plots a bin-by-bin difference in errors between the models. (a) For set size 2, there is very little difference between the models. The chunk model exhibits slightly higher rates of low errors neighboring zero (up to 30 degrees), due to small losses in precision resulting from some chunking (see text). (b) Set size 3 is beyond the number of stripes allotted to the network. The chunk model has a larger density at zero and small errors, and less guessing (reduced density in the uniform distribution, see red lines). (c) At set size 4, the chunking advantage is manifest by low errors and the improvement in less guessing becomes more pronounced (note y-axis scale - the reduction in guessing is actually reduced for set size 4 compared to 3).
Figure 5—figure supplement 1
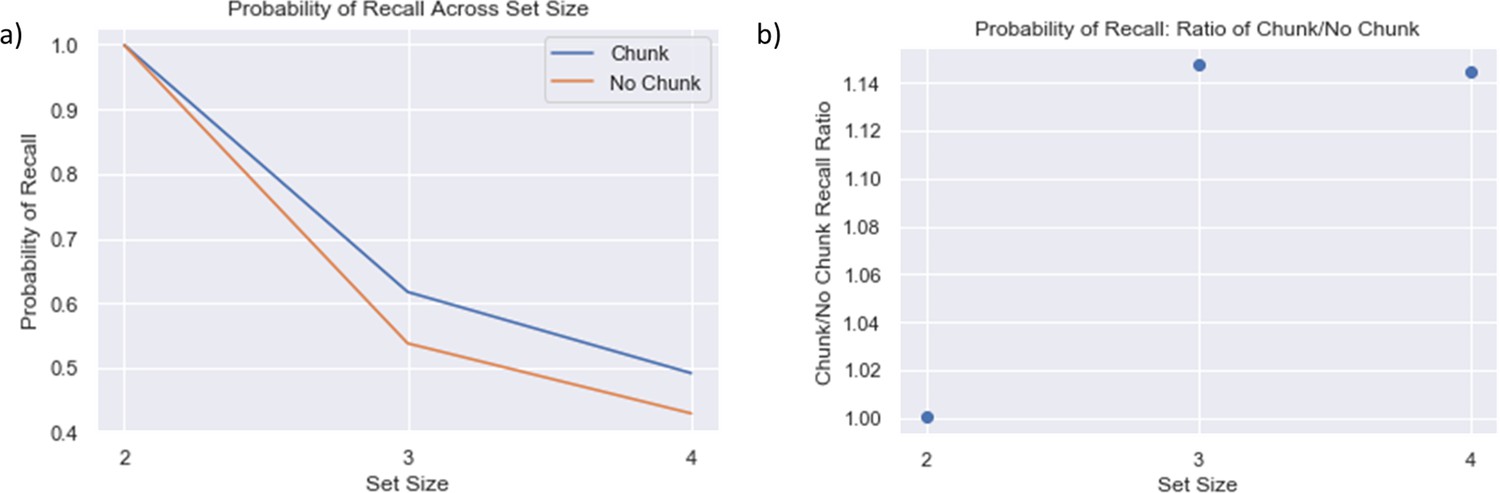
P(Recall) across set size.
(a) Average recall probability across set sizes decreases with set size, but less so for chunk models. Note that chance performance is approximately 19%. (b) Chunk models have a higher ratio of recall probability relative to no chunk model when set size exceeds allocated capacity. This analysis includes trials where the variance across colors is low (standard deviation was < 35 degrees). The same chunk advantages would acrossalltrials (including with high variance; not shown) butwefocusonlowvariancetrialswherein models can perform reasonably well even if accidentally mistaking one item for another (swap errors). Here we confirm that the chunk model improvement occurs over and above such effects.
Figure 6
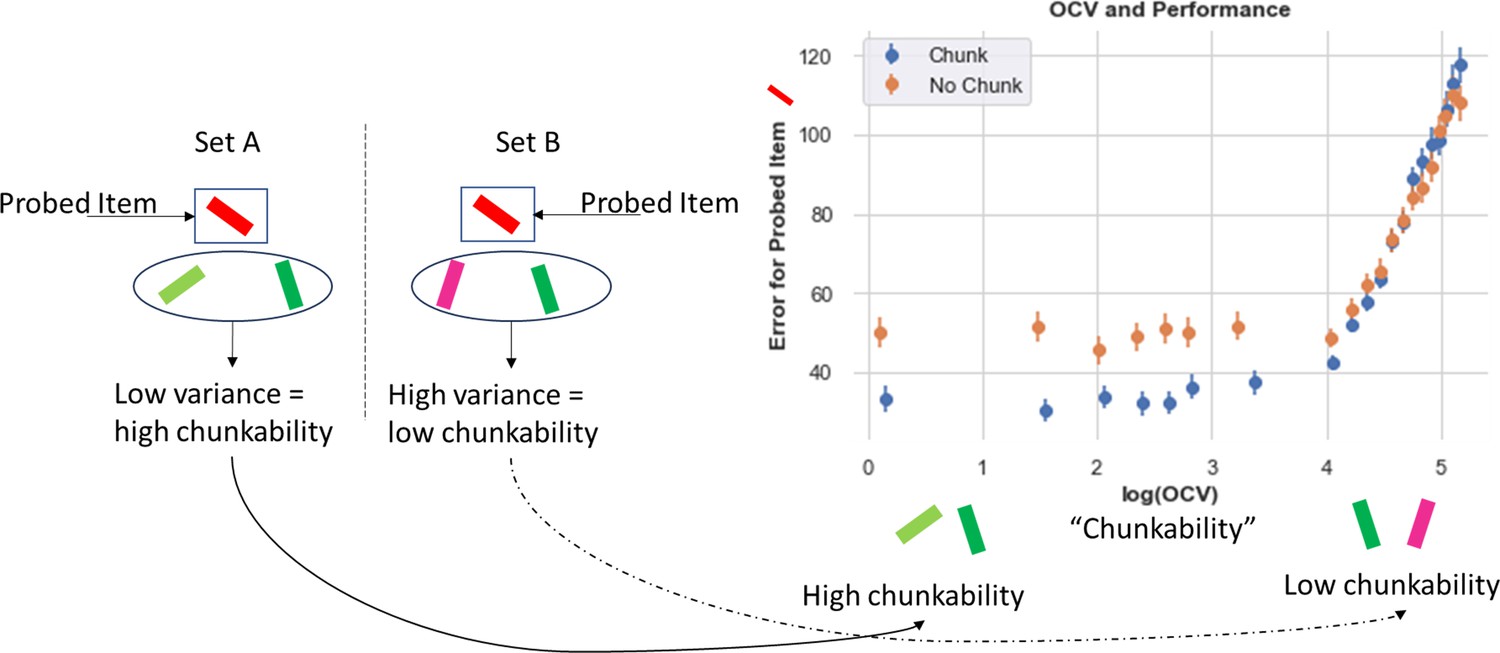
Chunking improves recall for non-chunked items.
Left. Example array. Here, we compare two sets, both containing a red item that will be later probed. In Set A, the other items (out of the probed cluster) are two shades of green and thus low variance (are similar to each other) and are, therefore, more likely to be chunked. In set B, the out of cluster variance (OCV) for the green and pink items is higher and these items are not likely to be chunked. Right. Chunking networks show consistent Recall advantages (lower errors) when OCV is low and hence the other items are chunkable. This difference disappears as OCV increases and overall errors rise. Errors plotted over all trials averaged over 80 networks in each case.
Figure 7
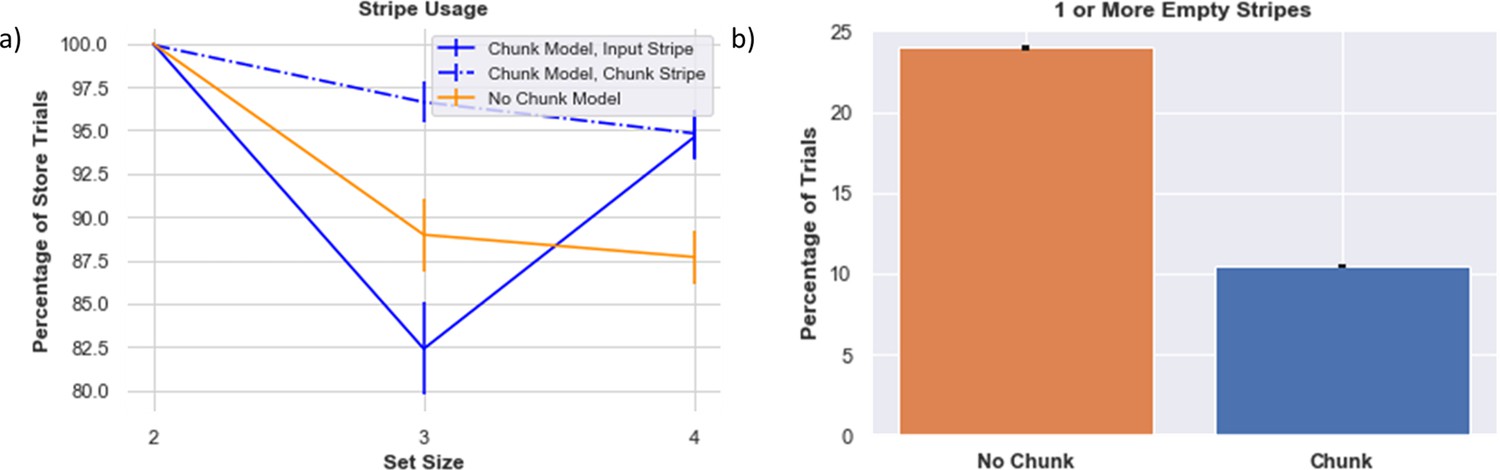
Stripe usage.
(a) Stripe usage for the (1) chunk model, chunk -linked stripe (2) chunk model, input-linked stripe (3) no chunk model (average across both stripes), (b) Proportion of trials when at least one stripe was empty. This analysis was done over 160 different model initializations.
Figure 8
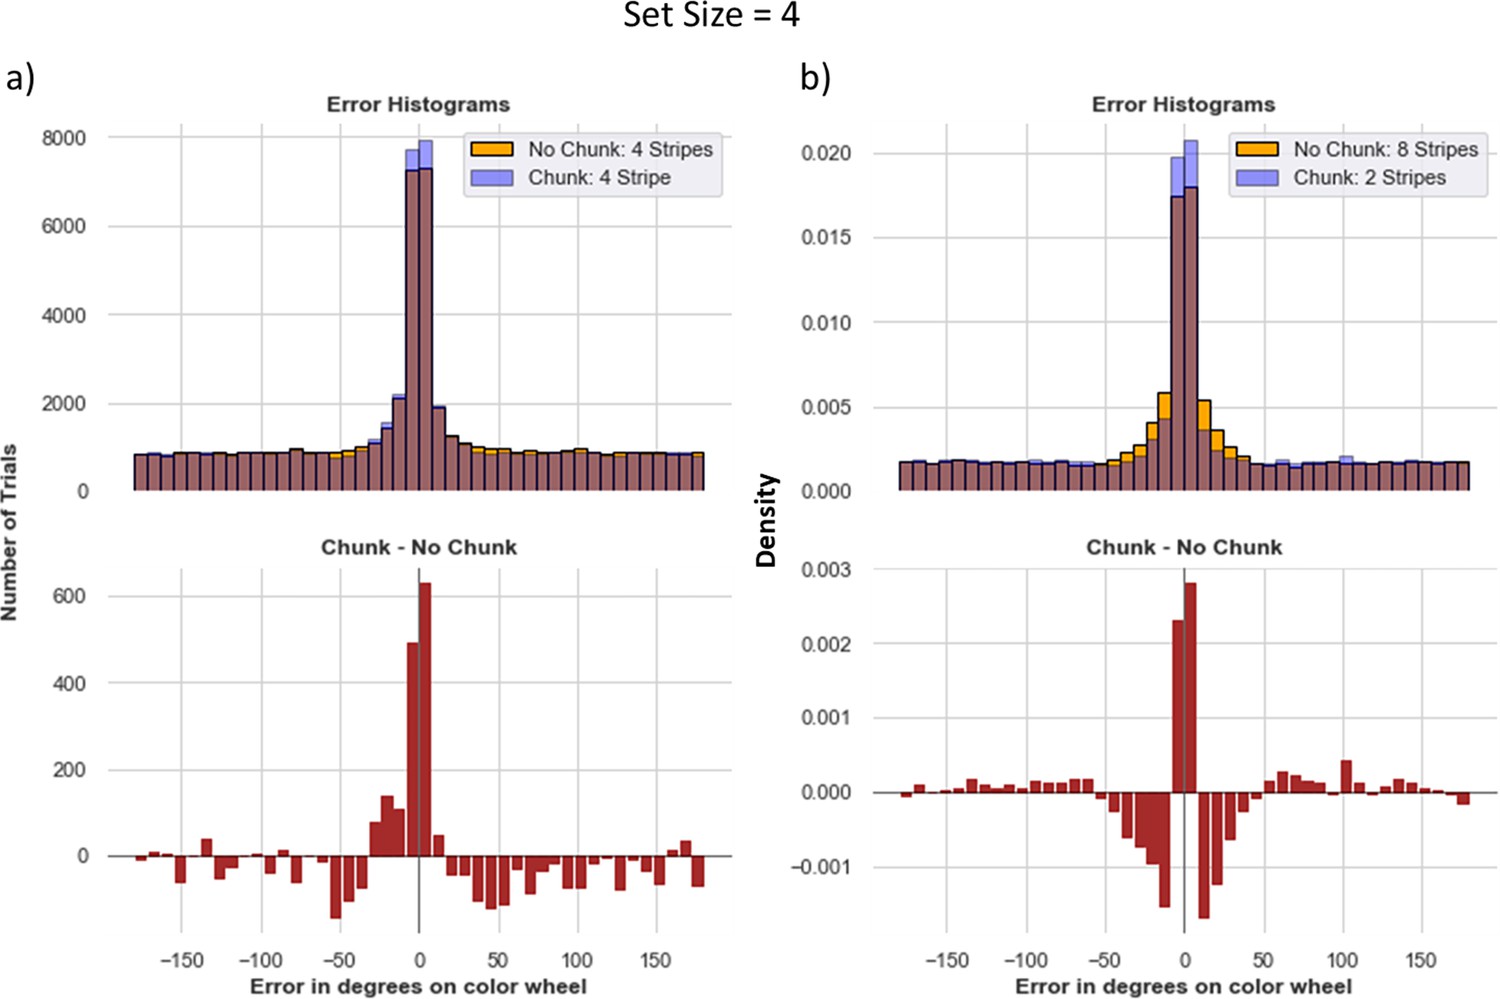
Increasing allocated capacity ≠ better performance.
The importance of Resource Management (a) Chunk model with four stripes vs. No chunk model with four stripes in a task with set size 4. Even though the no-chunk networks has sufficient number of stripes to store each item with high precision, the corresponding chunk network still exhibits advantages, due to difficulties in credit assignment associated with managing four independent stripes. (b) A more extreme comparison between the chunk model with two stripes vs. No chunk model with eightstripes. The chunk model guesses slightly more, but has more precise responses. The 8-stripe model has more density at small nonzero errors (see text for explanation). For both a and b the averages were computed over 160 models. For b, we display density rather than counts, because trials where either models gave no response were removed to better understand the small nonzero errors in the eight stripe model (nonresponses add noise).
Figure 9
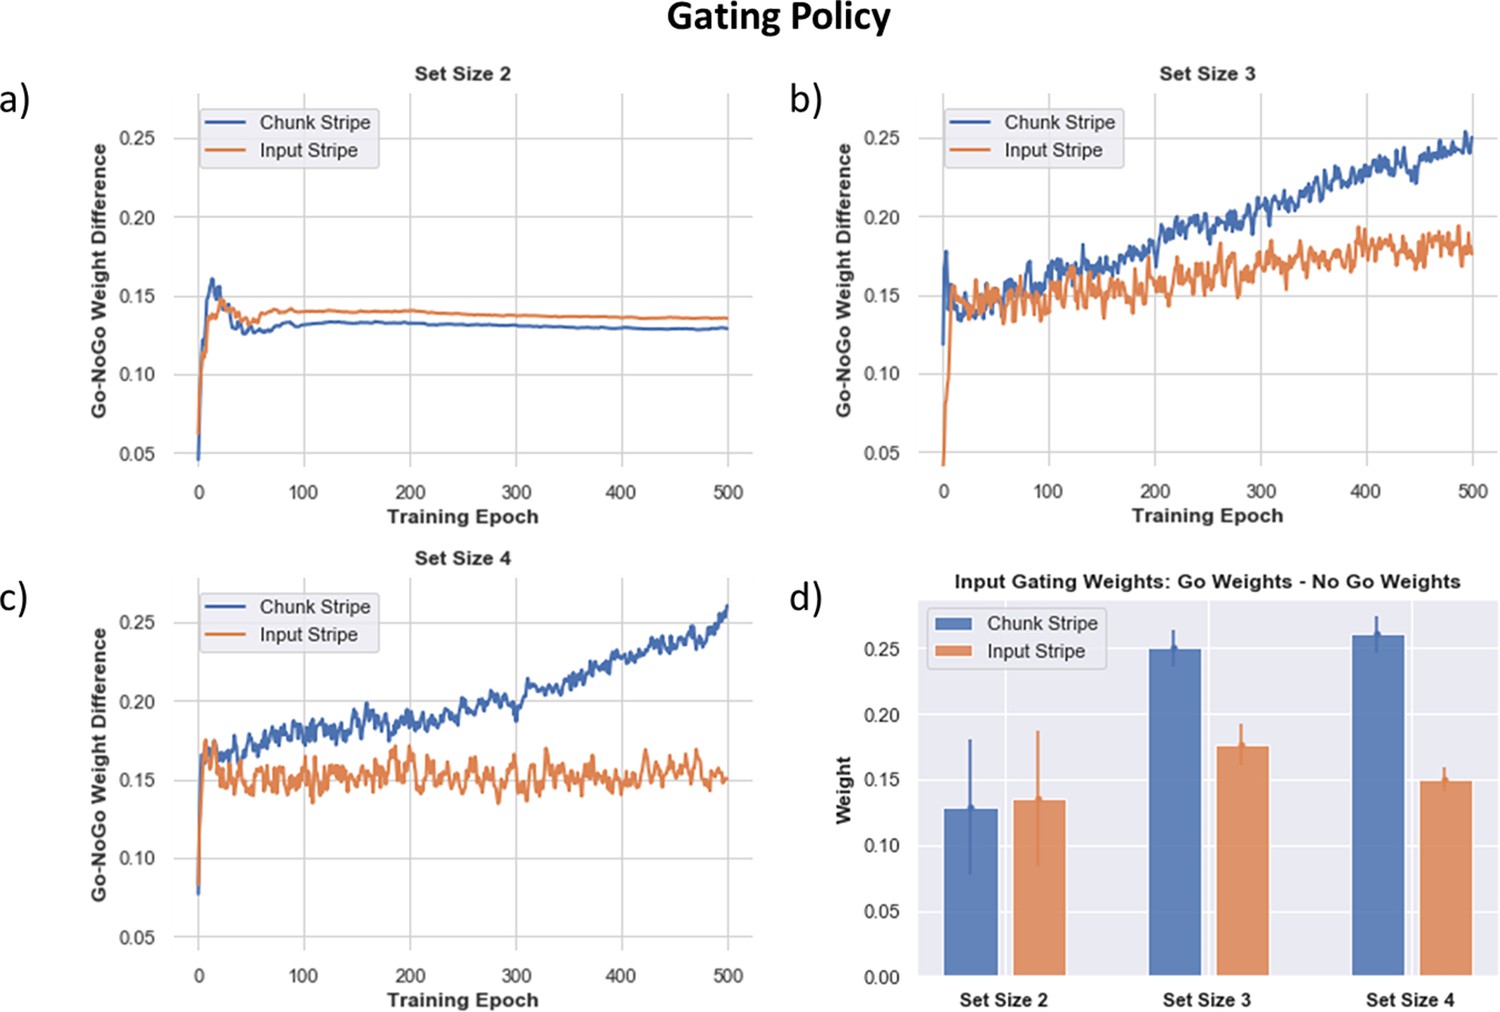
Gating policy (Go - NoGo Weights for Each PFC Stripe) across training as the networks learn (over 500 training epochs, averaged over 80 networks), the learned gating strategy differentiates between the input-linked (orange) or chunk-linked (blue) stripes.
Positive values indicate the networks learn greater Go than NoGo weights for input gating stimuli into the corresponding stripe. (a) Set size 2, the learned gating strategy shows a slight preference for the input stripe to be used (associated with increased precision), but the network also uses its chunk stripe to store the other stimulus (it is possible the chunk stripe stores a merged representation depending on the proximity of the stimuli). (b) As the set size increases to 3, the chunk stripe is increasingly preferred over training. (c) This differentiation occurs earlier and more strongly for set size 4, where chunking has yet a larger advantage. (d) Summary of Go - NoGo weights after training. A larger positive value shows a stronger preference for gating into that stripe. As set size increases, preference for gating into the chunk stripe increases. Relevant for training of all models: We can confirm that the network behavior has stabilized in learning even if the Go/NoGo weights continue to grow over time for the chunked layer (due to imperfect performance and reinforcement of the chunk gating strategy).
Figure 10
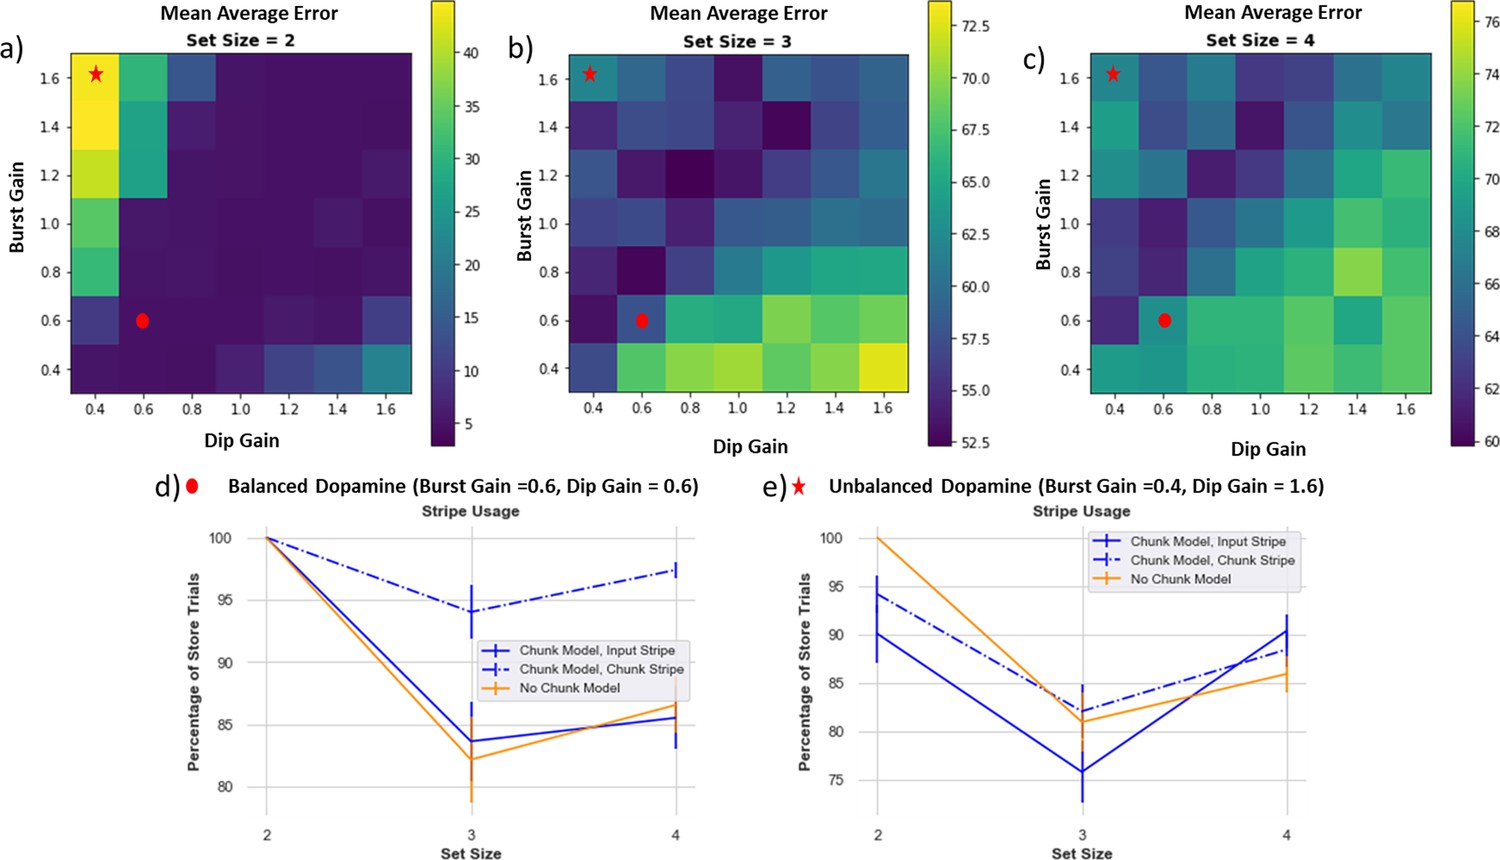
Dynamic dopamine bursts and dips are needed for adaptive performance.
Each box is an average absolute error over 80 models. The color bar on the right indicates performance (note different scales on each plot), with darker colors (blue) representing better performance/lower absolute error. (a) Set size 2: best performance is across the axis where burst and dip gain are symmetrical. (b and c) Set size 3 and 4: best performance is where burst gain is slightly higher than dip gain. (d) Example of balanced DA (burst gain = dip gain=0.6), stripe usage. The chunk model manages to use the chunk stripe across all set sizes and both stripes in set size 2. The no-chunk model shows diminished storage of both stripes with increased set size due to greater propensity of dopamine (DA) dips. (e) A regime of DA imbalance (larger DA dip than gain). The chunk model fails to robustly use both of its stripes, losing its advantage. The reinforcement learning (RL) parameters interact with the ability for the chunk model to properly leverage chunking.
Figure 11
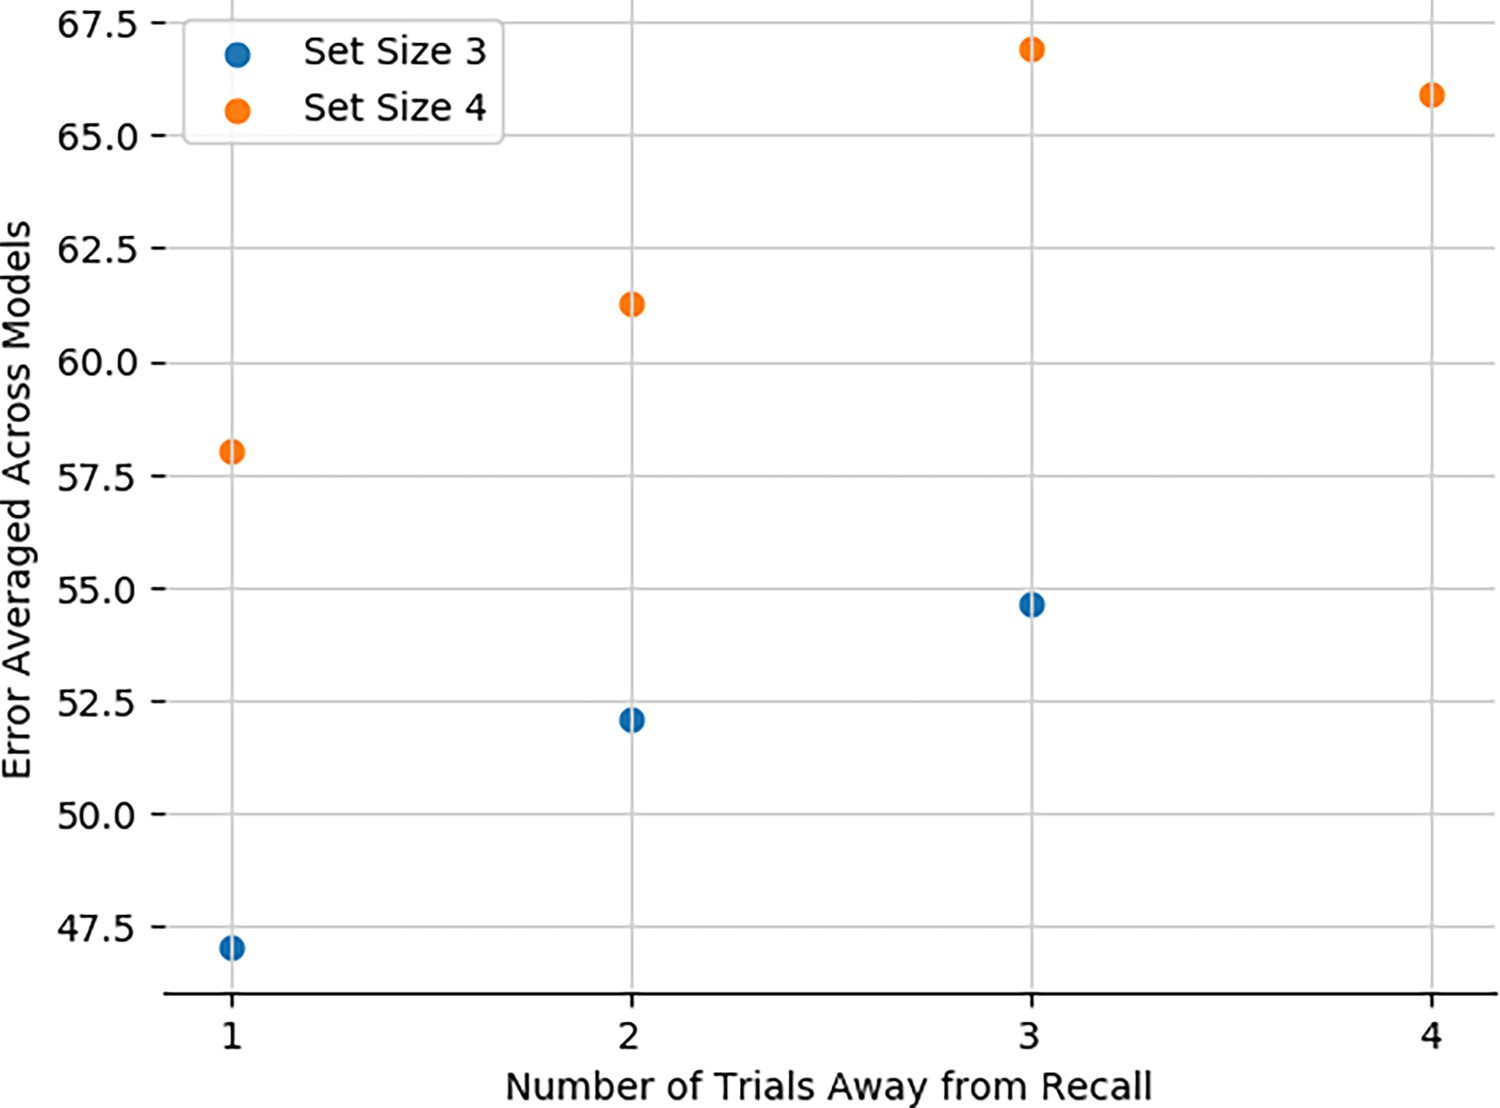
Network captures recency effects.
Average error on recall trials as a function of the distance in trials between presentation of the relevant stimulus and recall.
Additional files
Download links
A two-part list of links to download the article, or parts of the article, in various formats.
Downloads (link to download the article as PDF)
Open citations (links to open the citations from this article in various online reference manager services)
Cite this article (links to download the citations from this article in formats compatible with various reference manager tools)
Adaptive chunking improves effective working memory capacity in a prefrontal cortex and basal ganglia circuit
eLife 13:RP97894.
https://doi.org/10.7554/eLife.97894.3


