Perceptual and attentional impairments of conscious access involve distinct neural mechanisms despite equal task performance
- Department of Psychology, University of Amsterdam, Netherlands
- Amsterdam Brain and Cognition, University of Amsterdam, Netherlands
- Department of Applied and Experimental Psychology, Vrije Universiteit Amsterdam, Netherlands
Figures
Figure 1 with 1 supplement
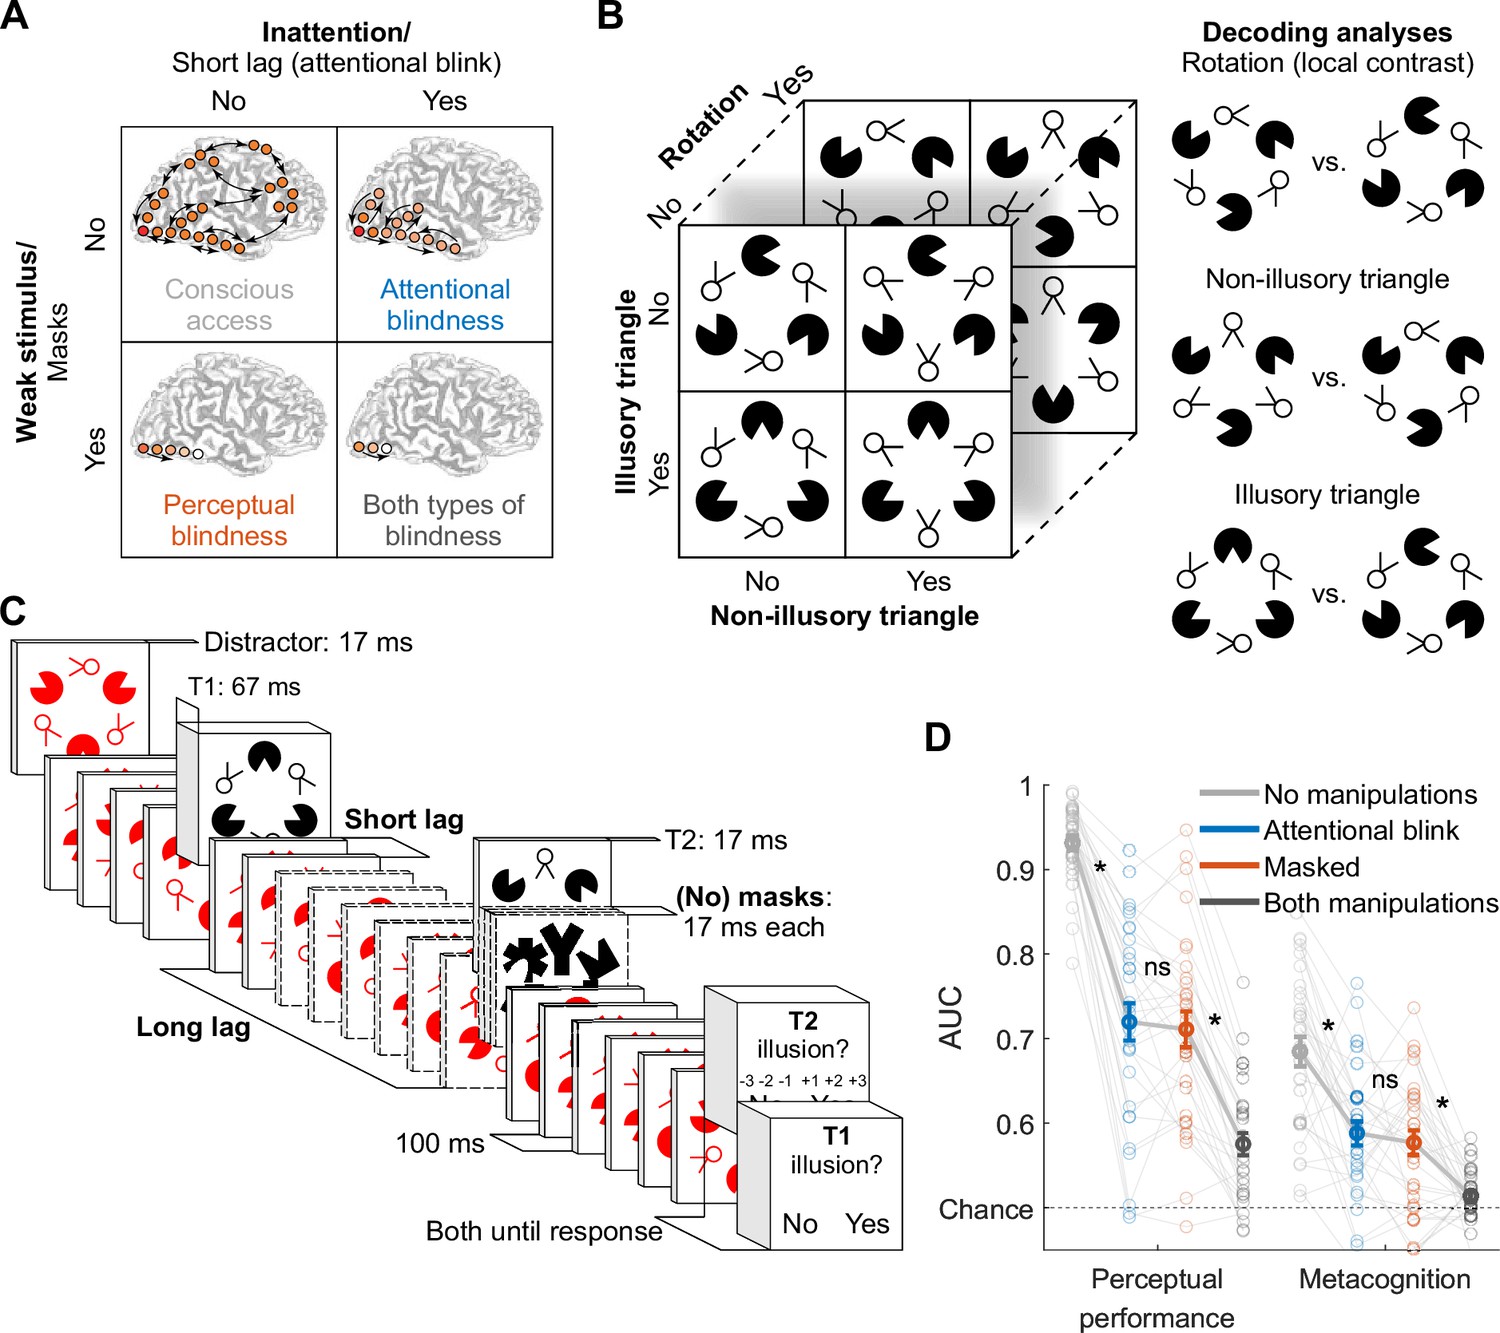
Experimental design and behavior.
(A) Perceptual vs. attentional blindness in the four-stage model. A stimulus with low bottom-up strength (masked) is thought to interrupt local recurrent processing in sensory areas while leaving feedforward processing largely intact, while inattention (induced by the attentional blink) is thought to interrupt global recurrent processing between frontoparietal areas and sensory areas, while leaving local recurrent processing within sensory areas largely intact. Reprinted from Dehaene et al., 2006 with permission from Elsevier. (B) Target stimulus set and decoding analyses. (C) Trial design. Note that the central fixation cross is not displayed for readability. (D) Perceptual performance refers to participants’ ability to detect the Kanizsa illusion. Metacognition refers to participants’ ability to evaluate their own performance using confidence judgments. Both perceptual performance and metacognition are measured as the area under the receiver operating characteristic curve (area under the curve, AUC). Error bars are mean ± standard error of the mean (n = 30). Individual data points are plotted using low contrast. Ns is not significant (p≥0.477, BF01 ≥4.05). *p≤0.001.
© 2006, Elsevier. Panel A is reprinted from Dehaene et al., 2006 with permission from Elsevier. It is not covered by the CC-BY 4.0 licence and further reproduction of this panel would need permission from the copyright holder.
Figure 1—figure supplement 1
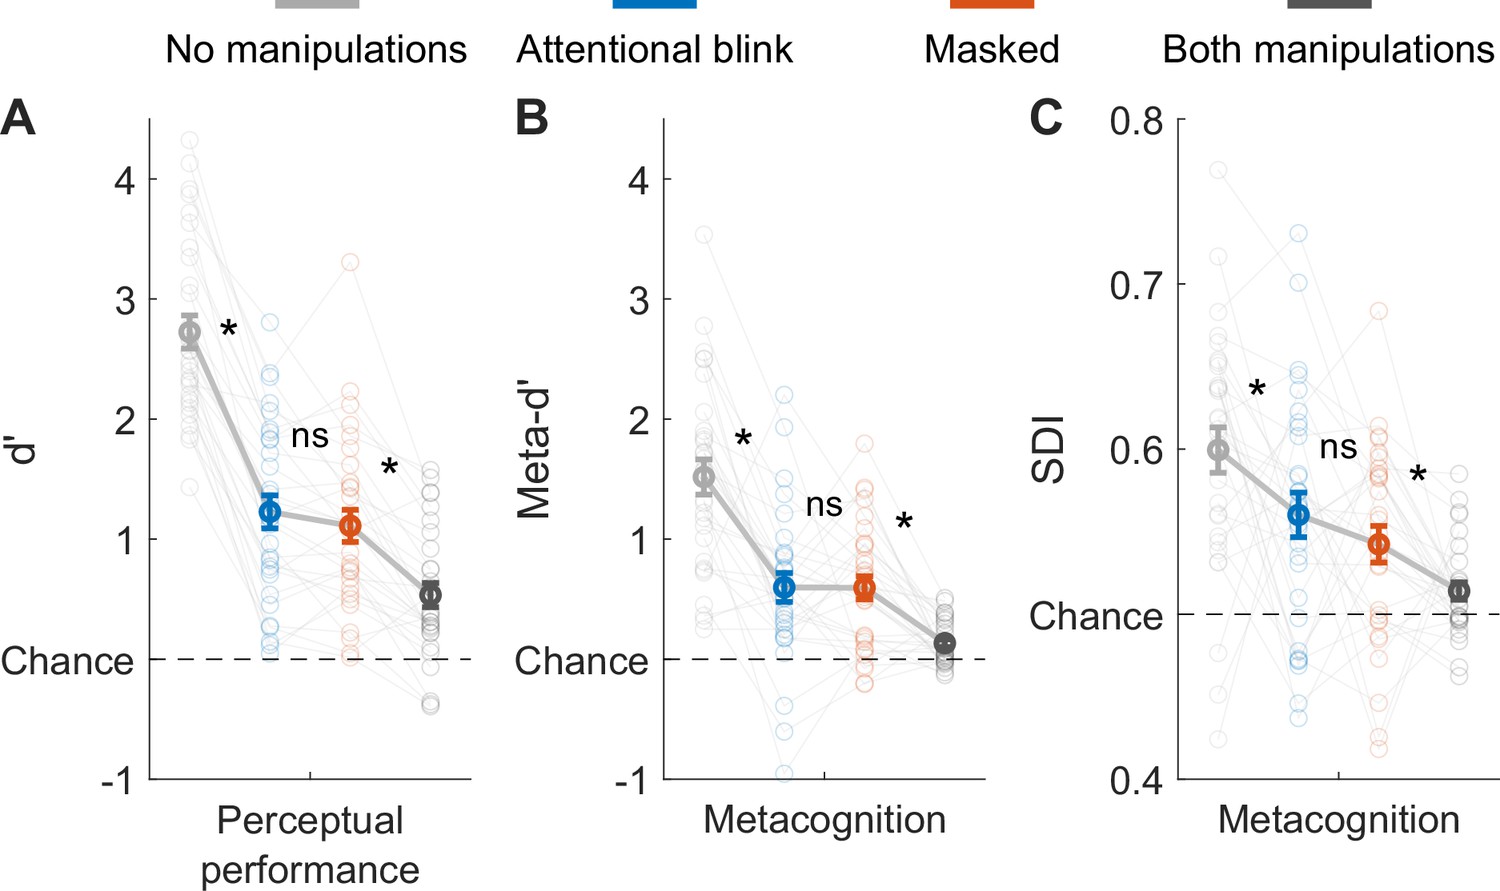
Alternative measures of behavioral performance.
Perceptual performance refers to participants’ ability to detect the Kanizsa illusion. Metacognition refers to participants’ ability to evaluate their own performance using confidence judgments. (A) Perceptual performance in d’. (B) Metacognition in meta-d’ (Maniscalco and Lau, 2012). (C) Metacognition in subjective discriminability of invisibility (SDI): the area under the receiver operating characteristic curve was calculated after only including trials where participants reported stimulus absence (here, the absence of the illusion). Kanai et al., 2010 introduced this measure and found a greater SDI after attentional manipulations compared to perceptual manipulations, suggesting that participants had some knowledge of having missed a stimulus under inattention. However, in the current study, there was no significant difference in SDI between masking and the attentional blink (t29=1.17, p=0.250, BF01=2.75). Error bars are mean ± standard error of the mean (n = 30). Individual data points are plotted using low contrast. Ns is not significant (p≥0.176, BF01 ≥2.16). *p≤0.039.
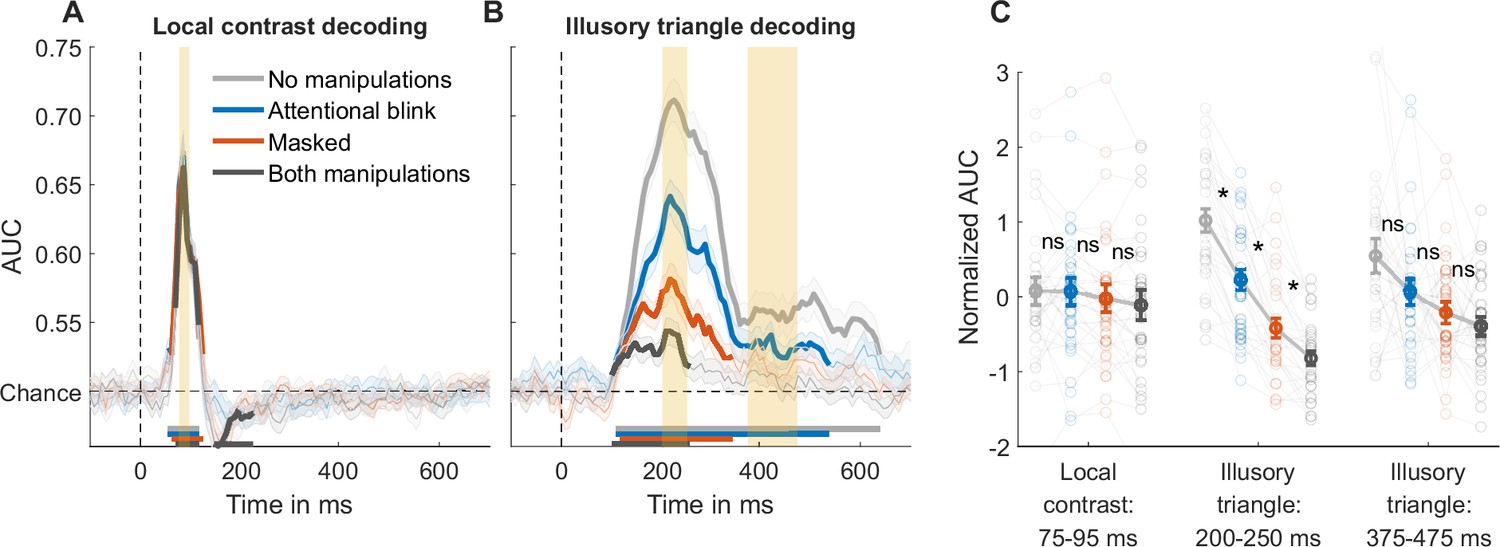
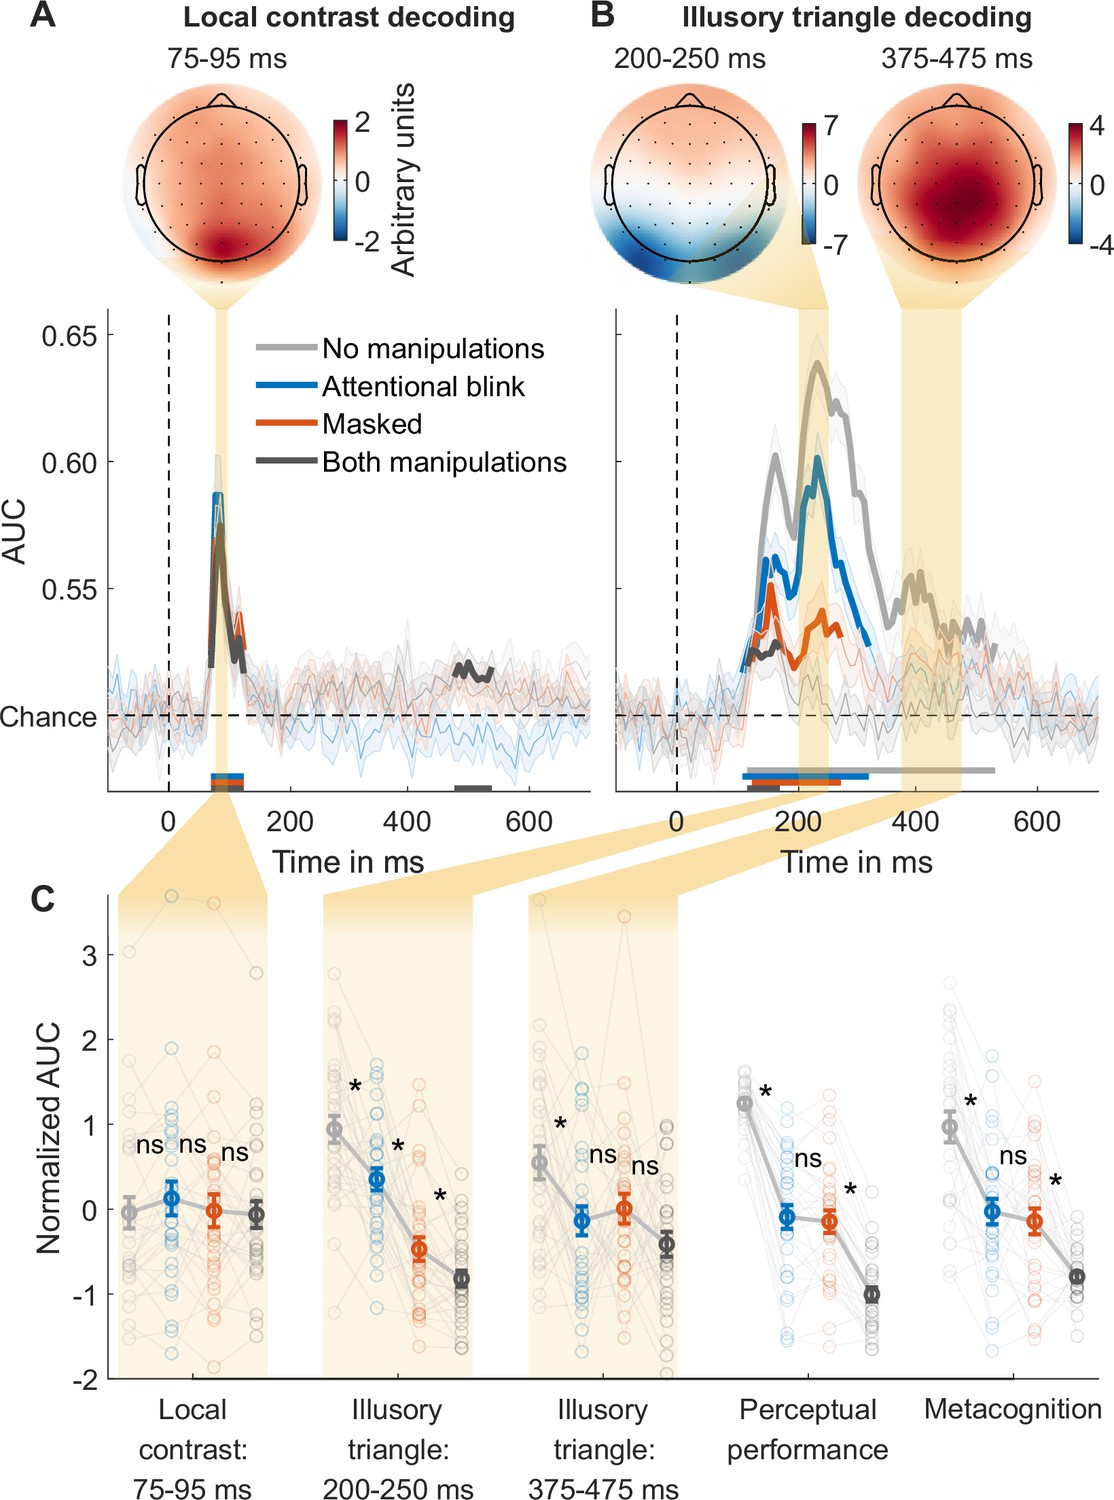
Figure 2 with 3 supplements
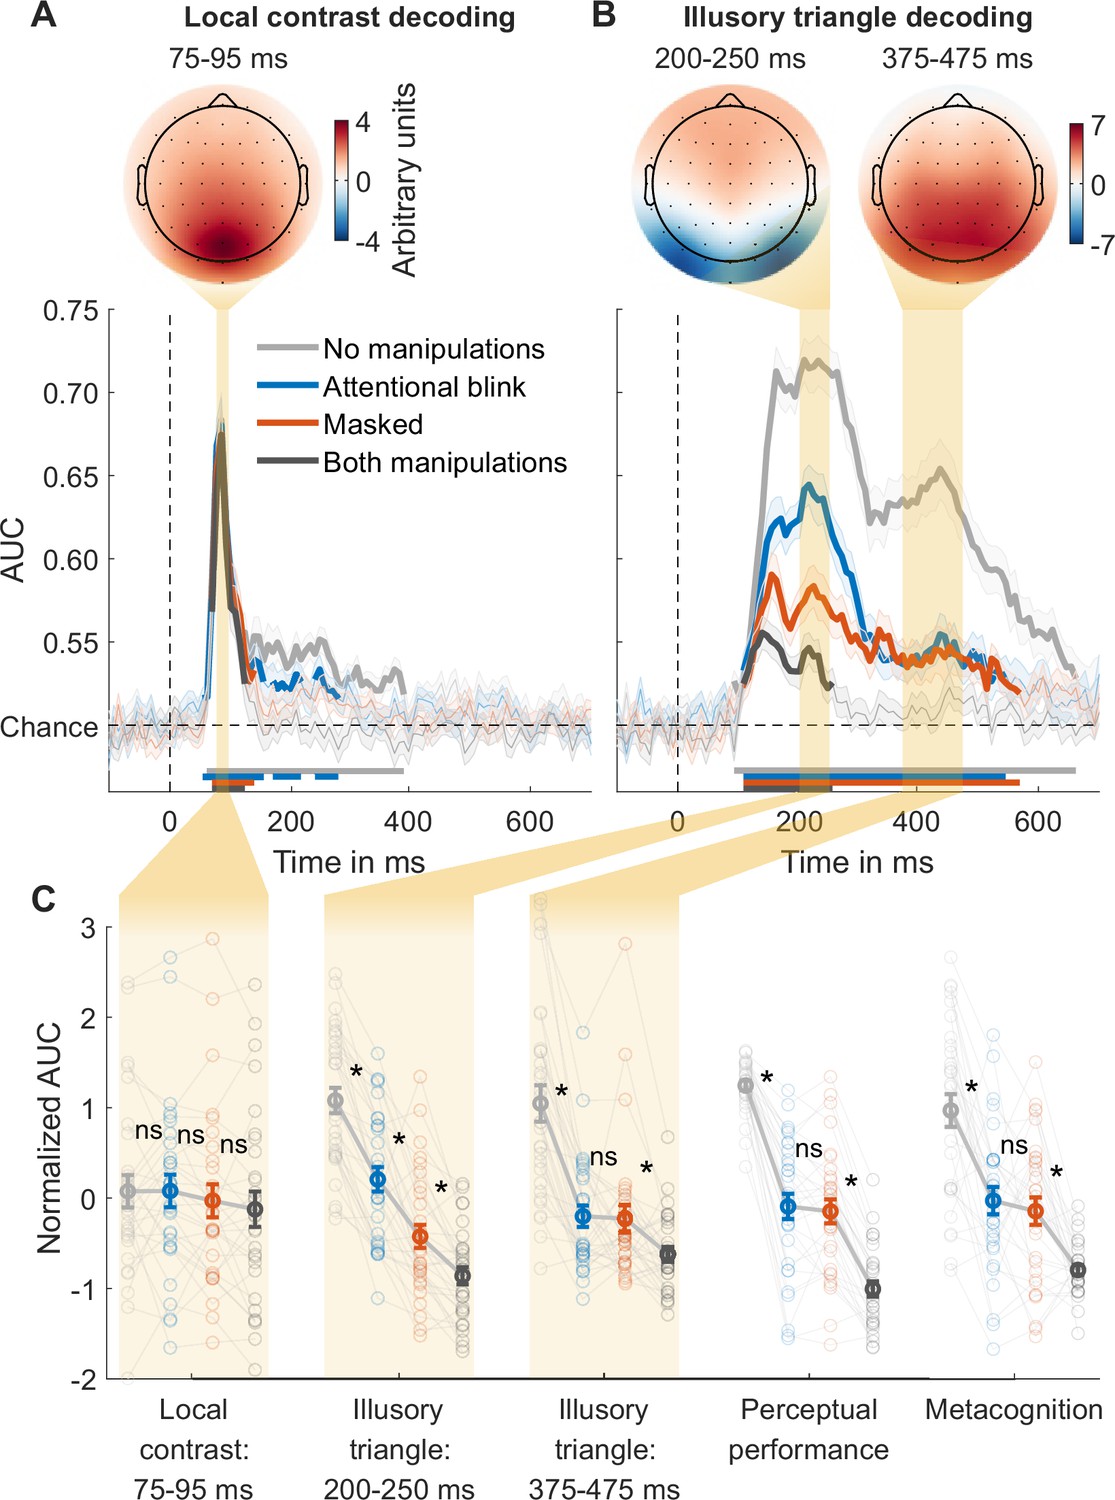
Local contrast and illusory triangle decoding using first targets as training data.
(A) Local contrast decoding. (B) Illusory Kanizsa triangle decoding. For both features, covariance/class separability maps reflecting underlying neural sources are shown. Below these maps: mean decoding performance, area under the receiver operating characteristic curve (area under the curve, AUC), over time ± standard error of the mean (SEM; n = 30). Thick lines differ from chance: p<0.05, cluster-based permutation test. (C) Normalized (Z-scored) AUC for every measure: mean decoding time windows and two types of behavior. Each measure is Z-scored separately. Perceptual performance refers to participants’ ability to detect the Kanizsa illusion. Metacognition refers to participants’ ability to evaluate their own performance using confidence judgments. See Figure 2—figure supplement 2 for the same analyses but then for off-diagonal decoding profiles. Error bars are mean ± SEM. Individual data points are plotted using low contrast. Ns is not significant (p≥0.166, BF01 ≥2.07). *p≤0.002.
Figure 2—figure supplement 1
Averaged decoding accuracy peaks and time window selection.
Mean decoding performance, area under the receiver operating characteristic curve (area under the curve, AUC), over time ± standard error of the mean (SEM; n = 30). Thick lines differ from chance: p<0.05, cluster-based permutation test. Vertical black lines indicate the main peaks and yellow rectangles their encompassing time windows. (A) Local contrast decoding. Regardless of training the classifier on first targets (top) or the independent training data (bottom), the main peak is at 86 ms, which is encompassed by the 75–95 ms time window. (B) Non-illusory triangle decoding. When the classifier was trained on first targets (top), the main peak was at 164 ms. When it was trained on the independent training set (bottom), the main peak was at 172 ms. Both peaks were encompassed by the 140-190 ms time window. (C) Illusory triangle decoding. When the classifier was trained on first targets (top), the main peaks were at 164, 219, and 438 ms, which were encompassed by the 140–190, 200–250, 375–475 ms time windows, respectively. When it was trained on the independent training set (bottom), the main peaks were at 164, 234, and 391 ms, which were encompassed by the same time windows.
Figure 2—figure supplement 2
Local contrast and illusory triangle off-diagonal decoding using first targets as training data.
(A) Rotation off-diagonal decoding, trained on the 75–95 ms window of T1. (B) Illusory Kanizsa triangle off-diagonal decoding, trained on the 200–250 ms window of T1. For both features, mean decoding performance, area under the receiver operating characteristic curve (area under the curve, AUC), over time ± standard error of the mean (SEM) is shown (n = 30). Thick lines differ from chance: p<0.05, cluster-based permutation test. (C) Normalized (Z-scored) AUC for every time window. Each window is Z-scored separately. Error bars are mean ± SEM. Individual data points are plotted using low contrast. ns is not significant (p≥0.062, BF01 ≥0.99). *p≤10–4.
Figure 2—figure supplement 3
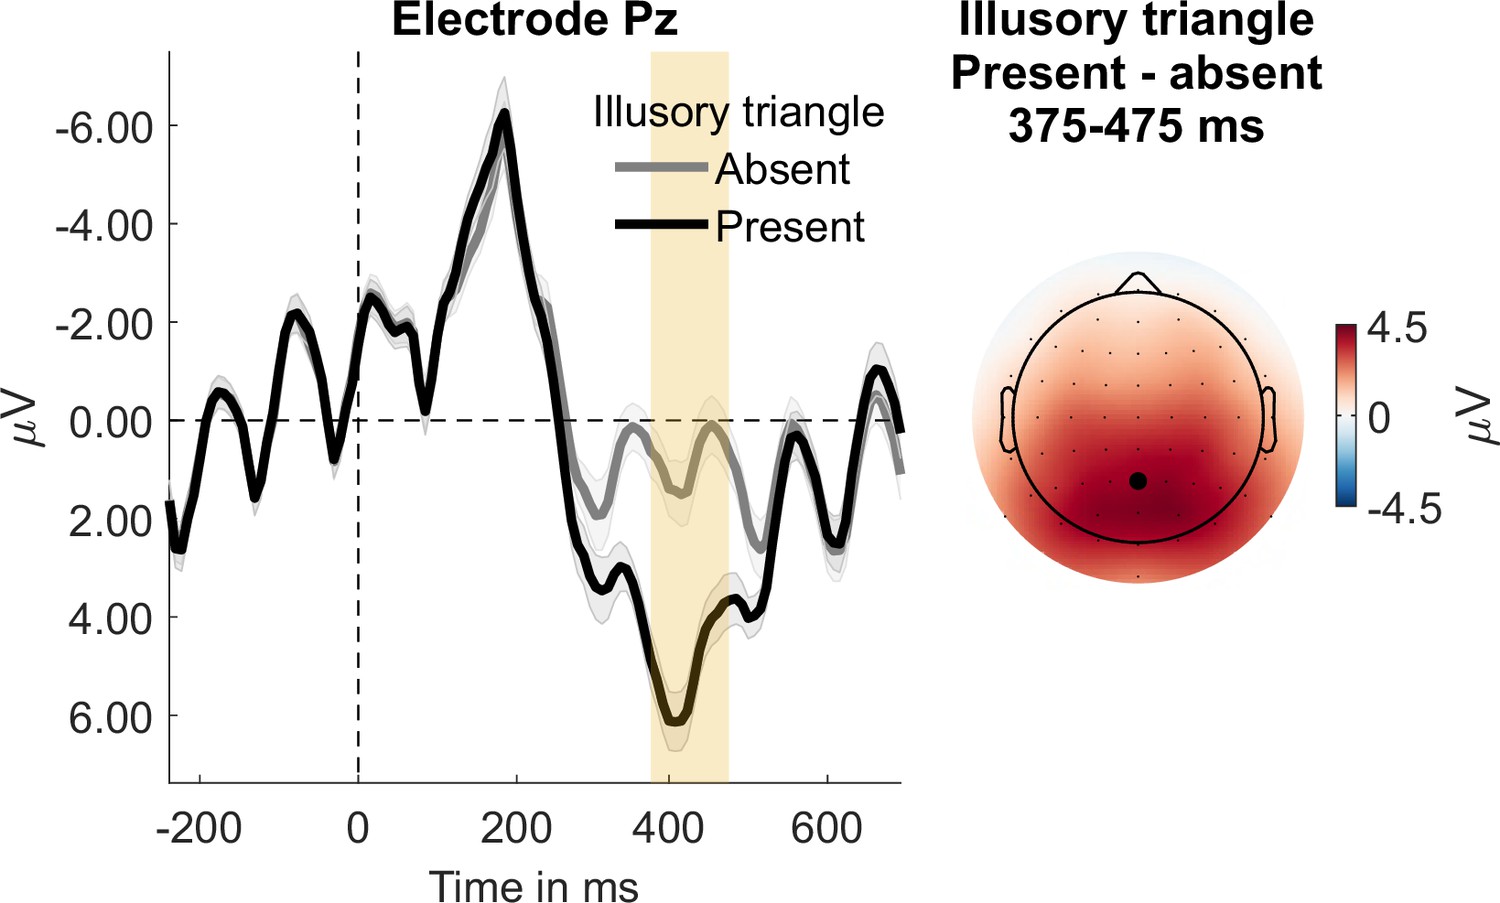
Event-related potential component P300 derived from the first targets.
Electrode Pz mean waveforms ± standard error of the mean (n = 30) and a topographical voltage distribution are plotted.
Figure 3 with 3 supplements
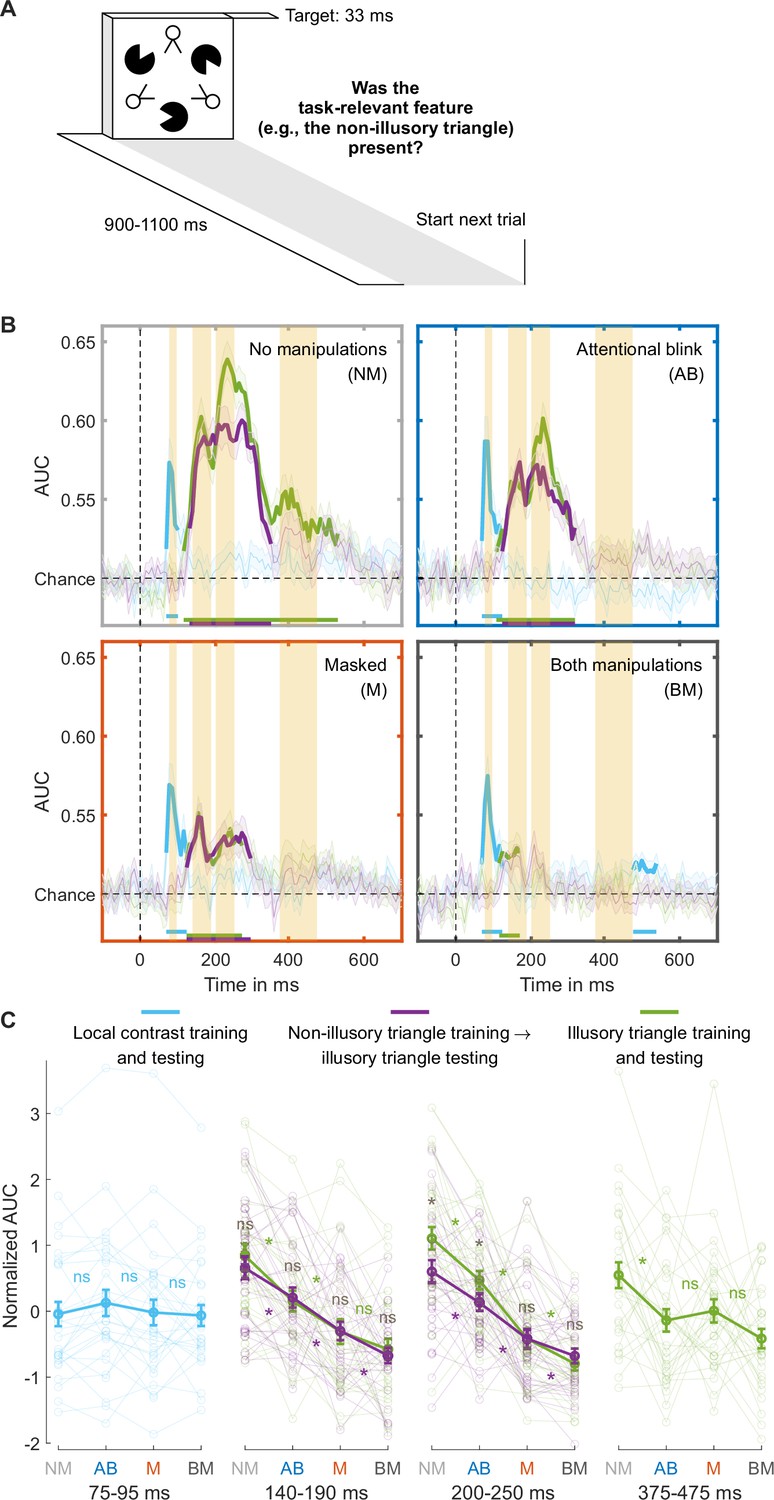
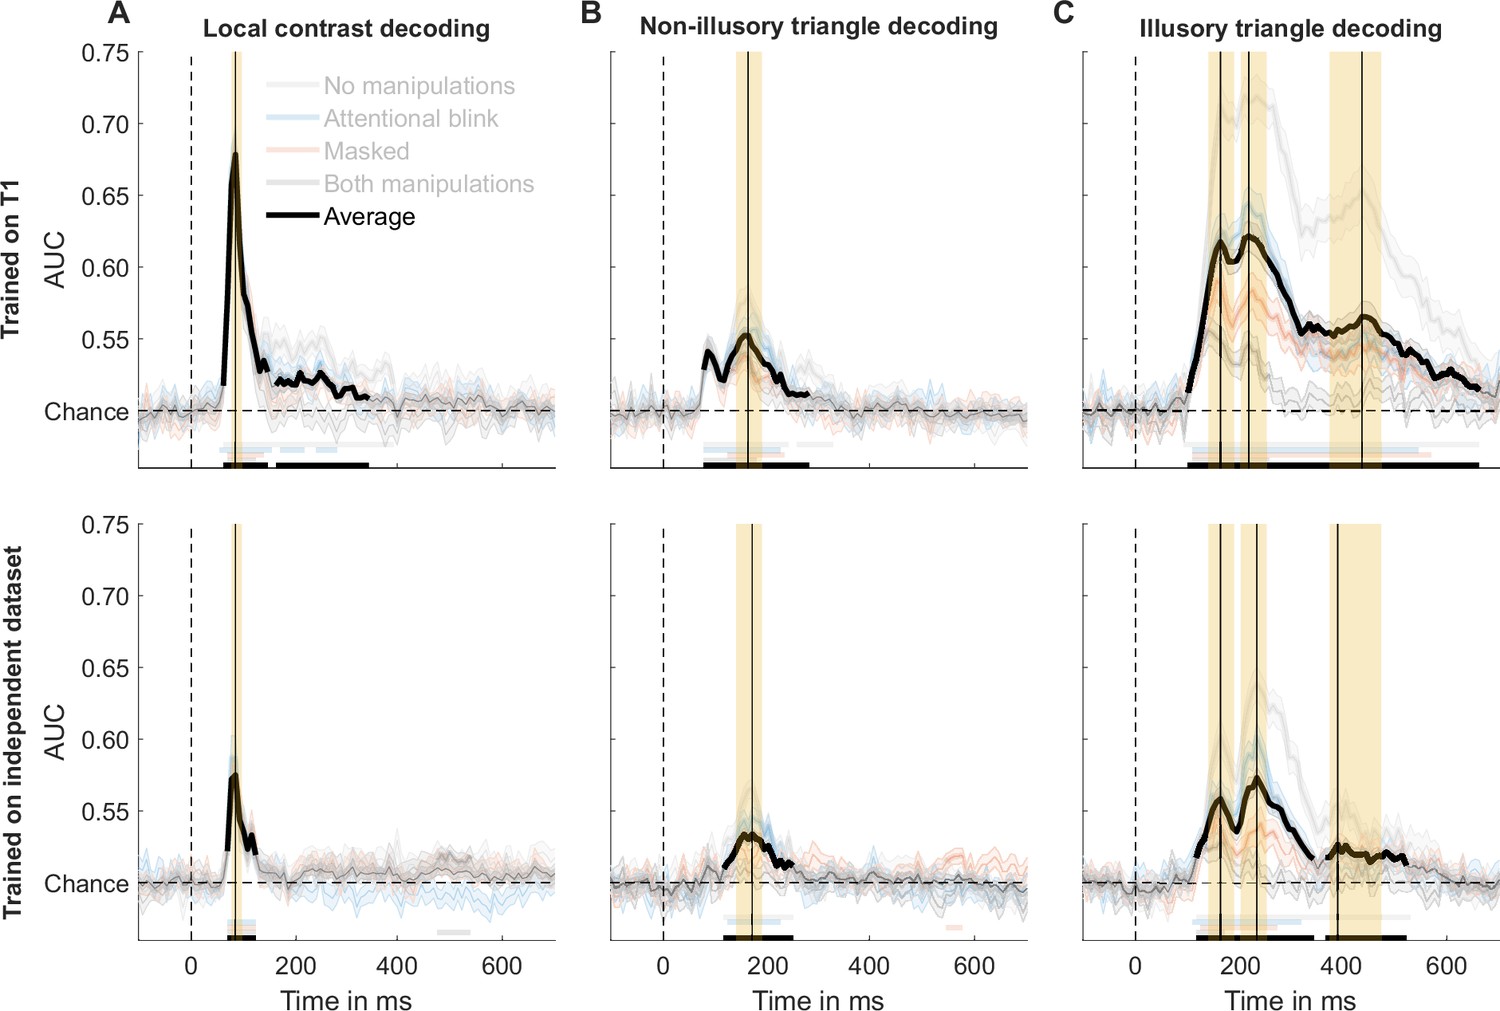
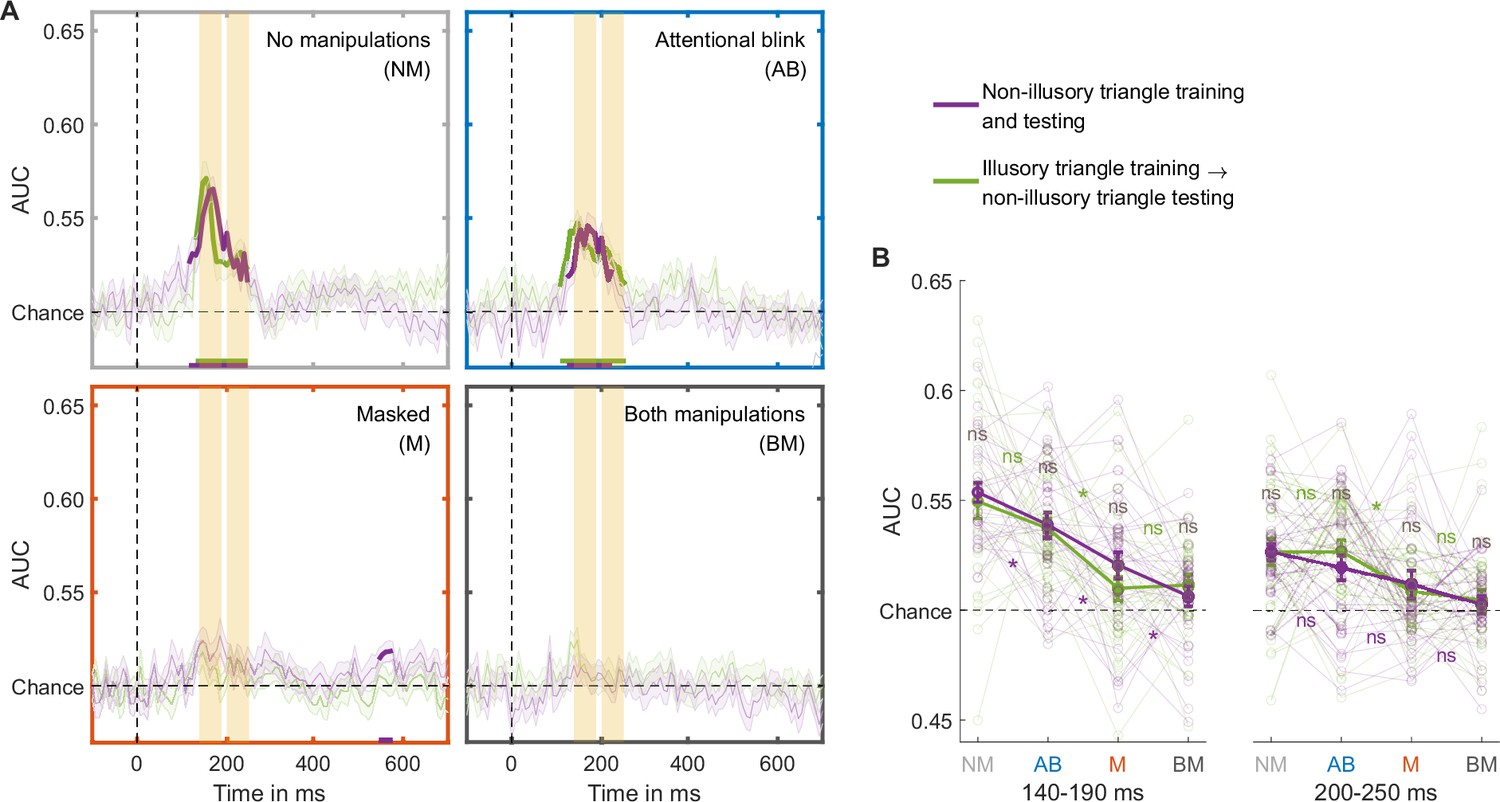
Separating collinearity and illusion-specific processes using the independent training dataset.
(A) Trial design used for obtaining the independent training dataset. (B) Illusory triangle decoding, after training classifiers on the independent training set on either the non-illusory (collinearity-only, purple lines) or illusory triangle (collinearity-plus-illusion, green lines). For comparison, training and testing on local contrast is shown in light blue. Mean decoding performance, area under the receiver operating characteristic curve (area under the curve, AUC), over time ± standard error of the mean (SEM) is shown (n = 30). Thick lines differ from chance: p<0.05, cluster-based permutation test. The highlighted time windows are 75–95, 140–190, 200–250, and 375–475 ms, corresponding to separate panels in (C), which shows normalized (Z-scored) mean AUC for every time window. Each window is Z-scored separately. Error bars are mean ± SEM. Individual data points are plotted using low contrast. Ns is not significant (p≥0.084, BF01 ≥1.26). *p≤0.048.
Figure 3—figure supplement 1

Local contrast decoding for each task-relevance condition from the independent training data and from another study.
Mean decoding performance, area under the receiver operating characteristic curve (area under the curve, AUC), for the 75–95 ms time window. Training and testing were done with the same dataset using a 10-fold cross-validation scheme. Error bars are mean ± standard error of the mean. Individual data points are plotted using low contrast. (A) Current study’s independent training data (B) Independent study’s data.
Figure 3—figure supplement 2
Local contrast and illusory triangle decoding using the independent training data.
(A) Local contrast decoding. (B) Illusory Kanizsa triangle decoding. For both features, covariance/class separability maps reflecting underlying neural sources are shown. Below these maps: mean decoding performance, area under the receiver operating characteristic curve (area under the curve, AUC), over time ± standard error of the mean (SEM; n = 30). Thick lines differ from chance: p<0.05, cluster-based permutation test. (C) Normalized (Z-scored) AUC for every measure: mean decoding time windows and two types of behavior. Each measure is Z-scored separately. Perceptual performance refers to participants’ ability to detect the Kanizsa illusion. Metacognition refers to participants’ ability to evaluate their own performance using confidence judgments. Error bars are mean ± SEM. Individual data points are plotted using low contrast. Ns is not significant (p≥0.084, BF01 ≥1.26). *p≤0.004.
Figure 3—figure supplement 3
Control analyses for training on the non-illusory triangle using the independent training set and testing on the non-illusory triangle from the experimental session.
(A) Mean decoding performance, area under the receiver operating characteristic curve (area under the curve, AUC), over time ± standard error of the mean (SEM; n = 30). The time windows are 75–95 and 140–190 ms. Thick lines differ from chance: p<0.05, cluster-based permutation test. (B) Mean AUC for both time windows. Error bars are mean ± SEM. Individual data points are plotted using low contrast. Ns is not significant (p≥0.062, BF01 ≥0.99). *p≤0.040.
Additional files
Download links
A two-part list of links to download the article, or parts of the article, in various formats.
Downloads (link to download the article as PDF)
Open citations (links to open the citations from this article in various online reference manager services)
Cite this article (links to download the citations from this article in formats compatible with various reference manager tools)
Perceptual and attentional impairments of conscious access involve distinct neural mechanisms despite equal task performance
eLife 13:RP97900.
https://doi.org/10.7554/eLife.97900.3


