Serum metabolome indicators of early childhood development in the Brazilian National Survey on Child Nutrition (ENANI-2019)
- Department of Social and Applied Nutrition, Federal University of Rio de Janeiro, Josué de Castro Nutrition Institute, Brazil
- Department of Social Nutrition, Institute of Nutrition, State University of Rio de Janeiro, Brazil
- Department of Nutrition and Dietetics, Federal University of Rio de Janeiro, Josué de Castro Nutrition Institute, Brazil
- Department of Chemistry and Chemical Biology, McMaster University, Canada
Figures
Figure 1
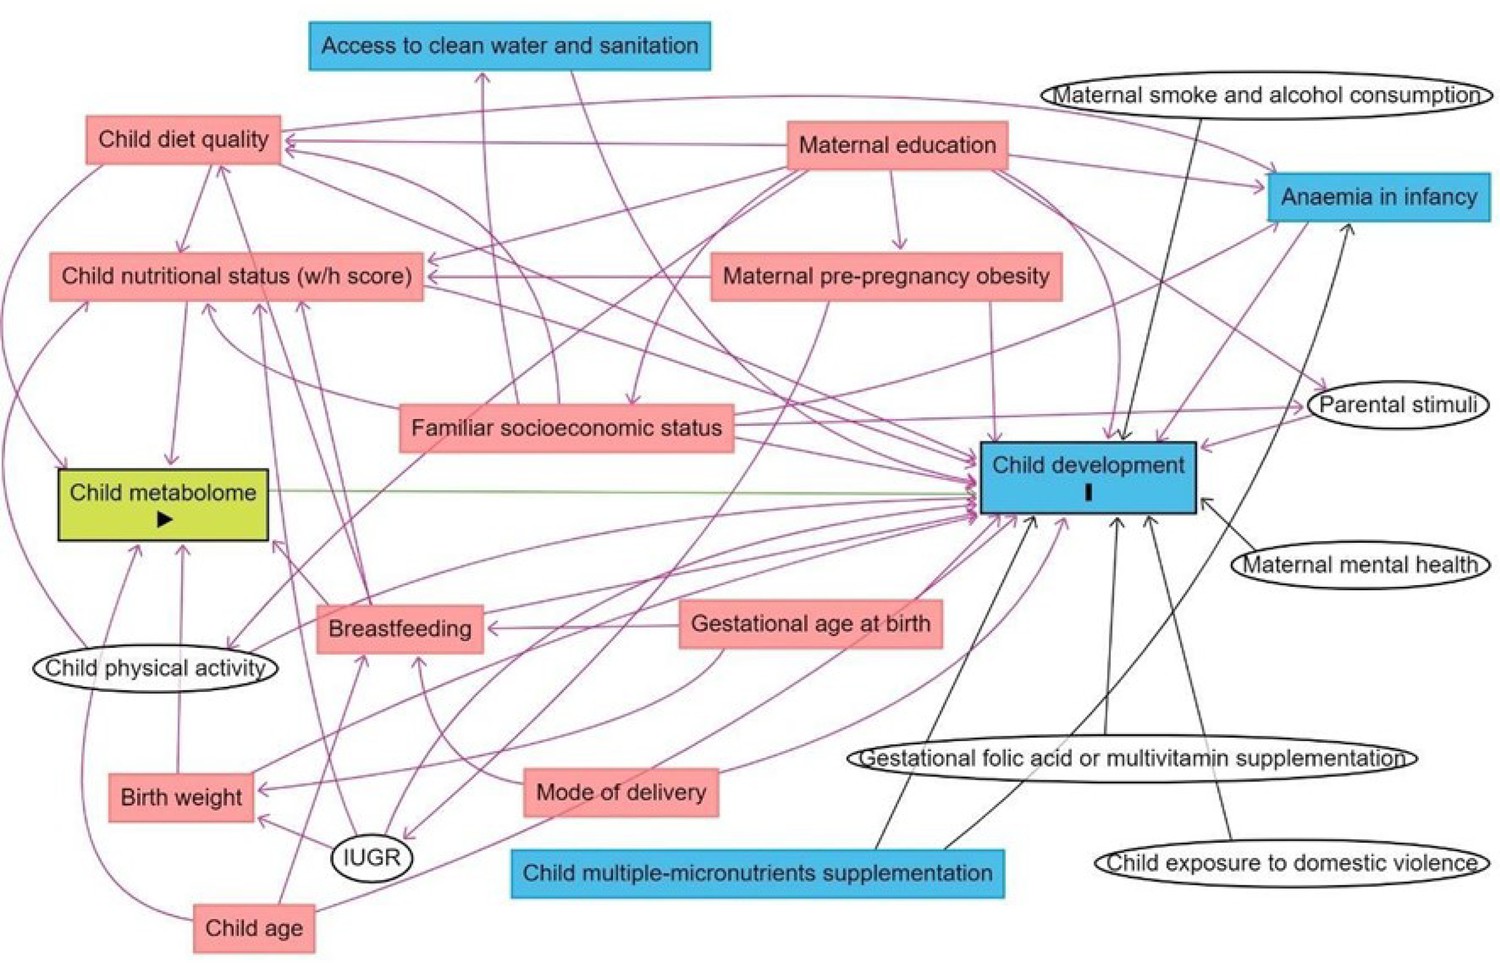
Directed acyclic graph (DAG) of the association between child serum metabolome and early childhood development.
Note: IUGR: intrauterine growth restriction. Breastfeeding refers to breastfeeding practice exclusively until 6 months and/or complemented until 2 years. Minimum adjustments suggested by the DAG: Birth weight, breastfeeding, child age, child diet quality, child nutritional status (w/h z-score). Blue rectangles: ancestor of the outcome; pink rectangles: ancestor of exposure and outcome; white circles: non observed variables in the ENANI-2019.
Figure 2

Flow chart of children included in the serum metabolome analysis of ENANI-2019 (the Brazilian National Survey on Child Nutrition).
Note: COVID-19, coronavirus disease 2019.
Figure 3 with 5 supplements
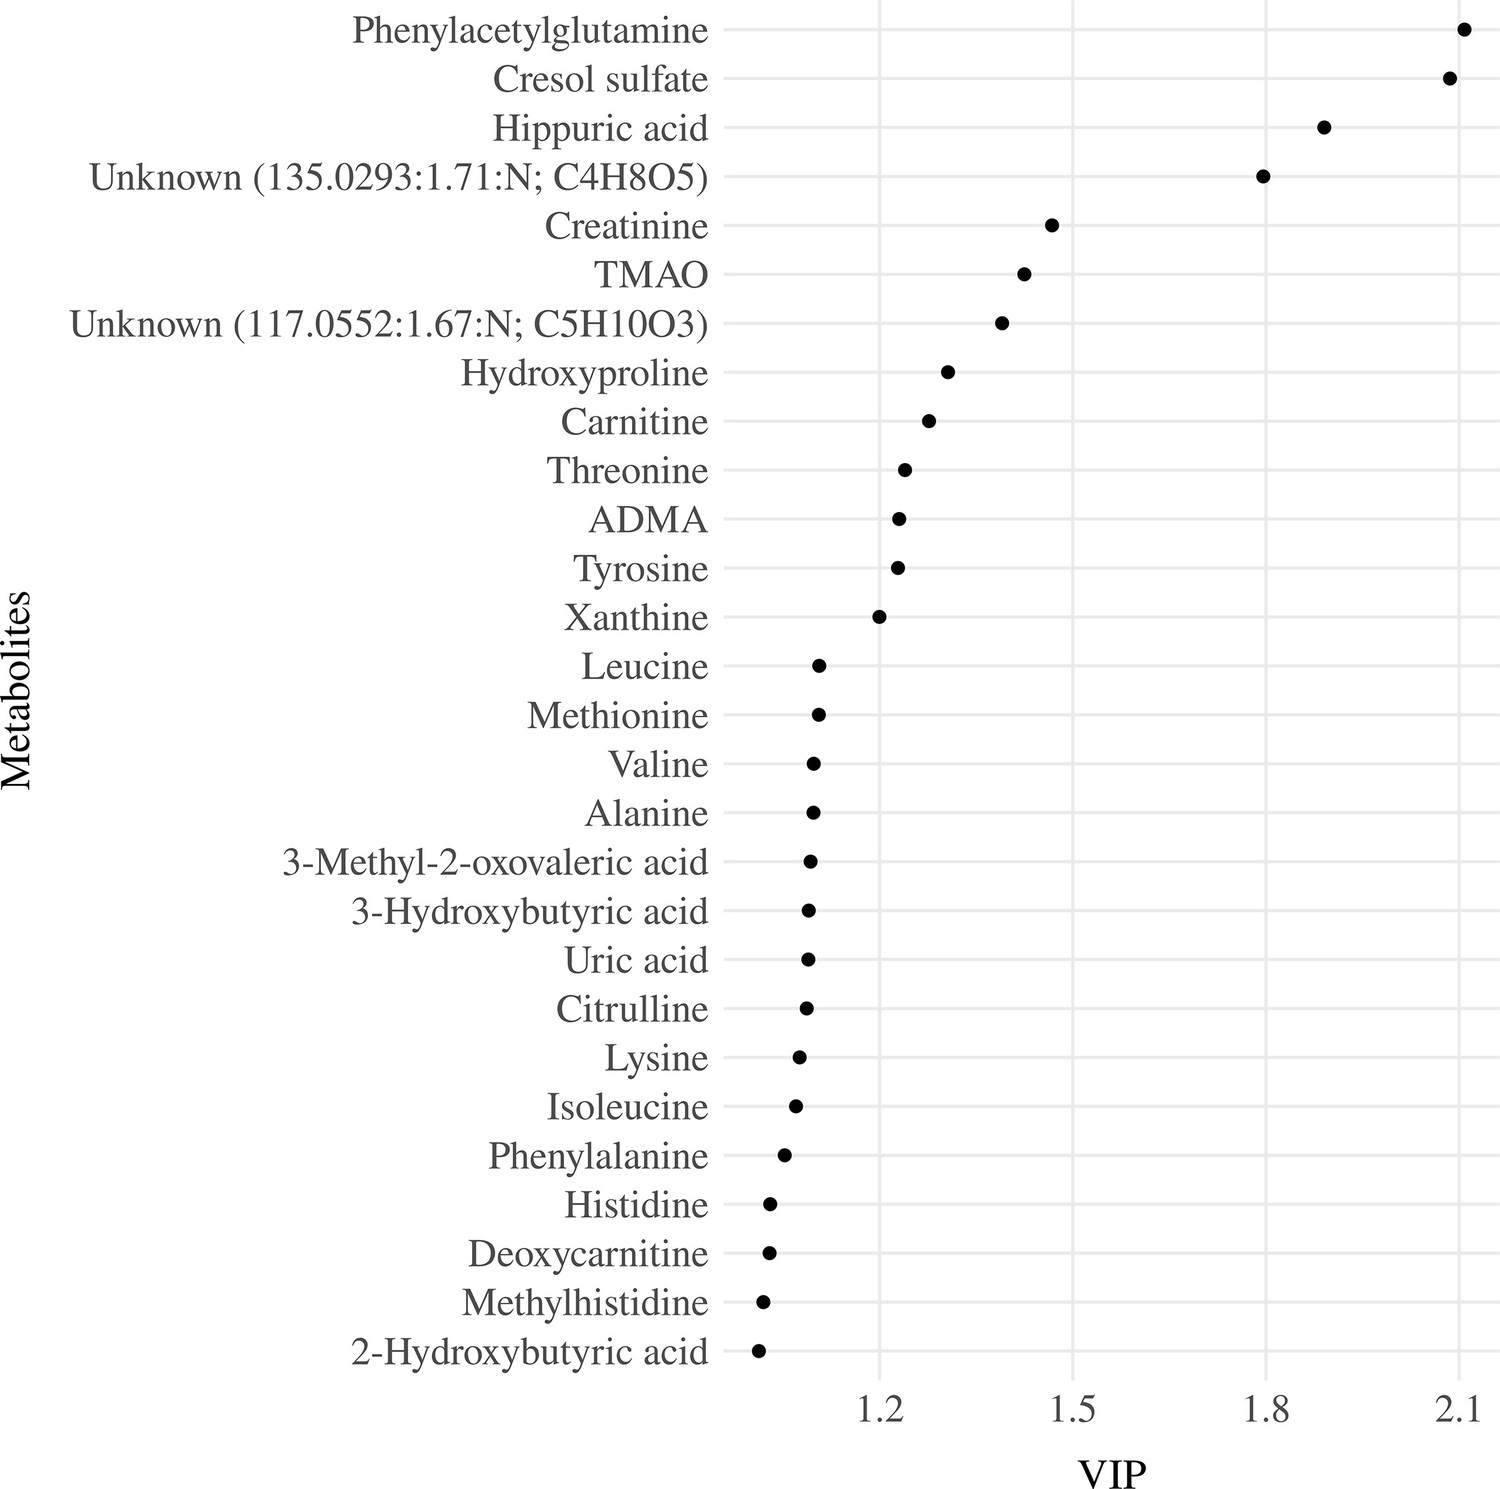
Variable importance projection (VIP) ranking scores from Partial Least Squares Regression (PLSR) analysis were performed to select the most relevant metabolites that explain the developmental quotient variability.
Note: Serum metabolites with higher VIP scores are the most contributory variables, whereas smaller VIP scores provide less contribution to explain the developmental quotient variability. Only metabolites with VIP scores higher than one are displayed.
Figure 3—figure supplement 1
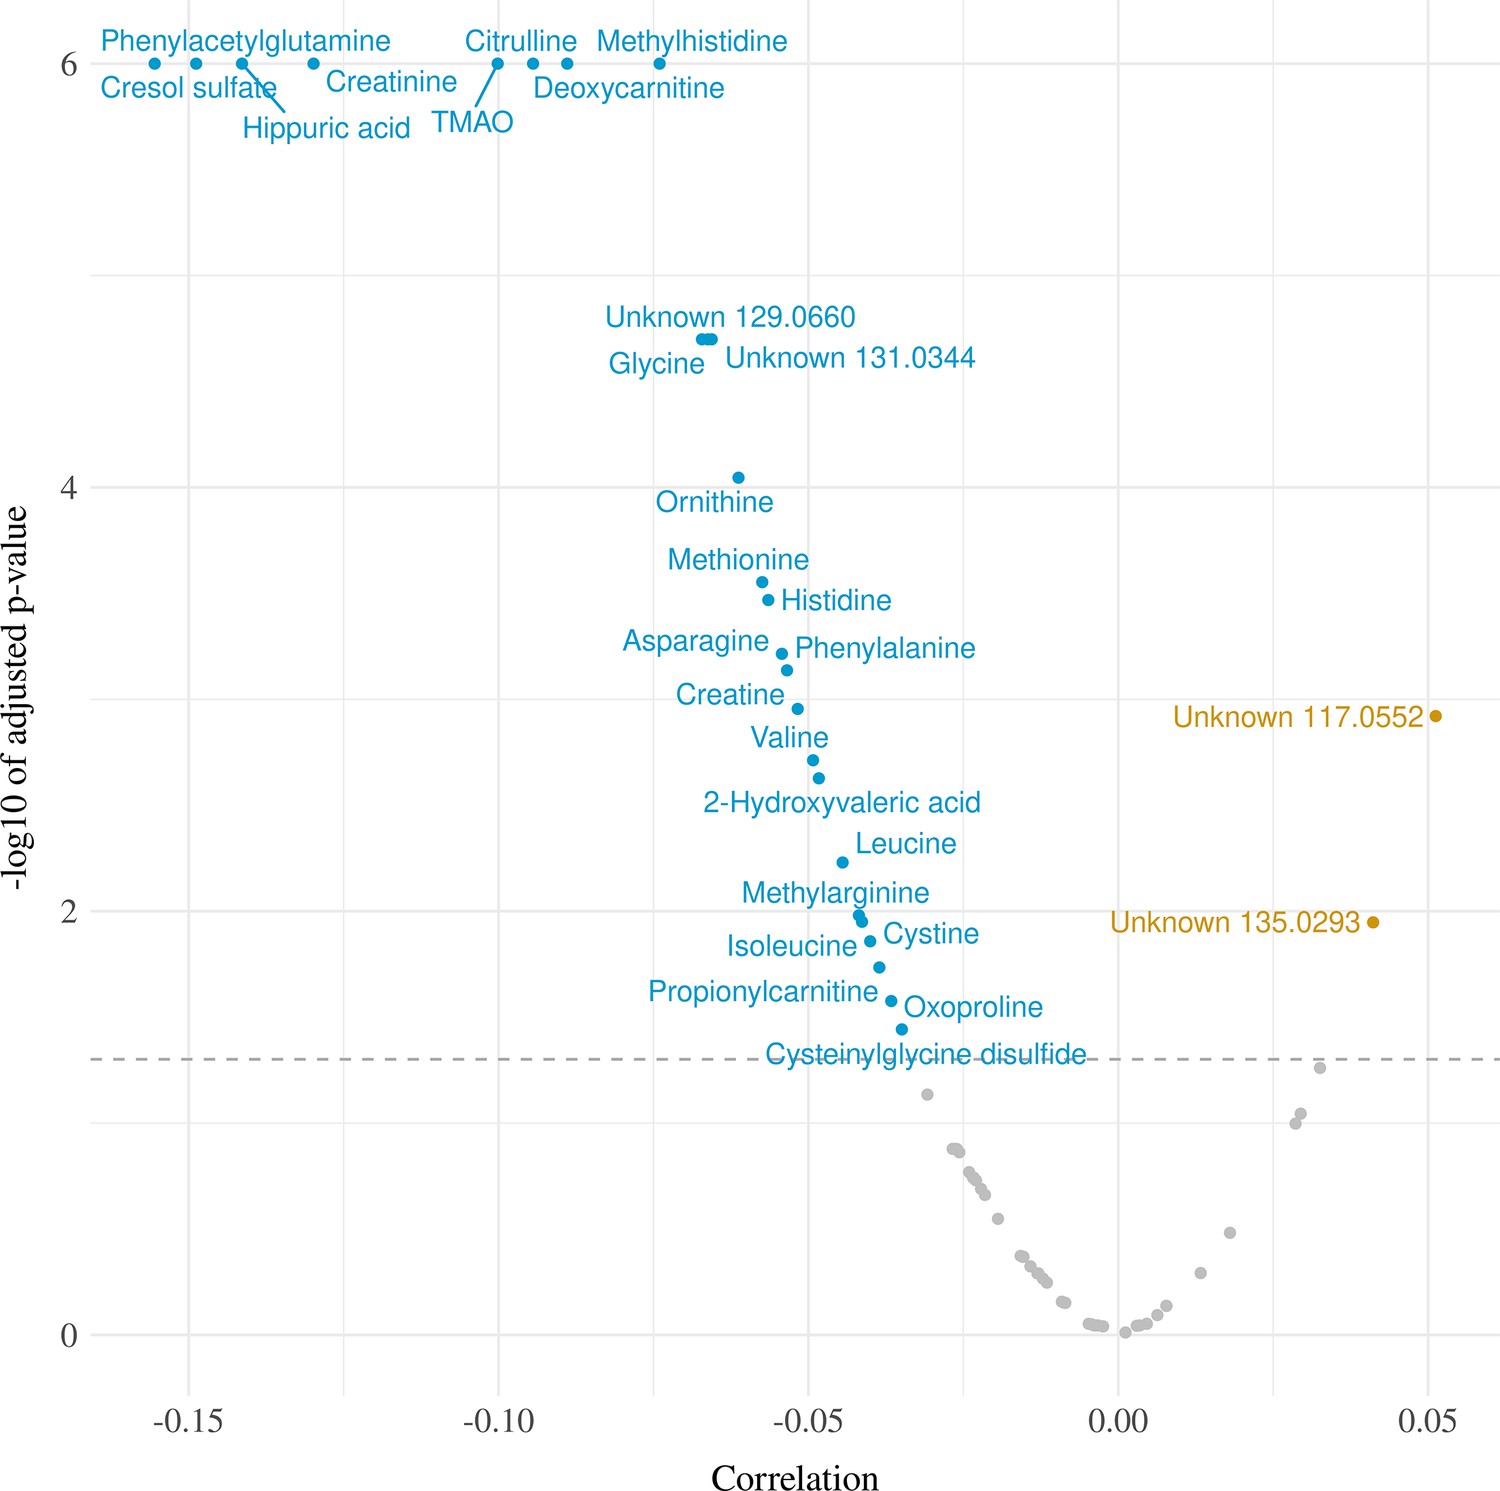
Volcano plot for Pearson correlations between serum metabolome and developmental quotients of children 6-59 months evaluated in ENANI-2019 (the Brazilian National Survey on Child Nutrition; n = 5004).
Note: The Y-axis and X-axis represent the negative logarithm (base-10) of adjusted p-values of each correlation coefficient and the correlation coefficient, respectively. Dashed line is the Benjamini-Hochberg adjusted-p-value for 72 metabolites comparisons. Statistically significant serum metabolites are labeled on plots.
Figure 3—figure supplement 2
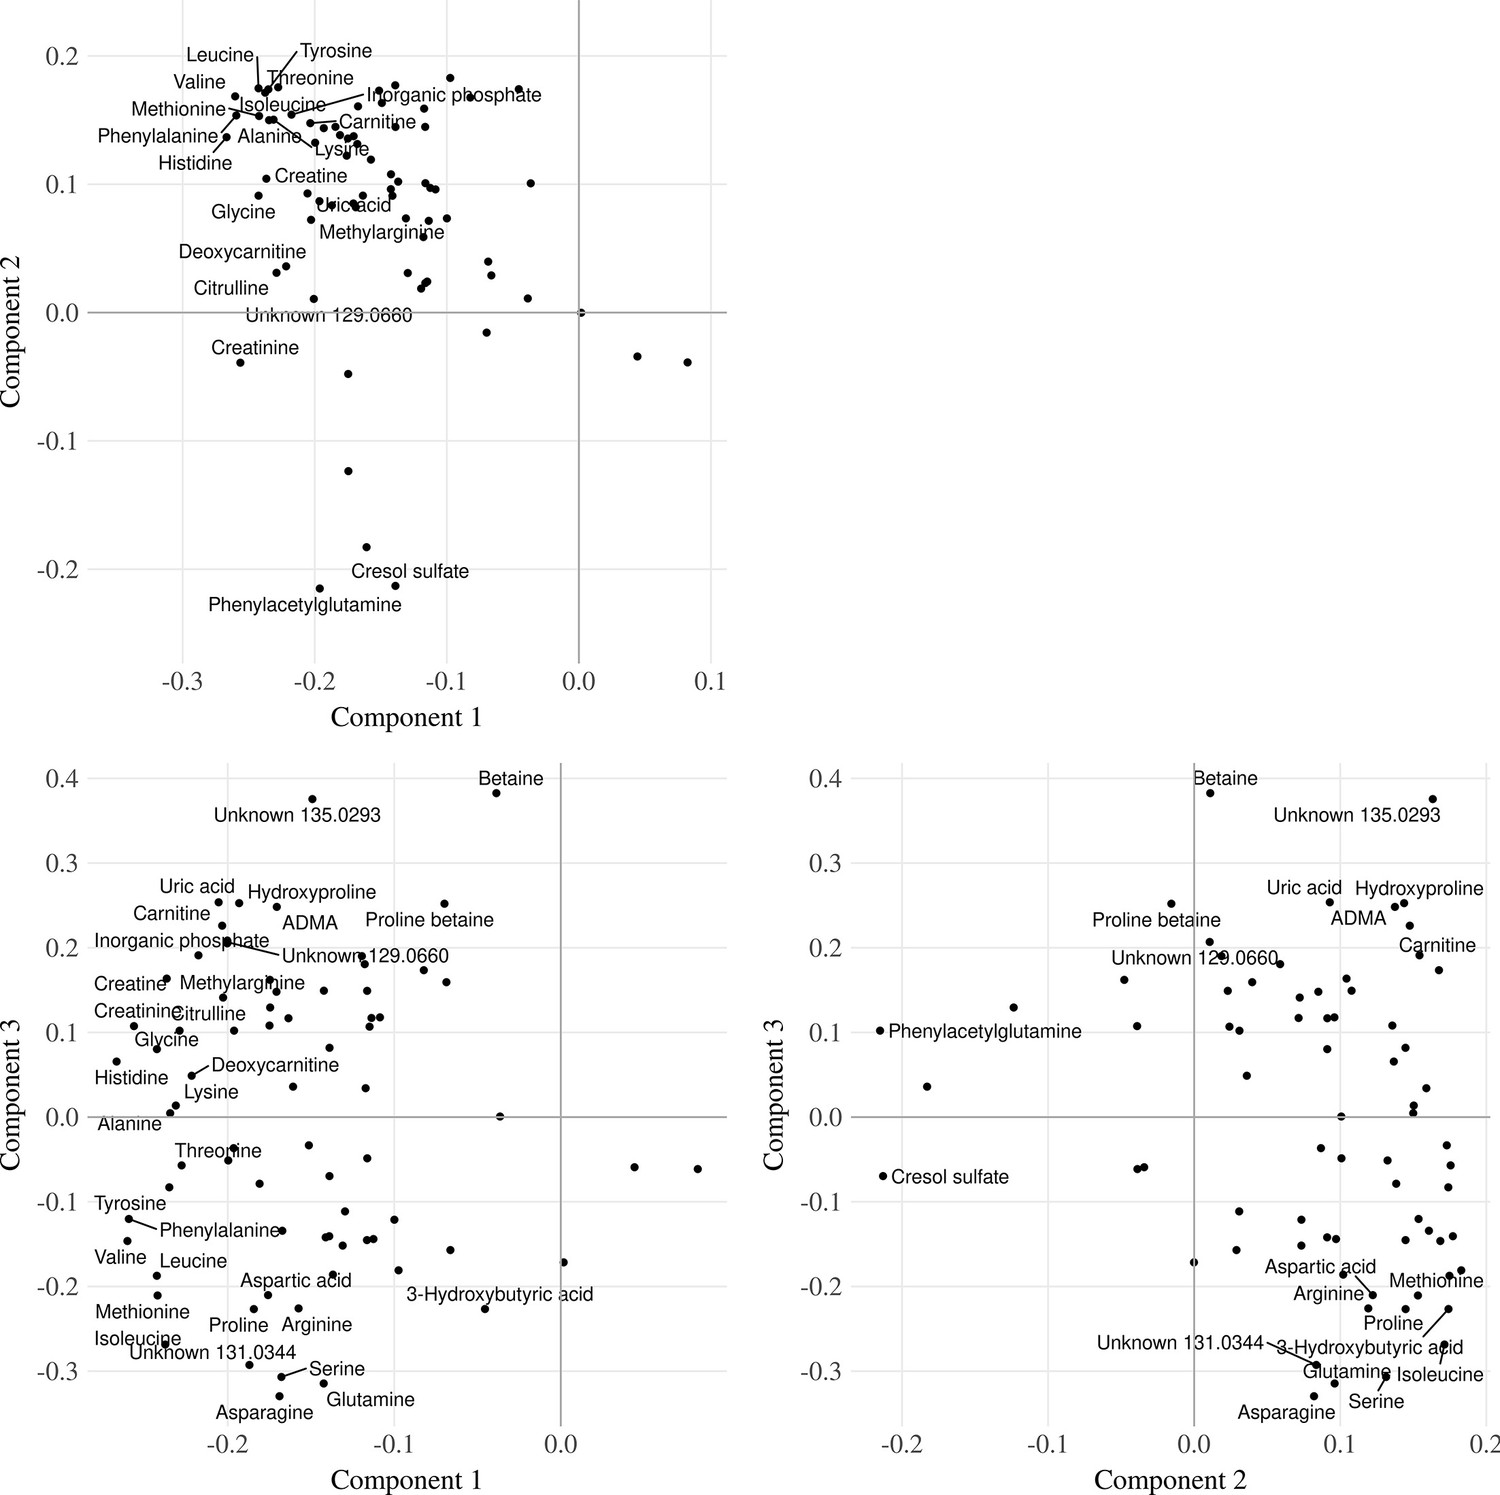
Partial Least Square Regression (PLSR) loading plots for components 1, 2, and 3.
Note: Labeled points are serum metabolites with loading greater than 0.2 or lower than -0.2 on any of the components in the plot.
Figure 3—figure supplement 3
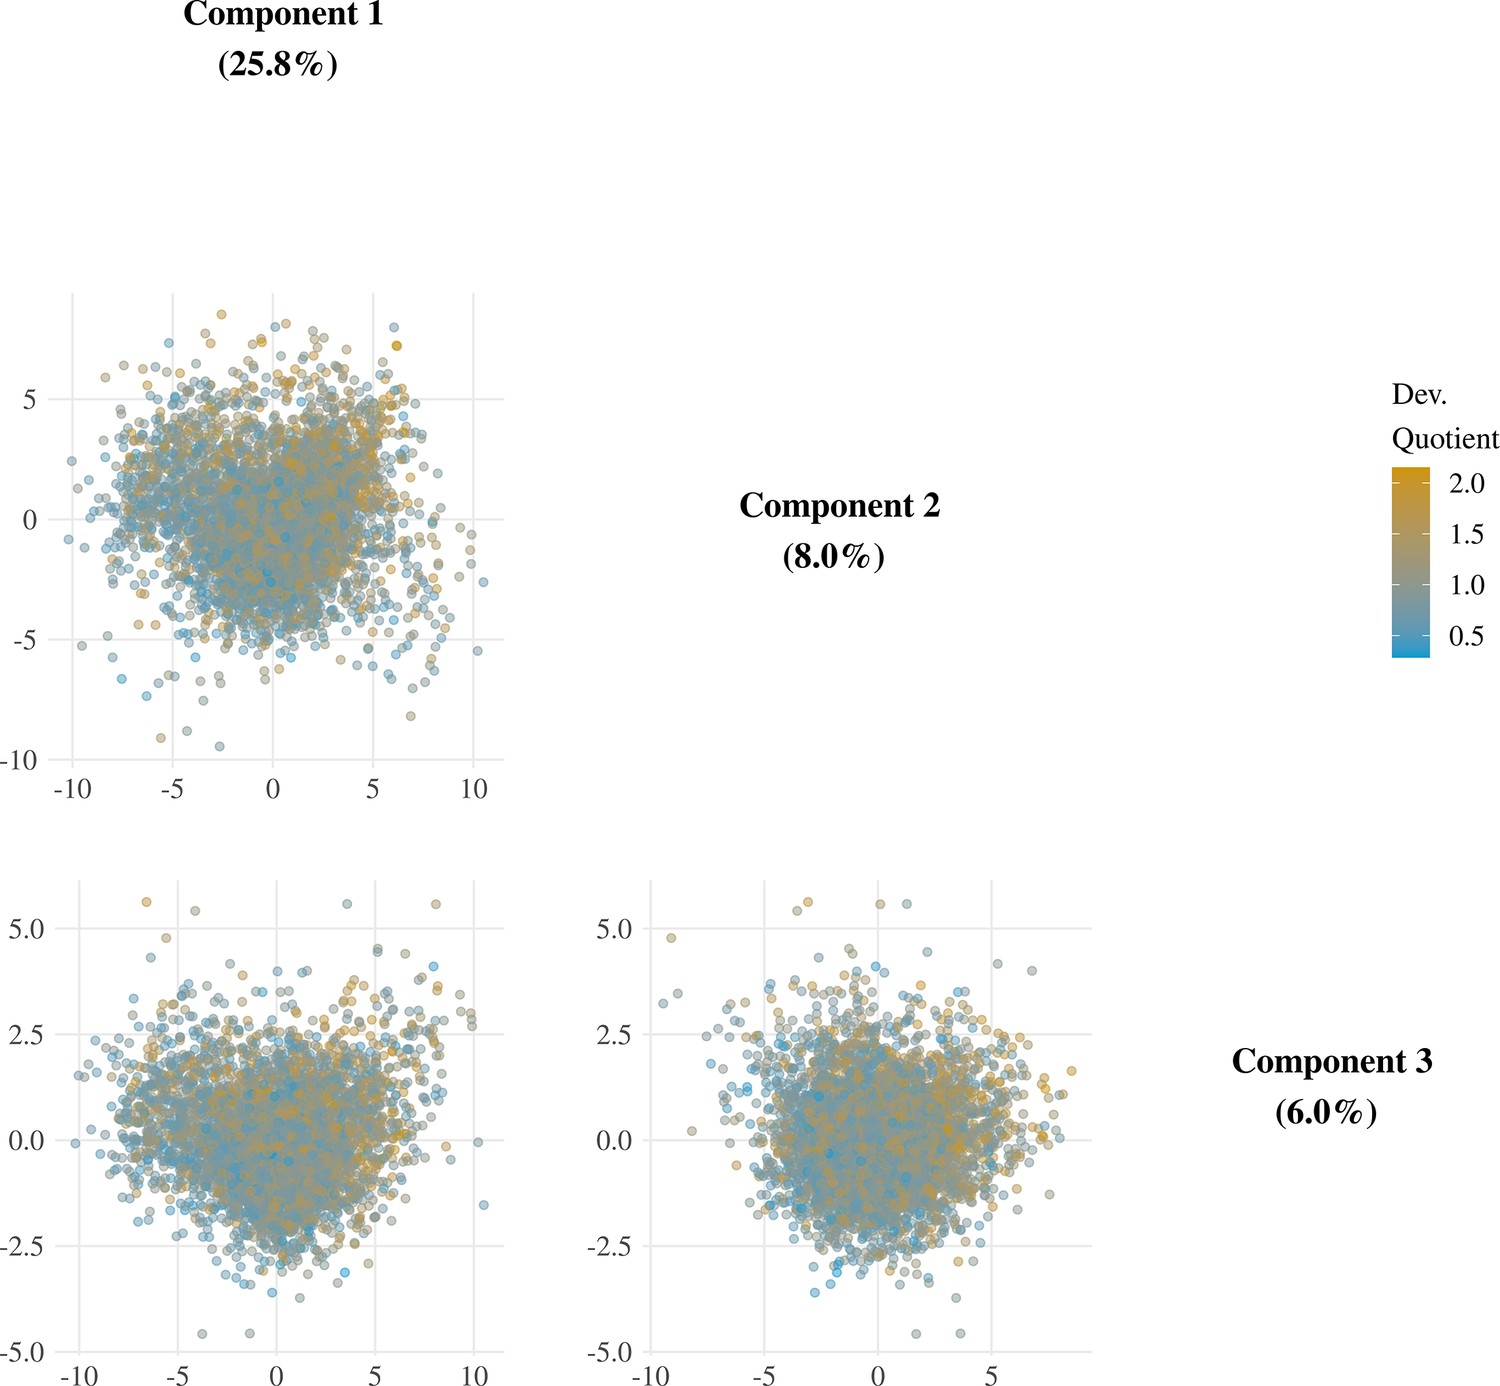
Partial Least Square Regression (PLSR) score scatterplots for components 1, 2, and 3.
Note: Percentages in parentheses indicate the total serum metabolite variance explained by each component. Dots were colored according to the developmental quotient. The child development was based on the Survey of Well-being of Young Children – the Brazilian version of the milestones questionnaire which estimates the child’s developmental age considering developmental milestones achieved. The developmental quotient (DQ) was calculated as the child’s developmental age divided by the chronological age (Sheldrick & Perrin, 2013). DQ = 1 indicates that expected age milestones have been attained; DQ <1 and > 1 suggest that the attainment of specific age milestones occurred below or above expectations, respectively.
Figure 3—figure supplement 4
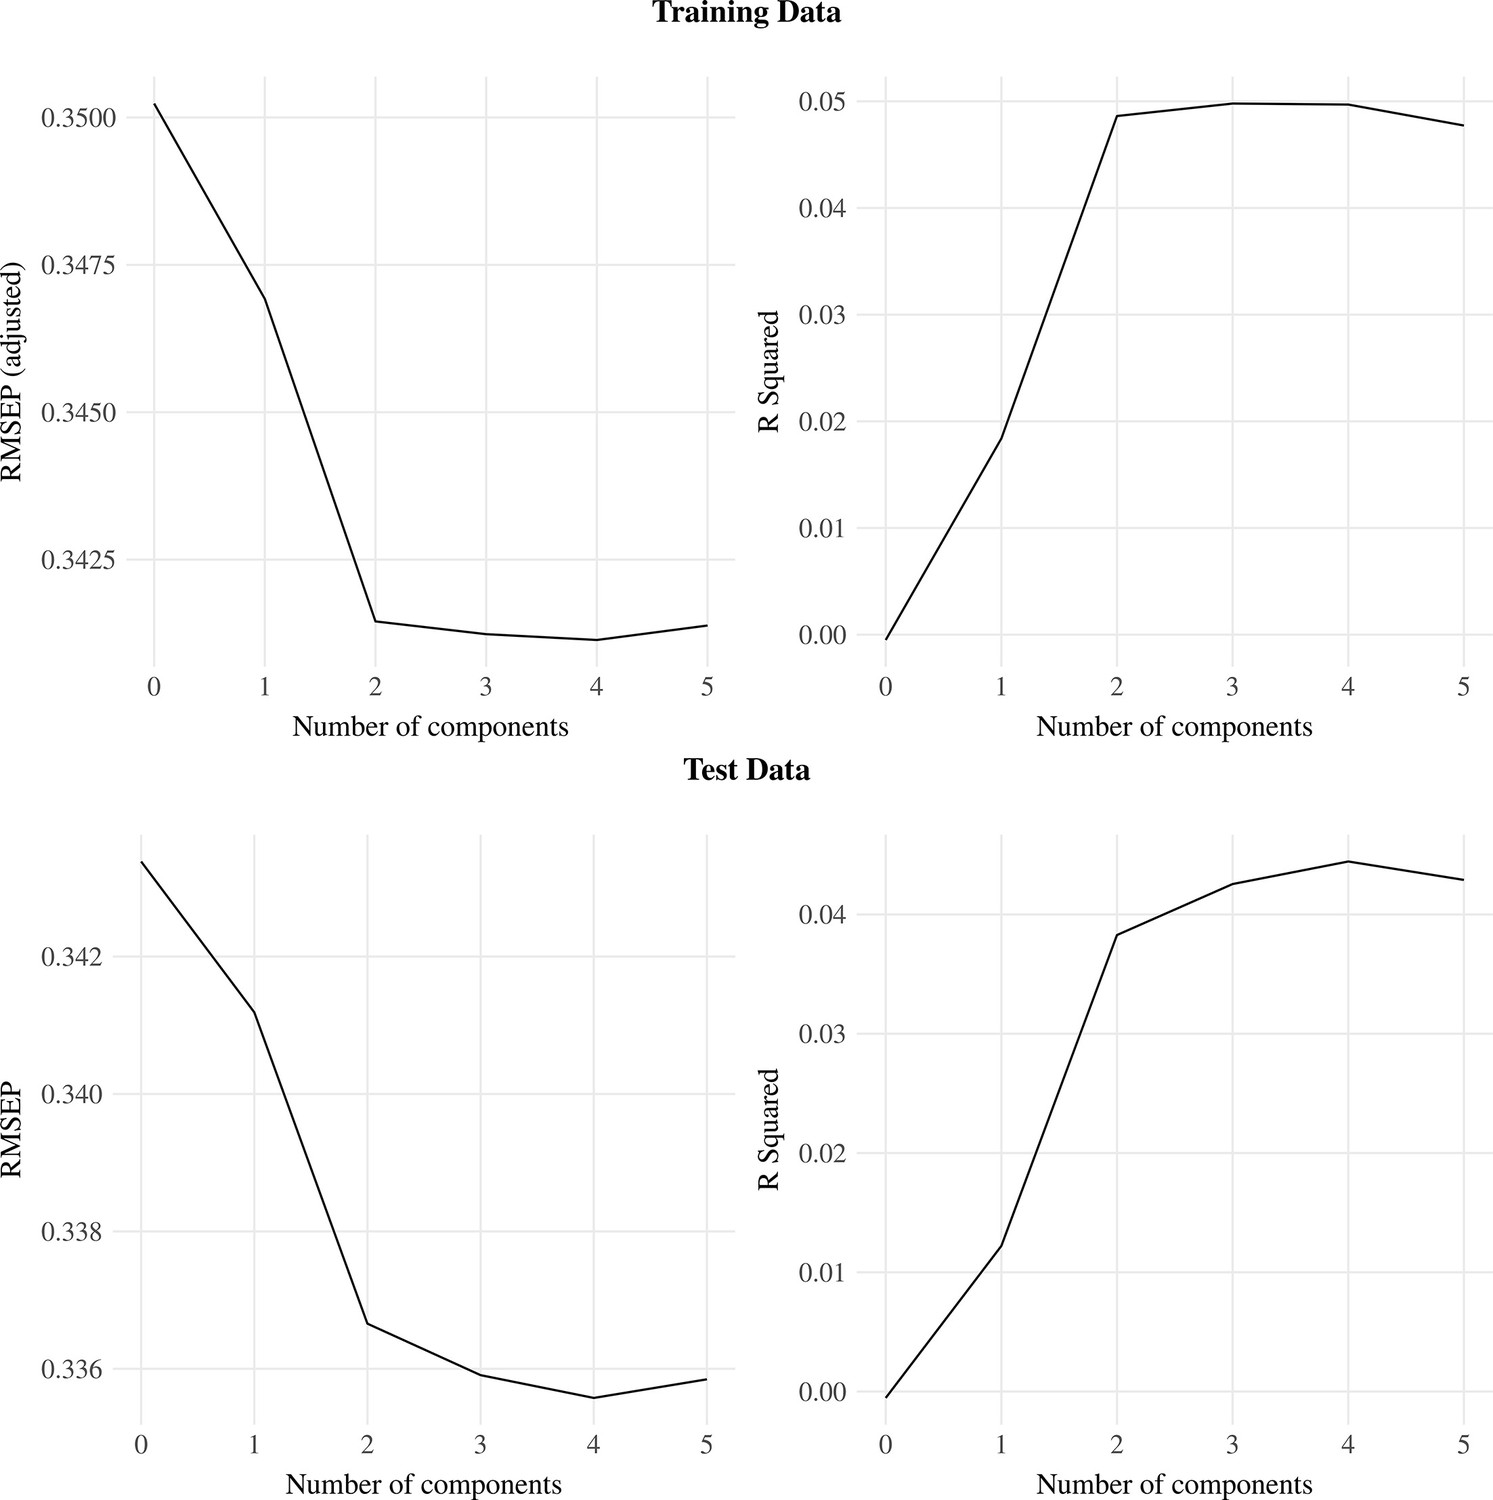
Residual means squared error (RMSEP) and R squared across Partial Least Square Regression (PLSR) models with different numbers of components.
Note: Training and test datasets were done with 80% (n = 4003) and 20% (n = 1001) of observations, respectively.
Figure 3—figure supplement 5
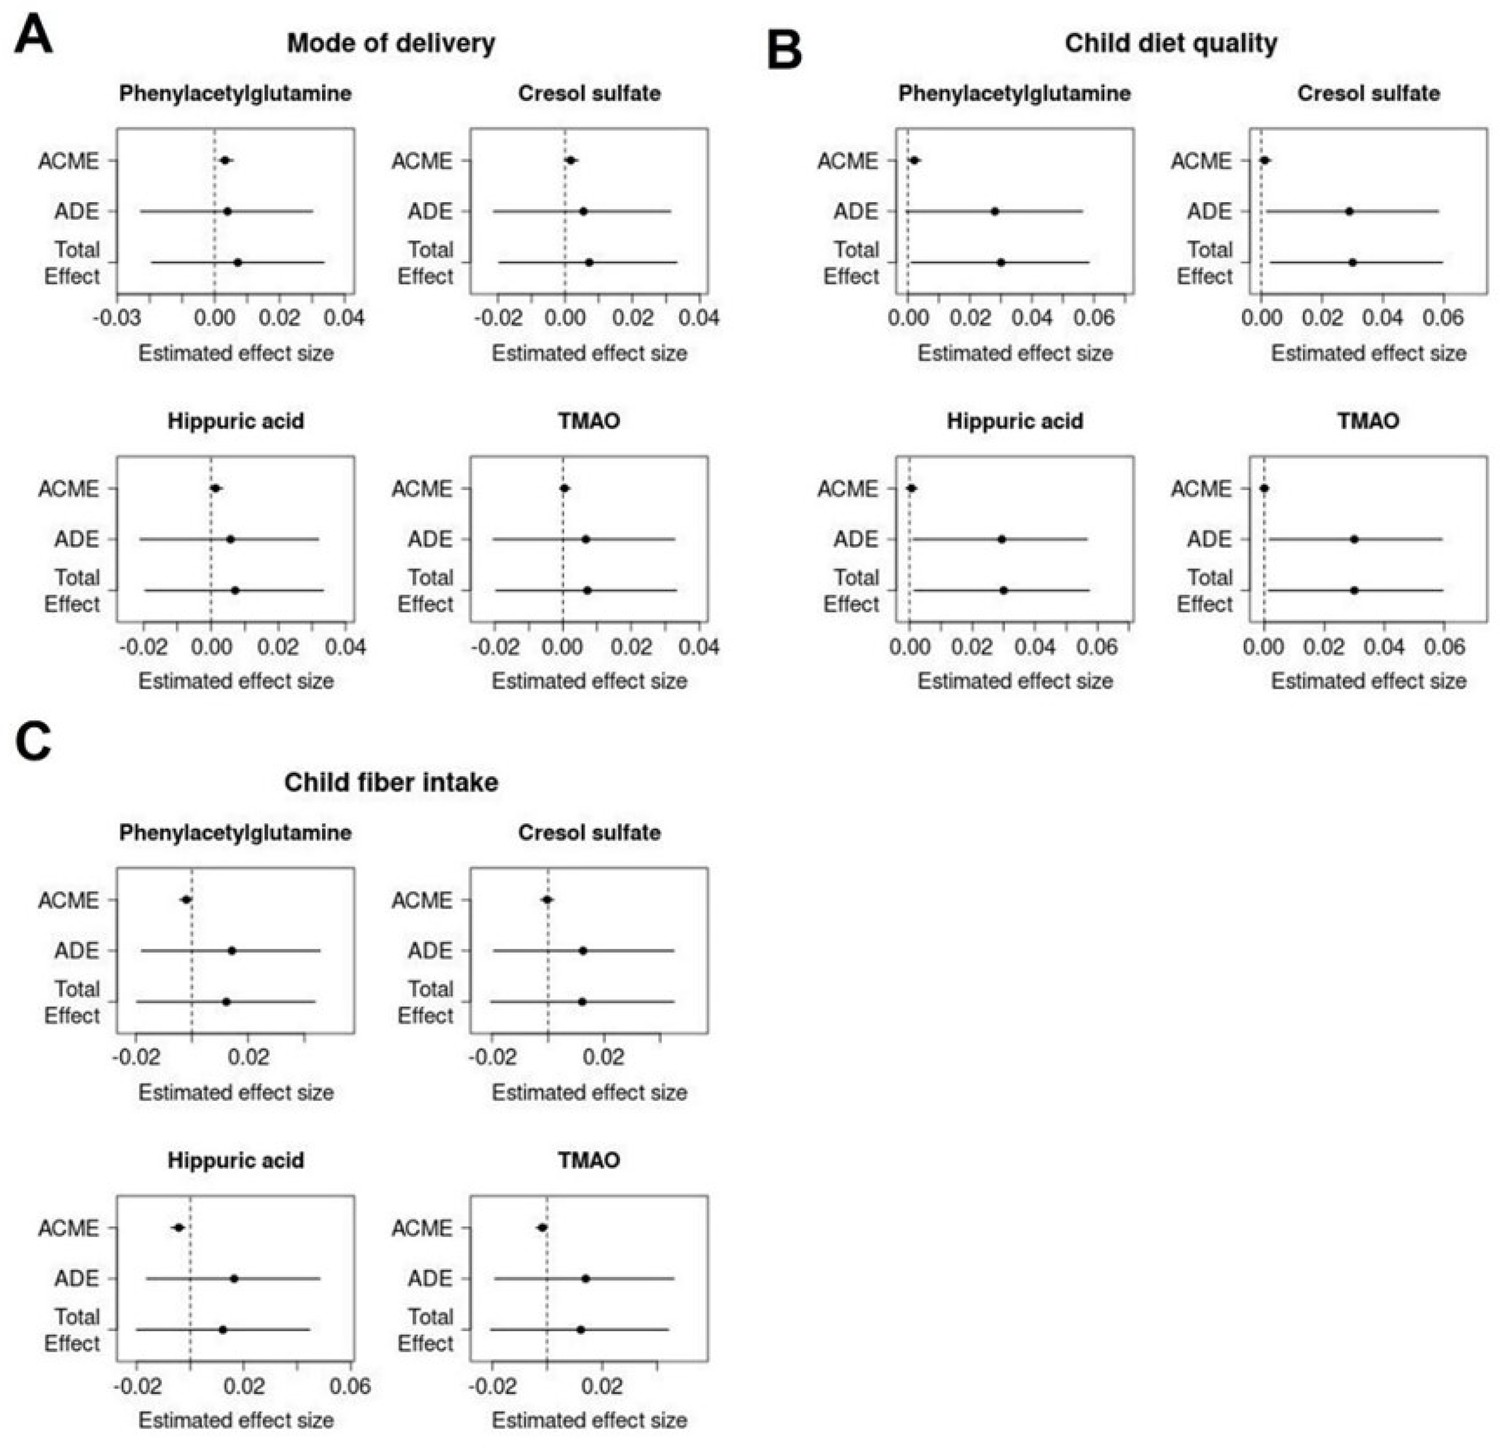
Metabolite-mediated effects of mode of delivery, child's diet quality, and fiber Intake on child developmental quotient.
Effect decomposition plots for mediation analysis of mode of delivery (A), child’s diet quality (B), and child fiber intake (C) on child’s developmental quotient considering metabolites as mediators. Notes: Dots and lines represent the point estimated and 95% confidence interval based upon the quantiles of bootstrapped distribution. Lines that are across the vertical dashed indicate the absence of statistical significance. ACME = Average causal mediation effect; ADE = Average direct effect; Total effect = the total effect. Only metabolites that showed statistically significant association with a child's developmental quotient were tested in the mediation models. The linear regression models were adjusted for child nutritional status (w/h z-score) and child age (in months). Data were auto-scaled before running the models. The mode of delivery was evaluated as vaginal or c-section; child’s diet quality as ≥ 5 or < 5 food groups (minimum dietary diversity), and child fiber intake was given in grams.
Figure 4

Association between serum metabolites with child age interaction and developmental quotient of children from 6 to 59 months from ENANI-2019 (the Brazilian National Survey on Child Nutrition, 2019) (n=5004).
Note: SD: standard deviation; TMAO: Trimethylamine N-oxide. Only statistically significant interactions at an adjusted p-value for multiple comparisons <0.05 were decomposed into their simple slopes. ** refers to simple slopes with p-value <0.001; * refers to simple slopes with p-value <0.05; ‘NS’ refers to ‘not statistically significant’. Regression adjustments used in the models: child diet quality, child age (months), and child nutritional status (w/h score). Mean of children age = 34 months and standard deviation = 15 months. The child development was based on the Survey of Well-being of Young Children - the Brazilian version of milestones questionnaire, which estimates the child’s developmental age considering developmental milestones achieved. The developmental quotient (DQ) was calculated as the child’s developmental age divided by the chronological age (Sheldrick and Perrin, 2013). All variables’ data were auto-scaled, before running the regression models. Figure 3—figure supplement 1. Volcano plot for Pearson correlations between serum metabolome and developmental quotients of children 6-59 months evaluated in ENANI-2019 (the Brazilian National Survey on Child Nutrition; n = 5004). Note: The Y-axis and X-axis represent the negative logarithm (base-10) of adjusted p-values of each correlation coefficient and the correlation coefficient, respectively. Dashed line is the Benjamini-Hochberg adjusted-p-value for 72 metabolites comparisons. Statistically significant serum metabolites are labeled on plots.
Tables
Table 1
Characteristics of children 6–59 months evaluated in a subset sample of ENANI-2019 (the Brazilian National Survey on Child Nutrition) (n=5004).
| Variables | Mean or Frequency (%) | 95% CI |
|---|---|---|
| Region | ||
| North | 24.8 | 23.6; 26.0 |
| Midwest | 20.5 | 19.4; 21.7 |
| Southeast | 18.6 | 17.5; 19.7 |
| Northeast | 22.6 | 21.5; 23.8 |
| South | 13.5 | 12.6; 14.5 |
| Age (months) | 34.0 | 33.6; 34.5 |
| Age groups (months) | ||
| 6–23 | 29.6 | 28.3; 30.8 |
| 24–35 | 21.5 | 20.4; 22.7 |
| 36–59 | 48.9 | 47.5; 50.3 |
| Sex | ||
| Male | 51.1 | 49.7; 52.5 |
| Female | 48.9 | 47.5; 50.3 |
| Weight for length/height (z-score) | 0.3 | 0.29; 0.36 |
| Weight for length/height categories *,† | ||
| Underweight (z-score < –2) | 1.6 | 1.3; 2.0 |
| Normal (–2≤z-score≤1) | 73.3 | 72.1; 74.5 |
| Overweight risk (1<z-score≤2) | 17.3 | 16.3; 18.4 |
| Excessive weight (z-score >2) | 7.3 | 6.6; 8.0 |
| Mother/caregiver education (years) | ||
| 0–7 | 25.5 | 24.4; 26.8 |
| 8–10 | 23.5 | 22.3; 24.7 |
| ≥11 | 51.0 | 49.6; 52.4 |
| Mode of delivery | ||
| Vaginal | 53.7 | 52.3; 55.1 |
| Elective c-section | 19.0 | 18.0; 20.2 |
| Non-elective c-section | 27.3 | 26.1; 28.5 |
| Monthly family income (USD) ‡ | ||
| <62.20 | 3.8 | 3.3; 4.4 |
| 62.20–124.40 | 4.5 | 4.0; 5.1 |
| 124.50–248.70 | 19.2 | 18.2; 20.3 |
| >248.70 | 72.4 | 71.2; 73.7 |
| Minimum dietary diversity (MDD) § | ||
| ≥5 food groups | 59.3 | 39.4; 42.1 |
| <5 food groups | 40.7 | 57.9; 60.6 |
-
Note: CI: Confidence interval; USD: United States dollar.
-
*
25 missing values.
-
†
Reference WHO child growth standards, 2006 (WHO, 2006).
-
‡
Estimated from the Brazilian minimum wage (R$ 998.00) and converted to the USD exchange 26 rate (R$ 4.013 = USD 1) in 2019 (Brazilian minimum wage = USD 248.70).
-
§
MDD: frequency of children who received ≥ 5 or < 5 out of eight food groups on the day before the interview, [food groups: (1) breast milk; (2) grains, roots and tubers; (3) beans, nuts and seeds; (4) dairy products; (5) flesh foods; (6) eggs; (7) vitamin A-rich fruits and vegetables; and (8) fruits and vegetables] (WHO, 2021; UNICEF, 2017; Supplementary file 1).
Table 2
Association between serum metabolites and developmental quotient (DQ) of children with and without child age interaction term for children 6–59 months evaluated in a subset sample of ENANI-2019 (the Brazilian National Survey on Child Nutrition; n=5004).
| Serum Metabolites | Main effect without child age interaction term* | Main effect with child age interaction term*, † | Interaction term(Metabolites: Child age)*, † | ||||||
|---|---|---|---|---|---|---|---|---|---|
| β | 95% CI | Adjusted p-value | β | 95% CI | Adjusted p-value | β | 95% CI | Adjusted p-value | |
| Asymmetric dimethylarginine | <0.01 | –0.03; 0.02 | 0.942 | <0.01 | –0.03; 0.02 | 0.984 | <0.01 | –0.02; 0.03 | 0.965 |
| Alanine | –0.02 | –0.04; 0.01 | 0.431 | –0.02 | –0.04; 0.01 | 0.414 | <0.01 | –0.03; 0.02 | 0.928 |
| Carnitine | <0.01 | –0.03; 0.03 | 0.954 | <0.01 | –0.03; 0.03 | 0.985 | <0.01 | –0.02; 0.03 | 0.965 |
| Citrulline | –0.03 | –0.05; 0.00 | 0.164 | –0.03 | –0.05; 0.00 | 0.176 | 0.02 | 0.00; 0.05 | 0.186 |
| Creatinine | –0.01 | –0.03; 0.02 | 0.935 | <0.01 | –0.03; 0.03 | 0.985 | 0.05 | 0.02; 0.08 | 0.003 |
| Cresol sulfate | –0.07 | –0.10; –0.04 | <0.001 | –0.06 | –0.09; –0.03 | <0.001 | 0.03 | 0.01; 0.06 | 0.059 |
| Deoxycarnitine | –0.03 | –0.06; –0.01 | 0.065 | –0.03 | –0.06; –0.01 | 0.073 | 0.02 | –0.01; 0.05 | 0.227 |
| Hippuric acid | –0.06 | –0.09; –0.04 | <0.001 | –0.06 | –0.09; –0.03 | <0.001 | 0.04 | 0.01; 0.06 | 0.041 |
| Histidine | –0.02 | –0.05; 0.00 | 0.183 | –0.02 | –0.05; 0.00 | 0.183 | 0.02 | 0.00; 0.05 | 0.156 |
| Hydroxyproline | –0.01 | –0.03; 0.02 | 0.912 | –0.01 | –0.03; 0.02 | 0.976 | –0.02 | –0.05; 0.01 | 0.227 |
| Isoleucine | –0.03 | –0.05; 0.00 | 0.164 | –0.03 | –0.05; 0.00 | 0.176 | 0.02 | –0.01; 0.04 | 0.312 |
| Leucine | –0.02 | –0.05; 0.00 | 0.183 | –0.02 | –0.05; 0.00 | 0.203 | 0.03 | 0.00; 0.05 | 0.144 |
| Lysine | <0.01 | –0.03; 0.02 | 0.935 | <0.01 | –0.03; 0.02 | 0.984 | 0.02 | 0.00; 0.05 | 0.194 |
| Methionine | –0.03 | –0.05; 0.00 | 0.164 | –0.03 | –0.05; 0.00 | 0.176 | 0.02 | –0.01; 0.05 | 0.227 |
| Methylhistidine | <0.01 | –0.02; 0.03 | 0.952 | <0.01 | –0.03; 0.03 | 0.985 | 0.04 | 0.02; 0.07 | 0.018 |
| Phenylacetylglutamine | –0.06 | –0.09; –0.04 | <0.001 | –0.06 | –0.09; –0.03 | 0.001 | 0.04 | 0.01; 0.07 | 0.018 |
| Phenylalanine | –0.03 | –0.06; 0.00 | 0.164 | –0.03 | –0.05; 0.00 | 0.176 | 0.03 | 0.00; 0.05 | 0.129 |
| Threonine | <0.01 | –0.03; 0.02 | 0.953 | <0.01 | –0.03; 0.02 | 0.985 | 0.01 | –0.02; 0.03 | 0.836 |
| TMAO | –0.05 | –0.08; –0.02 | 0.002 | –0.04 | –0.07; –0.02 | 0.010 | 0.05 | 0.02; 0.07 | 0.003 |
| Tyrosine | –0.01 | –0.04; 0.02 | 0.816 | –0.01 | –0.04; 0.02 | 0.810 | 0.02 | 0.00; 0.05 | 0.194 |
| 117.0552:1.67:N; C5H10O3 | –0.02 | –0.05; 0.01 | 0.317 | –0.02 | –0.05; 0.01 | 0.322 | <0.01 | –0.03; 0.03 | 0.965 |
| 135.0293:1.71:N; C4H8O5 | 0.01 | –0.02; 0.04 | 0.721 | 0.01 | –0.02; 0.04 | 0.653 | –0.01 | –0.04; 0.01 | 0.524 |
| Uric acid | –0.01 | –0.03; 0.02 | 0.924 | <0.01 | –0.03; 0.02 | 0.984 | 0.02 | 0.00; 0.05 | 0.150 |
| Valine | –0.03 | –0.05; 0.00 | 0.164 | –0.02 | –0.05; 0.00 | 0.183 | 0.04 | 0.01; 0.06 | 0.039 |
| 2-Hydroxybutyric acid | –0.01 | –0.04; 0.02 | 0.800 | –0.01 | –0.04; 0.02 | 0.653 | 0.03 | 0.00; 0.06 | 0.129 |
| 3-Hydroxybutyric acid | –0.03 | –0.05; 0.00 | 0.164 | –0.03 | –0.05; 0.00 | 0.176 | <0.01 | –0.03; 0.03 | 0.965 |
| 3-Methyl-2-oxovaleric acid | <0.01 | –0.03; 0.03 | 0.957 | <0.01 | –0.03; 0.03 | 0.985 | <0.01 | –0.02; 0.03 | 0.965 |
| Xanthine | <0.01 | –0.02; 0.03 | 0.954 | <0.01 | –0.03; 0.03 | 0.985 | <0.01 | –0.03; 0.03 | 0.965 |
-
Note: CI: Confidence interval; DQ: Developmental quotient; TMAO: Trimethylamine N-oxide.
-
Only metabolites with variable importance projection (VIP) scores > 1 were entered in the regressions (29 serum metabolites). Adjusted p-values refer to p-values adjusted for 802 multiple comparisons by the Benjamini-Hochberg method. The child development was based on the Survey of Well-being of Young Children - the Brazilian version of the 803 milestones questionnaire, which estimates the child’s developmental age considering developmental milestones achieved. The developmental quotient was calculated as the 804 child’s developmental age divided by the chronological age (Sheldrick & Perrin, 2013). All variables were scaled before running the regression models. Bold values indicate 805 statistically significant adjusted p-values.
-
*
Multiple linear regression adjusted for child’s diet quality (minimum dietary diversity), child nutritional status (w/h score), and child age (in months).
-
†
Child age (in months) was used as interaction in the regression models.
Additional files
-
Supplementary file 1
(a) Means and confidence intervals (CI) for developmental quotient (DQ) by sociodemographic variables of children 6–59 months evaluated in a subset sample of ENANI-2019 (the Brazilian National Survey on Child Nutrition) (n=5004). (b) Annotation of unknown ions from untargeted metabolome analysis of serum filtrate samples by MSI-CE-MS from the ENANI-2019 study.
- https://cdn.elifesciences.org/articles/97982/elife-97982-supp1-v3.docx
-
MDAR checklist
- https://cdn.elifesciences.org/articles/97982/elife-97982-mdarchecklist1-v3.pdf
Download links
A two-part list of links to download the article, or parts of the article, in various formats.
Downloads (link to download the article as PDF)
Open citations (links to open the citations from this article in various online reference manager services)
Cite this article (links to download the citations from this article in formats compatible with various reference manager tools)
Serum metabolome indicators of early childhood development in the Brazilian National Survey on Child Nutrition (ENANI-2019)
eLife 14:e97982.
https://doi.org/10.7554/eLife.97982


