Dual-specific autophosphorylation of kinase IKK2 enables phosphorylation of substrate IκBα through a phosphoenzyme intermediate
- Department of Biological Sciences, Bose Institute, India
- Department of Chemistry and Biochemistry, University of California San Diego, United States
- Structural Biology and Bioinformatics Division, CSIR-Indian Institute of Chemical Biology, India
- Academy of Scientific and Innovative Research (AcSIR), India
- CSIR-Centre for Cellular and Molecular Biology, Uppal Road, India
- Department of Chemistry and Biochemistry, San Diego State University, United States
Figures
Figure 1 with 1 supplement

Autophosphorylation of IKK2 at hitherto uncharacterized sites.
(A) A schematic of the IKK-complex (pre- and post-stimulation) showing binding of NEMO helping activation of IKK as well as channelizing its recognition of substrate IκBα. The mechanism of specific phosphorylation at Ser32 and Ser36 of IκBα is unclear (B) Domain organization of IKK2 based on the X-ray structures highlighting its functional kinase domain (KD), ubiquitin-like domain (ULD), scaffold dimerization domain (SDD), and NEMO-binding domain. Serine residues in the activation loop - substitution of which to glutamate renders IKK2 constitutively active, and those in the SRR region known to be phosphorylated are marked. Tyrosine residues in the activation loop and the conserved ATP-interacting Lys44 are also marked. (C) In vitro kinase assay showing autophosphorylation of wild-type full-length IKK2 (FL IKK2WT) upon incubation with γ32P radiolabeled ATP for different time periods. (D) Similar in vitro kinase assays performed to assess the effect of NEMO on autophosphorylation of FL IKK2WT (left panel), and the effect of NEMO and IκBα on autophosphorylation and substrate phosphorylation (right panel) activities of FL IKK2WT. (E) In vitro kinase assay (schematic depicted in Figure 1—figure supplement 1B) showing the effect of different concentrations of the Inhibitor VII on FL IKK2WT autophosphorylation and IκBα substrate phosphorylation (this assay was performed twice). (F) Kinase assay with radiolabeled ATP displaying auto- and substrate-phosphorylation of full-length and deletion constructs of the constitutively active form of IKK2 harboring phosphomimetic Ser177Glu and Ser181Glu substitutions.
-
Figure 1—source data 1
Original unedited autoradiograph and Coomassie-stained gel files used in Figure 1C, D, E and F.
- https://cdn.elifesciences.org/articles/98009/elife-98009-fig1-data1-v1.zip
-
Figure 1—source data 2
Original autoradiographs and Coomassie-stained gel files used in Figure 1C, D, E and F with sample labels.
- https://cdn.elifesciences.org/articles/98009/elife-98009-fig1-data2-v1.zip
Figure 1—figure supplement 1
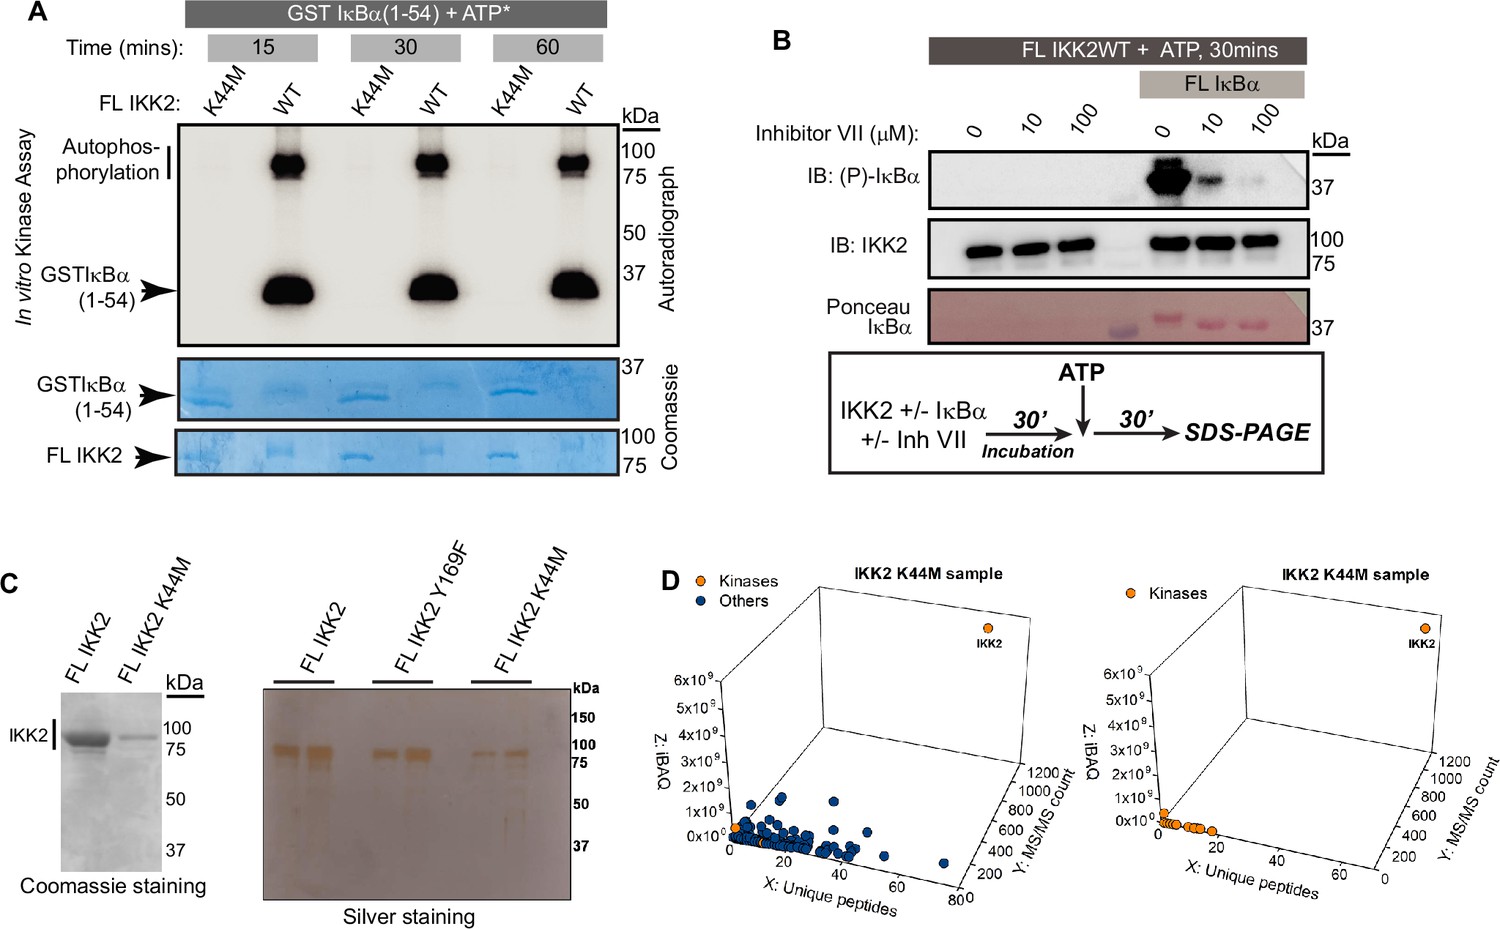
Activity and purity level check of FL IKK2 WT and K44M.
(A) Autoradiograph of an in vitro kinase assay showing auto- and substrate-phosphorylations with FL IKK2WT or IKK2 K44M using substrate GST-tagged IκBα (1-54) as a function of time. (B) In vitro kinase assay with cold ATP showing the effect of different Inhibitor VII concentrations on substrate phosphorylation activity of FL IKK2 WT. FL IκBα WT was used as the substrate and phosphorylation specifically at S32/S36 was monitored using a monoclonal antibody specific for IκBα phosphorylated at those two serines. A scheme of the kinase assay is shown below. (C) Coomassie-stained SDS-PAGE gel showing general purity of the IKK2 proteins (WT and K44M) used in this study (Left panel). Silver-stained SDS-PAGE gel showing the purity of three different FL IKK2 protein constructs (WT, Y169F, and K44M) used in the study. (D) LC MS/MS analyses of FL IKK2 K44M protein after trypsin digestion on Orbitrap Exploris 240 equipment. See Supplementary file 1 for additional details. A 3D scatter plot with different parameters for the detected proteins obtained from the mass spectrometric analysis of the sample is shown, where the X-axis represents the number of unique peptides for each protein, the Y-axis represents spectral counts, and the Z-axis represents the iBAQ (intensity Based Absolute Quantification) values. KyPlot was used to create this 3D scatter plot. In the left panel, all the proteins detected are shown, where the orange circle represents the protein kinases, whereas in the right panel only the protein kinases are shown for better clarity. See Supplementary file 2 for additional details. For this analysis, the Spodoptera frugiperda reference proteome (ID: UP000829999) available in the Uniprot database was used, which contains both reviewed (Swiss-Prot) and unreviewed (TrEMBL) protein sequences.
-
Figure 1—figure supplement 1—source data 1
Original unedited autoradiograph, Coomassie-stained gel, Silver-stained gel, western blot files and plots used in Figure 1—figure supplement 1A, B, C and D.
- https://cdn.elifesciences.org/articles/98009/elife-98009-fig1-figsupp1-data1-v1.zip
-
Figure 1—figure supplement 1—source data 2
Original autoradiograph, Coomassie-stained gel, Silver-stained gel, western blot files and plots used in Figure 1—figure supplement 1A, B, C and D with sample labels.
- https://cdn.elifesciences.org/articles/98009/elife-98009-fig1-figsupp1-data2-v1.zip
Figure 2 with 1 supplement

IKK2 displays autocatalytic dual specificity.
(A) In vitro kinase assay with unlabeled ATP showing autophosphorylations in FL IKK2WT detected by immunoblotting using antibodies specific against phosphor-Ser (177/181) and phospho-Tyr residues. (B) pTyr on IKK2 detected using a different commercial source of phospho-Tyr antibody. (C) Effect of Inhibitor VII on tyrosine autophosphorylation of FL IKK2WT. (D) Autophosphorylation of IKK2 K44M mutant compared to that of IKK2 WT assessed at different time points through immunoblotting performed with phospho-Tyr antibody. (E) Autophosphorylation of tyrosines along with phosphorylation of GST-tagged IκBα (1-54) substrate with full-length and deletion mutants of IKK2 harboring phosphomimetic Ser177Glu and Ser181Glu substitutions. (F) In vitro de novo auto-phosphorylation of IKK2 Δ664EE construct on tyrosine analyzed by phospho-Ser and phospho-Tyr-specific monoclonal antibodies. (G) Autophosphorylations at tyrosine and AL-serine residues upon fresh ATP treatment of FLIKK2 WT and FLIKK2 S177A,S181A assessed by immunoblot analysis using antibodies against phospho-IKK2-Ser(177/181) and phospho-Tyr.
-
Figure 2—source data 1
Original unedited western blot files used in Figure 2A–G.
- https://cdn.elifesciences.org/articles/98009/elife-98009-fig2-data1-v1.zip
-
Figure 2—source data 2
Original western blot files used in Figure 2A–G with sample labels.
- https://cdn.elifesciences.org/articles/98009/elife-98009-fig2-data2-v1.zip
Figure 2—figure supplement 1
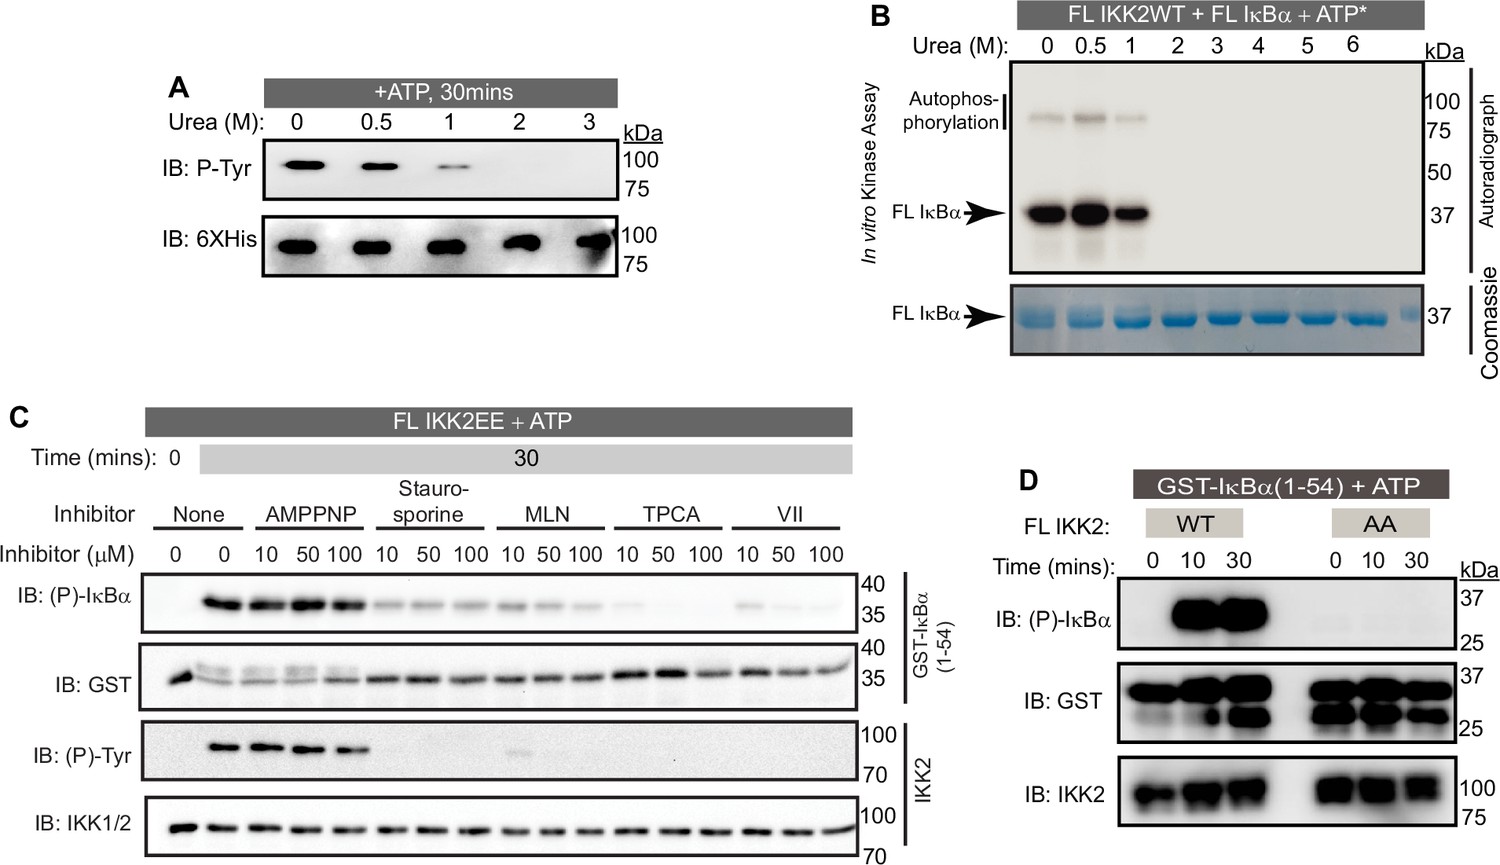
Effect of Urea, kinase inhibitors and activation loop Serine mutations on IKK2 activity.
(A) In vitro kinase assay monitored by immunoblotting showing the effect of increasing concentration of urea on tyrosine autophosphorylation of FL IKK2WT. (B) In vitro kinase assay using radiolabeled ATP to test auto- and substrate-phosphorylations with up to 6 M urea. (C) Effects of common kinase inhibitors, for example AMPPNP and Staurosporine, highly specific IKK2 inhibitors TPCA, Calbiochem Inhibitor VII, and MLN120B on inhibition of both substrate phosphorylation and tyrosine autophosphorylation activities of IKK2. Immunoblotting using specific antibodies as indicated in the figure was used to monitor the phosphorylation and protein levels. (D) In vitro kinase assay showing substitution of AL-serines to non-phosphorylatable alanine (FL IKK2 S177A,181A double mutant) debilitates kinase activity of IKK2 toward S32,S36 of IκBα compared to its WT version.
-
Figure 2—figure supplement 1—source data 1
Original unedited autoradiograph, Coomassie-stained gel, and western blot files used in Figure 2—figure supplement 1A–D.
- https://cdn.elifesciences.org/articles/98009/elife-98009-fig2-figsupp1-data1-v1.zip
-
Figure 2—figure supplement 1—source data 2
Original autoradiograph, Coomassie-stained gel, and western blot files used in Figure 2—figure supplement 1A–D with sample labels.
- https://cdn.elifesciences.org/articles/98009/elife-98009-fig2-figsupp1-data2-v1.zip
Figure 3 with 1 supplement
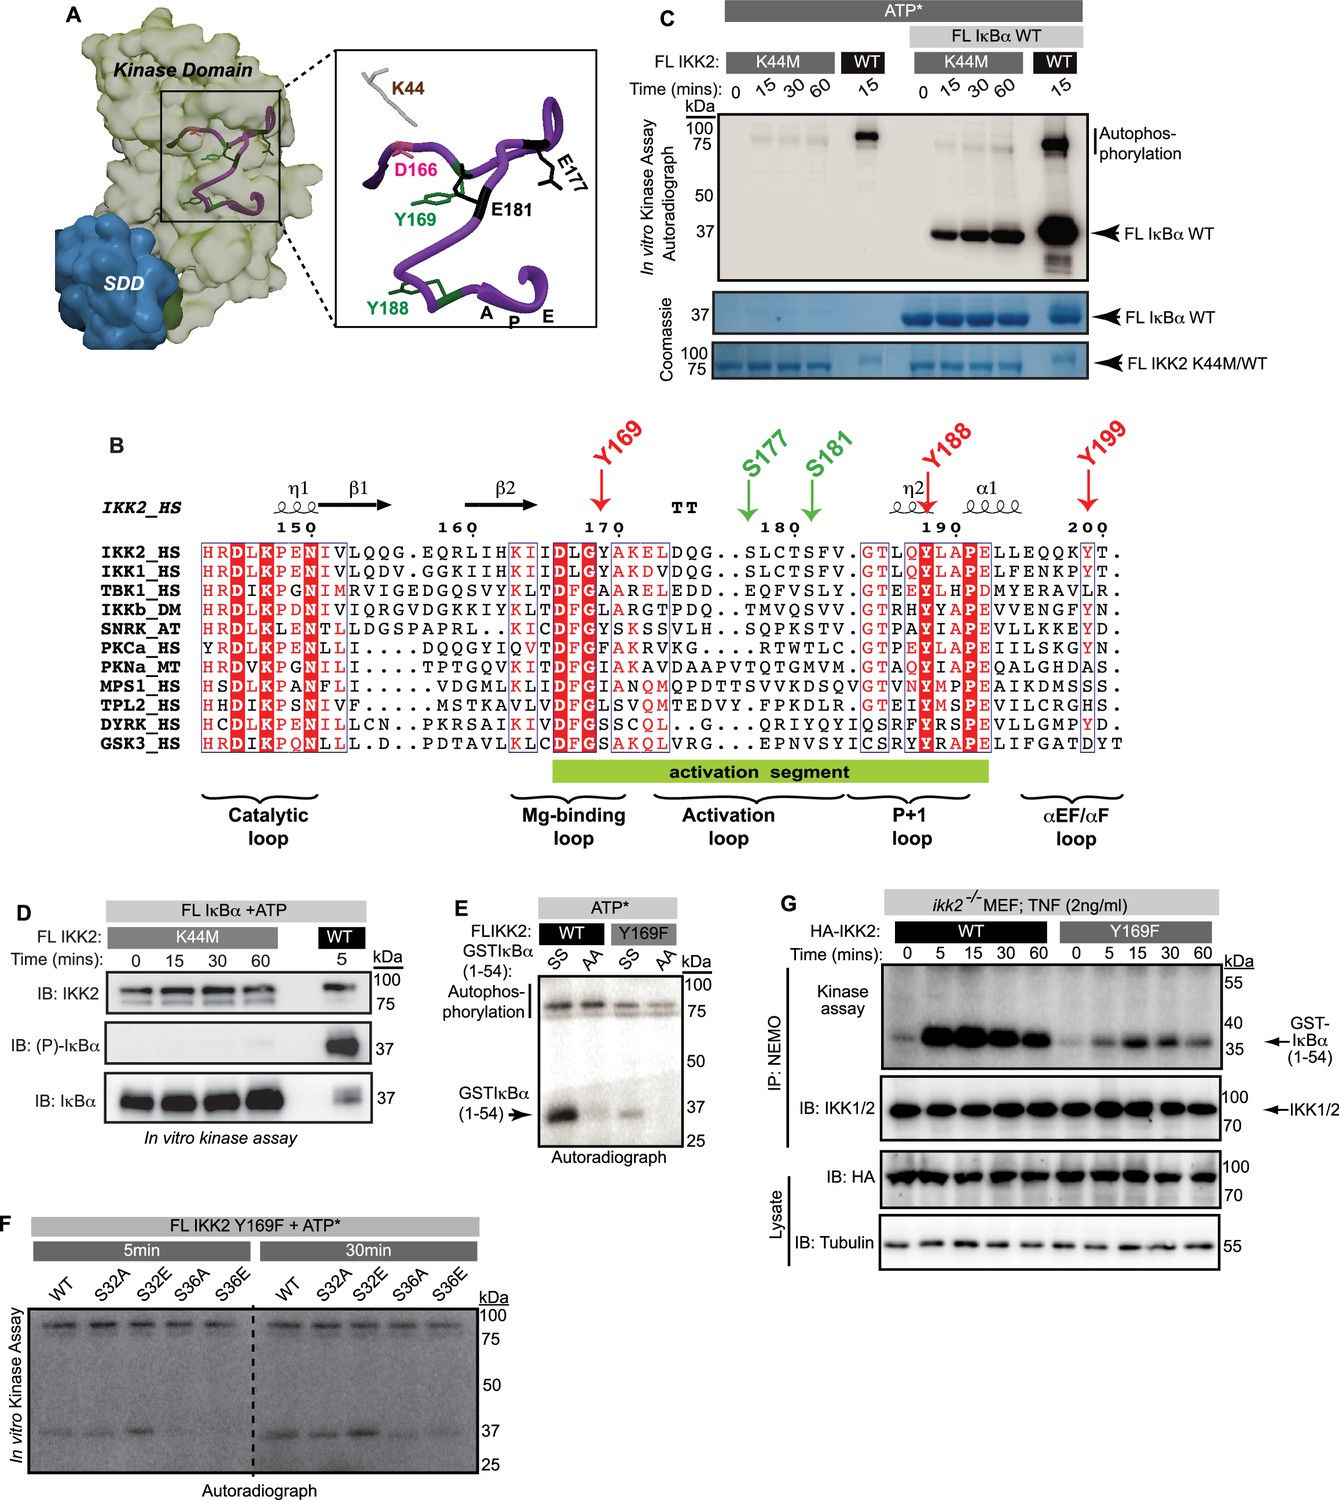
Dual-specific autophosphorylation is critical for the function of IKK2.
(A) A surface representation of IKK2-KD structure (adapted from PDB ID 4E3C; KD is shown in light green and SDD in teal) with positions of canonically important residues within the AL (purple ribbon) marked. Tyrosine residues in the activation segment are marked in green, Tyr169 among which is identified to be autophosphorylated. (B) Amino-acid sequence alignment of activation loop segment of different kinases in the IKK-family. The tyrosine at position DFG +1 (DLG +1 in case of IKK1 and IKK2) is observed only in IKK and in the stress response-related plant kinase SnRK2, but not in other structural homologues of IKK or dual specificity kinases, for example DYRK and GSK3β (both contain Ser at that position). Tyr at position 188 (204 in PKA) is universally conserved. (C) Substrate and autophosphorylation activities of FL IKK2 WT and IKK2 K44M mutant were compared using in vitro radioactive kinase assay in presence and absence of FL IκBα WT as the substrate. (D) Specific residue-selectivity of phosphorylation by the FL IKK2 K44M analyzed using an antibody specific for phospho-S32/36 of IκBα. (E) In vitro kinase assay using radiolabeled ATP performed with IKK2 WT and IKK2 Y169F in the presence of WT and AA-mutant of GST-tagged IκBα (1-54) substrate. (F) In vitro kinase assay using radiolabeled ATP performed with IKK2 Y169F mutant in the presence of various GST-tagged IκBα(1-54) substrates indicating abolition of substrate phosphorylation in S36A and S36E mutants of IκBα. (G) Severe reduction of IKK activity with IKK immunoprecipitated (IP-ed) with anti-NEMO antibody from whole cell extract (n=2) of TNFα-induced ikk2-/- MEF-3T3 cells reconstituted with mutant Y169F IKK2 compared to the wild-type.
-
Figure 3—source data 1
Original unedited autoradiograph, Coomassie-stained gel, and western blot files used in Figure 3C, D, E, F, and G.
- https://cdn.elifesciences.org/articles/98009/elife-98009-fig3-data1-v1.zip
-
Figure 3—source data 2
Original autoradiograph, Coomassie-stained gel, and western blot files used in Figure 3C, D, E, F, and G with sample labels.
- https://cdn.elifesciences.org/articles/98009/elife-98009-fig3-data2-v1.zip
Figure 3—figure supplement 1
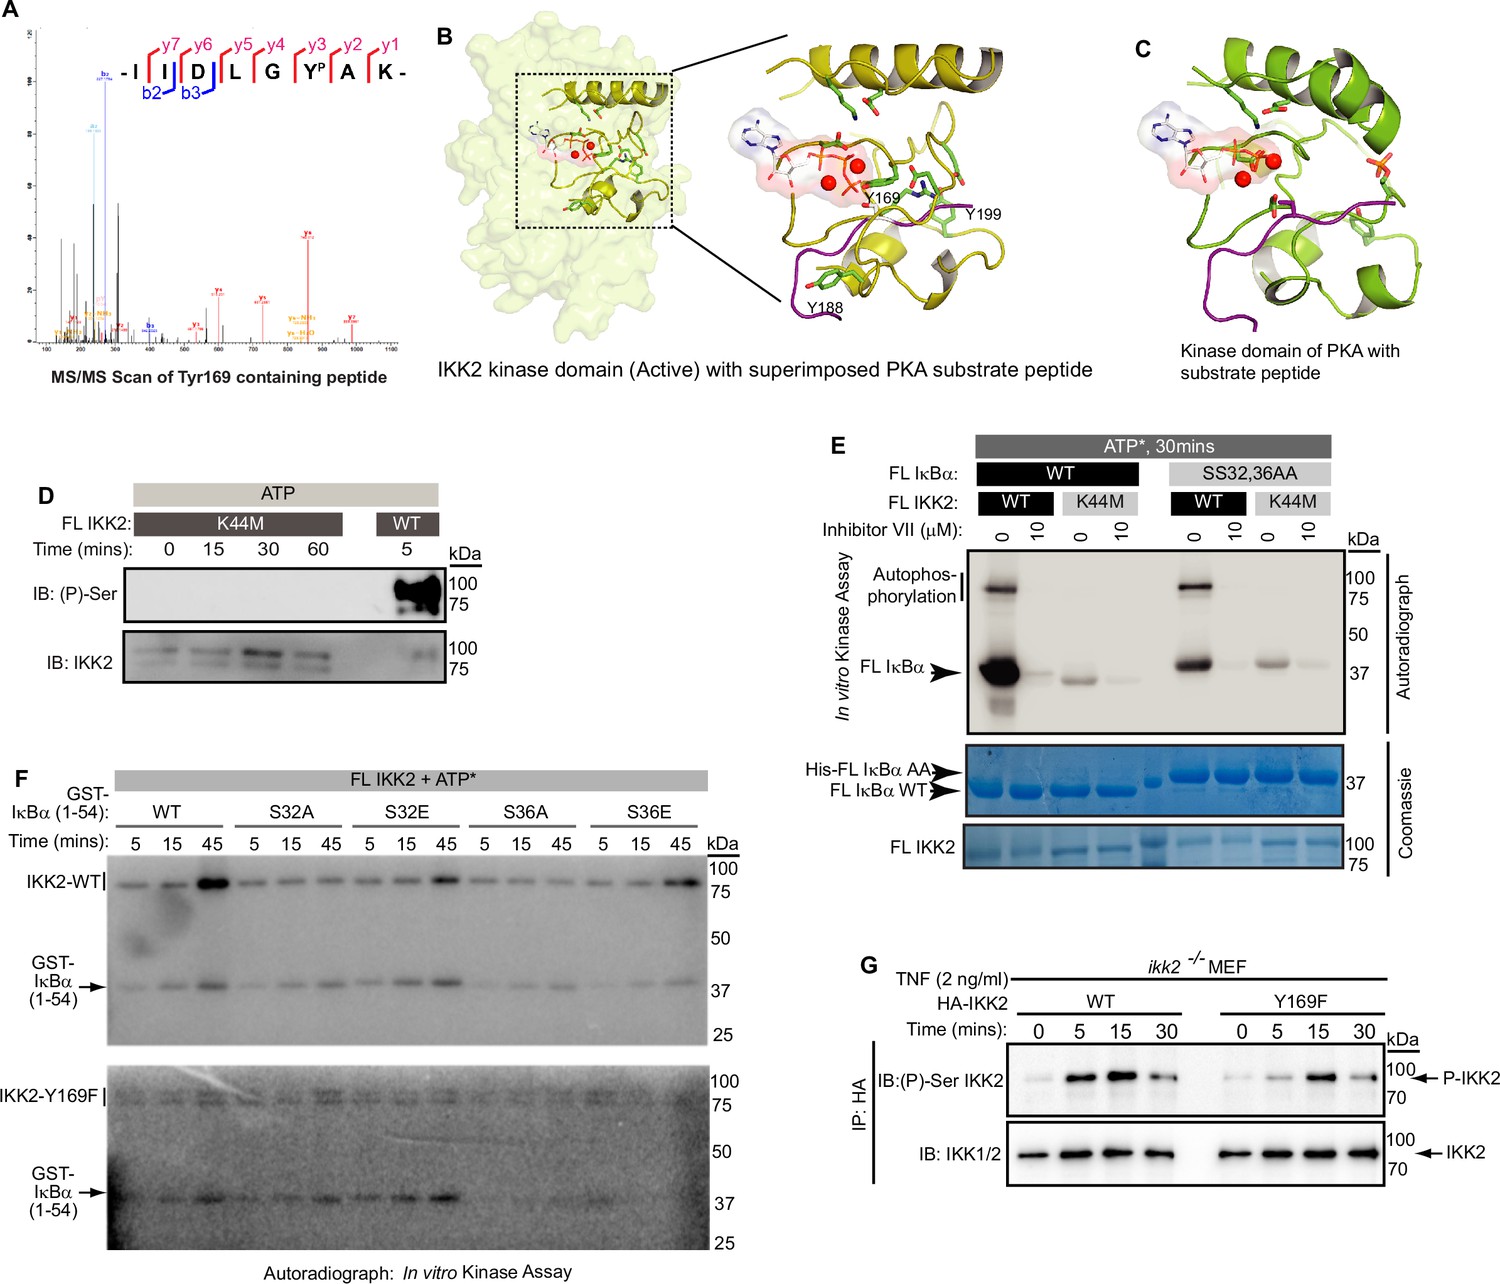
Identification of Tyr169 phosphorylation, and effect of Y169F and K44M mutations on IKK2’s specificity.
(A) LC-MS/MS based detection of phosphorylated tyrosine residue, Y169 on autophosphorylated FL IKK2 WT. (B) A close-up view of the active site in active form in the context of the entire kinase domain of IKK2. Three tyrosines (Y169, Y188, and Y199) in immediate vicinity of active sites are highlighted. Position of ATP is modeled based on the ATP-bound structure of PKA. (C) Substrate bound PKA in its active form; phosphorylatable serine of the substrate peptide (in magenta) is highlighted. (D) Immunoblotting performed with phospho-IKK2 S177/S181 antibody to check autophosphorylation in IKK2 K44M mutant at different time points compared to that of IKK2 WT. (E) Differential sensitivity of specific vs. non-specific phosphorylation by IKK2 displayed in the effect of Inhibitor VII on FL IKK2 WT and IKK2 K44M in the presence of either IκBα WT or IκBα AA as substrates. (F) To compare IKK2 Y169F to IKK2 WT for phosphorylation of S32 and S36 of IκBα, an assay similar to that described in Figure 3F was performed. Reactions with IKK2 WT and IKK2 Y169F were run on different gels, but the gels were similarly processed and exposed for autoradiography before imaging (n=1). (G) AL-serine phosphorylation status of immunoprecipitated [with monoclonal anti-HA antibody (n=2)] IKK2 WT and IKK2 Y169F from TNF-α-stimulated reconstituted MEF cells.
-
Figure 3—figure supplement 1—source data 1
Original unedited autoradiograph, Coomassie-stained gel, and western blot files used in Figure 3—figure supplement 1D–G.
- https://cdn.elifesciences.org/articles/98009/elife-98009-fig3-figsupp1-data1-v1.zip
-
Figure 3—figure supplement 1—source data 2
Original autoradiograph, Coomassie-stained gel, and western blot files used in Figure 3—figure supplement 1D–G with sample labels.
- https://cdn.elifesciences.org/articles/98009/elife-98009-fig3-figsupp1-data2-v1.zip
Figure 4 with 1 supplement

Structural analyses of IKK2 autophosphorylation.
(A) Molecular dynamics (MD) simulations of three differently phosphorylated states of IKK2 - UnP-IKK2, p-IKK2, and P-IKK2, and 200ns trajectory of energy of these states shown in golden yellow, blue, and copper red, respectively. Same coloring scheme has been maintained in this figure and in the corresponding figure supplement (see Supplementary file 3 for additional details). (B) 200 ns trajectory of RMSD of the three states (see Supplementary file 4 for additional details). (C) Superposition of structures representing the differently phosphorylated states post 200 ns MD simulation. Relevant regions, for example activation loop, αC-helix, and Gly-rich loop areas are highlighted in the right panel. (D) Residues forming canonical R- (labeled in blue) and C-spines (labeled in dark gray) representing an active conformation in p-IKK2 are shown. (E) ATP-bound p-IKK2 structure is depicted. In the right panel, relevant residues are highlighted. The position of Tyr169 is conducive to autophosphorylation. (F) ATP maintains the desired continuum of R- and C-spines observed in active kinase conformations. (G) P-IKK2 cannot accommodate ATP in its cleft, and the αC-helix is displaced. (H) Met65 is moved away from the R-spine, failing to form canonically active conformation of R- and C-spines. (I and J) ADP-bound states of p-IKK2 and P-IKK2, both of which can accommodate ADP in their respective clefts.
-
Figure 4—source data 1
Source PDB files used for creating Figure 4C–J and Figure 4—figure supplement 1B and G.
- https://cdn.elifesciences.org/articles/98009/elife-98009-fig4-data1-v1.zip
Figure 4—figure supplement 1
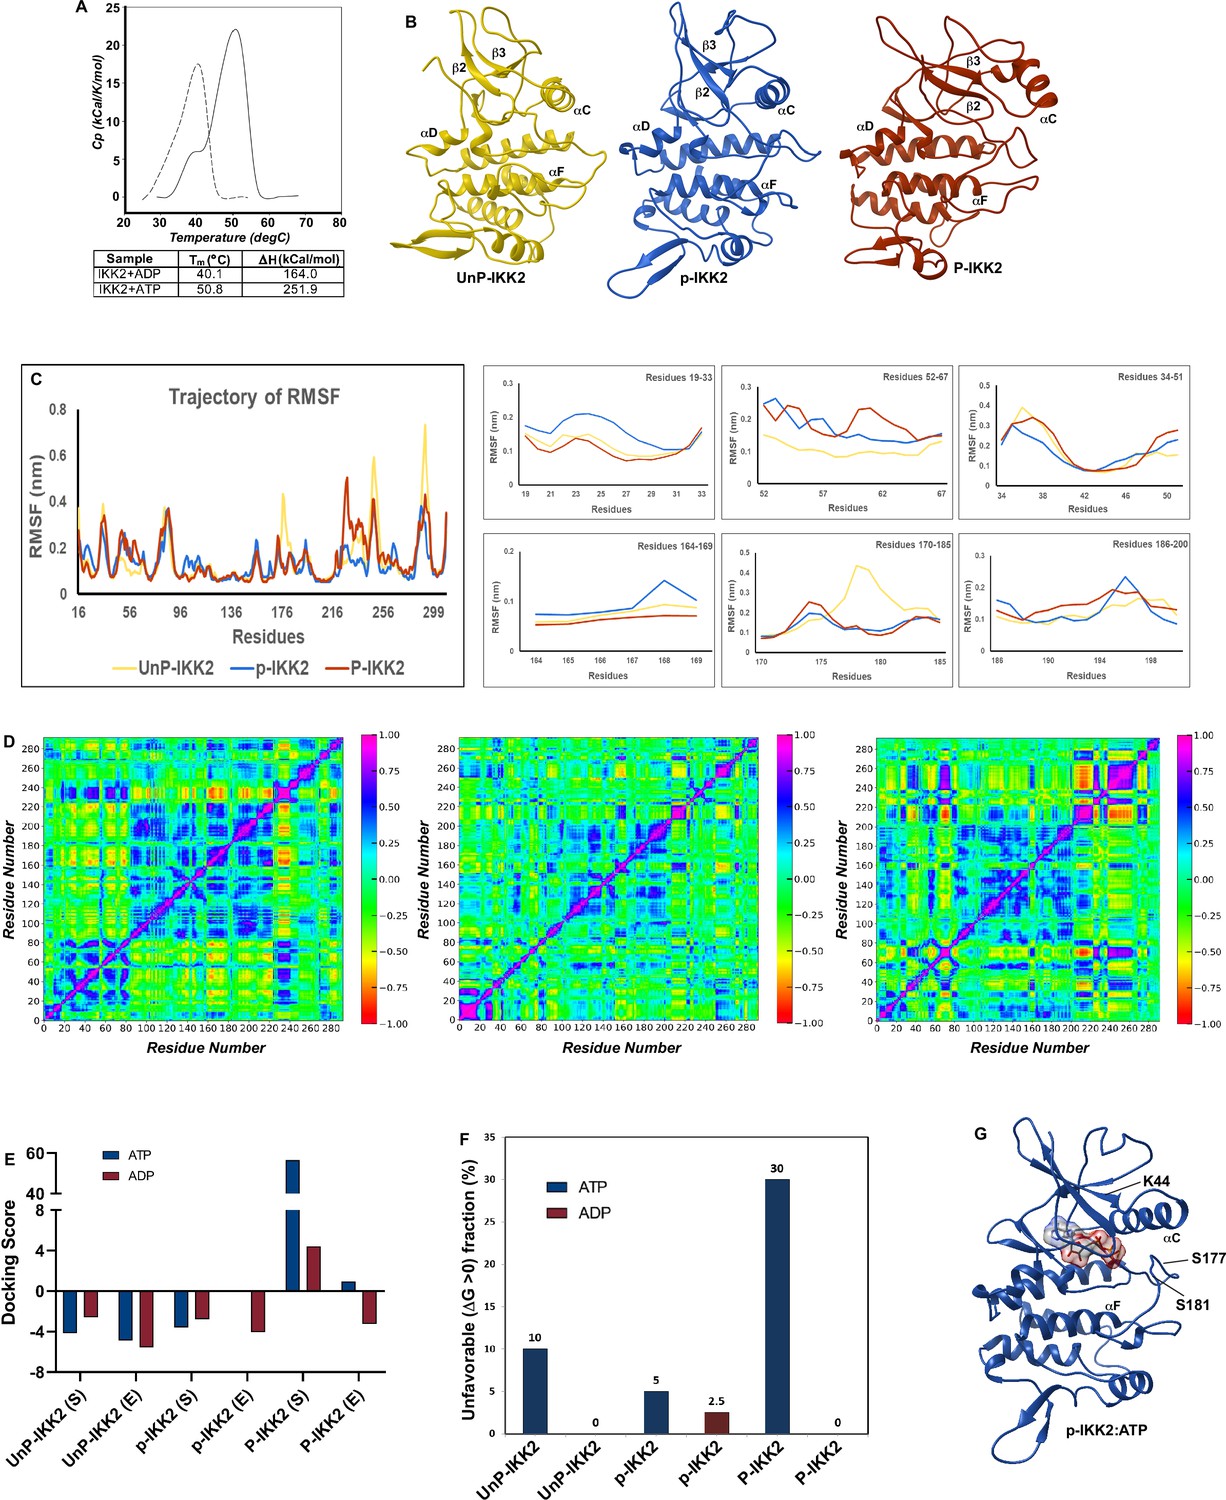
Effect of IKK2 autophosphorylation on its thermal stability, dynamics and energetics of ATP/ADP binding.
(A) A differential scanning calorimetry (DSC) thermogram showing a striking enhancement in folding stability of IKK2 upon ATP-treatment (solid line) as compared to ADP-treatment (dashed line) (n=1). For details, check Supplementary file 7. (B) Ribbon representation of different phosphorylated versions of IKK2 is shown: UnP-IKK2 in golden yellow, p-IKK2 in blue, and P-IKK2 in copper red. (C) Trajectories of RMSF for these structures are shown (left panel). For clarity, different regions of the KD are shown in the right panel. See Supplementary file 5 for additional details. (D) Dynamic cross-correlation matrix (DCCM) or contact map of each structure reveals phosphorylation-induced local as well as allosteric changes. (E) Docking scores of ATP and ADP bound differently phosphorylated IKK2 proteins using three different docking programs. ATP and ADP were docked to respective IKK2 models at 0ns and at 200ns using LeDock and GOLD followed by rescoring with AutoDock Vina (see Materials and methods). (F) Percentage of unfavorable poses having ΔG>0 obtained from MM-PBSA (Molecular Mechanics Poisson-Boltzmann Surface Area) method for each phosphorylated state of IKK2 using 50 intermediate complex structures in a 10ns MD simulation of respective complex structures post-docking (see Materials and methods). (G) ATP-bound structure of p-IKK2 (ribbon) is shown.
Figure 5 with 1 supplement
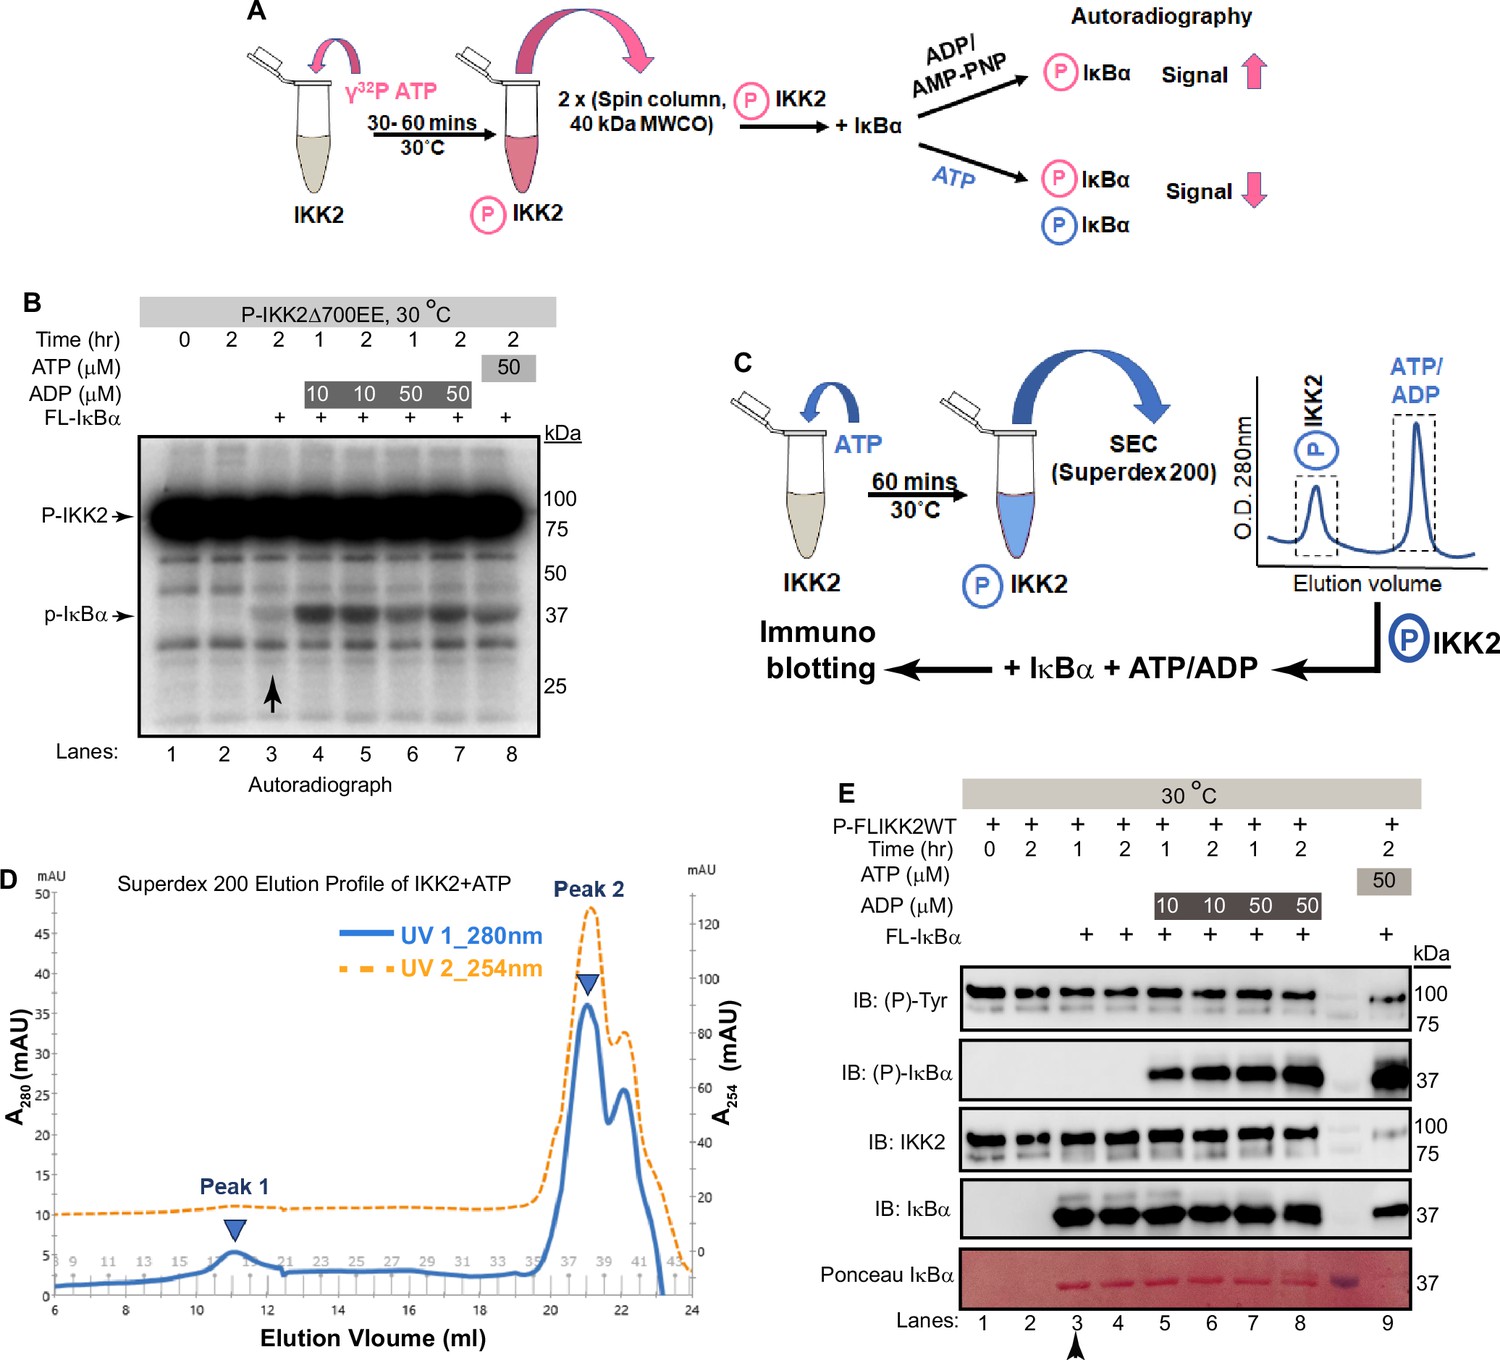
Freshly autophosphorylated IKK2 relays phosphates to IκBα.
(A) A schematic of the autoradiography experiment to monitor the path of phosphate(s) from phospho-IKK2 to substrate. (B) Autophosphorylated (with radiolabeled ATP) purified IKK2 could transfer its phosphate to IκBα substrate in the absence of any nucleotide, and the transfer efficiency is enhanced upon addition of ADP or ATP. (C) A schematic of the immunoblot experiment to monitor the path of phosphate(s) from phospho-IKK2 to substrate. (D) Elution profile in size-exclusion chromatography (Superdex200 10/30 increase) of phospho-IKK2 (Peak 1) to remove excess unlabeled ATP (Peak 2). Phospho-IKK2 from Peak1 was used in downstream phosphotransfer assays. (E) Immunoblotting experiment using specific antibodies indicated in the figure (n=2) showing that purified autophosphorylated (with cold ATP) IKK2 transfers its phosphate to IκBα substrate, and this transfer efficiency is enhanced upon addition of ADP or ATP.
-
Figure 5—source data 1
Original unedited autoradiograph and western blot files used in Figure 5B and E.
- https://cdn.elifesciences.org/articles/98009/elife-98009-fig5-data1-v1.zip
-
Figure 5—source data 2
Original autoradiograph and western blot files used in Figure 5B and E with sample labels.
- https://cdn.elifesciences.org/articles/98009/elife-98009-fig5-data2-v1.zip
Figure 5—figure supplement 1
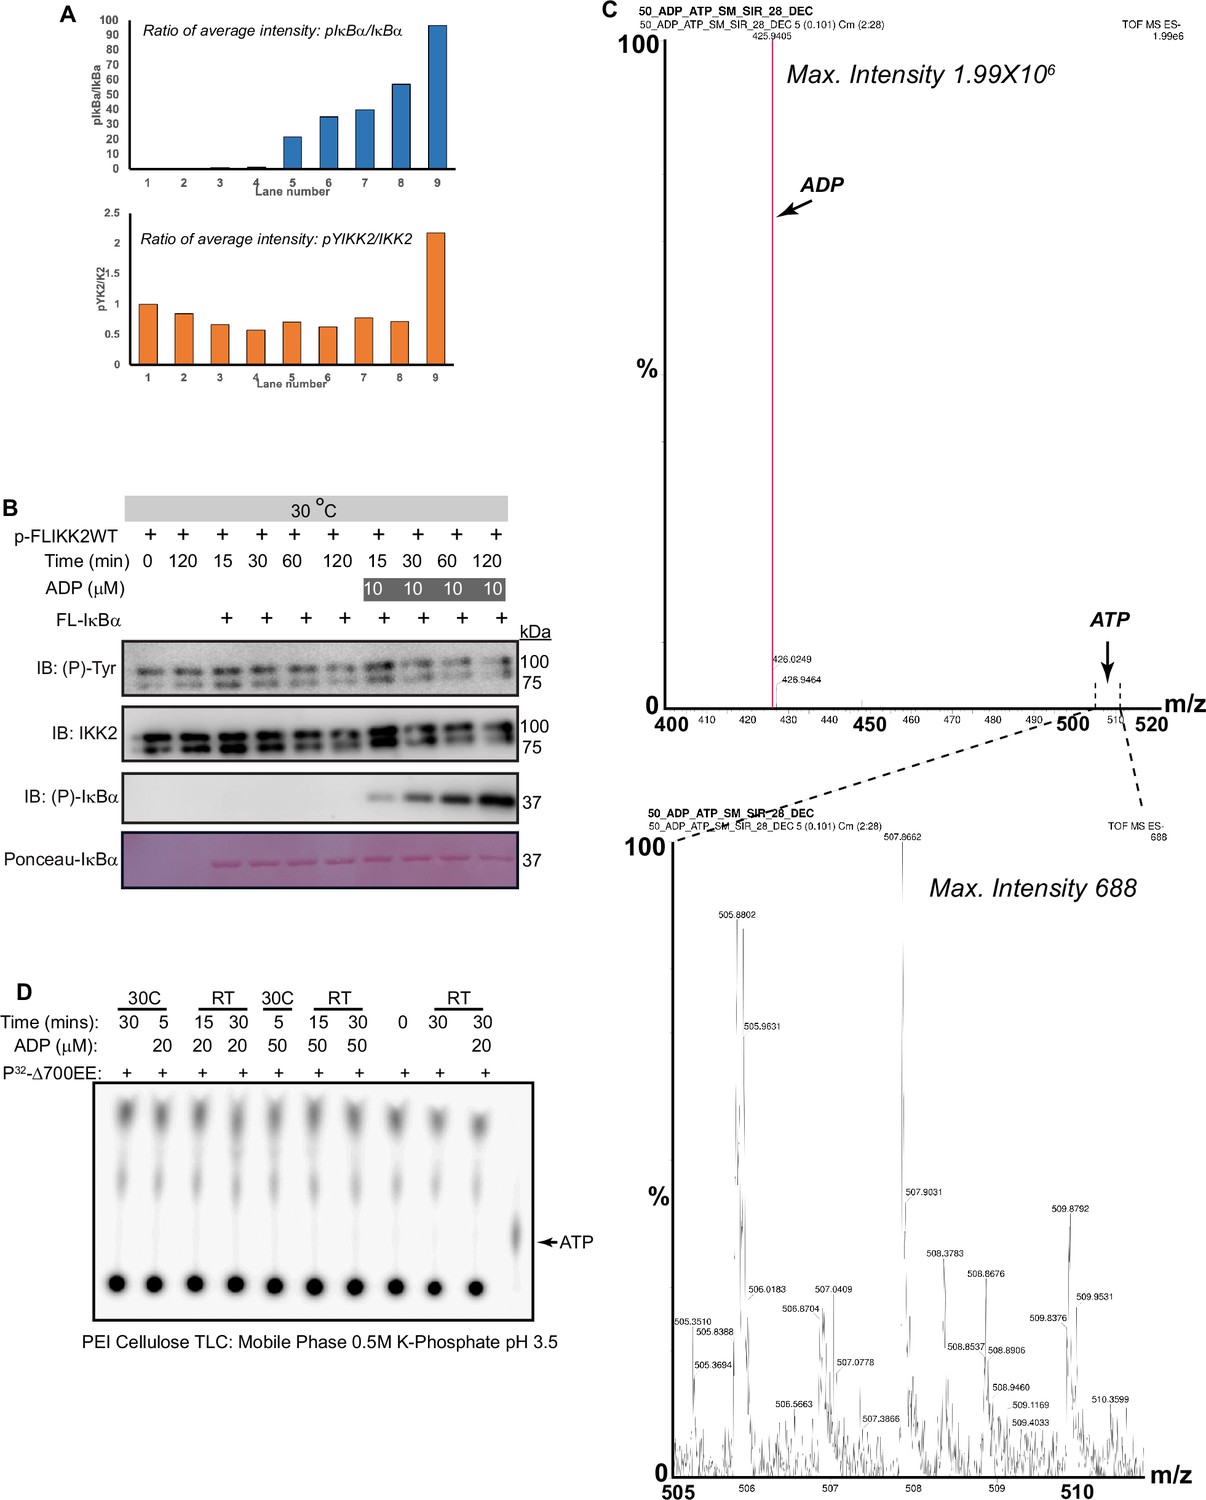
Phosphotransfer from autophosphorylated IKK2 to IκBα does not involve ATP-regeneration.
(A) Quantitation of phospho-IκBα (at S32/S36) and tyrosine phosphorylated IKK2 described in Figure 5E using ImageQuant TL software. The average intensity values were obtained upon subtracting the background noise, and the ratios of the average intensity of the phosphorylated protein with respect to the intensity of total protein were plotted using Microsoft Excel. See Supplementary file 6 for additional details. (B) Transfer of phosphates from purified autophosphorylated (unlabeled ATP) IKK2 to IκBα substrate increases in the presence of a fixed concentration of ADP in a time-dependent manner. Progress of the reaction is monitored by immunoblotting using specific antibodies as indicated in the figure (n=2). (C) ESI-MS scan of the ADP used in this assay system showing negligible trace, if any, of ATP at 50 μM ADP concentration. (D) Regeneration of ATP, if any, through microscopic reversibility was checked by TLC in a variety of conditions. γ-P32 was used as the control/standard.
-
Figure 5—figure supplement 1—source data 1
Original unedited western blot and TLC files used in Figure 5—figure supplement 1B and D.
- https://cdn.elifesciences.org/articles/98009/elife-98009-fig5-figsupp1-data1-v1.zip
-
Figure 5—figure supplement 1—source data 2
Original western blot and TLC files used in Figure 5—figure supplement 1B and D with sample labels.
- https://cdn.elifesciences.org/articles/98009/elife-98009-fig5-figsupp1-data2-v1.zip
Figure 6 with 1 supplement

Specificity and fidelity of phosphotransfer by IKK2 to IκBα.
(A) Autoradiograph showing phosphotransfer to full-length IκBα WT but not to its S32A,S36A double mutant. Domain organization and position of relevant S/T/Y residues of IκBα are shown above the autoradiograph. Also, AMP-PNP can support efficient phosphotransfer. (B) A proposed scheme of reactions during signal-responsive IKK2-activation and subsequent specific phosphorylation of IκBα at S32, S36 through phosphotransfer in the presence of ADP.
-
Figure 6—source data 1
Original unedited autoradiograph file used displayed in Figure 6A.
- https://cdn.elifesciences.org/articles/98009/elife-98009-fig6-data1-v1.zip
-
Figure 6—source data 2
Original autoradiograph file used displayed in Figure 6A with sample labels.
- https://cdn.elifesciences.org/articles/98009/elife-98009-fig6-data2-v1.zip
Figure 6—figure supplement 1
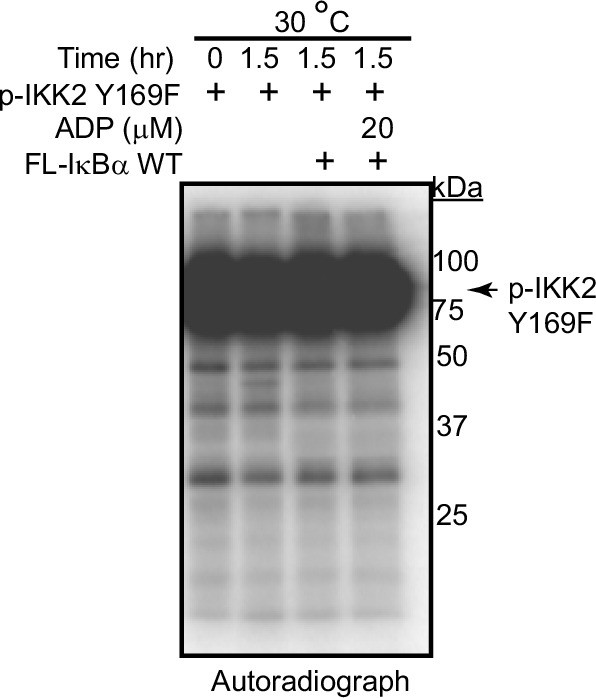
Purified autophosphorylated (radiolabeled) FL IKK2 Y169F fails to transfer phosphate to IκBα substrate in absence or presence of ADP (n=1).
This assay was performed similarly to that described in Figure 5A.
-
Figure 6—figure supplement 1—source data 1
Original unedited autoradiograph file used in Figure 6—figure supplement 1.
- https://cdn.elifesciences.org/articles/98009/elife-98009-fig6-figsupp1-data1-v1.zip
-
Figure 6—figure supplement 1—source data 2
Original autoradiograph file used in Figure 6—figure supplement 1 with sample labels.
- https://cdn.elifesciences.org/articles/98009/elife-98009-fig6-figsupp1-data2-v1.zip
Tables
Key resources table
| Reagent type (species) or resource | Designation | Source or reference | Identifiers | Additional information |
|---|---|---|---|---|
| Gene (Homo sapiens) | IKBKB | GenBank | Gene ID: 3551 | |
| Gene (Homo sapiens) | NFKBIA | GenBank | Gene ID: 4792 | |
| Gene (Homo sapiens) | IKBKG | GenBank | Gene ID: 8517 | |
| Strain, strain background (Escherichia coli) | Rosetta2 (DE3) | Other | Chemically competent cells | |
| Strain, strain background (Escherichia coli) | DH5α | New England Biolabs | Cat# C2987H | Chemically competent cells |
| Strain, strain background (Spodoptera frugiperda) | Sf9 cells | Thermo Fischer | Cat# 12659017 | |
| Antibody | Anti-IκBα (L35A5) (Mouse monoclonal) | Cell Signaling Technology | Cat# 4814, RRID:AB_390781 | WB (1:2000) |
| Antibody | Anti-Phospho-IκBα (Ser32/36) (5A5) (Mouse monoclonal) | Cell Signaling Technology | Cat# 9246, RRID:AB_2267145 | WB (1:2500) |
| Antibody | Anti-Phospho-IKKα/β (Ser176/180) (16A6) (Rabbit monoclonal) | Cell Signaling Technology | Cat# 2697, RRID:AB_2079382 | WB (1:2000) |
| Antibody | Anti-Phospho-Tyrosine (Mouse monoclonal) | BD Biosciences | Cat# 610000, RRID:AB_397423 | WB (1:500) |
| Antibody | Anti-Phospho-Tyrosine (Mouse monoclonal) | EMD Millipore | Cat# 05–321 X | WB (1:1000) |
| Antibody | Anti-IKKβ (Rabbit Polyclonal) | Bio Bharti Life Science | Cat# BB-AB0094 | WB (1:2000) |
| Antibody | Anti-IKKβ (10AG2) (Mouse monoclonal) | Novus Biologicals | Cat# NB100-56509 | WB (1:5000) |
| Antibody | Anti-6XHis (Rabbit Polyclonal) | Bio Bharti Life Science | Cat# BB-AB0010 | WB (1:2500) |
| Antibody | Anti-GST (Rabbit polyclonal) | BioLegend | Cat# 924801, RRID:AB_2565461 | WB (1:10000) |
| Antibody | Anti-Phospho-Serine Q5 (Mouse Monoclonal) | Qiagen | Cat# 37430 | WB (1:2000) |
| Antibody | Anti-NEMO (Mouse monoclonal) | BD biosciences | Cat# 559675, RRID:AB_397297 | IP (1:1AB_397297AB_397297AB_397297AB_397297AB_39729700) |
| Antibody | Anti-HA 11 epitope (Mouse monoclonal) | BioLegend | Cat# 901502, RRID:AB_2565007 | WB (1:2000) IP (1:100) |
| Antibody | Anti-Tubulinβ3 (Mouse monoclonal) | BioLegend | Cat# 657402, RRID:AB_2562570 | WB (1:10,000) |
| Recombinant DNA reagent | pFastBac HT B (plasmid) | Invitrogen | ||
| Recombinant DNA reagent | pET24d (6xHis- TEV) (plasmid) (modified) | Other | Prepared in lab | |
| Sequence-based reagent | IKK2_1_F | This paper | PCR primer | 5’-GCATGATCAAGCTG GTCACCTTCCCTGAC-3’ |
| Sequence-based reagent | IKK2_700_R | This paper | PCR primer | 5’-ATAAGAATGCGGCCG CTCACTCAGGTAAGCTGTTGGAGGCCG-3’ |
| Sequence-based reagent | IKK2_AA_F | This paper | PCR primer | 5’-GCCAAGGAGCTGGAT CAGGGCGCTCTTTGCACAGCATTCGTGGGGACCCTGCAGTAC-3’ |
| Sequence-based reagent | IKK2_AA_R | This paper | PCR primer | 5’- GTACTGCAGGGTCCC CACGAATGCTGTGCAAAGAGCGCCCTGATCCAGCTCCTTGGC-3’ |
| Sequence-based reagent | IKK2_Y169F_F | This paper | PCR primer | 5’-CACAAAATTATTGACC TAGGATTTGCCAAGGAGCTGGATCAGGGC-3’ |
| Sequence-based reagent | IKK2_Y169F_R | This paper | PCR primer | 5’-GCCCTGATCCAGCTC CTTGGCAAATCCTAGGTCAATAATTTTGTG-3’ |
| Sequence-based reagent | NEMO_F | This paper | PCR primer | 5’-CGGAATTCATG AATAGGCACCTCTGG-3’ |
| Sequence-based reagent | NEMO_R | This paper | PCR primer | 5’-ACGCGTCGACTCA CTCAATGCACTCCATG-3’ |
| Sequence-based reagent | IκBα_F | This paper | PCR primer | 5’-CGCGGATCCATGTT CCAGGCGGCCGAG-3’ |
| Sequence-based reagent | IκBα_R | This paper | PCR primer | 5’-ACGCGTCGACTCAT AACGTCAGACGCTG-3’ |
| Peptide, recombinant protein | FL IKK2 WT | (Polley et al., 2013) PMID:23776406 | Sf9-baculovirus expression system | |
| Peptide, recombinant protein | FL IKK2 K44M | This paper | Sf9-baculovirus expression system | |
| Peptide, recombinant protein | FL IKK2 AA | This paper | Sf9-baculovirus expression system | |
| Peptide, recombinant protein | FL IKK2 Y169F | This paper | Sf9-baculovirus expression system | |
| Peptide, recombinant protein | FL IKK2 EE | (Polley et al., 2013) PMID:23776406 | Sf9-baculovirus expression system | |
| Peptide, recombinant protein | (1-700) IKK2 EE | (Polley et al., 2013) PMID:23776406 | Sf9-baculovirus expression system | |
| Peptide, recombinant protein | (1-664) IKK2 EE | (Shaul et al., 2008) PMID:18657515 | Sf9-baculovirus expression system | |
| Peptide, recombinant protein | FL IκBα WT | (Hauenstein et al., 2014) PMID:24611898 | Bacterial expression system | |
| Peptide, recombinant protein | FL IκBα AA | (Hauenstein et al., 2014) PMID:24611898 | Bacterial expression system | |
| Peptide, recombinant protein | (1-54) IκBα WT | (Polley et al., 2013) PMID:23776406 | Bacterial expression system | |
| Peptide, recombinant protein | (1-54) IκBα S32A | This paper | Bacterial expression system | |
| Peptide, recombinant protein | (1-54) IκBα S32E | This paper | Bacterial expression system | |
| Peptide, recombinant protein | (1-54) IκBα S36A | This paper | Bacterial expression system | |
| Peptide, recombinant protein | (1-54) IκBα S36E | This paper | Bacterial expression system | |
| Peptide, recombinant protein | (1-54) IκBα AA | (Hauenstein et al., 2014) PMID:24611898 | Bacterial expression system | |
| Peptide, recombinant protein | FL NEMO WT | This paper | Bacterial expression system | |
| Commercial assay or kit | PureLink HiPure Plasmid Miniprep Kit | Invitrogen | Cat# K210002 | For Bacmid prep |
| Commercial assay or kit | QIAquick Gel Extraction Kit | Qiagen | Cat# 28704 | For Gel extraction |
| Chemical compound, drug | IKK Inhibitor VII | Calbiochem | CAS 873225-46-8 | IKK inhibitor |
| Chemical compound, drug | Staurosporine | Sigma-Aldrich | S5921 | Kinase inhibitor |
| Chemical compound, drug | TPCA | Abcam | ab145522 | IKK inhibitor |
| Software, algorithm | GROMACS | GROMACS | RRID:SCR_014565 | |
| Software, algorithm | UCSF Chimera | UCSF Chimera | RRID:SCR_004097 | |
| Software, algorithm | AutoDock Vina | AutoDock Vina | RRID:SCR_011958 | |
| Software, algorithm | CHARMM | CHARMM | RRID:SCR_014892 |
Additional files
-
Supplementary file 1
MaxQuant output file (Excel file) of LC MS/MS analysis for FL IKK2 K44M.
- https://cdn.elifesciences.org/articles/98009/elife-98009-supp1-v1.xlsx
-
Supplementary file 2
Number of unique peptides, spectral counts, and iBAQ values from mass spectrometric analysis of FL IKK2 K44M shown in 3D scatter plot in Figure 1—figure supplement 1D.
- https://cdn.elifesciences.org/articles/98009/elife-98009-supp2-v1.xlsx
-
Supplementary file 3
Details for the 200ns energy trajectory of three differently phosphorylated states of IKK2 - UnP-IKK2, p-IKK2, and P-IKK2 shown in Figure 4A.
- https://cdn.elifesciences.org/articles/98009/elife-98009-supp3-v1.xlsx
-
Supplementary file 4
Details for the 200ns of RMSD of three differently phosphorylated states of IKK2 - UnP-IKK2, p-IKK2, and P-IKK2 shown in Figure 4B.
- https://cdn.elifesciences.org/articles/98009/elife-98009-supp4-v1.xlsx
-
Supplementary file 5
Details for the 200ns of RMSF of three differently phosphorylated states of IKK2 - UnP-IKK2, p-IKK2, and P-IKK2 shown in Figure 4—figure supplement 1C.
- https://cdn.elifesciences.org/articles/98009/elife-98009-supp5-v1.xlsx
-
Supplementary file 6
Ratios of the average intensity of the phosphorylated protein with respect to the intensity of total protein for each lane plotted in Figure 5—figure supplement 1A.
- https://cdn.elifesciences.org/articles/98009/elife-98009-supp6-v1.xlsx
-
Supplementary file 7
Data points for the Differential Scanning Calorimetry experiment shown in Figure 4—figure supplement 1A.
- https://cdn.elifesciences.org/articles/98009/elife-98009-supp7-v1.xlsx
-
MDAR checklist
- https://cdn.elifesciences.org/articles/98009/elife-98009-mdarchecklist1-v1.pdf
Download links
A two-part list of links to download the article, or parts of the article, in various formats.
Downloads (link to download the article as PDF)
Open citations (links to open the citations from this article in various online reference manager services)
Cite this article (links to download the citations from this article in formats compatible with various reference manager tools)
Dual-specific autophosphorylation of kinase IKK2 enables phosphorylation of substrate IκBα through a phosphoenzyme intermediate
eLife 13:RP98009.
https://doi.org/10.7554/eLife.98009.4


