Dynamics of compartment-specific proteomic landscapes of hepatotoxic and cholestatic models of liver fibrosis
- Laboratory of Integrative Biology, Institute of Molecular Genetics of the Czech Academy of Sciences, Czech Republic
- Laboratory of Mass Spectrometry, BIOCEV, Faculty of Science, Charles University, Czech Republic
- Department of Mathematics, Informatics and Cybernetics, University of Chemistry and Technology, Czech Republic
- Department of Animal Physiology, Faculty of Science, Charles University, Czech Republic
- Clinical and Transplant Pathology Centre, Institute for Clinical and Experimental Medicine, Czech Republic
- Department of Pathology, The Third Faculty of Medicine, Charles University and University Hospital Kralovske Vinohrady, Czech Republic
- Helmholtz Munich, Research Unit Precision Regenerative Medicine; Comprehensive Pneumology Center, Member of the German Center for Lung Research (DZL), Germany
- Institute of Experimental Pneumology, LMU University Hospital, Ludwig-Maximilians University, Germany
Figures
Figure 1 with 2 supplements
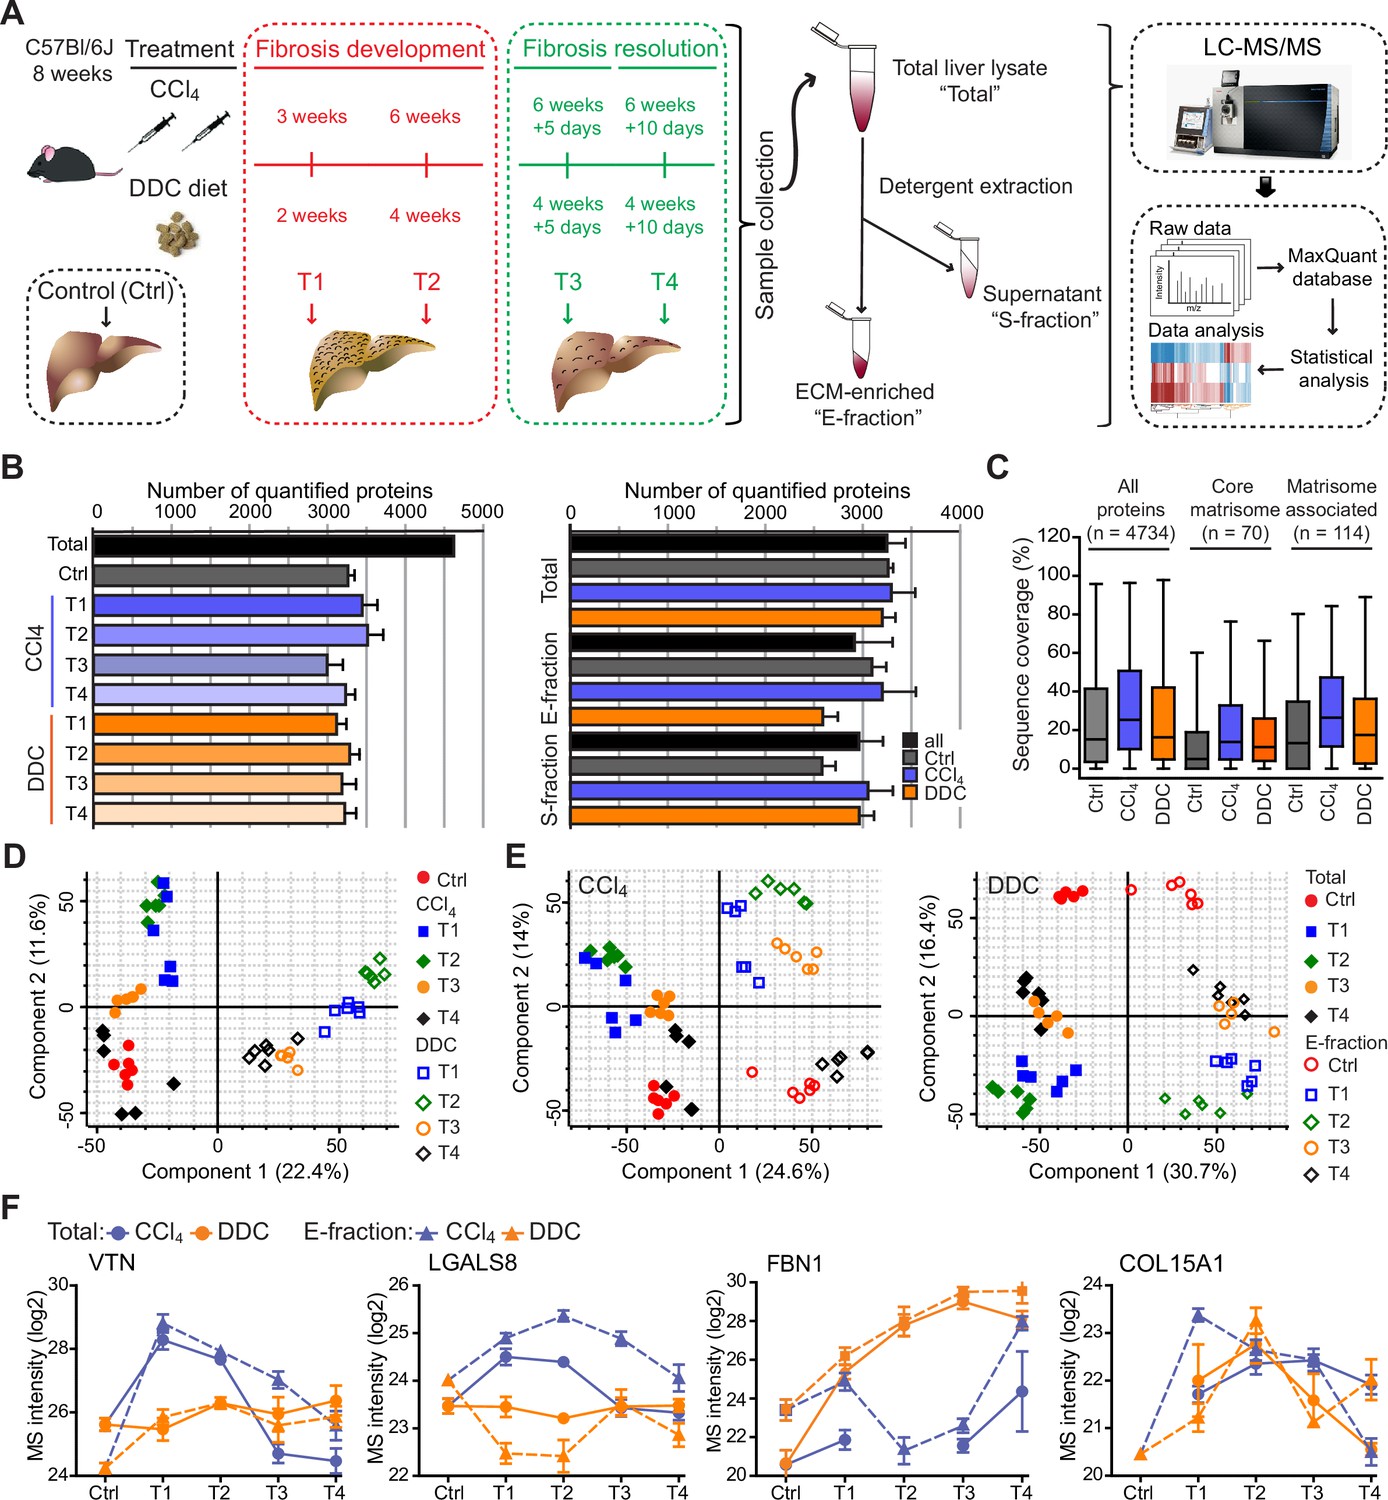
Hepatotoxic and cholestatic injury generate distinct time-resolved and compartment-specific protein signatures.
(A) Schematic overview of the experimental setup. Six animals were used in each model at each time point. (B) Numbers of quantified proteins at the indicated time points and experimental conditions; n=6. (C) Box plot shows the distribution of protein sequence coverage (coverage of possible tryptic peptides per protein in %) for the indicated matrisome categories (as defined by Naba et al., 2012) and all detected proteins in experimental conditions indicated. (D) Principal component analysis (PCA) of Total proteome separates time-dependent fibrogenesis and healing in carbon tetrachloride (CCl4)- (closed symbols) and 3,5-diethoxycarbonyl-1,4-dihydrocollidine (DDC)- (open symbols) induced fibrosis. The first two components of data variability of 3624 proteins identified in Total liver fractions in CCl4 and 3521 proteins in DDC are shown; n=6. (E) PCA shows the separation of Total (closed symbols) and E-fraction (open symbols) proteomes in time; the first two components of data variability are shown; n=6. (F) Line plots show time-dependent changes in mass spectrometry (MS) intensities in Total (solid line) and E-fraction (broken line) proteomes for indicated selected proteins in CCl4 and DDC models; n=4–6.
Figure 1—figure supplement 1
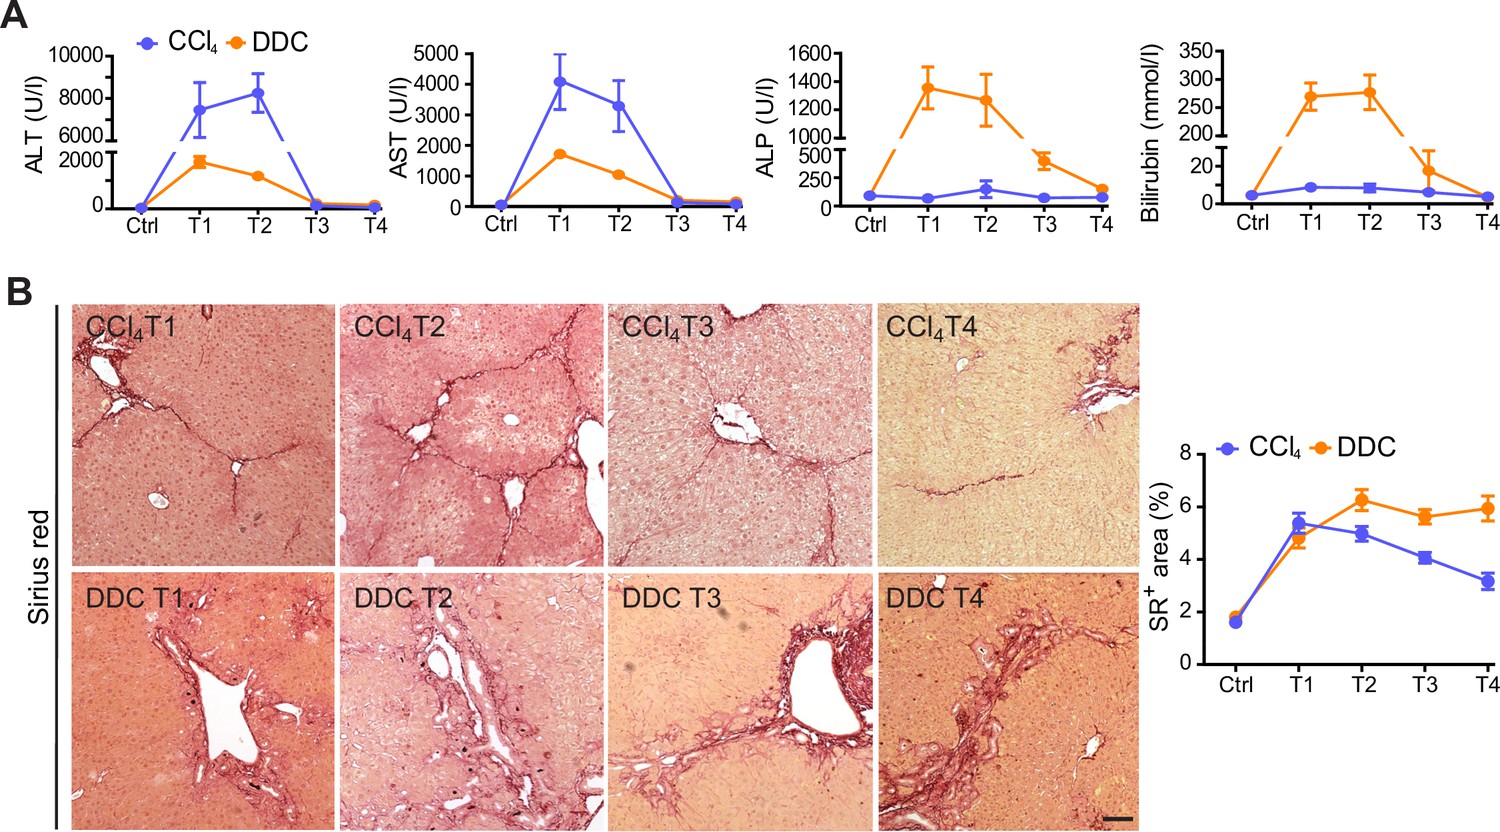
Liver damage markers and collagen deposits in carbon tetrachloride (CCl4) and 3,5-diethoxycarbonyl-1,4-dihydrocollidine (DDC) models.
(A) Serum levels of alanine aspartate transaminase (ALT), aspartate transaminase (AST), alkaline phosphatase (ALP), and bilirubin determined from CCl4- and DDC-treated mice at indicated time points. (B) Representative images of Sirius red (SR)-stained liver sections from mice treated with CCl4 or DDC document time course in fibrosis development and partial resolution. Scale bar = 50 μm. Line plot shows the quantification of collagen deposits in each time point shown as a percentage of the SR+ area per liver section; n=6.
Figure 1—figure supplement 2
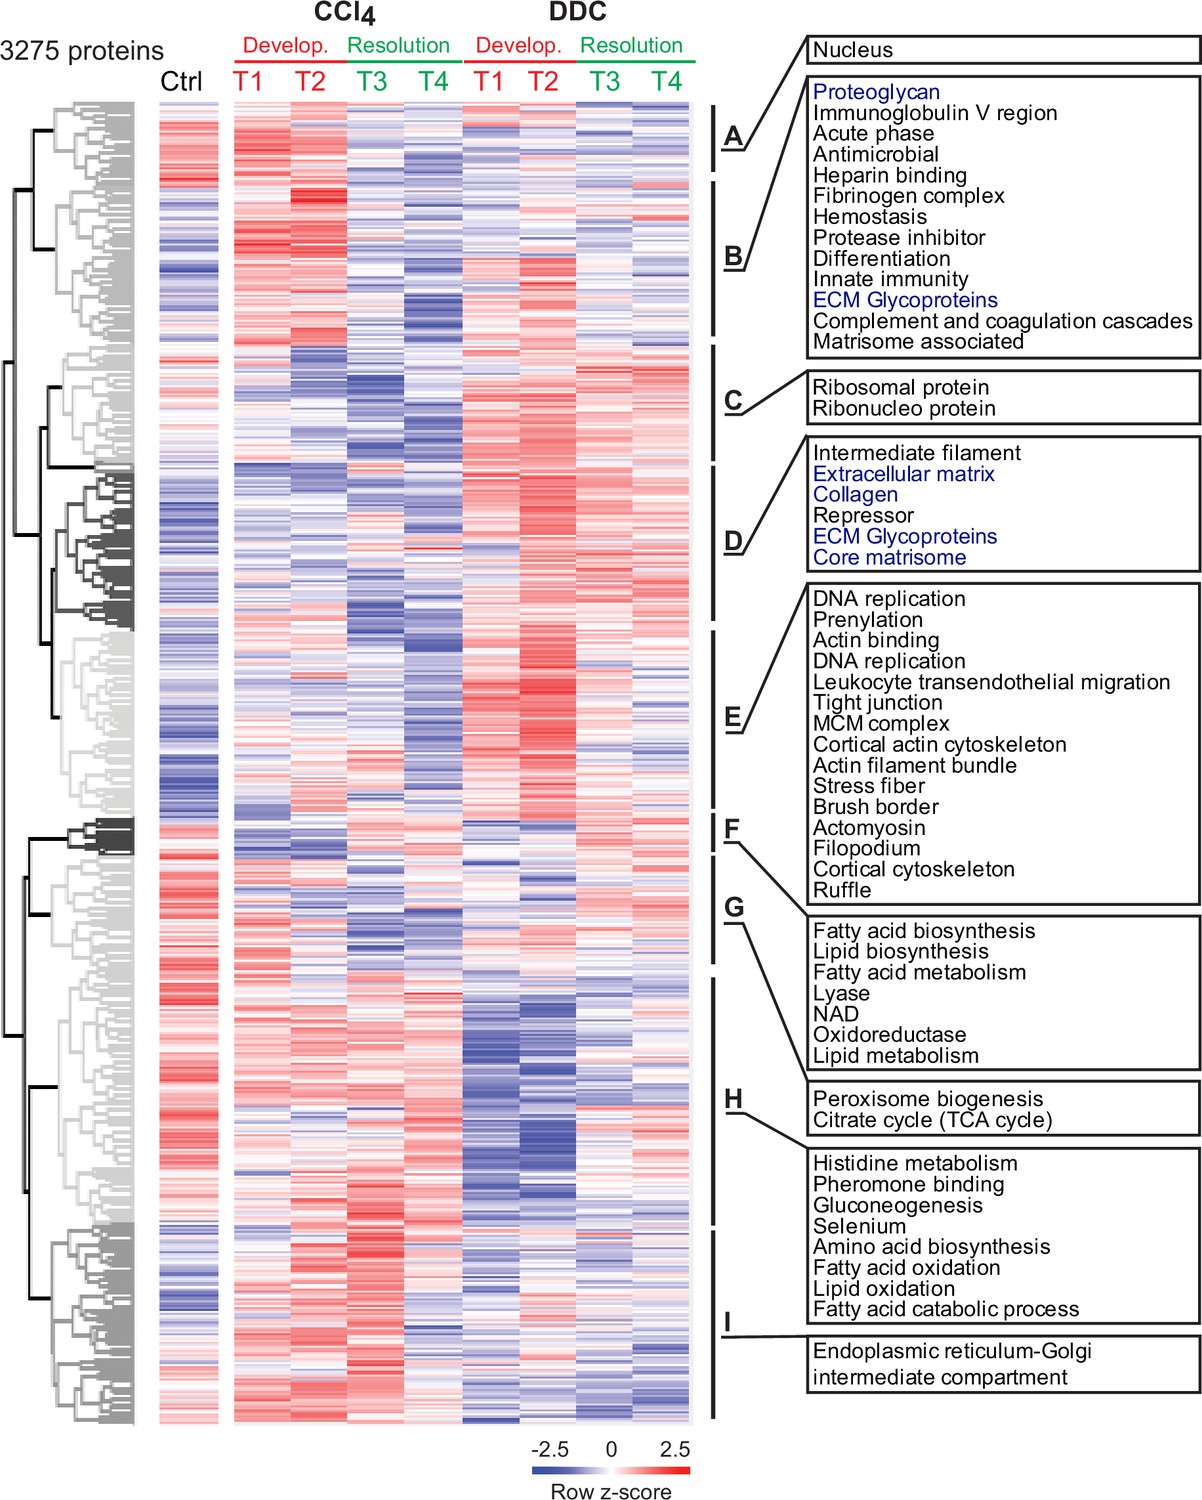
Hierarchical cluster analysis shows the separation of carbon tetrachloride (CCl4)- and 3,5-diethoxycarbonyl-1,4-dihydrocollidine (DDC)-derived Total proteomes.
Unsupervised hierarchical clustering of z-scored mass spectrometry intensities (log 2) of proteins from Total CCl4 and DDC proteomes. UniProtKB keyword enrichment annotations for clusters of proteins (Benjamini-Hochberg false discovery rate <0.04) are shown (extracellular matrix [ECM]-related keywords in blue).
Figure 2 with 2 supplements
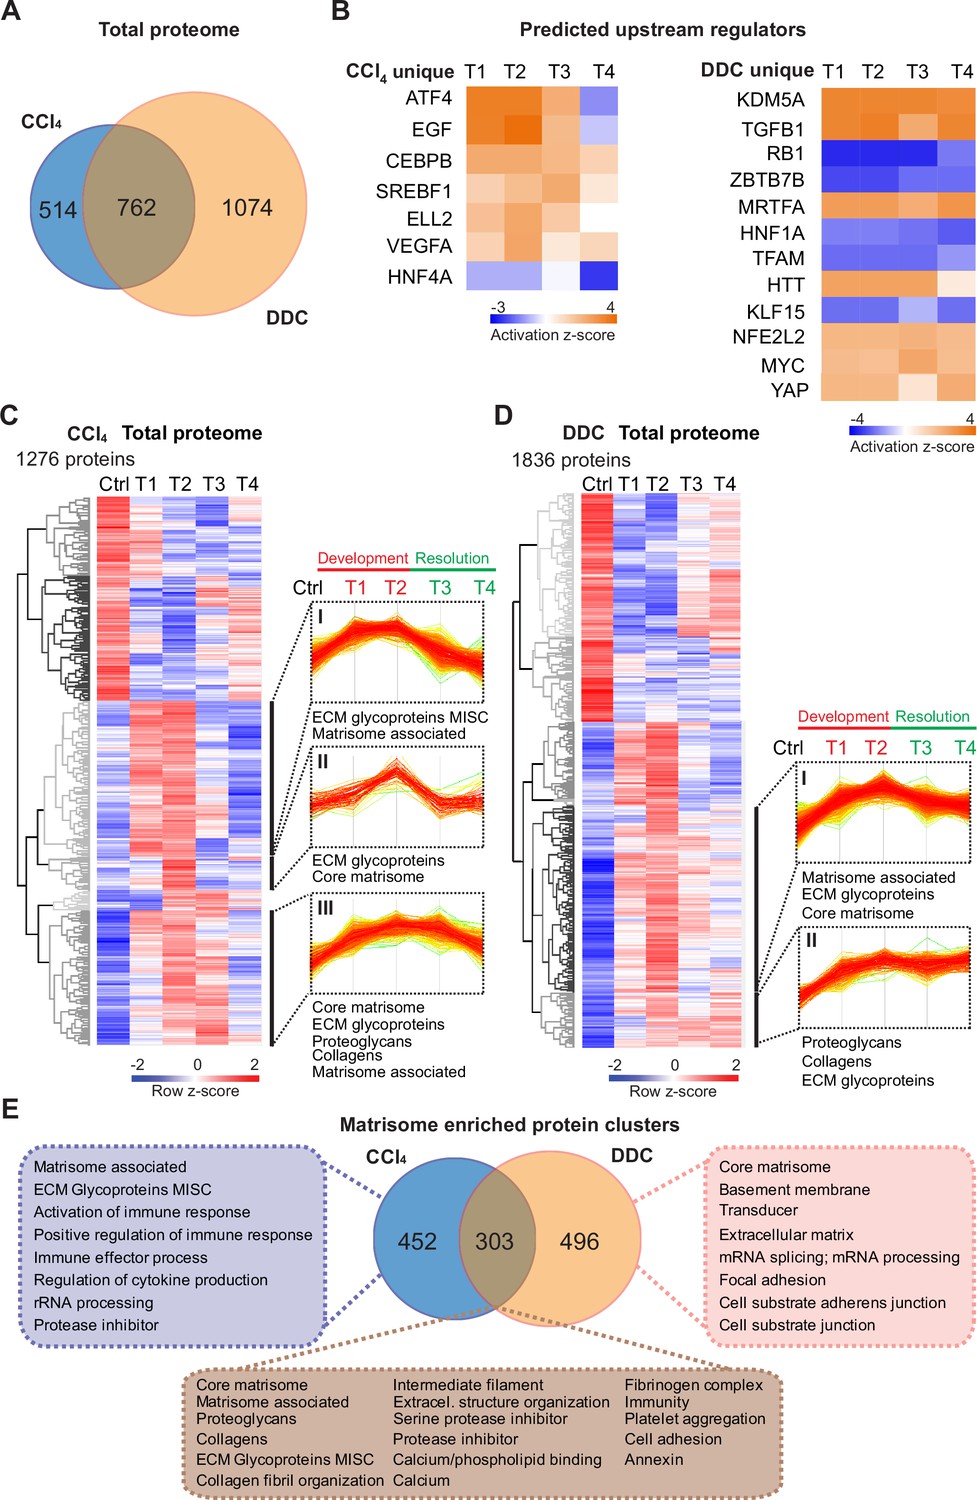
Time-resolved analysis of Total proteomes shows limited healing in matrisome-enriched protein clusters in the cholestatic model.
(A) Venn diagram shows relative proportion of 1276 and 1836 proteins differentially expressed (t-test; Benjamini-Hochberg false discovery rate [BH FDR]<5%) in Total carbon tetrachloride (CCl4) and 3,5-diethoxycarbonyl-1,4-dihydrocollidine (DDC) proteomes, respectively. (B) Hierarchical cluster analysis of the activity score of the upstream regulators at the indicated time points predicted by Ingenuity Pathway Analysis (IPA) from unique CCl4 and DDC protein signatures shown in A. (C, D) Hierarchical clustering of mean z-scored mass spectrometry (MS) intensities of proteins of Total CCl4 (C) or DDC (D) proteomes; n=6. Profiles of z-scored MS intensities of proteins from matrisome-annotated clusters for CCl4 (I–III) and DDC (I and II) models are shown. (E) Venn diagram compares proteins from matrisome-annotated clusters shown in C and D. UniProt keyword enrichment annotation for each group within the diagram is indicated (Fisher’s test, BH FDR<4%).
Figure 2—figure supplement 1
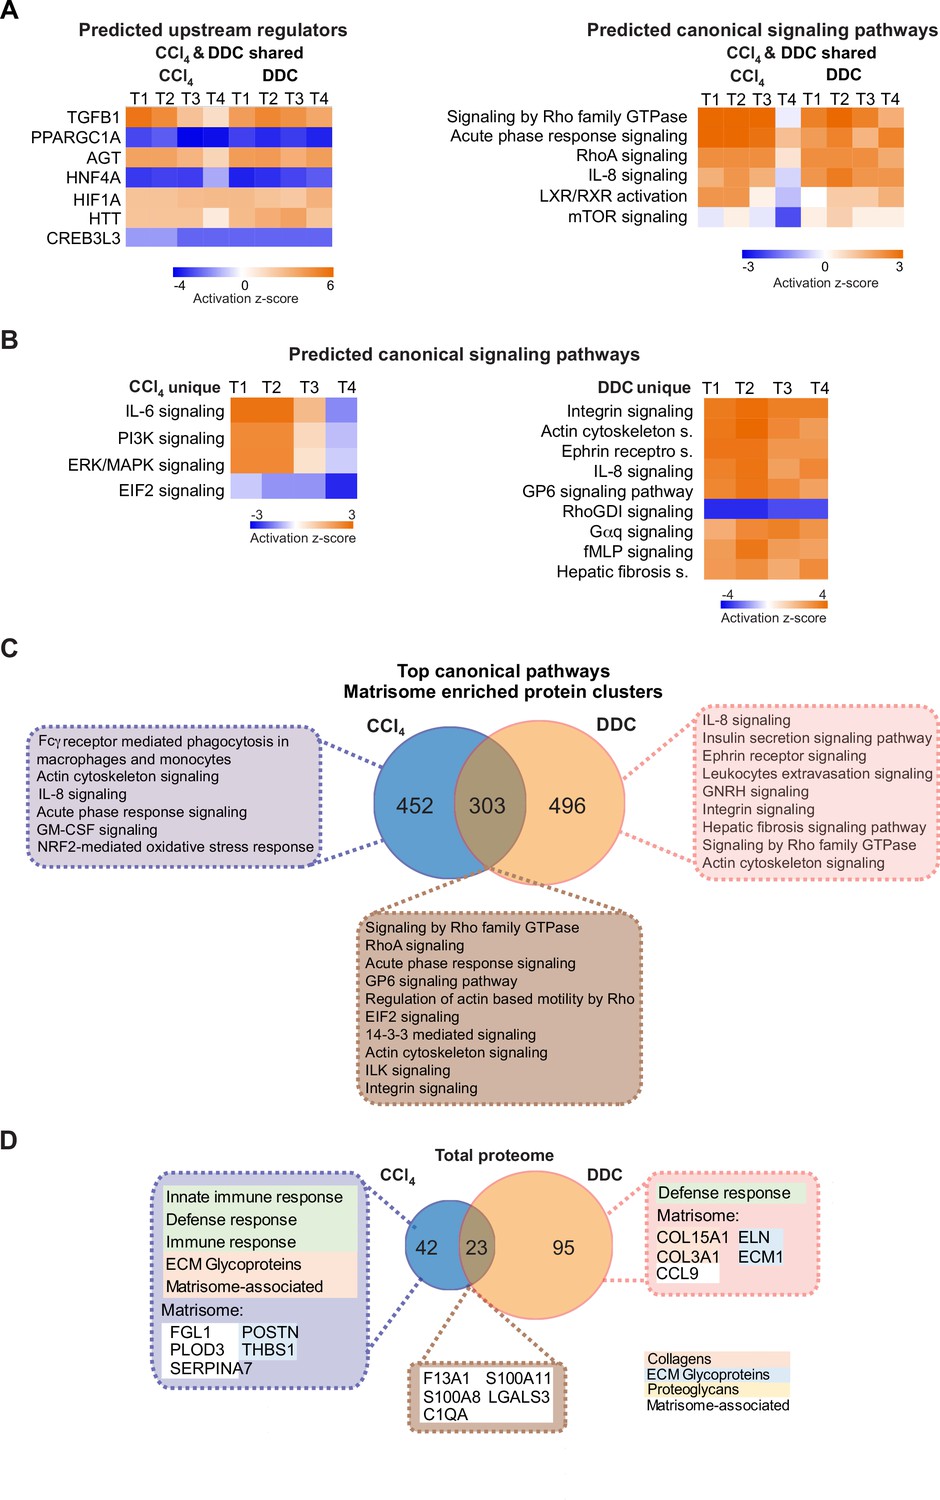
Ingenuity Pathway Analysis (IPA) of upstream regulators and canonical signaling pathways in carbon tetrachloride (CCl4) and 3,5-diethoxycarbonyl-1,4-dihydrocollidine (DDC) models.
(A) Hierarchical cluster analysis of the activity score of the upstream regulators and downstream canonical signaling pathways at the indicated time points predicted by IPA from 762 proteins shared between CCl4 and DDC protein signatures as shown in Figure 2A. (B) Hierarchical cluster analysis of the activity score of the canonical signaling pathways at the indicated time points predicted by IPA from proteins uniquely identified in CCl4 (514) and DDC (1074) Total proteomes. (C) Venn diagram compares proteins from matrisome-annotated clusters as shown in Figure 2A. Top canonical signaling pathways identified by IPA are shown. (D) Venn diagram compares proteins identified as newly induced by fibrosis development in CCl4 and DDC models, highlighting thus qualitative changes in total proteomes induced by fibrogenesis. We identified 65 newly induced proteins in CCl4- and 118 in DDC-treated livers. Top canonical signaling pathways identified by IPA associated with CCl4-induced proteins and selected matrisome-annotated proteins are shown. Matrisome proteins are highlighted with color coding to indicate identified matrisome categories.
Figure 2—figure supplement 2
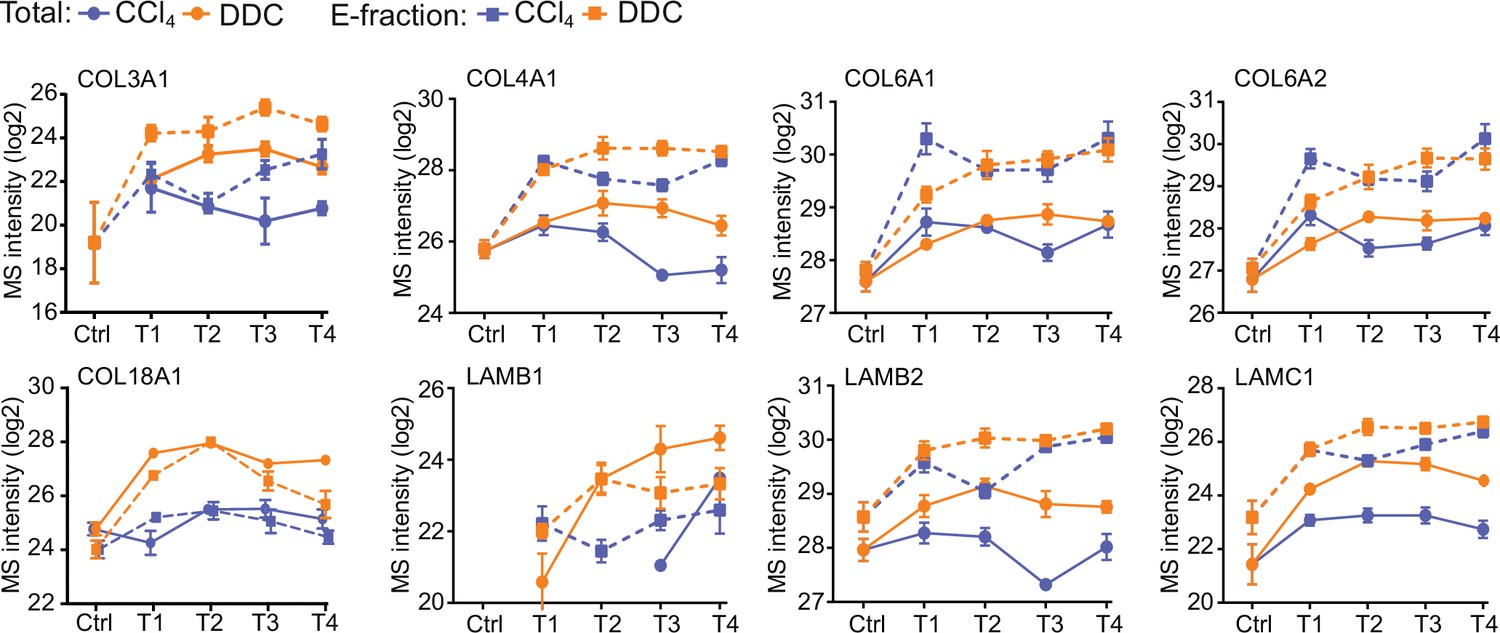
Collagens and laminins identified in Total proteomes.
The line plots show the time-dependent change in mass spectrometry intensities of indicated selected collagens and laminins in Total (solid line) and E-fraction (broken line) proteomes in carbon tetrachloride (CCl4) and 3,5-diethoxycarbonyl-1,4-dihydrocollidine (DDC) models; n=4–6.
Figure 3
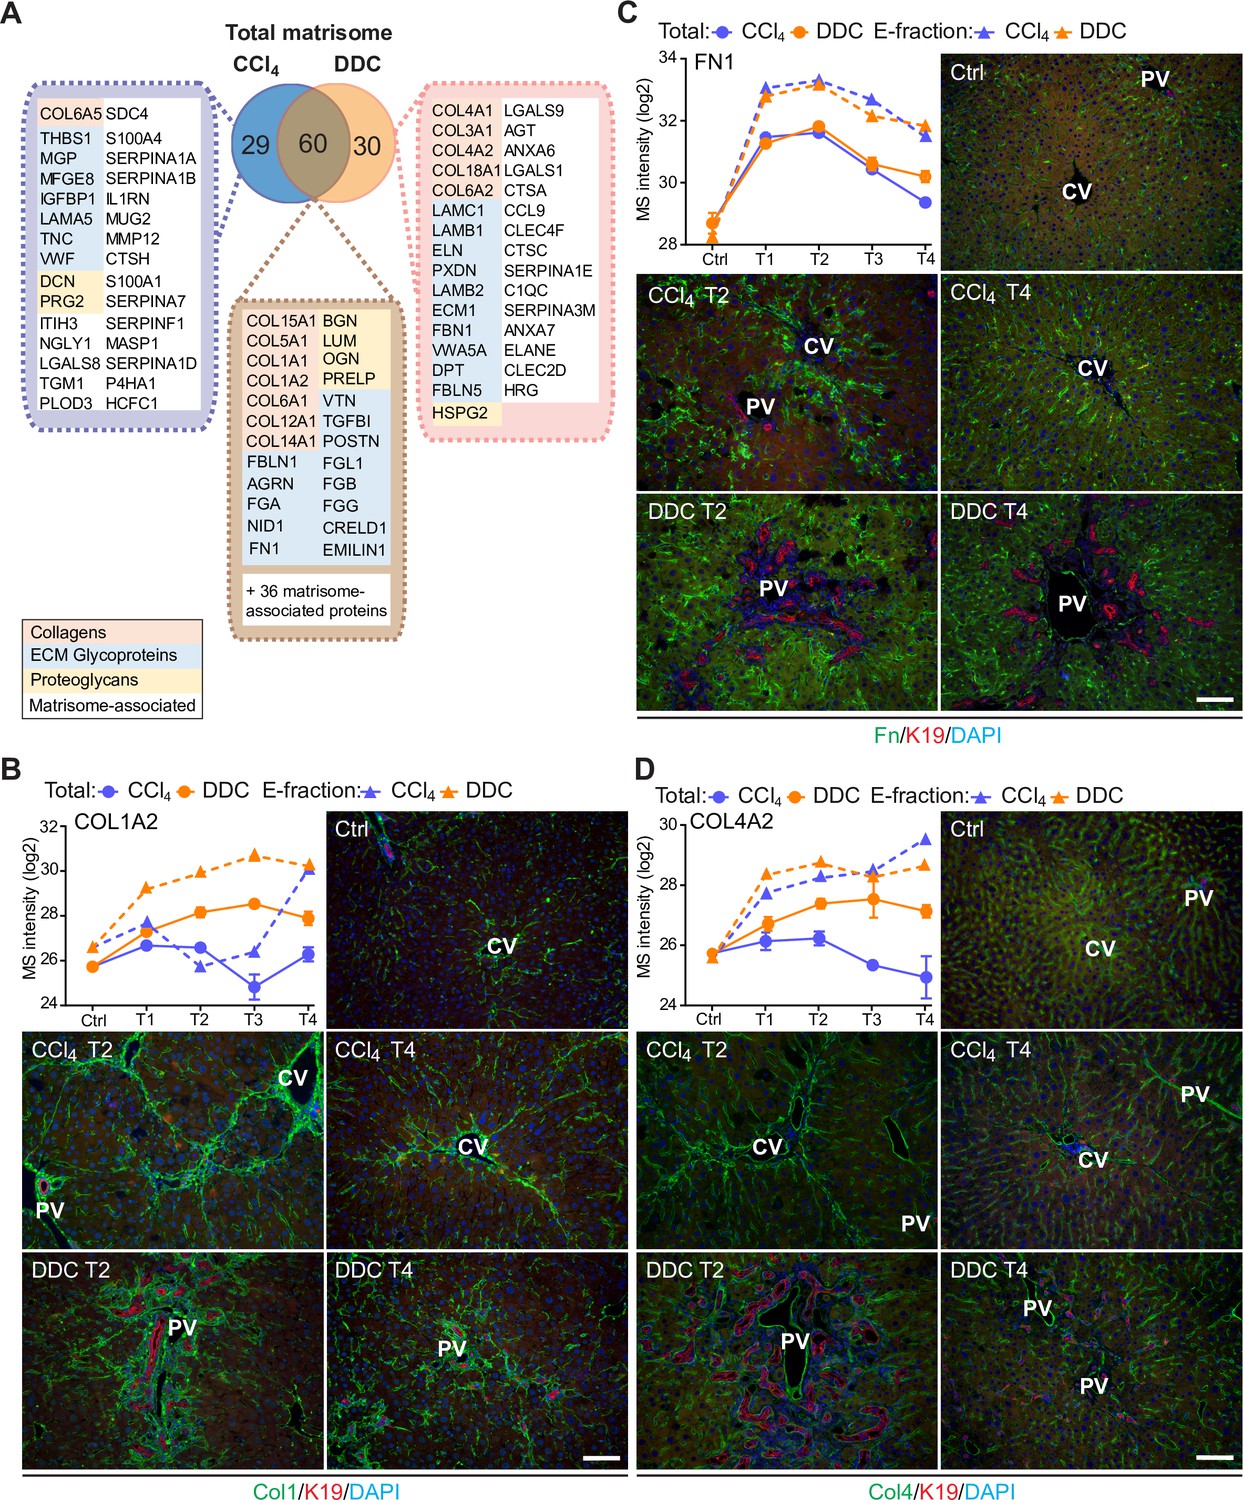
Comparison of matrisome proteins differentially expressed between the carbon tetrachloride (CCl4)- and 3,5-diethoxycarbonyl-1,4-dihy- drocollidine (DDC)-derived Total proteomes with immunofluorescence (IF) localization of the main core matrisome proteins within the injured livers.
(A) Venn diagram shows a comparison of matrisome proteins differentially enriched in Total CCl4 and DDC proteomes. Color coding indicates identified matrisome categories. (B–D) Representative IF images of collagen type I (B), fibronectin (C), and collagen type IV (D), all in green in liver sections from untreated controls (Ctrl), CCl4-, and DDC-treated mice at time points of fibrosis development (T2) and resolution (T4). Bile ducts were visualized with antibodies to keratin 19 (K19; red); nuclei were stained with DAPI (blue). CV, central vein; PV, portal vein. Scale bar = 100 μm. Line plots show time-dependent change in respective mass spectrometry (MS) intensities in Total (solid line) and E-fraction (broken line) proteomes in CCl4 and DDC models; n=4–6.
Figure 4 with 2 supplements
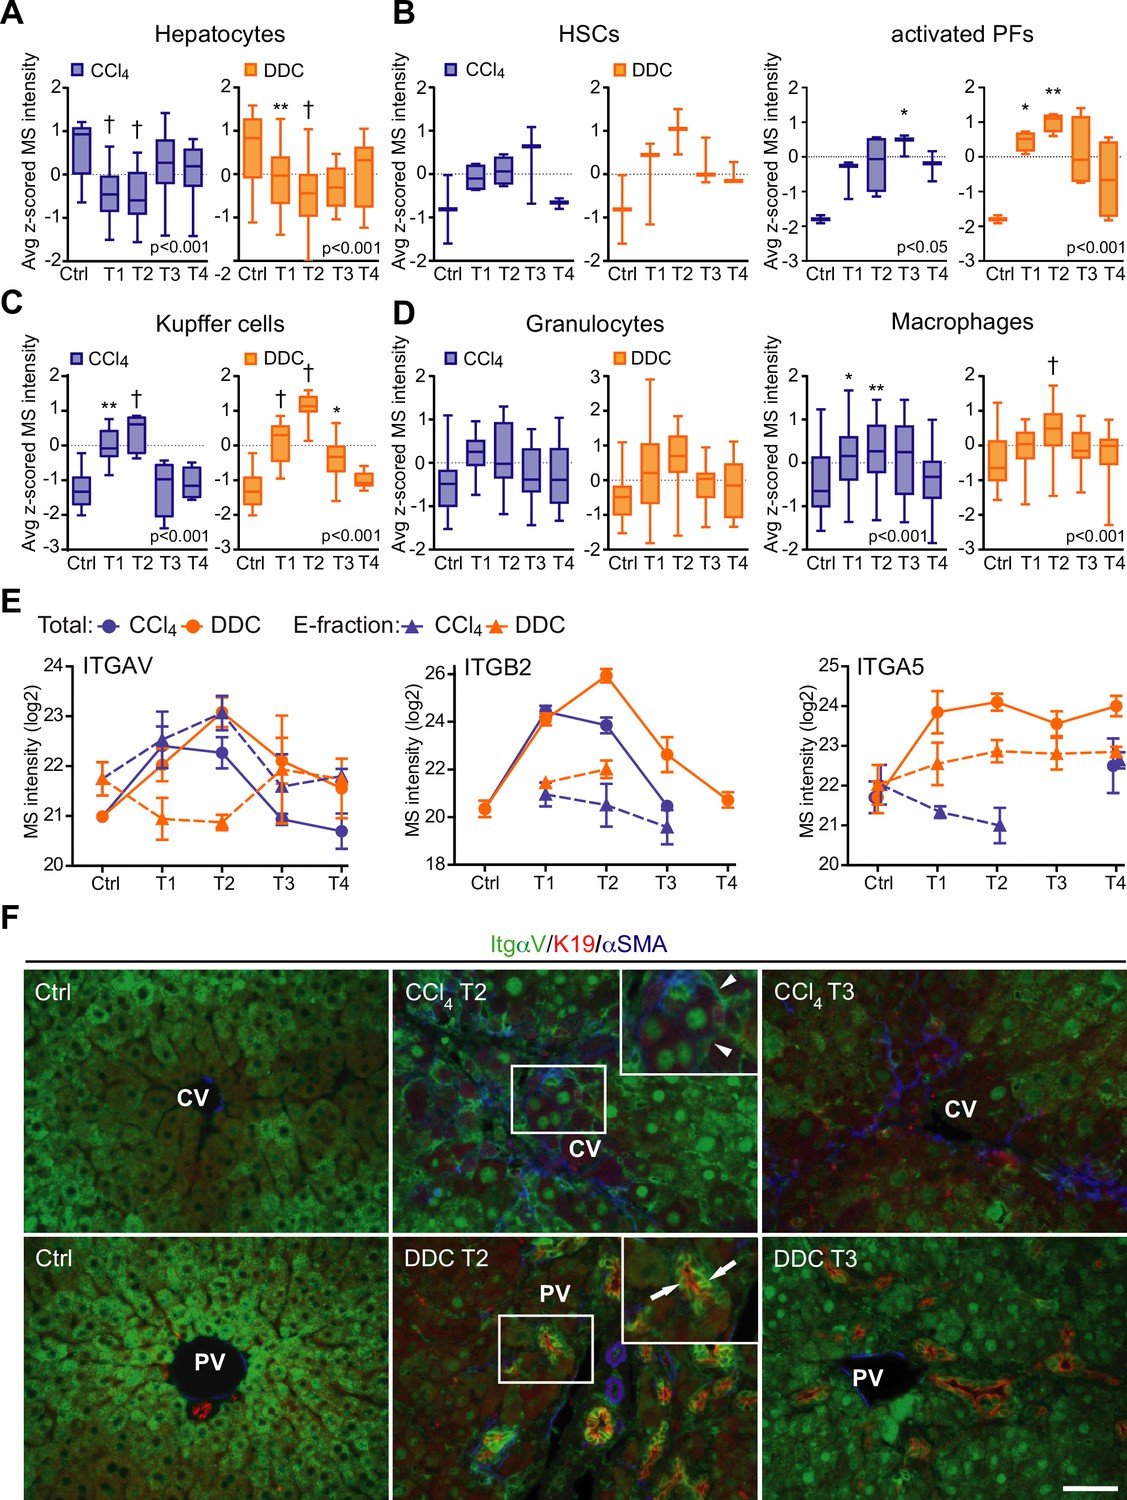
Liver cell-type dynamics and cell-type-specific integrin expression during fibrogenesis and healing.
(A–D) Box plots show mean z-scored mass spectrometry (MS) intensities of the indicated cell-type-specific protein signatures in time. Hepatocytes (A; n=18), hepatic stellate cells (HSCs), and activated portal fibroblasts (PFs) (B; n=3 and 4), Kupffer cells (C; n=6), granulocytes, and macrophages (D; n=16 and 33). One-way ANOVA with Bonferroni’s post-test; *p<0.05; **p<0.01; †p<0.001. (E) The line plots show the time-dependent change in MS intensities of indicated selected integrins in Total (solid line) and E-fraction (broken line) proteomes in carbon tetrachloride (CCl4) and 3,5-diethoxycarbonyl-1,4-dihydrocollidine (DDC) models; n=4–6. (F) Representative immunofluorescence images of liver sections from untreated controls (Ctrl), CCl4-, and DDC-treated mice at time points of fibrosis development (T2) and resolution (T3) immunolabeled for integrin αv (green), K19 (red), and αSMA (blue). Arrowheads, integrin αv-positive injured hepatocytes; arrows, integrin αv-positive biliary epithelial cells of reactive ductuli. CV, central vein; PV, portal vein. Boxed areas, ×2 images. Scale bar = 50 μm.
Figure 4—figure supplement 1
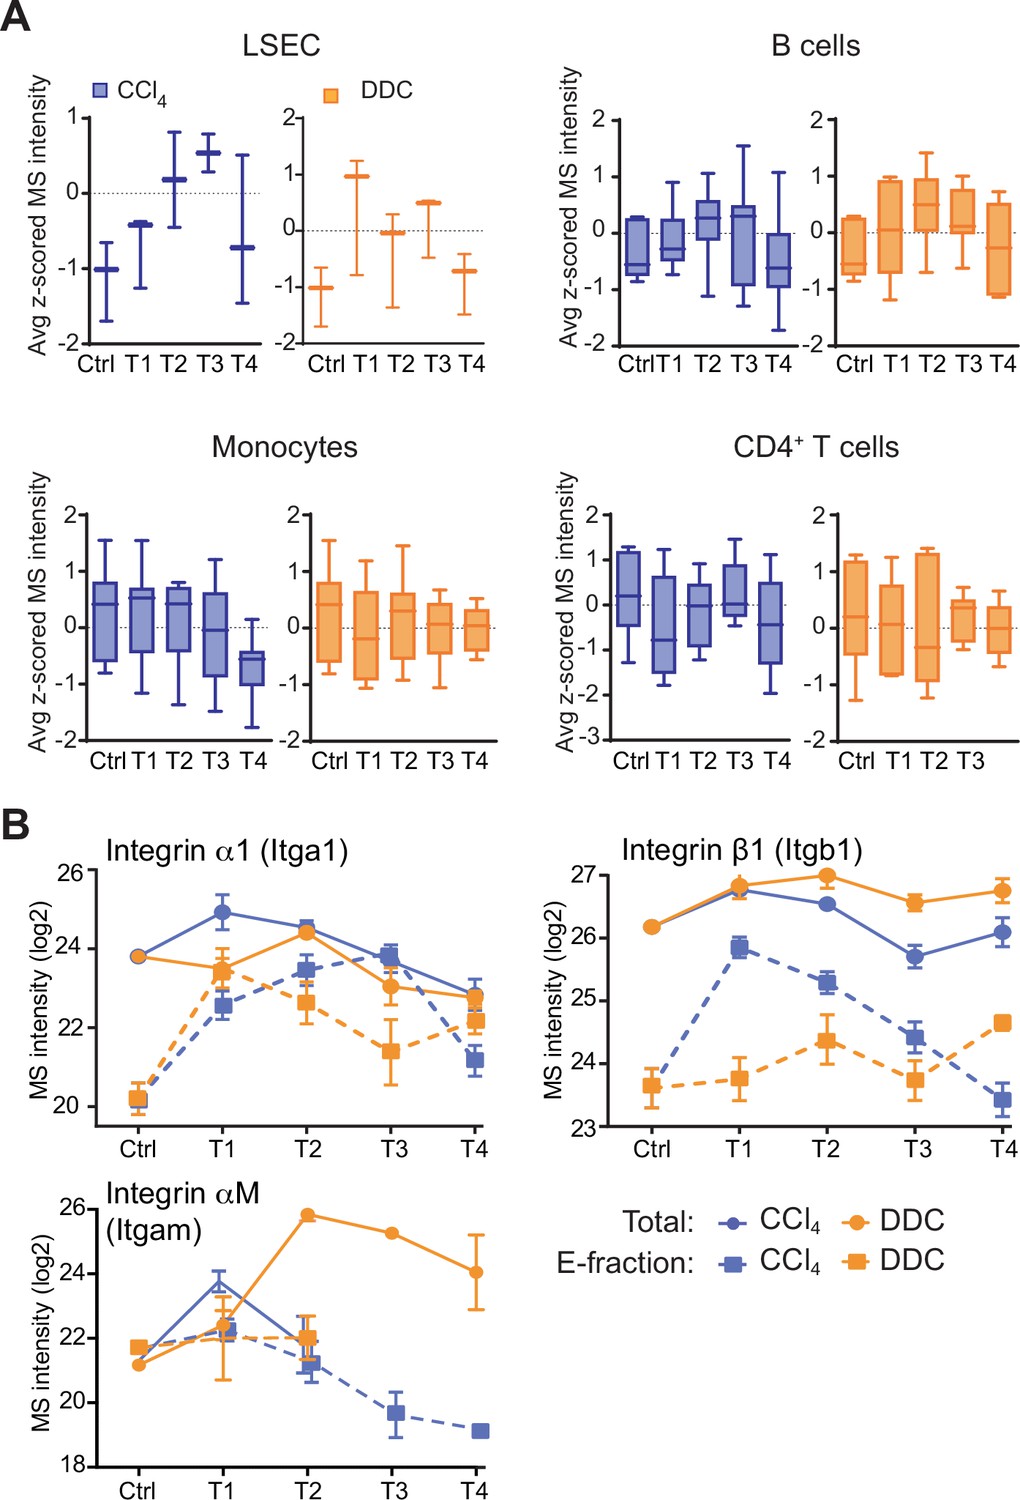
Dynamics of liver sinusoidal endothlial cells (LSECs) and immune cells with their cell-type-specific integrin expression profiles.
(A) Box plots show mean z-scored mass spectrometry (MS) intensities of the indicated cell-type-specific protein signatures in time. LSECs (n=3), B cells (n=7), monocytes (n=12), and CD4+ T-cells (n=6). (B) The line plots show the change in MS intensities of indicated selected integrins in Total (solid line) and E-fraction (broken line) proteomes in carbon tetrachloride (CCl4) and 3,5-diethoxycarbonyl-1,4-dihy- drocollidine (DDC) models; n=4–6.
Figure 4—figure supplement 2
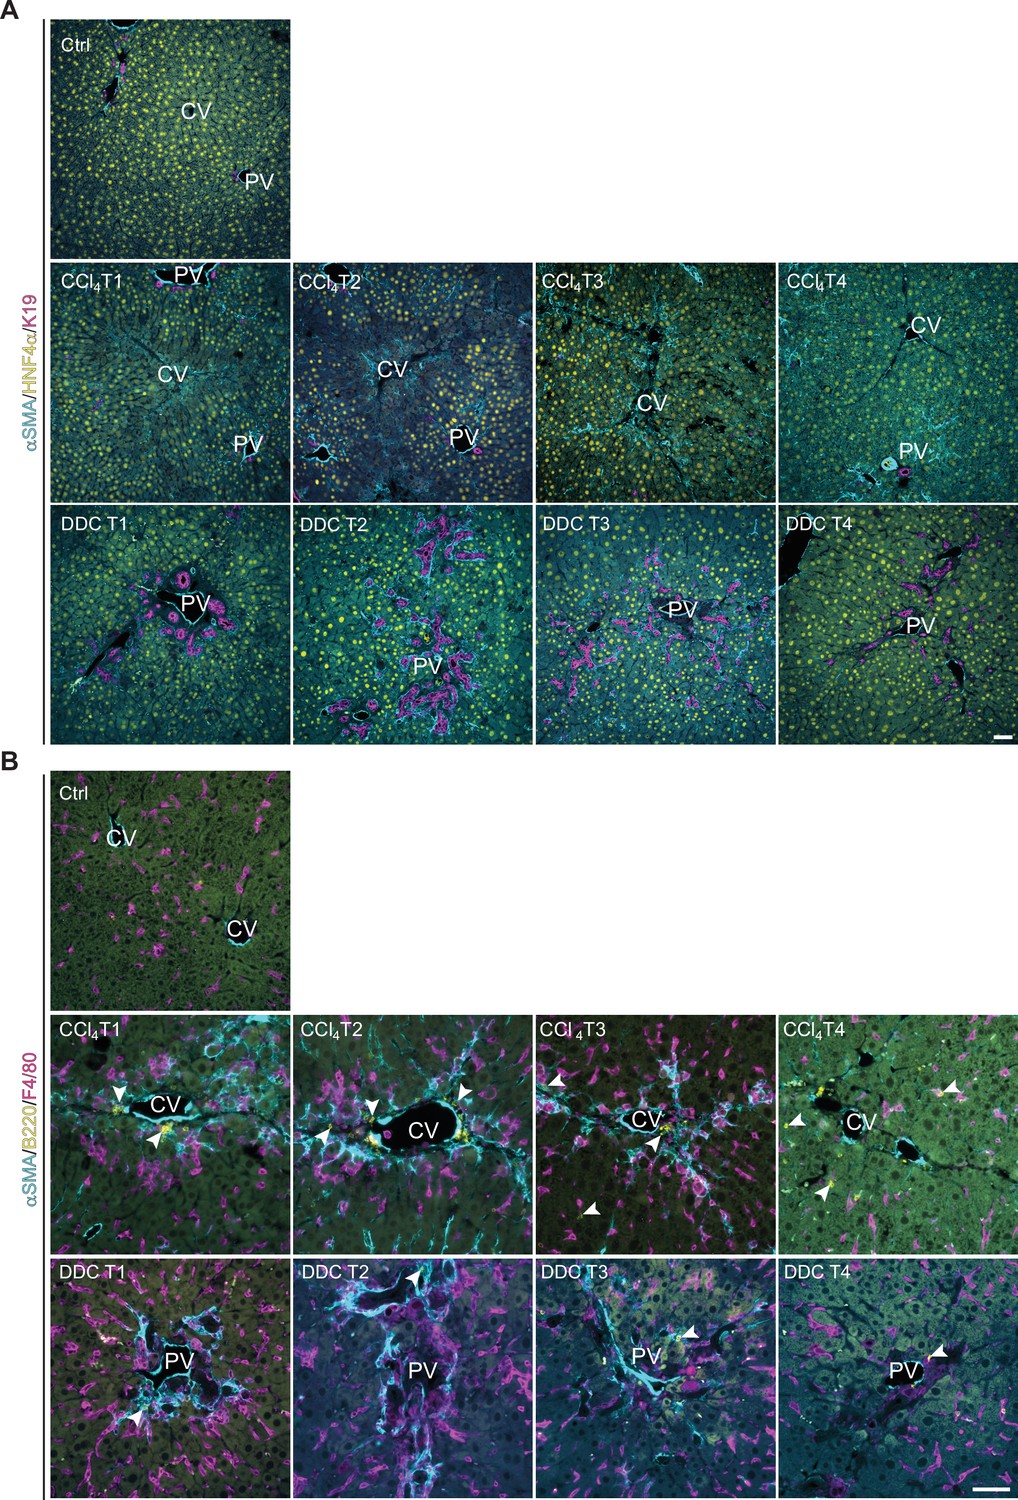
Liver cell-type-specific dynamics development during fibrogenesis and healing documented by immunofluorescence microscopy corroborates the mass spectrometry (MS)-derived cell-type-specific signature dynamics.
(A, B) Representative immunofluorescence (IF) images of liver sections from untreated controls (Ctrl), carbon tetrachloride (CCl4)-, and 3,5-diethoxycarbonyl-1,4-dihydrocollidine (DDC)-treated mice at time points of fibrosis development (T1, T2) and resolution (T3, T4) immunolabeled for indicated cell-type-specific markers. (A) HNF4α (yellow; detecting changes in hepatocyte abundance), αSMA (cyan; detecting activated hepatic stellate cells [HSCs] and portal fibroblasts), and K19 (magenta; detecting cholangiocytes). (B) B-cell marker (B220, yellow) and macrophage/monocyte/Kupffer cell marker (F4/80; magenta) together with αSMA (cyan) antibody show the role of the inflammation component in the context of fibrosis development and resolution in both models. Arrowheads, B cells recruited to the sites of injury. CV, central vein; PV, portal vein. Scale bar = 50 μm.
Figure 5 with 1 supplement
Solubility profiling provides in-depth analysis of model-specific matrisome composition.
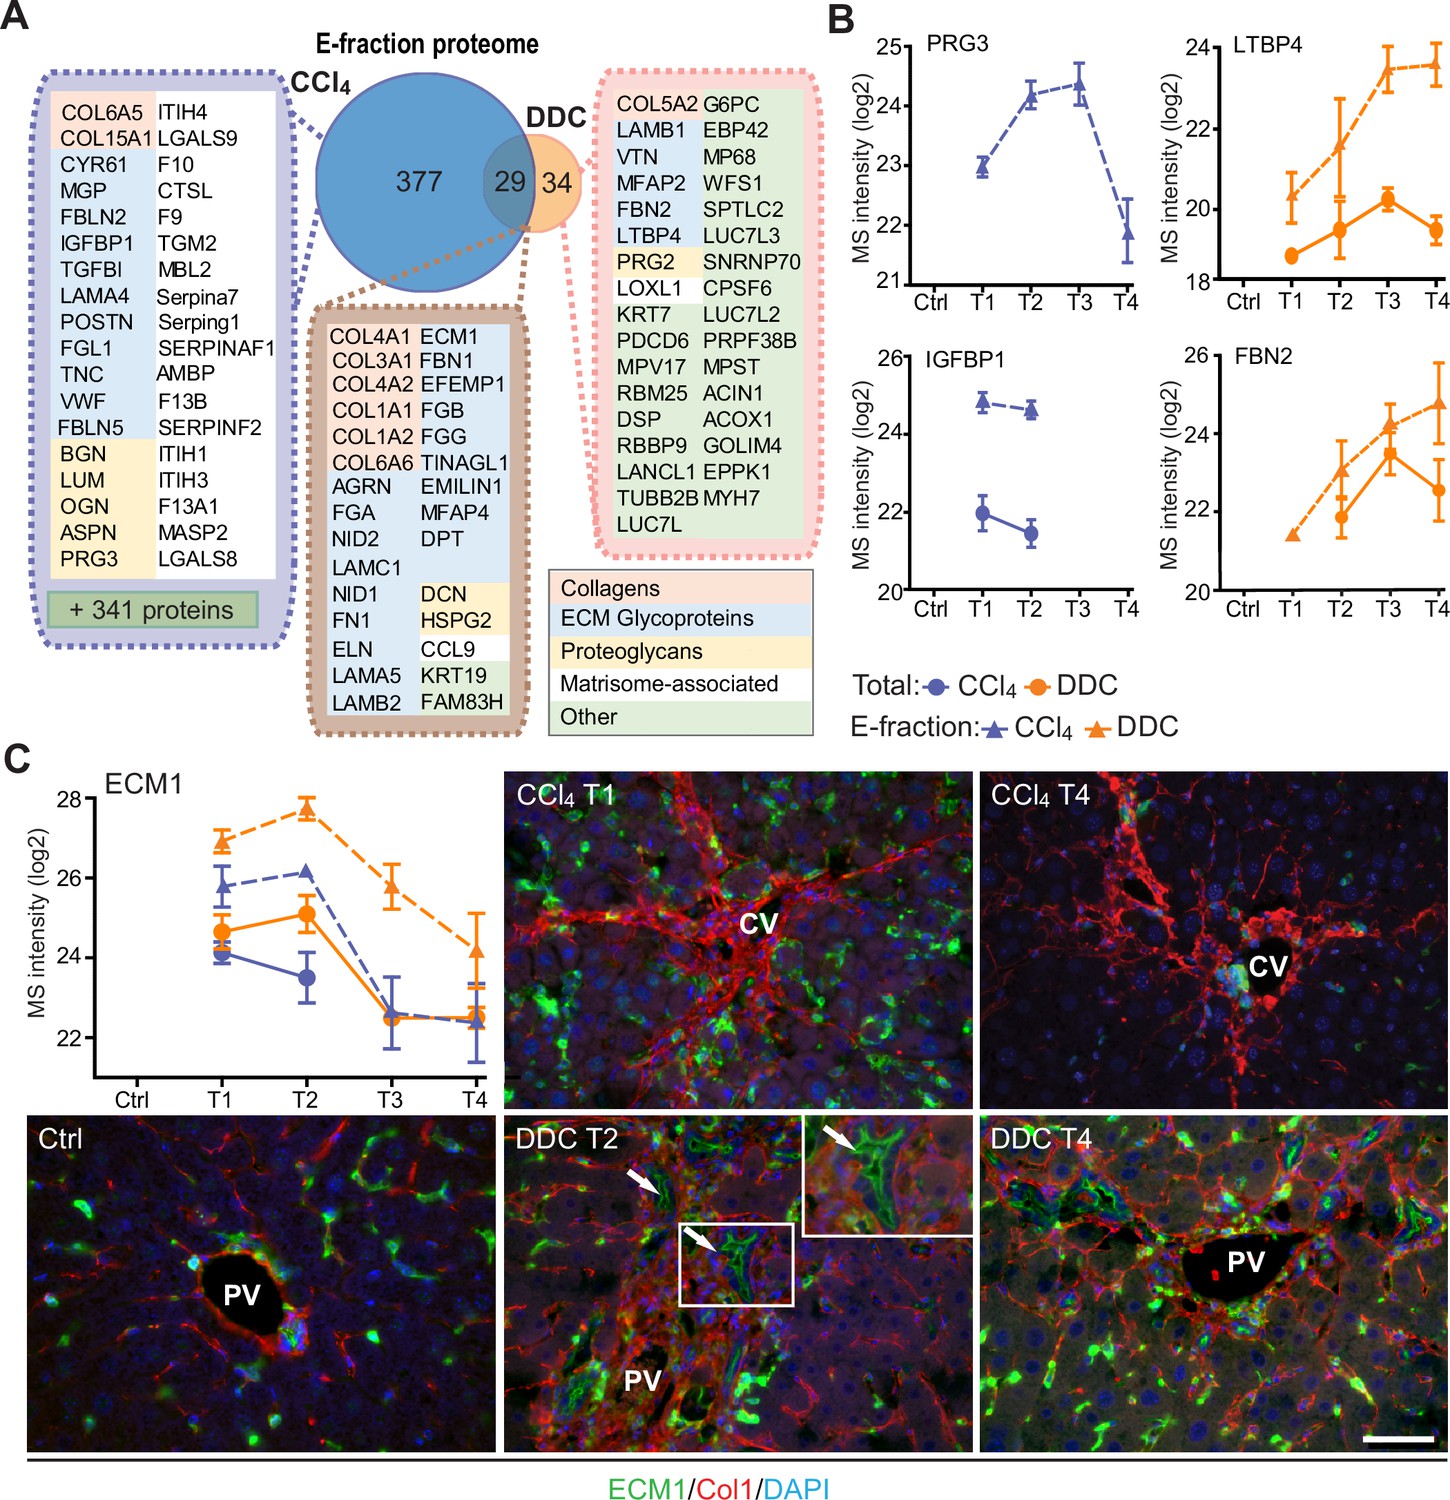
(A) Venn diagram shows relative proportion of proteins from E-fraction proteome identified as proteins with increasing insolubility over the course of fibrosis in each model (see Figure 5—figure supplement 1A and B and Materials and methods). Matrisome proteins are highlighted with color coding to indicate identified matrisome categories. (B, C) Line plots show time-dependent change in mass spectrometry (MS) intensities of indicated selected matrisome proteins uniquely identified in E-fraction (broken line) proteomes in carbon tetrachloride (CCl4) and 3,5-diethoxycarbonyl-1,4-dihydrocollidine (DDC) models; n=4–6. (Solid line shows MS intensity profile in Total proteome.) (C) Representative immunofluorescence images of liver sections from untreated controls (Ctrl), CCl4-, and DDC-treated mice at indicated time points of fibrosis development (T1 and T2) and resolution (T4) immunolabeled for ECM1 (green) and collagen type I (red). Nuclei were stained with DAPI (blue). Arrows, ECM1-positive reactive biliary epithelial cells. CV, central vein; PV, portal vein. Boxed areas, ×2 images. Scale bar = 50 μm.
Figure 5—figure supplement 1
Analysis of matrisome proteins identified in carbon tetrachloride (CCl4)- and 3,5-diethoxycarbonyl-1,4-dihydrocollidine (DDC)-derived E-fraction proteomes.
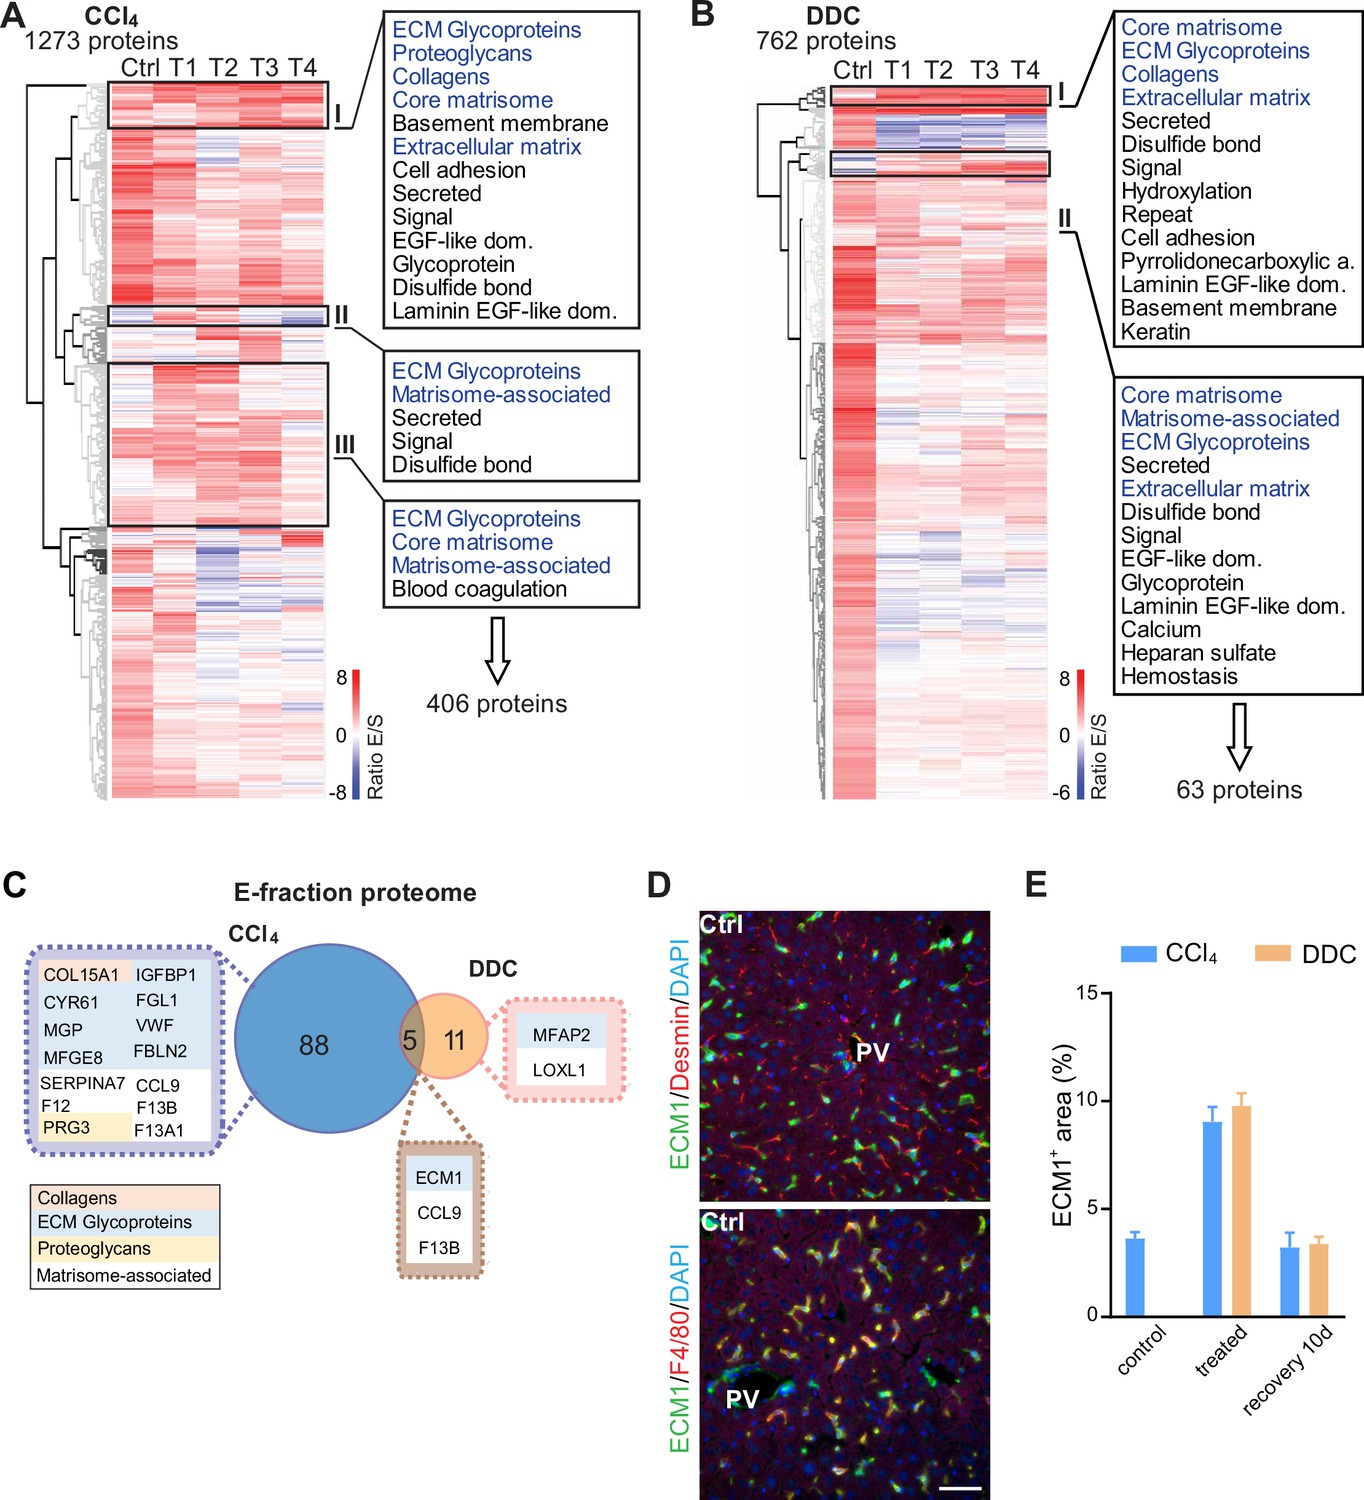
(A, B) Unsupervised hierarchical clustering of mass spectrometry intensity ratios (E-fraction/S-fraction) of proteins differentially expressed in E-fraction in CCl4 (A) and DDC (B) model. UniProtKB keyword enrichment annotations for clusters of proteins (CCl4 clusters I–III in A; DDC clusters I and II in B) with decreasing solubility over the course of fibrosis are shown (extracellular matrix [ECM]-related keywords in blue). (C) Venn diagram shows a comparison of matrisome proteins detected during fibrosis development (T1 and T2) but not in control samples in E-fraction proteomes of CCl4 and DDC model. Color coding indicates identified matrisome categories. (D) Representative immunofluorescence images of liver sections from untreated controls (Ctrl) immunolabeled for ECM1 (green) and desmin (red; upper panel) or F4/80 (red; lower panel). Nuclei were stained with DAPI (blue). Note the colocalization of ECM1 with F4/80 positive cells (in yellow; lower panel). PV, portal vein. Scale bar = 50 μm. (E) Bar graph shows the quantification of percentage of ECM1+ area per field of view (using ×40 objective) within the injury affected area (CV area in CCl4 model and PV area in DDC model) at selected time points.
Figure 6 with 3 supplements
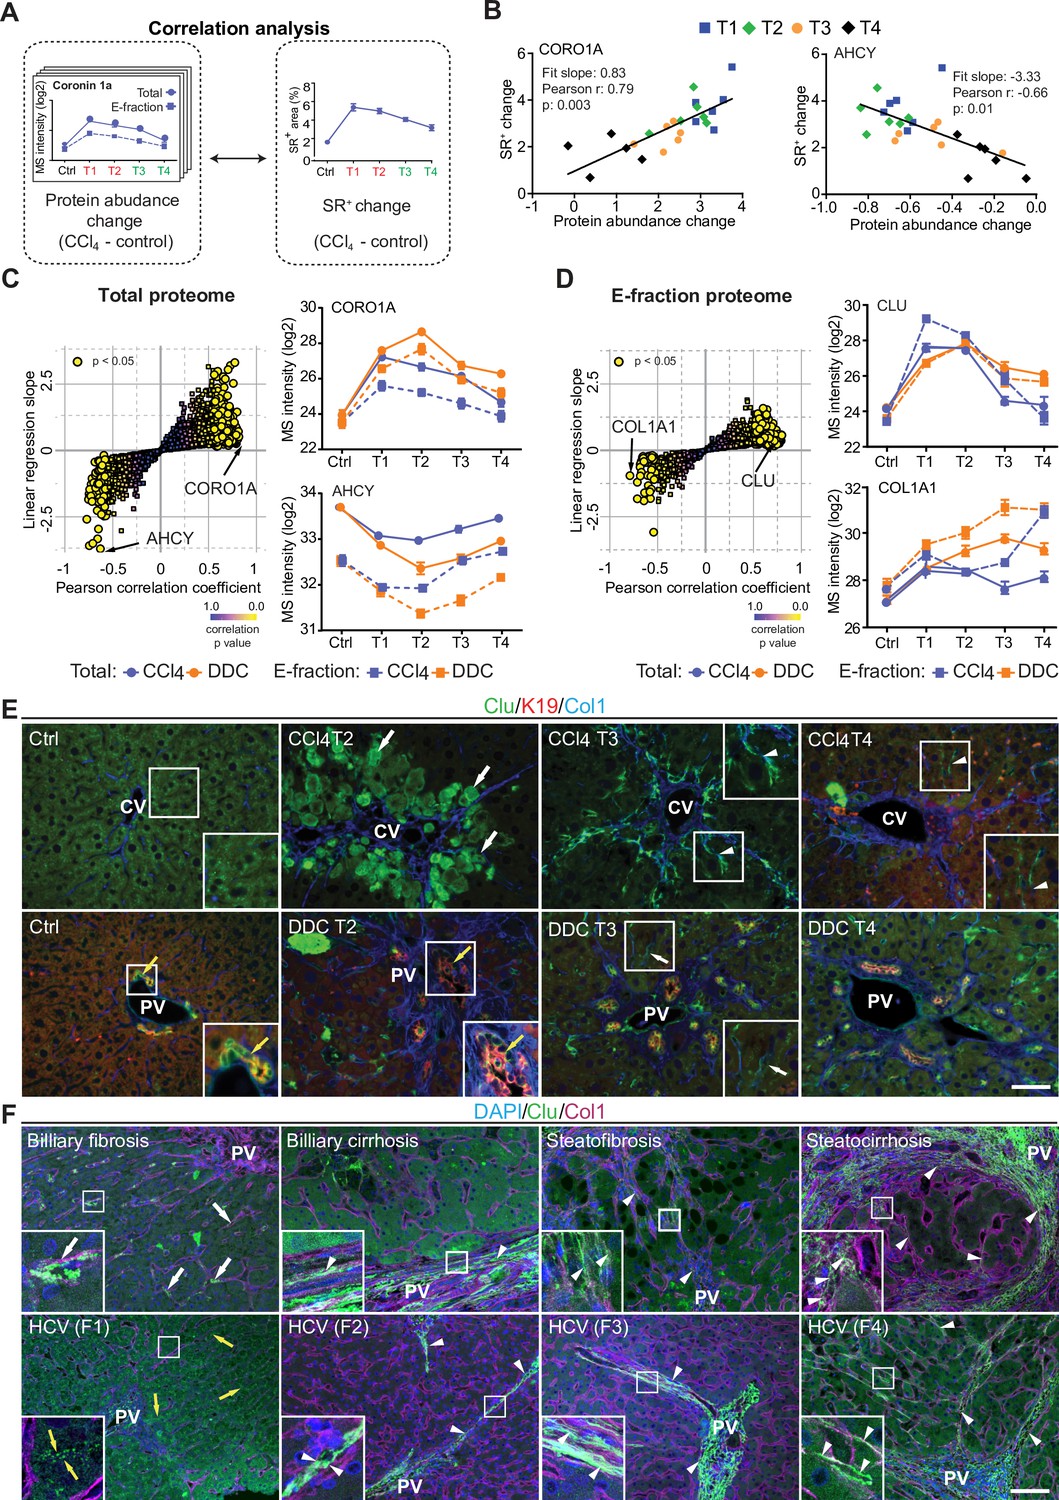
Correlation analysis of protein abundance and changes in fibrotic deposits in the hepatotoxic model associates clusterin with fibrosis resolution.
(A) Schematic illustrates the correlation of protein abundance changes with changes in sirius red-positive (SR+) areas of fibrous extracellular matrix (ECM) deposits in carbon tetrachloride (CCl4)-treated animals at the indicated time points. (B) The regulator of the actin cytoskeleton, coronin 1a (CORO1A), serves as an example of a protein with a positive slope of the correlation fit. The methionine cycle enzyme, adenosylhomocysteinase (AHCY), serves as an example of a protein with a negative slope of the correlation fit. (C, D) The scatter plots show the linear regression slope and the Pearson correlation coefficient for proteins of CCl4 Total (C), and E-fraction (D) proteomes. Statistical significance of the correlation is color-coded as indicated. The line plots show time-dependent change in mass spectrometry (MS) intensities of indicated representative proteins with significant correlation in Total (solid line) and E-fraction (broken line) proteomes in CCl4 and 3,5-diethoxycarbonyl-1,4-dihydrocollidine (DDC) models; n=4–6. (E) Representative immunofluorescence (IF) images of liver sections from untreated controls (Ctrl), CCl4-, and DDC-treated mice at indicated time points of fibrosis development (T2) and resolution (T3 and T4) immunolabeled for clusterin (Clu, green), keratin 19 (K19, red), and collagen type I (Col1, blue). Arrowheads, clusterin staining signal delineating collagen deposits; arrows, clusterin-positive injured hepatocytes; yellow arrows, clusterin-positive biliary epithelial cells. CV, central vein; PV, portal vein. Boxed areas, ×2 images. Scale bar = 50 μm. (F) Representative IF images of human liver sections from different stages of chronic liver diseases of various etiologies (biliary-type, steatotic liver disease, and chronic hepatitis C [HCV] infection) immunolabeled for clusterin (Clu, green) and collagen type I (Col1, magenta). Nuclei were stained with DAPI (blue). Top row shows increase in clusterin expression along collagen fibrils in biliary-type and metabolic syndrome-related cirrhosis compared to the stage of mild fibrosis. Bottom row documents change in clusterin staining pattern with chronic HCV progression from fibrosis stage F1 to stage F4 (METAVIR grading system: F1, portal fibrosis; F2, periportal fibrosis; F3, bridging septal fibrosis; F4, cirrhosis). Arrowheads, clusterin staining delineating collagen deposits; arrows, clusterin-positive capillarized sinusoids; yellow arrows, clusterin-positive bile canaliculi (stage F1 only). PV, portal vein. Boxed areas, ×4 images. Scale bar = 50 μm.
Figure 6—figure supplement 1
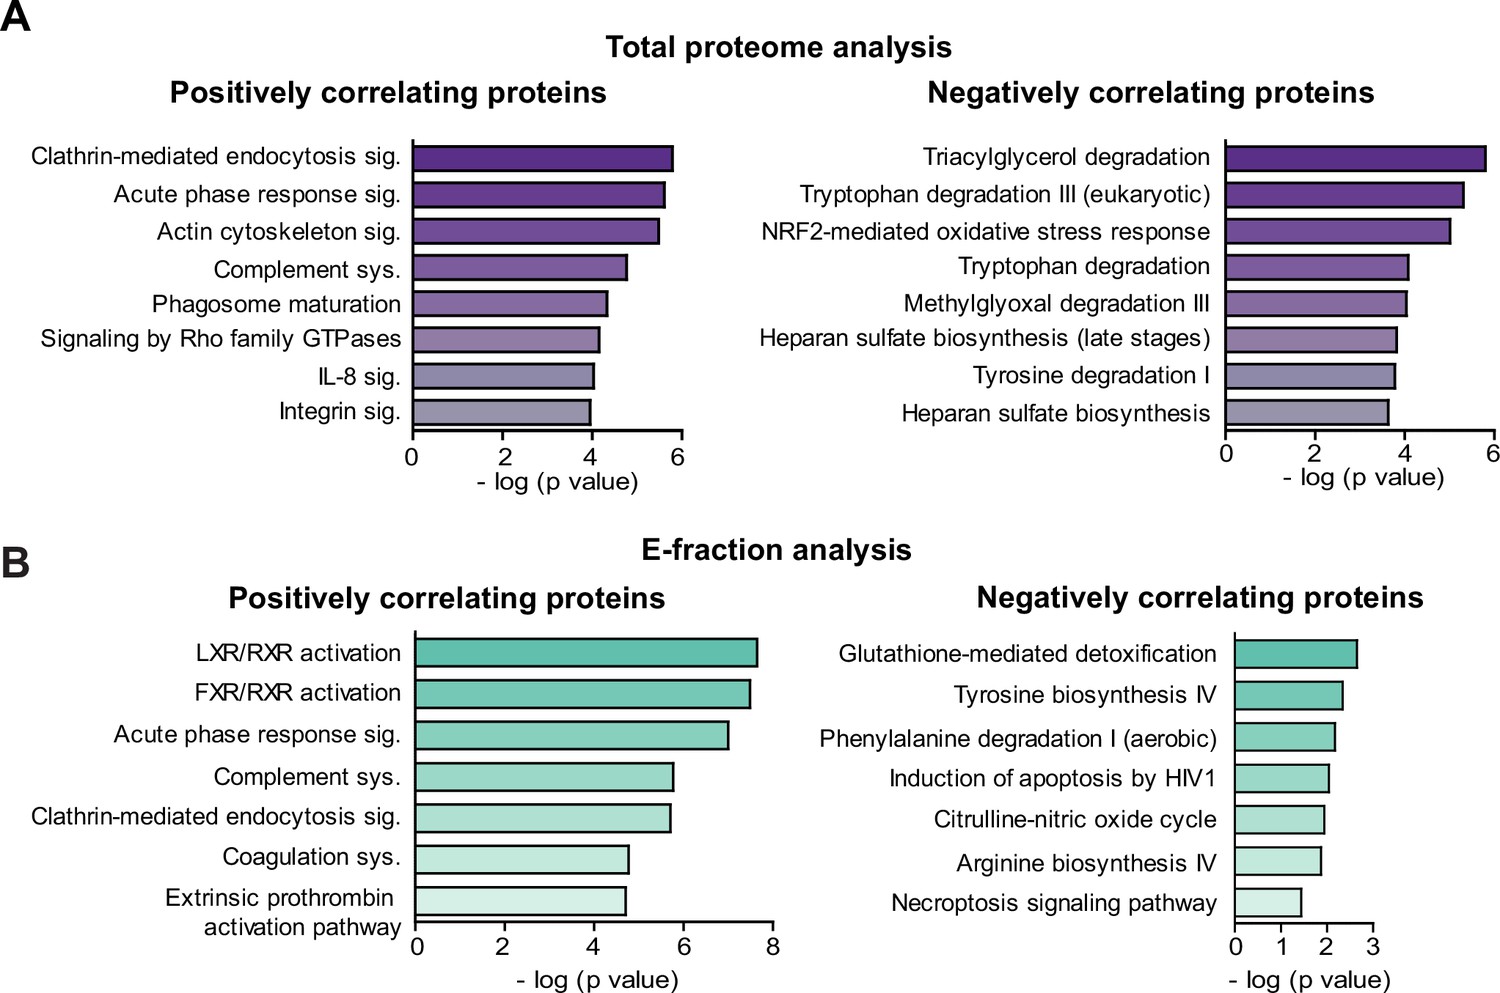
Ingenuity Pathway Analysis (IPA) canonical signaling pathways predicted from correlation analysis.
(A, B) Canonical signaling pathways identified (IPA) for proteins with significant correlation with fibrous extracellular matrix (ECM) deposits from carbon tetrachloride (CCl4)-derived Total (A) and E-fraction (B) proteomes.
Figure 6—figure supplement 2
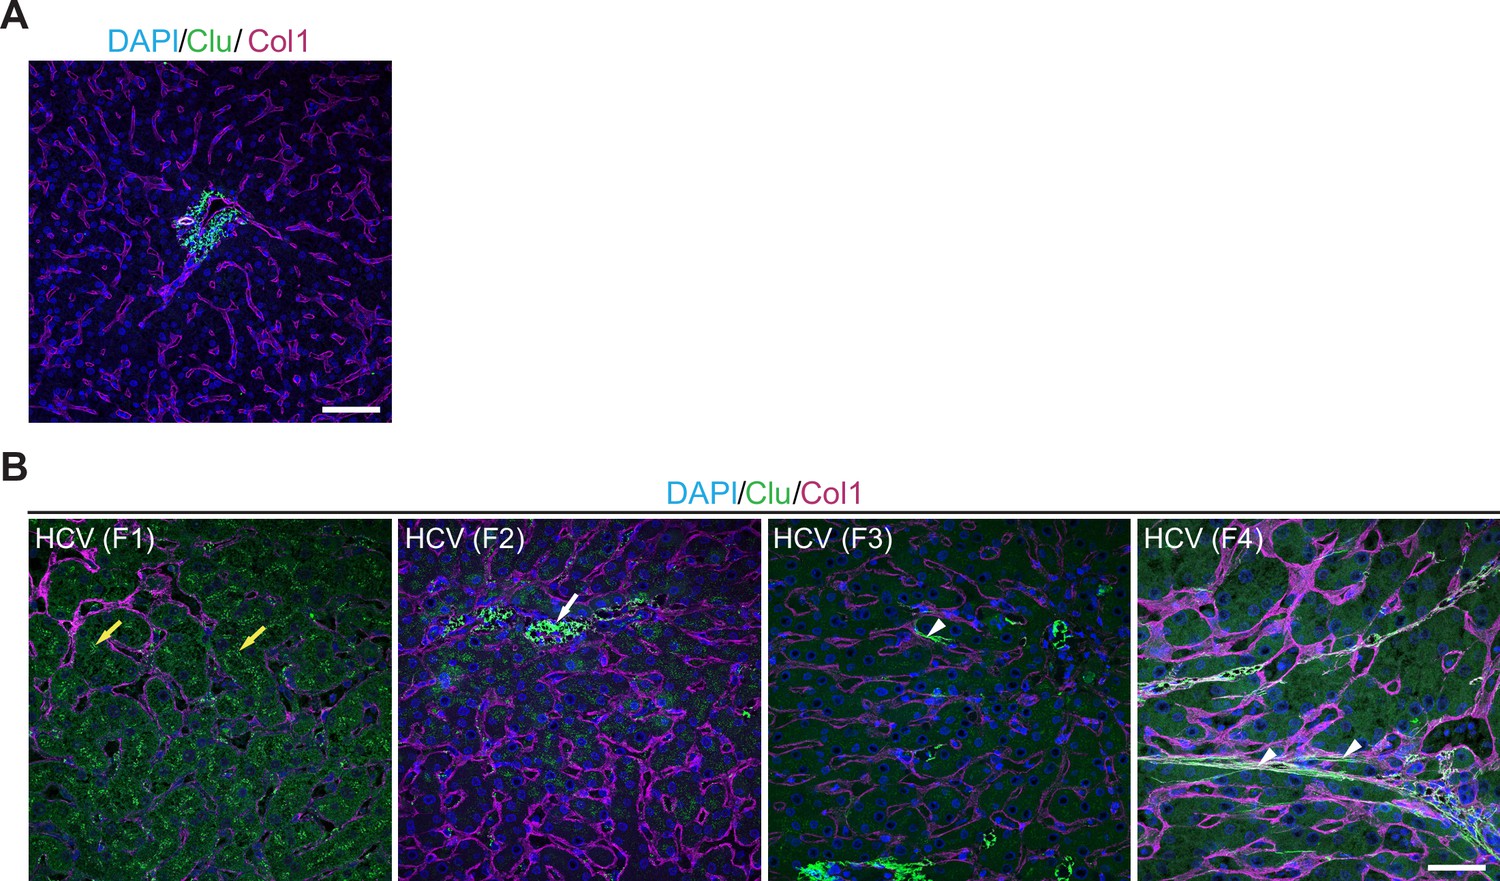
Clusterin expression in control and diseased human livers.
(A) Representative immunofluorescence (IF) image of control human liver sections immunolabeled for clusterin (green) and collagen type I (Col1, magenta). Nuclei were stained with DAPI (blue). Note no clusterin expression in healthy parenchyma. Scale bar = 50 μm. (B) Representative IF images of human liver sections from different stages of chronic hepatitis C (HCV) infection immunolabeled for clusterin (green) and collagen type I (Col1, magenta). Nuclei were stained with DAPI (blue). The images document change in clusterin staining pattern with fibrosis progression from stage F1 to stage F4 according the METAVIR grading system (F1, portal fibrosis; F2, periportal fibrosis; F3, bridging septal fibrosis; F4, cirrhosis). Note clusterin-positive bile canaliculi in stage F1 (yellow arrows); clusterin-positive granuli associated with sinusoids in F2 (arrow); clusterin positive collagen fibers within sinusoids in F3 (arrowhead); clusterin-positive collagen fibers within parenchyma in F4 (arrowheads). Scale bar = 25 μm.
Figure 6—figure supplement 3

Correlation analysis of protein abundance and changes in fibrotic deposits in the cholestatic model.
The scatter plots show the linear regression slope and the Pearson correlation coefficient for proteins of 3,5-diethoxycarbonyl-1,4-dihydrocollidine (DDC) Total (left panel), and E-fraction (right panel) proteomes. The statistical significance of the correlation is color-coded as indicated.
Figure 7 with 1 supplement
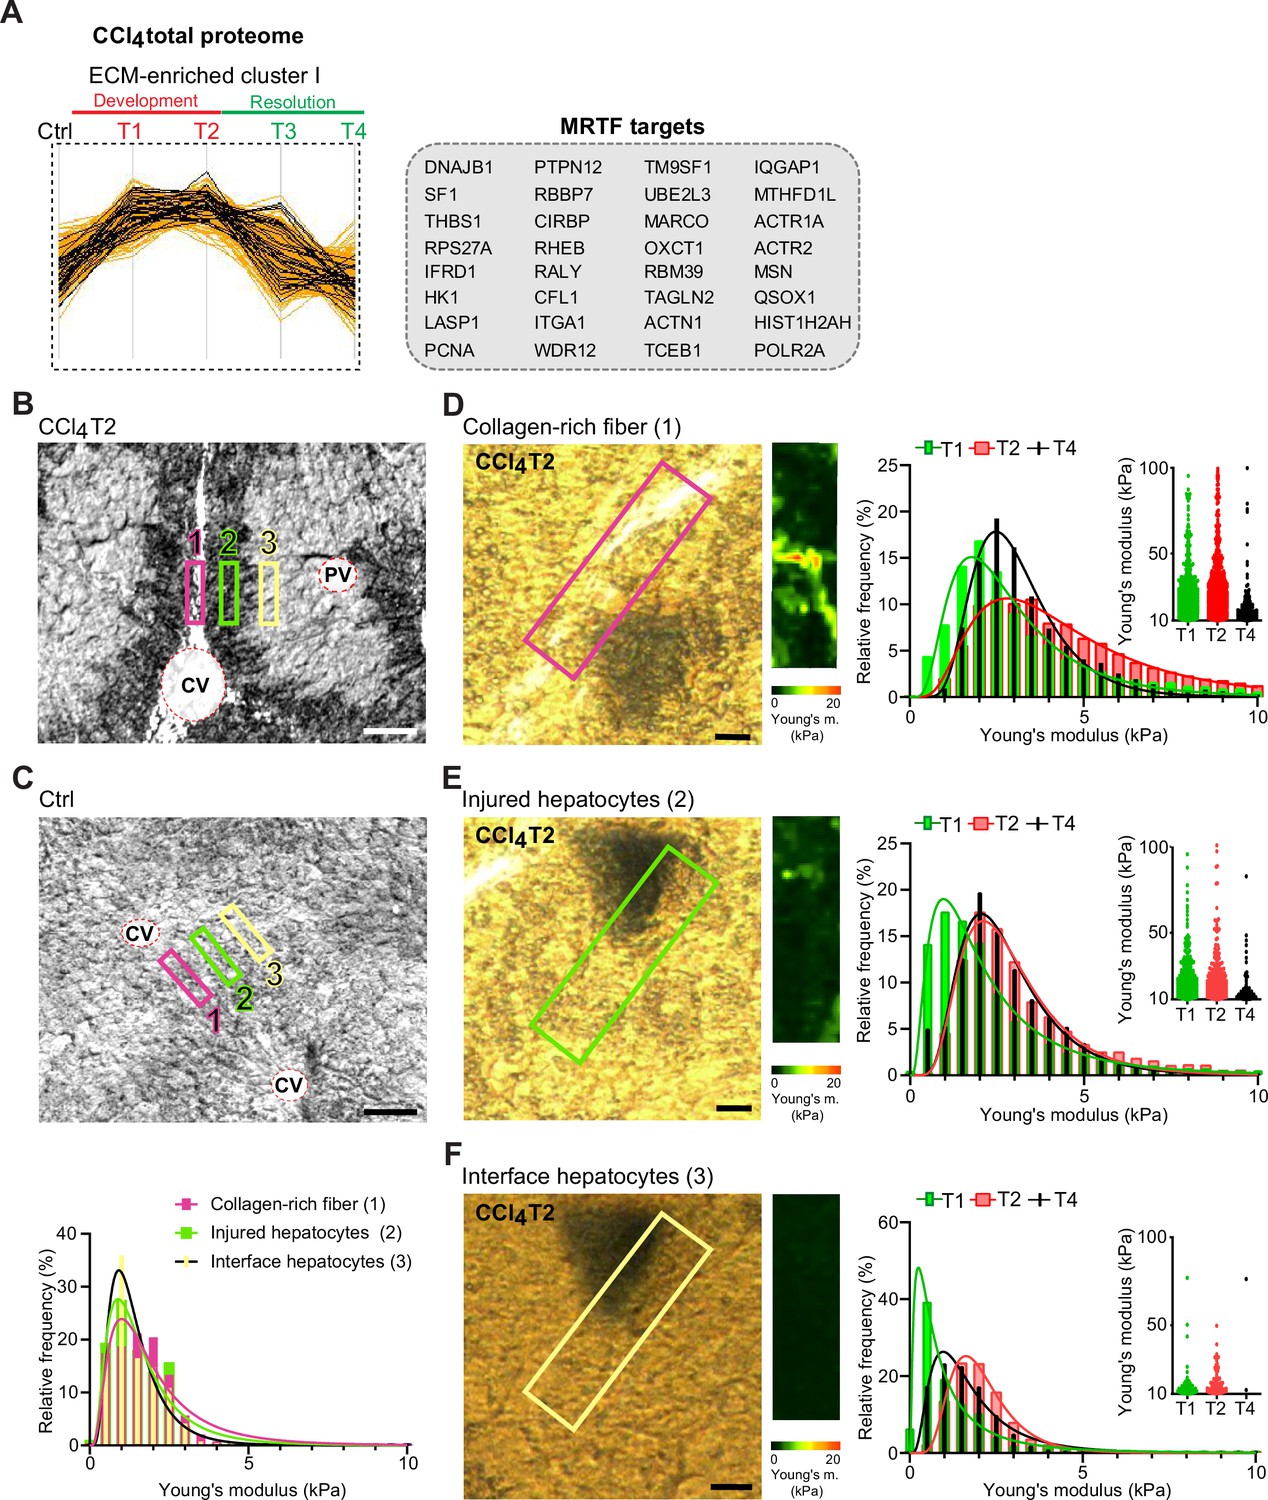
Atomic force microscopy (AFM) stiffness mapping reveals changes in the local mechanics of liver tissue upon hepatotoxic injury.
(A) The line plot shows the dynamics of 32 myocardin-related transcription factor (MRTF) targets (highlighted in black) significantly enriched in extracellular matrix (ECM)-enriched cluster I of carbon tetrachloride (CCl4) Total proteome (Figure 2C) identified by Fisher’s exact test (p=0.01; Benjamini-Hochberg false discovery rate = 3%). (B, C) Representative polarized microscopy images of CCl4-treated (T2, B) and untreated control (Ctrl, C) liver sections with indicated regions (1–3) selected for AFM measurements. Note in (B) white areas corresponding to collagen fibers visualized by polarized light. Pink rectangle, region 1 (collagen-rich fiber); green rectangle, region 2 (injured hepatocytes); yellow rectangle, region 3 (interface hepatocytes). CV, central vein; PV, portal vein. Scale bar = 100 μm. Histogram shows Young’s moduli for the measured regions in untreated control livers; n=7 regions in three mice. (D–F) Representative polarized microscopy images of CCl4-treated (T2) liver sections with rectangle indicating the regions of AFM measurements (30×100 μm2) and corresponding pseudocolor Young’s modulus maps determined by AFM. Scale bar = 25 μm. Histograms show Young’s moduli for indicated regions of collagen-rich fibers (D), injured hepatocytes (E), and interface hepatocytes (F) at indicated time points of fibrosis development (T1 and T2) and spontaneous resolution (T4). Inset scatter plots show Young’s modulus values above 10 kPa for each time point; n=7 regions in three mice.
Figure 7—figure supplement 1
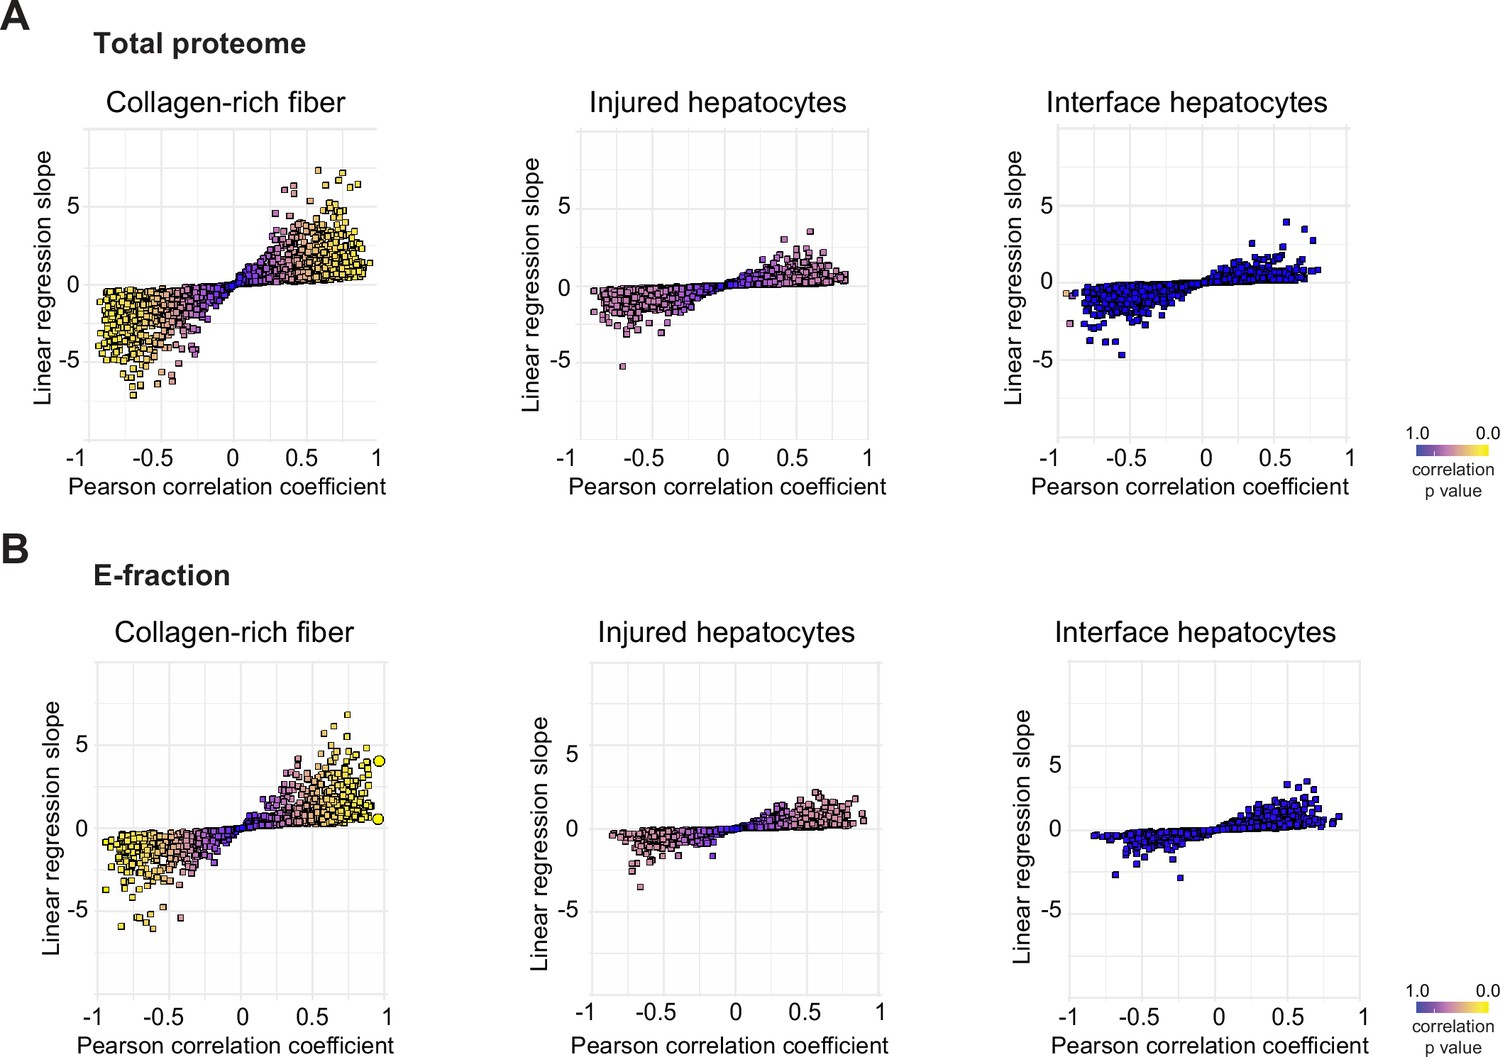
Correlation analysis of protein abundance change and changes in mechanical properties of the local mechanics of liver tissue upon hepatotoxic injury.
(A, B) The scatter plots show the linear regression slope and the Pearson correlation coefficient for proteins of carbon tetrachloride (CCl4) Total proteome (A) and CCl4 E-fraction proteome (B) with average Young’s moduli of collagen-rich areas, injured hepatocyte areas, and interface hepatocyte areas. The statistical significance of the correlation is color-coded as indicated.
Author response image 1

Dynamics of clusterin abundance with the development of HCV-induced fibrotic disease in comparison to the changes in collagen deposits.
IF images of human liver sections from different stages of chronic HCV infection were immunolabeled for clusterin and collagen 1. Clusterin- and collagenpositive (+) areas (as %) from three to eight fields of view (20x objective) were evaluated for each fibrosis stage (F1-F4).
Tables
Table 1
Median Young’s moduli for each defined area and treatment.
Statistical analysis was performed on frequency distribution data using Kruskal-Wallis test followed by Dunn’s multiple comparison post-testing. *p<0.05, **p<0.01 vs. control.
| Median Young’s modulus (kPa) | |||
|---|---|---|---|
| Treatment | Collagen area | Affected hepatocyte area | Interface hepatocyte area |
| Control (substitute area) | 1.6 | 1.3 | 1.2 |
| 3 week CCl4 (T1) | 2.7** | 1.9** | 0.8** |
| 6 week CCl4 (T2) | 4.4** | 2.8** | 2.0* |
| 6 weeks+10 days (T4) | 3.0 | 2.5* | 1.4 |
Key resources table
| Reagent type (species) or resource | Designation | Source or reference | Identifiers | Additional information |
|---|---|---|---|---|
| Antibody | Anti- K19 (TROMA III; Rat monoclonal) | DSHB | TROMA III RRID:AB_2133570 | IHCP (1:250) |
| Antibody | Anti-αSMA (1A4; Mouse monoclonal) | DAKO | M0851 RRID:AB_2223500 | IHCP (1:50) |
| Antibody | Anti-ECM1 (F-1; Mouse monoclonal) | Santa Cruz Biotechnology | sc-365335 RRID:AB_10847810 | IHCP (1:100) |
| Antibody | Anti-clusterin (goat polyclonal) | R&D Systems | AF2747 RRID:AB_2083314 | IHCP (1:250) |
| Antibody | Anti-clusterin (A-11; Mouse monoclonal) | Santa Cruz Biotechnology | sc-166831 RRID:AB_2245186 | IHCP (1:50) |
| Antibody | Anti-fibronectin (Rabbit polyclonal) | Abcam | ab2413 RRID:AB_2262874 | IHCP (1:500) |
| Antibody | Anti-collagen I (Rabbit polyclonal) | Abcam | ab21286 RRID:AB_446161 | IHCP (1:100) |
| Antibody | Anti-collagen IV (Rabbit polyclonal) | Bio-Rad | 2150-1470 | IHCP (1:250) |
| Antibody | Anti-integrin αV(EPR16800, mouse monoclonal) | Abcam | IHCP (1:500) | |
| Antibody | Anti-B220 (RA3-6B2, mouse monoclonal) | BioLegend | 103203 | IHCP (1:100) |
| Antibody | Anti-F4/80(D2S9R mouse monoclonal) | Cell Signaling | 70076 RRID:AB_2799771 | IHCP (1:100) |
| Antibody | Anti-desmin (rabbit polyclonal) | Thermo Fisher Scientific | PA5-16705 RRID:AB_10977258 | IHCP (1:500) |
| Antibody | Rhodamine Red-X (RRX) AffiniPure Donkey Anti-Mouse IgG (H+L) | Jackson ImmunoResearch | 715-295-151 RRID:AB_2340832 | IHCP (1:250) |
| Antibody | Alexa Fluor 488 AffiniPure F(ab')₂ Fragment Donkey Anti-Goat IgG (H+L) | Jackson ImmunoResearch | 705-546-147 RRID:AB_2340430 | IHCP (1:250) |
| Antibody | Alexa Fluor 594 AffiniPure F(ab')₂ Fragment Donkey Anti-Rat IgG (H+L) | Jackson ImmunoResearch | 712-586-150 RRID:AB_2340690 | IHCP (1:250) |
| Antibody | Alexa Fluor 647 AffiniPure Donkey Anti-Rabbit IgG (H+L) | Jackson ImmunoResearch | 711-605-152 RRID:AB_2492288 | IHCP (1:250) |
| Antibody | Alexa Fluor 488 AffiniPure Donkey Anti-Mouse IgG (H+L) | Jackson ImmunoResearch | 715-545-150 RRID:AB_2340846 | IHCP (1:250) |
| Antibody | Alexa Fluor 488 AffiniPure Donkey Anti-Rabbit IgG (H+L) | Jackson ImmunoResearch | 711-545-152 RRID:AB_2313584 | IHCP (1:250) |
| Chemical compound, drug | CCl4 | Sigma-Aldrich | SML1656 | |
| Software, algorithm | SPSS | SPSS | RRID:SCR_002865 | |
| Other | DAPI stain | Invitrogen | D1306 | (1 µg/ml) |
| Software | Perseus | https://maxquant.net/perseus/ | Version 1.6.10.43 |
Additional files
Download links
A two-part list of links to download the article, or parts of the article, in various formats.
Downloads (link to download the article as PDF)
Open citations (links to open the citations from this article in various online reference manager services)
Cite this article (links to download the citations from this article in formats compatible with various reference manager tools)
Dynamics of compartment-specific proteomic landscapes of hepatotoxic and cholestatic models of liver fibrosis
eLife 13:RP98023.
https://doi.org/10.7554/eLife.98023.3


