Astrocytes mediate two forms of spike timing-dependent depression at entorhinal cortex-hippocampal synapses
- Laboratory of Cellular Neuroscience and Plasticity, Department of Physiology, Anatomy and Cell Biology, Universidad Pablo de Olavide, Spain
Figures
Figure 1 with 1 supplement
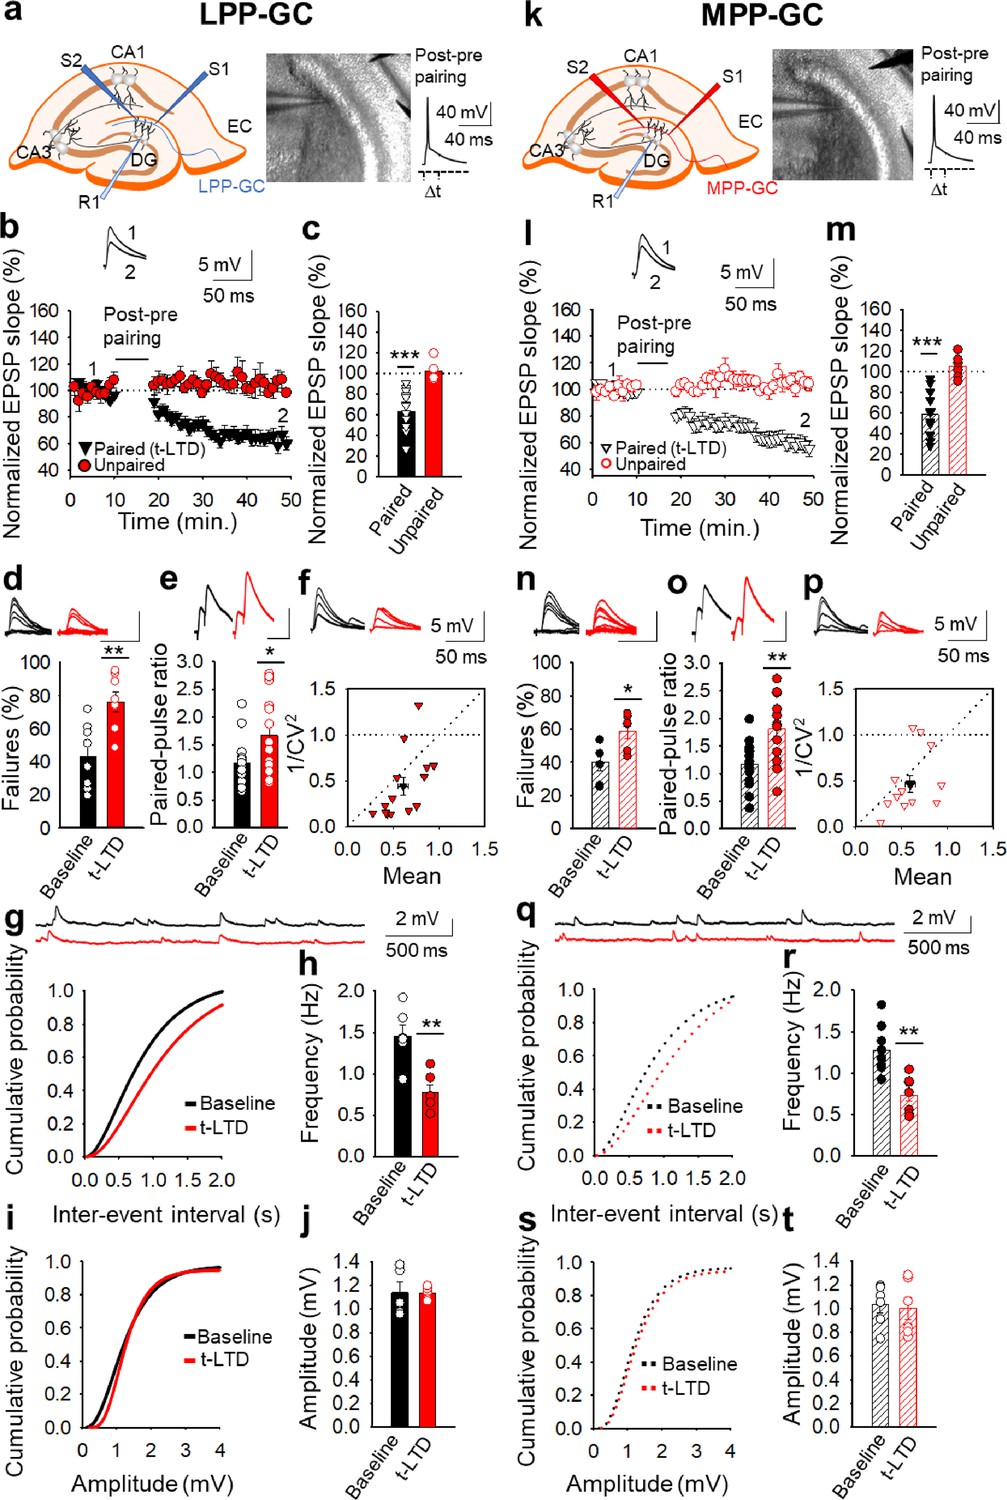
Input-specific presynaptic spike timing-dependent LTD at lateral and medial perforant pathway-dentate gyrus granule cell synapses.
(a, k) Schemes and pictures show the general set-up for the electrophysiological recordings and pairing protocol (∆t = –18ms, time between the peak of the postsynaptic spike and the onset of the EPSP) at both LPP- and MPP-GC synapses: CA, cornus ammonis; DG, dentate gyrus; EC, entorhinal cortex; S1 and S2, stimulating electrodes; R, recording electrode. A post-before-pre pairing protocol induced t-LTD at both LPP-GC (b) and MPP-GC (l) synapses. The EPSP slopes monitored in the paired (LPP-GC synapses black triangles, n=14; MPP-GC synapses open black triangles, n=14) and unpaired (LPP-GC synapses red symbols; MPP-GC synapses open red symbols) pathways are shown. The traces show the EPSP before (1) and 30 min after (2) pairing. Depression was only observed in the paired pathways. (c, m) Summary of the results. At the lateral (d-j) and medial (n–t) perforant pathway synapses onto dentate gyrus granule cells t-LTD is expressed presynaptically. The number of failures increases after t-LTD induction at both LPP- (n=8, (d) and MPP-GC (n=6, (n) synapses. Traces show the EPSPs before (black) and 30 min after pairing (red). PPR increases after t-LTD pairing protocol at LPP-GC (e) and MPP-GC (o) synapses. The traces show the EPSP before (black) and 30 min after t-LTD induction (red). (f, p) Normalized plots of CV−2 versus mean EPSP slopes suggest a presynaptic change in the release parameters at both LPP- (n=14) and MPP-GC (n=13) synapses. The traces show the EPSPs before (black) and 30 min after t-LTD induction (red). Miniature EPSPs (mEPSPs) were monitored at baseline and after t-LTD induction in the presence of TTX (300 nM) at LPP- (g–j), n=6) and MPP-GC synapses (q–t), n=6). Cumulative graphs and histograms show that after t-LTD induction, the frequency of mEPSPs decreases at both types of synapses, whereas the amplitude of the mEPSPs remains constant. Scale bar for the % failures - 5 mV, 50ms; scale bar for PPR - 5 mV, 80ms. Error bars indicate the S.E.M. * p<0.05, **p<0.01, *** p<0.001, two-sided Student’s t-test.
-
Figure 1—source data 1
Individual values included in the histograms.
- https://cdn.elifesciences.org/articles/98031/elife-98031-fig1-data1-v1.xlsx
Figure 1—figure supplement 1
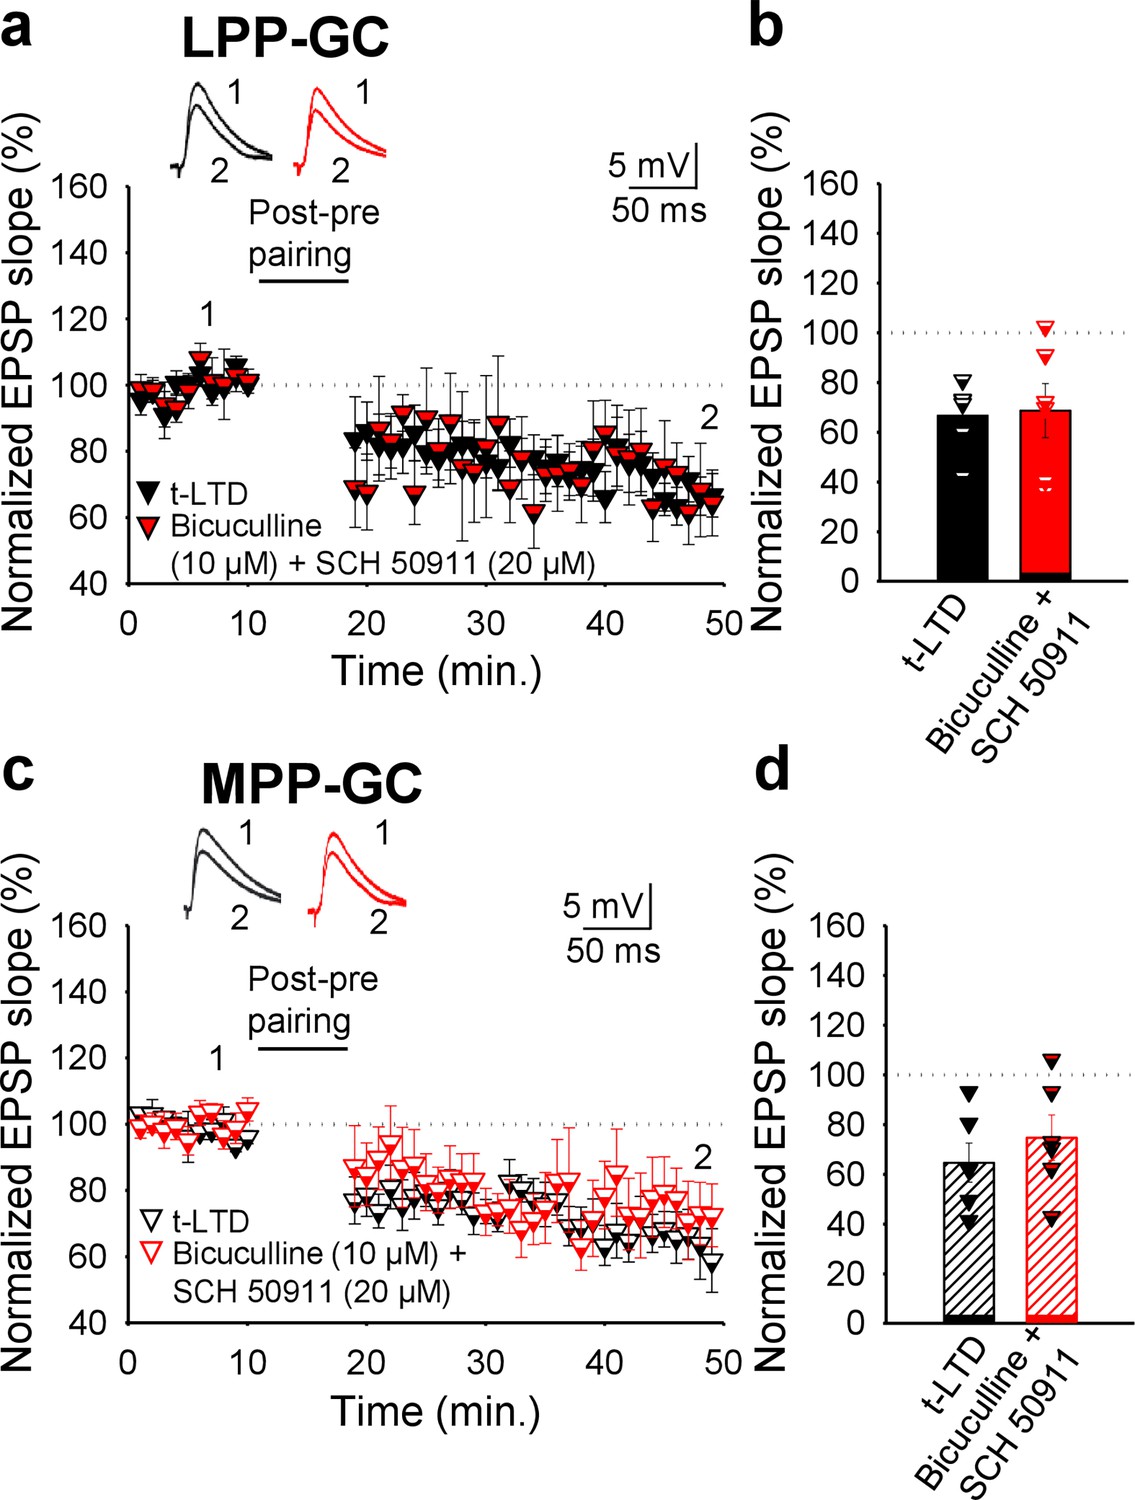
GABA receptors are not required for t-LTD at LPP- or MPP-GC synapses.
(a and c) Time course of EPSP monitored in slices during baseline and after the addition of bicuculline (LPP-GC: 67 ± 6%, n=6; MPP-GC: 65 ± 8%, n=6) and SCH50911 (LPP-GC: 69±11, n=6; MPP-GC: 75 ± 9%, n=6) to the perfusion fluid. Traces show the EPSP before (1) and 30 min after (2) treatment. (b) Summary of the results. Error bars indicate S.E.M.
-
Figure 1—figure supplement 1—source data 1
Individual values included in the histograms of Figure 1—figure supplement 1.
- https://cdn.elifesciences.org/articles/98031/elife-98031-fig1-figsupp1-data1-v1.xlsx
Figure 2
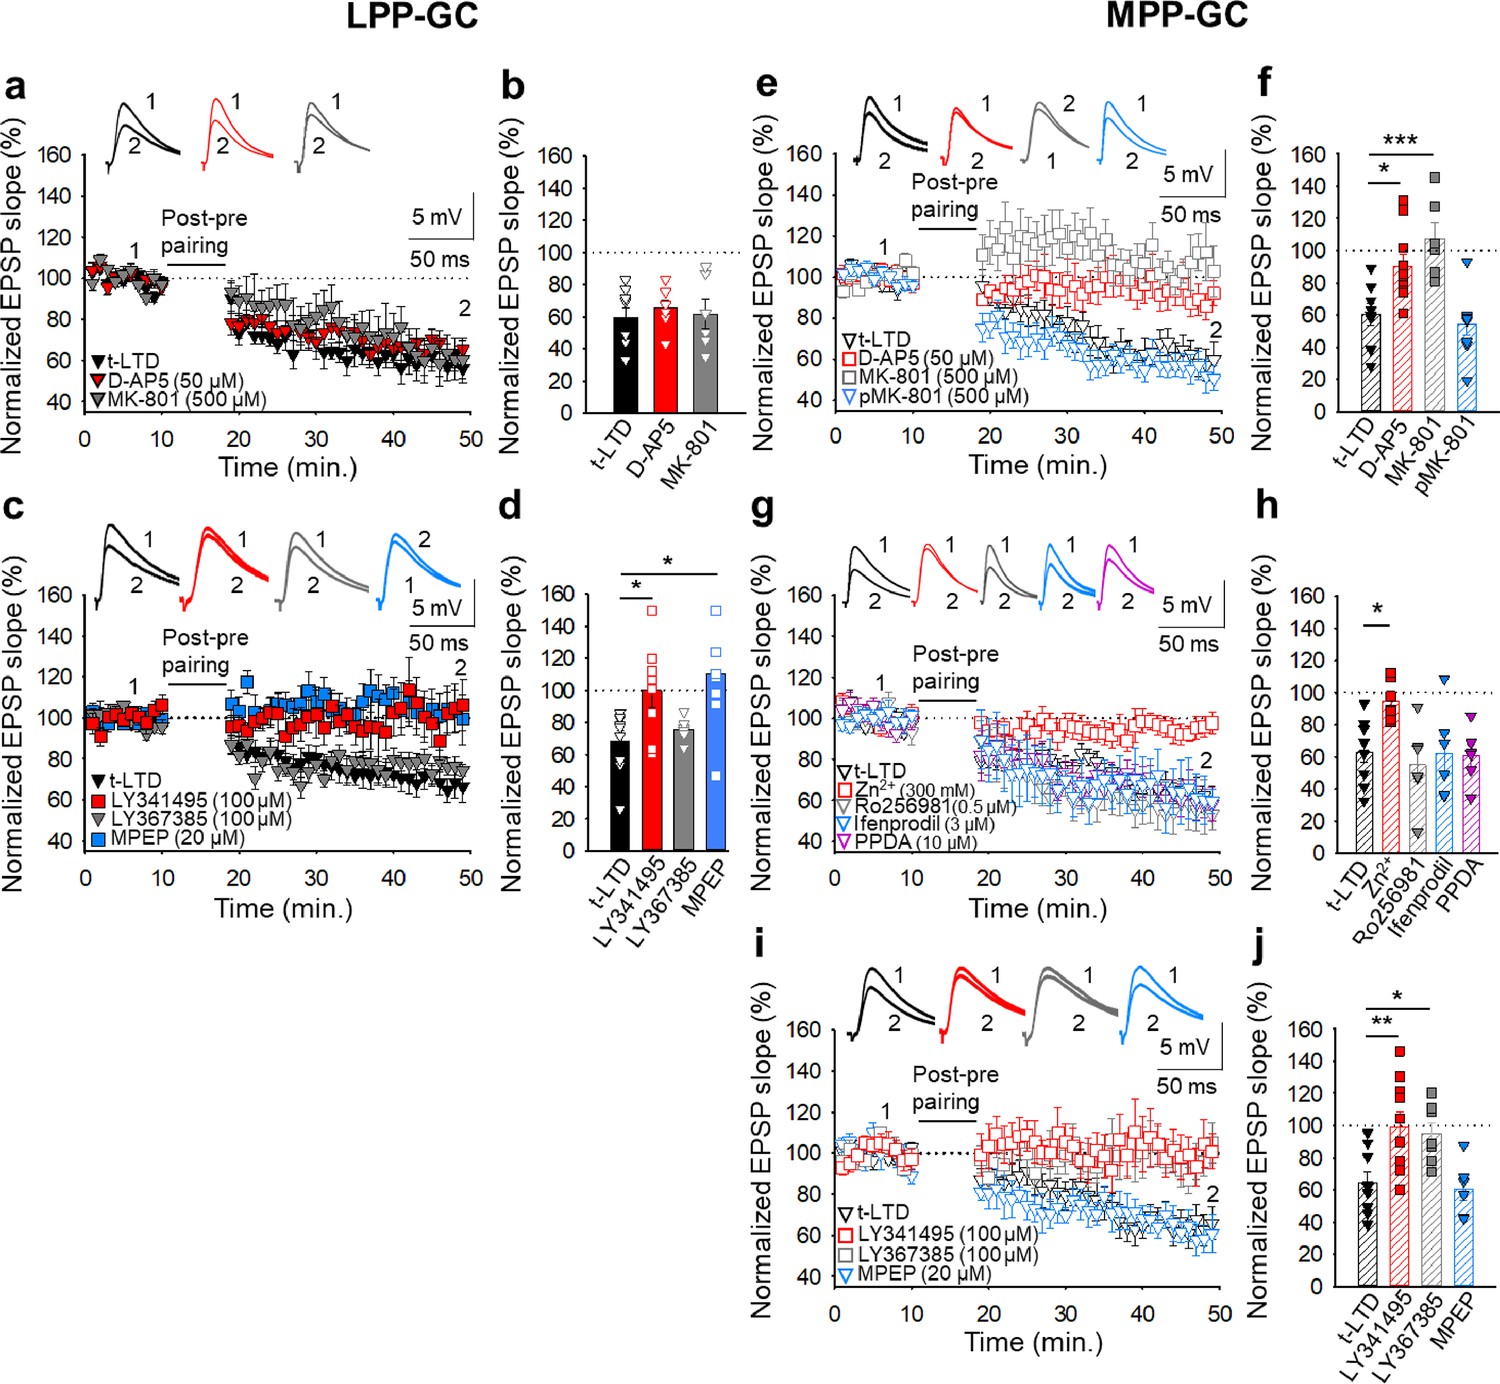
The t-LTD at lateral and medial perforant pathway-dentate gyrus granule cell synapses has distinct requirements for glutamate receptors.
The t-LTD at LPP-GC synapses does not require NMDAR but requires mGluR5.(a) The addition of D-AP5 (50 μM) or MK-801 (500 μM) to the superfusion fluid does not prevent the induction of t-LTD at LPP-GC synapses. The EPSP slopes shown are from D-AP5-treated (red triangles, n=8), MK-801-treated (grey triangles, n=6) and untreated cells (black triangles, n=8). The traces show EPSPs before (1) and 30 min after (2) pairing. (b) Summary of the results. (c) The EPSP slopes are shown from control slices (black triangles, n=9), and slices treated with the mGluR antagonist LY341495 (100 µM, red squares, n=8), the mGluR1 antagonist LY367385 (100 µM, grey triangles, n=6) or the mGluR5 antagonist MPEP (20 µM, blue squares, n=8). The traces show the EPSPs before (1) and 30 min after (2) pairing. (d) Summary of the results. (e) The t-LTD at MPP-GC synapses requires NMDARs containing GluN2A subunits and mGluR1. The addition of D-AP5 (50 µM) or MK-801 (500 µM) to the superfusion fluid prevented t-LTD induction at MPP-GC synapses, whereas postsynaptic loading of MK-801 (500 µM) did not block t-LTD induction. The EPSP slopes are shown from D-AP5 (open red squares, n=10) or MK-801 treated cells (bath, open grey squares, n=6; loaded into postsynaptic cell, open blue triangles, n=9), and untreated cells (open black triangles, n=8). The traces show the EPSPs before (1) and 30 min after (2) pairing. (f) Summary of the results. (g) The NMDARs involved in t-LTD at MPP-GC synapses contain GluN2A subunits. The t-LTD at MPP-GC synapses was completely blocked in slices exposed to Zn2+ (300 nM), while it remained unaffected in slices treated with Ro 25–6981 (0.5 µM), ifenprodil (3 µM) or PPDA. The EPSP slopes shown are from control slices (open black triangles, n=9) and slices treated with Zn2+ (open red squares, n=7), Ro-25–6981 (open grey triangles, n=6), ifenprodil (open blue triangles, n=6) or PPDA (open pink triangles, n=6). The traces show the EPSPs before (1) and 30 min after (2) pairing. (h) Summary of the results. (i) The t-LTD at MPP-GC synapses requires mGluR1. The EPSP slopes shown are from control slices (open black triangles, n=9), or slices treated with LY341495 (100 µM, open red squares, n=10), LY367385 (100 µM, open grey squares, n=7) or MPEP (20 µM, open blue triangles, n=6). The traces show the EPSPs before (1) and 30 min after (2) pairing. (j) Summary of the results. The error bars indicate the S.E.M. *p<0.05, ** p<0.01, ***p<0.001, One-way ANOVA + Holm–Sidak test.
-
Figure 2—source data 1
Individual values included in the histograms of Figure 2.
- https://cdn.elifesciences.org/articles/98031/elife-98031-fig2-data1-v1.xlsx
Figure 3 with 1 supplement
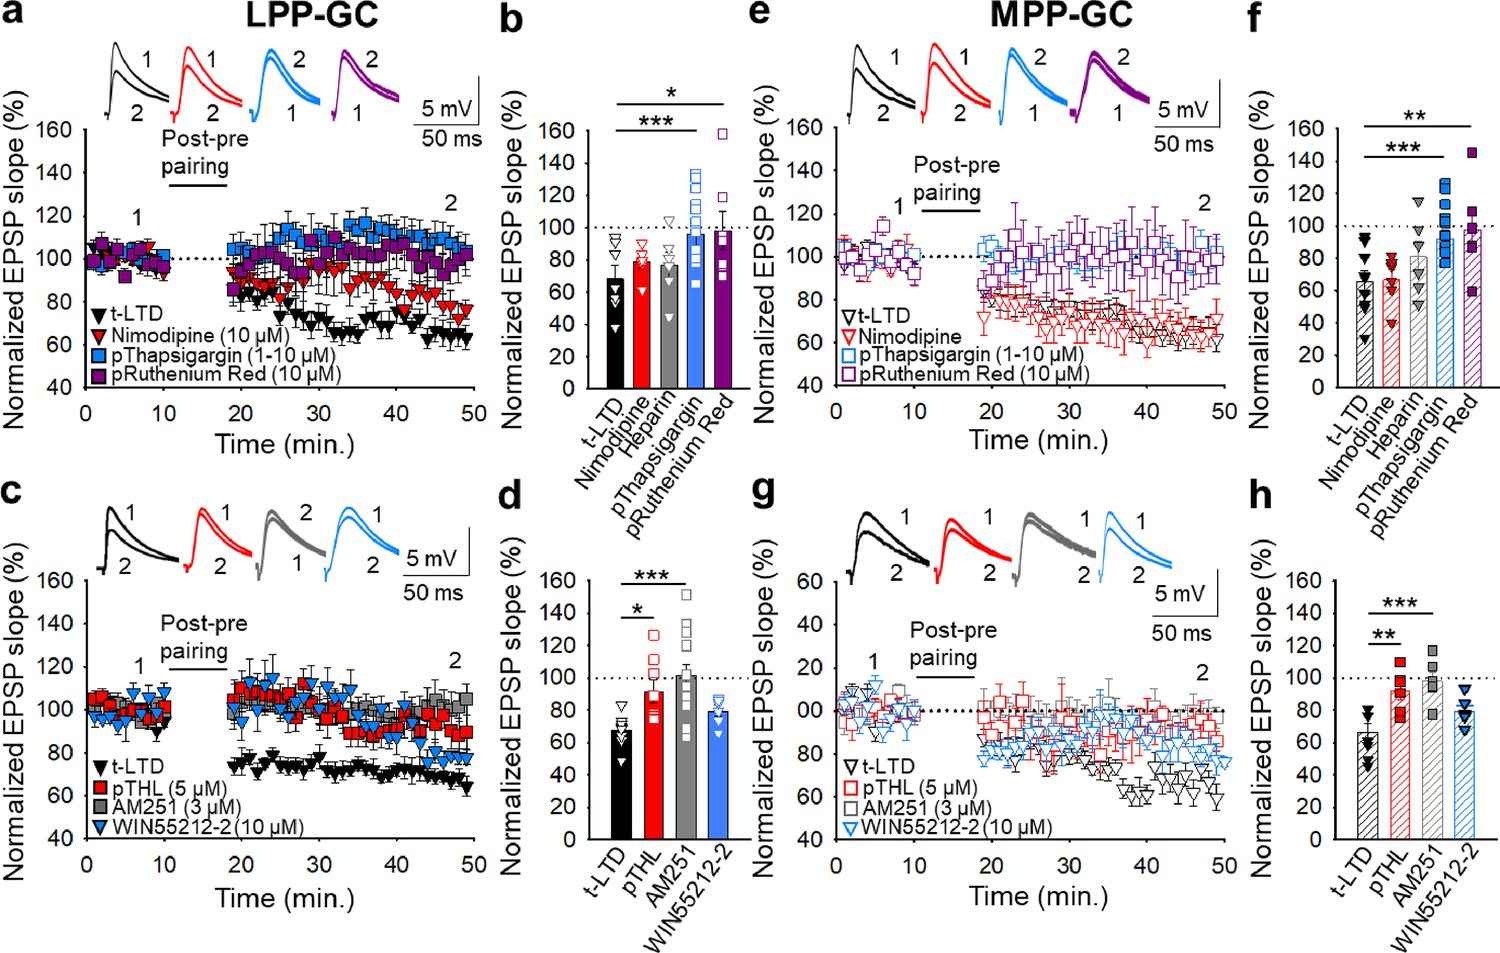
The t-LTD at lateral and medial perforant pathway-dentate gyrus granule cell synapses requires postsynaptic calcium and eCB signalling.
(a) The induction of t-LTD at LPP-GC synapses in slices was unaffected by exposure to nimodipine (10 µM) or to heparin (5 mg/ml), but it was prevented by treatment with thapsigargin (1–10 µM) or ruthenium red (10 µM), loaded into the postsynaptic cell. The EPSP slopes shown are from control slices (black triangles, n=11) and slices treated with nimodipine (red triangles, n=6), thapsigargin (blue squares, n=15) and ruthenium red (purple squares, n=7). The traces show EPSPs before (1) and 30 min after (2) pairing. (b) Summary of the results. (c) The t-LTD at LPP-GC synapses requires endocannabinoids and CB1 receptors, as it was blocked when THL was loaded into the postsynaptic neuron (pTHL, 5 µM) or in slices treated with AM251 (3 µM). In addition, LTD was induced by direct activation of CB1R by treatment of the slices with WIN 55 512–2 (10 µM). The EPSP slopes shown are from control slices (black triangles, n=9), in slices with THL loaded into the postsynaptic neuron (red squares, n=8), treated with AM251 (grey squares, n=14) or treated with WIN 55 512–2 (blue triangles, n=6). The traces show the EPSPs before (1) and 30 min after (2) pairing. (d) Summary of the results. (e) The induction of t-LTD at MPP-GC synapses was unaffected in nimodipine-treated slices (10 µM) or heparin (5 mg/ml), but prevented in slices treated with thapsigargin (10 µM) or ruthenium red (10 µM), loaded into the postsynaptic cell. The EPSP slopes shown are from control slices (open black triangles, n=9) and slices treated with nimodipine (open red triangles, n=6), thapsigargin (open blue squares, n=13) and ruthenium red (open purple squares, n=6). The traces show EPSPs before (1) and 30 min after (2) pairing. (f) Summary of the results. (g) The t-LTD at MPP-GC synapses requires endocannabinoids and CB1 receptors, and it was blocked when THL was loaded into the postsynaptic neuron (pTHL, 5 µM) and in slices treated with AM251 (3 µM). In addition, LTD was induced by direct activation of CB1R by treatment of the slices with WIN 55 512–2 (10 µM). The EPSP slopes shown are from control slices (open black triangles, n=8) and slices with THL loaded into the postsynaptic neuron (open red squares, n=6) or treated with AM251 (open grey squares, n=6) or treated with WIN 55 512–2 (open blue triangles, n=6). The traces show EPSPs before (1) and 30 min after (2) pairing. (h) Summary of the results. The error bars indicate S.E.M. *p<0.05, ** p<0.01, *** p<0.001, One-way ANOVA + Holm–Sidak test.
-
Figure 3—source data 1
Individual values included in the histograms of Figure 3.
- https://cdn.elifesciences.org/articles/98031/elife-98031-fig3-data1-v1.xlsx
Figure 3—figure supplement 1
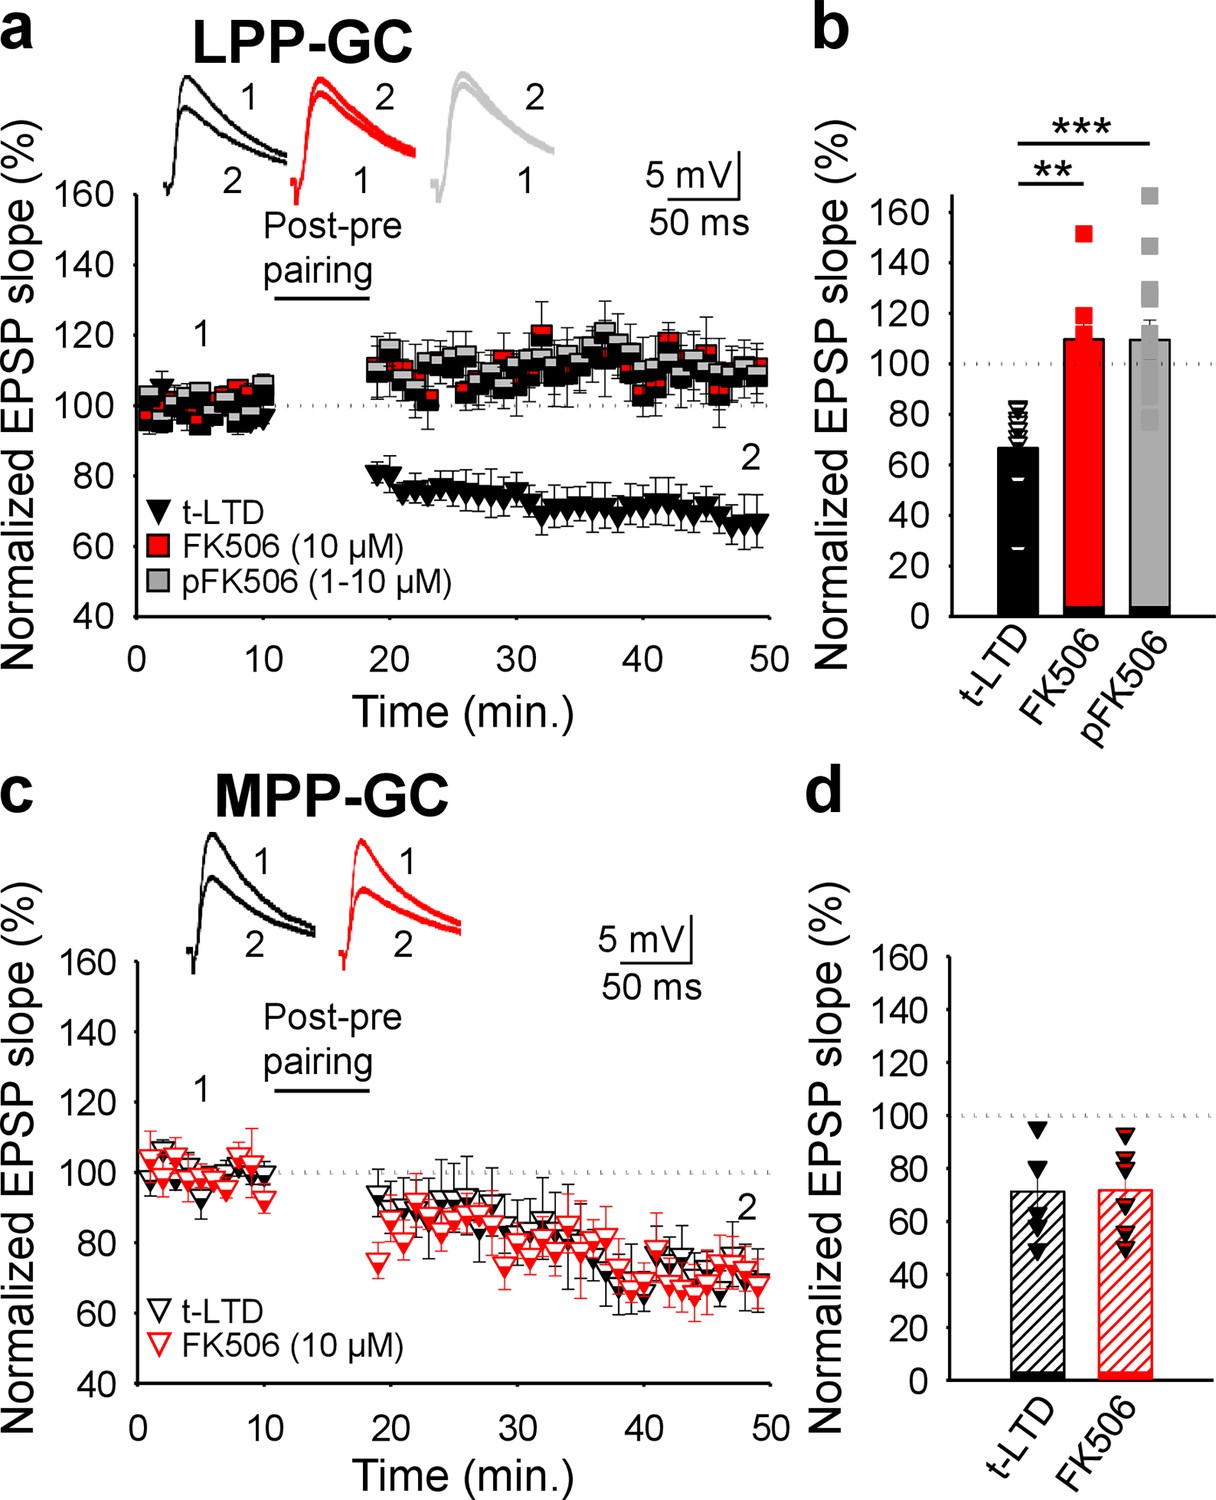
Calcineurin is required for t-LTD induction at the LPP, but not at MPP-GC synapses.
(a) t-LTD requires postsynaptic calcineurin at LPP-GC synapses. The EPSP slopes monitored in control slices (black triangles, n=9) and in slices treated with the calcineurin blocker FK506 (1–10 µM), either in the bath (red squares, n=8) or loaded into the postsynaptic neuron (gray squares, n=13) are shown. Traces show EPSP before (1) and 30 min after (2) pairing. (b) Summary of the results. (c) t-LTD does not require calcineurin at MPP-GC synapses. The EPSP slopes monitored in control slices (open black triangles, n=6) and in slices treated with FK506 (10 µM) in the bath (open-red triangles, n=6) are shown. Traces show EPSP before (1) and 30 min after (2) pairing. (d) Summary of the results. **p<0.01, ***p<0.001, One-way ANOVA + Holm–Sidak. Error bars represent the S.E.M.
-
Figure 3—figure supplement 1—source data 1
Individual values included in the histograms of Figure 3—figure supplement 1.
- https://cdn.elifesciences.org/articles/98031/elife-98031-fig3-figsupp1-data1-v1.xlsx
Figure 4 with 1 supplement
The t-LTD at lateral and medial perforant pathway-dentate gyrus granule cell synapses requires astrocytes and glutamate.
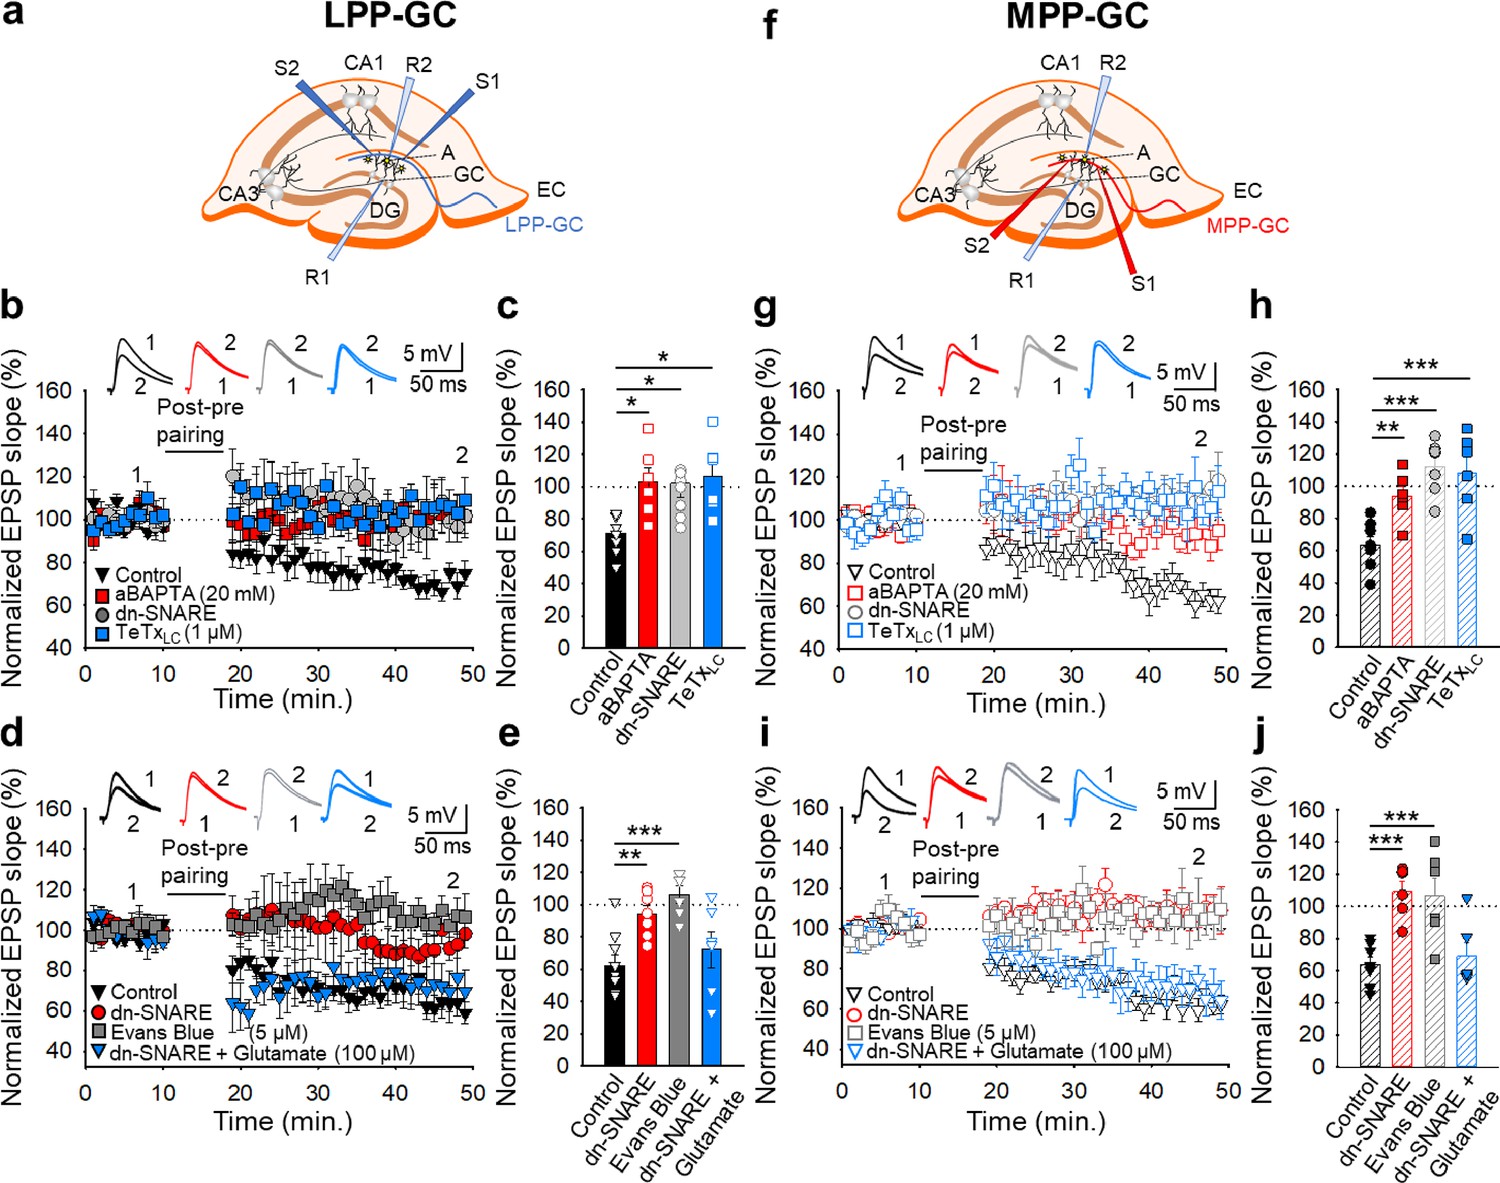
(a, f) Schemes showing the general experimental set-up: A, astrocyte; CA, cornus ammonis; DG, dentate gyrus; EC, entorhinal cortex; GC, granule cell; S1 and S2, stimulating electrodes; R1 and R2, recording electrodes. (b) The t-LTD at LPP-GC synapses requires astrocytes as it was prevented by loading astrocytes with BAPTA (20 mM) and in slices from dnSNARE mice or when astrocytes are treated with the light chain of the tetanus toxin (TeTxLC, 1 µM). The EPSP slopes shown are from control slices (black triangles, n=7), slices with BAPTA-loaded astrocytes (red squares, n=6), slices from dnSNARE mice (grey circles, n=9) and in slices treated with TeTxLC (blue squares, n=6). The traces show the EPSPs before (1) and 30 min after (2) pairing. (c) Summary of the results. (d) The t-LTD at LPP-GC synapses requires glutamate as it is absent in slices from dnSNARE mice but it is restored by glutamate puffs (100 µM). Note that t-LTD is also absent in slices treated with Evans blue (5 µM). The EPSP slopes shown are from control slices (black triangles, n=8), slices from dnSNARE mice (red circles, n=7), slices from dnSNARE mice administered glutamate puffs (blue triangles, n=6), and slices treated with Evans blue loaded into the astrocytes (grey squares, n=6). The traces show the EPSPs before (1) and 30 min after (2) pairing. (e) Summary of the results. (g) The t-LTD at MPP-GC synapses requires astrocytes as t-LTD induction at MPP-GC synapses was prevented by loading astrocytes with BAPTA (20 mM), in slices from dnSNARE mice or when astrocytes are treated with the light chain of the tetanus toxin (TeTxLC, 1 µM). The EPSP slopes shown are from control slices (open black triangles, n=6), slices with BAPTA-loaded astrocytes (open red squares, n=6), slices from dnSNARE mice (open grey circles, n=7) and in slices treated with TeTxLC (open blue squares, n=6). The traces show the EPSPs before (1) and 30 min after (2) pairing. (h) Summary of the results. (i) The t-LTD at MPP-GC synapses requires glutamate as it is absent in slices from dnSNARE mice but is restored by glutamate puffs (100 µM). Note that t-LTD is also absent in slices treated with Evans blue (5 µM). The EPSP slopes shown are from control slices (open black triangles, n=8), slices from dnSNARE mice (open red circles, n=6) slices from dnSNARE mice administered to glutamate puffs (open blue triangles, n=6) and slices treated with Evans blue loaded into the astrocytes (open grey squares, n=6). The traces show the EPSPs before (1) and 30 min after (2) pairing. (j) Summary of the results. The error bars indicate the S.E.M. *p<0.05, **p<0.01, ***p<0.001, One-way ANOVA + Holm–Sidak test.
-
Figure 4—source data 1
Individual values included in the histograms of Figure 4.
- https://cdn.elifesciences.org/articles/98031/elife-98031-fig4-data1-v1.xlsx
Figure 4—figure supplement 1
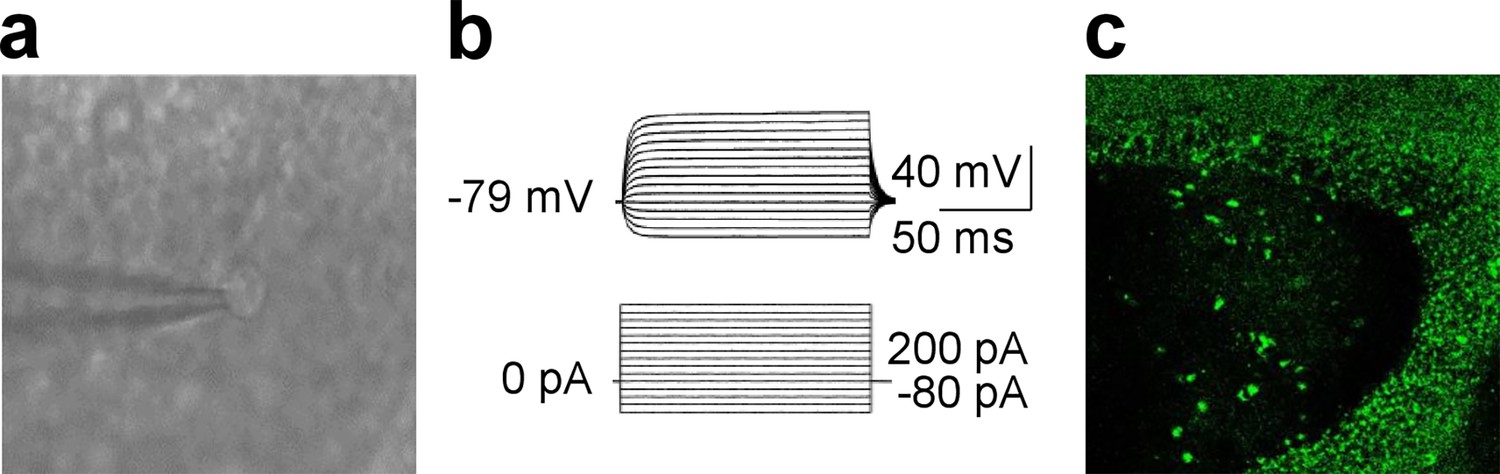
Identification of astrocytes.
(a) Low magnification infrared video microscopy image showing a brain slice with a recording electrode on one astrocyte. (b) Voltage responses of typical astrocytes in the surrounding of LPP-and MPP-GC synapses are shown. Astrocytes show a passive response to current injections. (c) 25 x confocal image showing GFP fluorescence in the granule cell layer of the dentate gyrus from a dnSNARE mouse off Dox since birth. No GFP could be found in neurons.
Figure 5
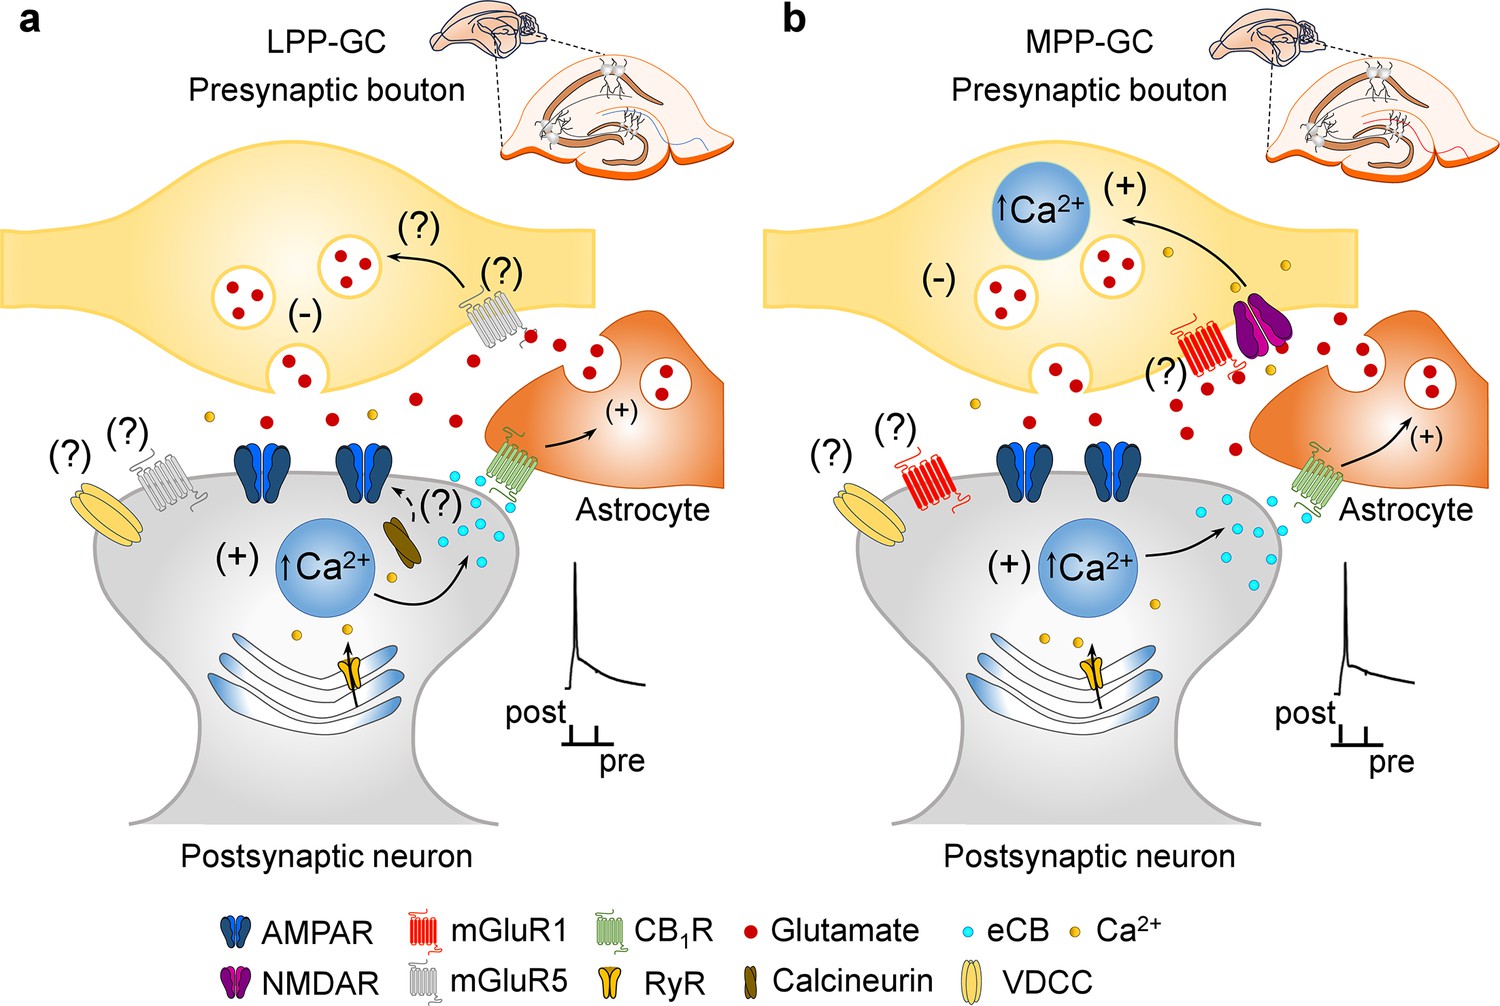
Model of presynaptic t-LTD at LPP- and MPP-GC synapses.
t-LTD is induced by a post-before-pre, single-spike pairing protocol at P13-21. Postsynaptic action potentials depolarize the postsynaptic membrane that probably permeates Ca2+ into the postsynaptic neuron, causing calcineurin activation (at LPP-GC synapses) and Ca2+ release from internal stores in a Ca2+-dependent Ca2+ release manner at both, LPP- and MPP-GC synapses, driving eCBs synthesis and release. The eCB signal leads to the activation of CB1 receptors, possibly situated in surrounding astrocytes, facilitating glutamate release from astrocytes, which, together with glutamate released from presynaptic neurons, that at LPP-GC synapses (a) possibly activates mGluR5 and presynaptic NMDA receptors at MPP-GC synapses (b) to produce a decrease in glutamate release probability in both cases and t-LTD.
Additional files
Download links
A two-part list of links to download the article, or parts of the article, in various formats.
Downloads (link to download the article as PDF)
Open citations (links to open the citations from this article in various online reference manager services)
Cite this article (links to download the citations from this article in formats compatible with various reference manager tools)
Astrocytes mediate two forms of spike timing-dependent depression at entorhinal cortex-hippocampal synapses
eLife 13:RP98031.
https://doi.org/10.7554/eLife.98031.3


