Altered visual cortex excitatory/inhibitory ratio following transient congenital visual deprivation in humans
- Biological Psychology and Neuropsychology, University of Hamburg, Germany
- Department of Medicine and Optometry, Linnaeus University, Sweden
- Child Sight Institute, Jasti V Ramanamma Children’s Eye Care Centre, LV Prasad Eye Institute, India
- Department of Psychology, University of Nevada, United States
- LUCID Medical Diagnostics, India
- Institute of Systems Neuroscience, University Medical Center Hamburg-Eppendorf, Germany
Figures
Figure 1
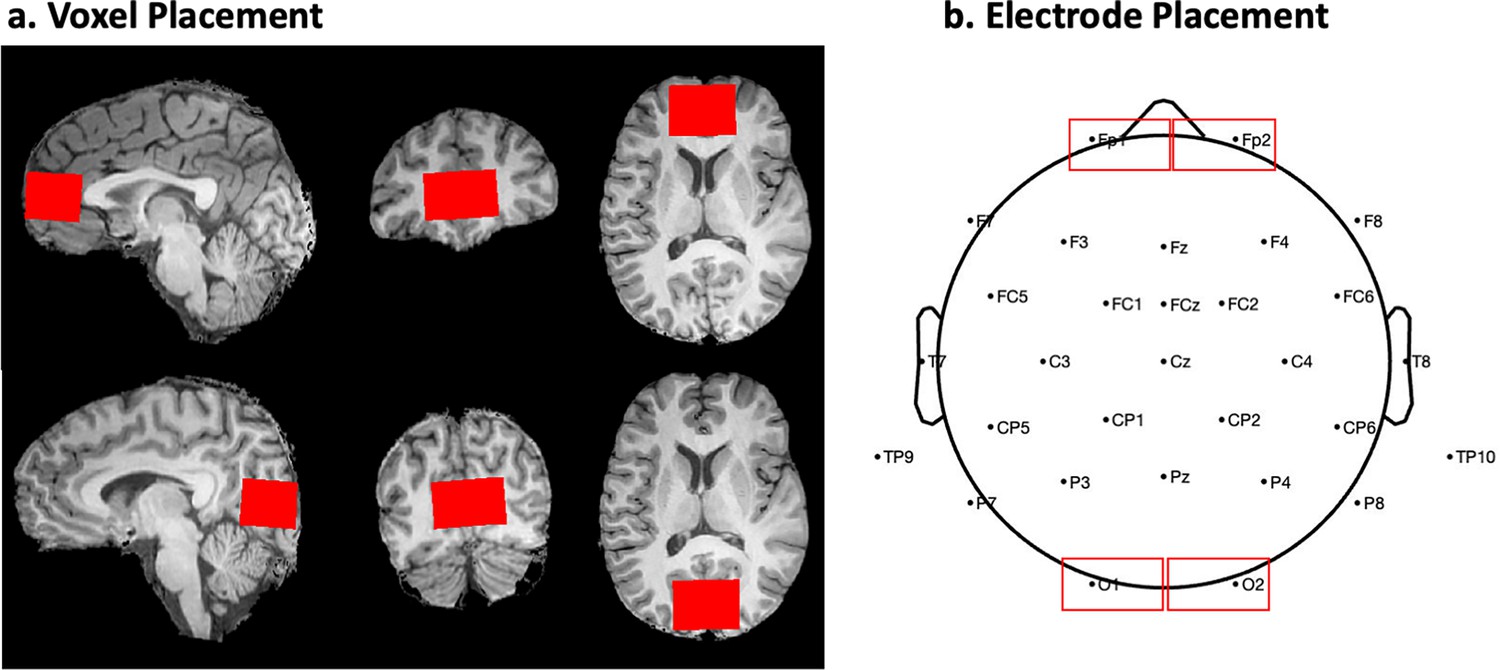
Voxel placement for Magnetic Resonance Spectroscopy and electrode placement for Electroencephalography.
(a) Position of the frontal cortex (top) and visual cortex (bottom) voxels in a single subject. Skull-stripped figures output from SPM12. (b) Electrode montage according to the 10/20 electrode system with marked occipital electrodes preselected for analyses, and frontal electrodes used for control analyses.
Figure 2
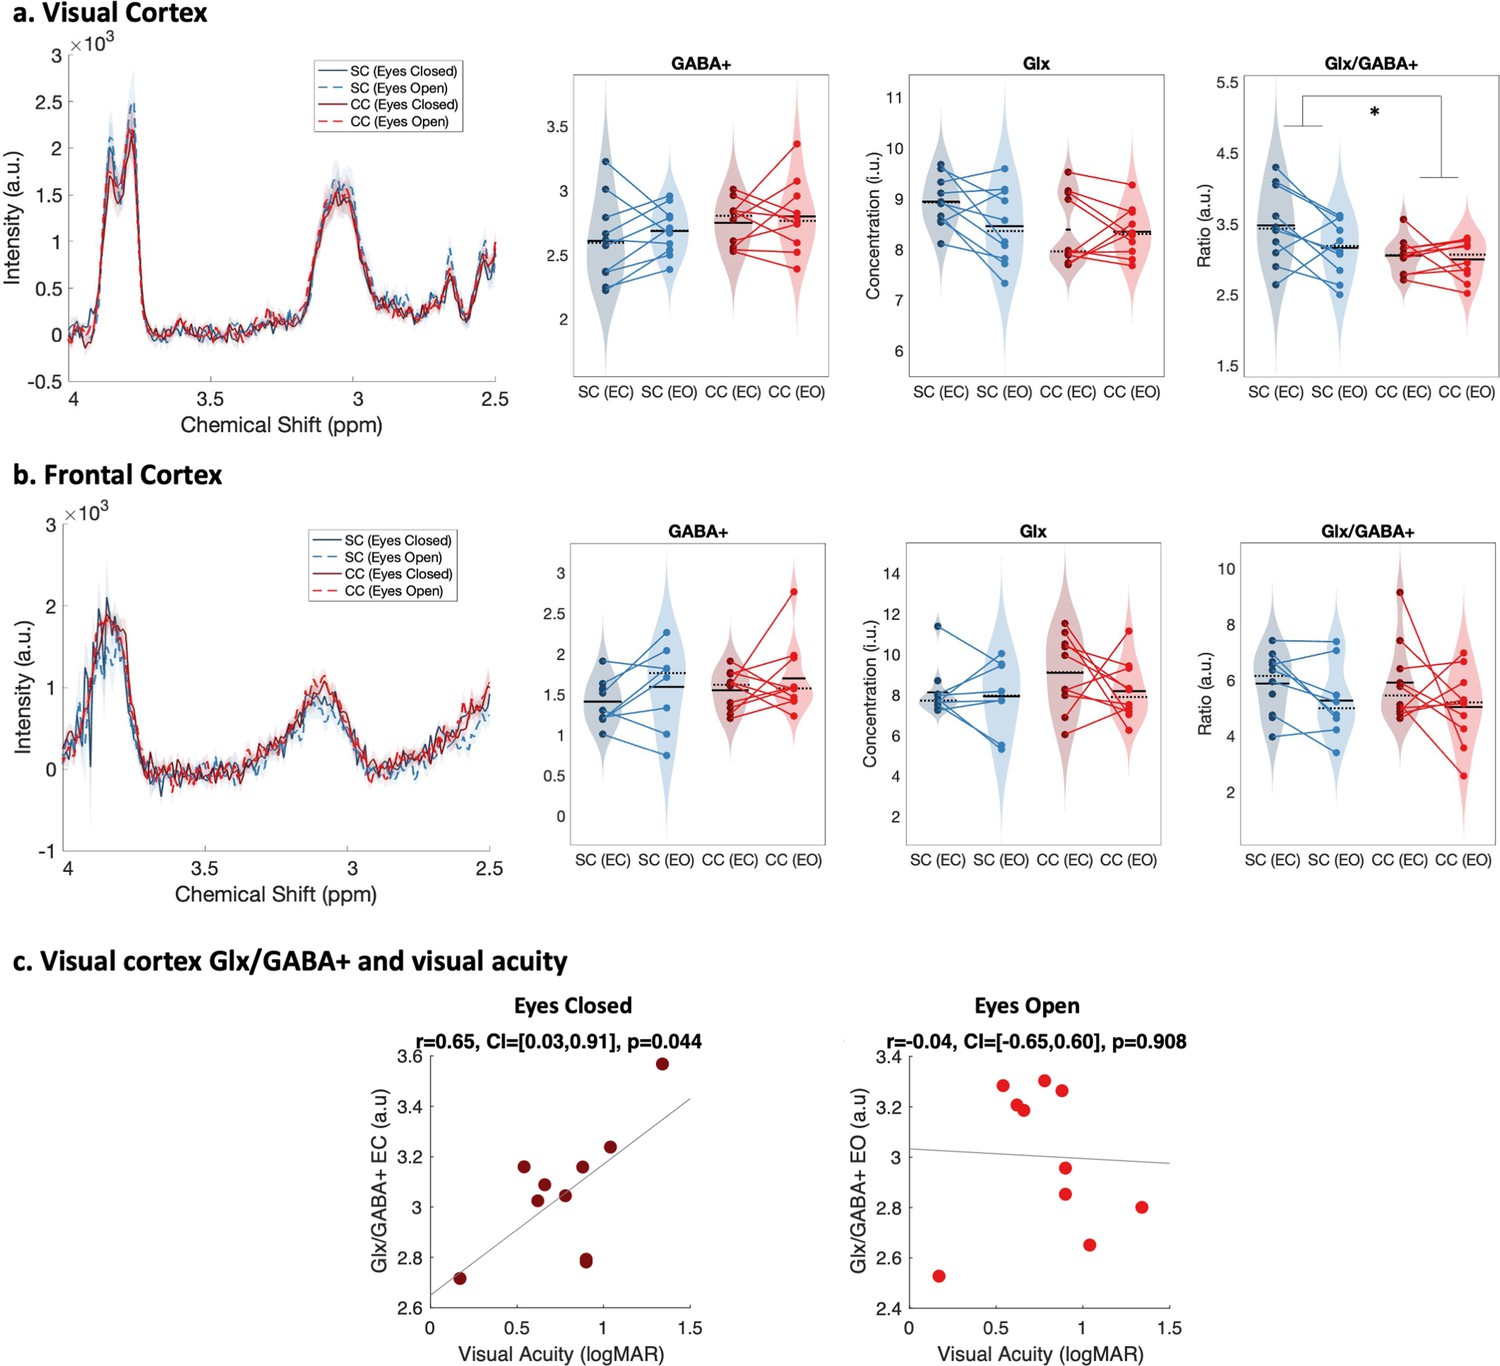
Edited spectra obtained from Magnetic Resonance Spectroscopy (MRS).
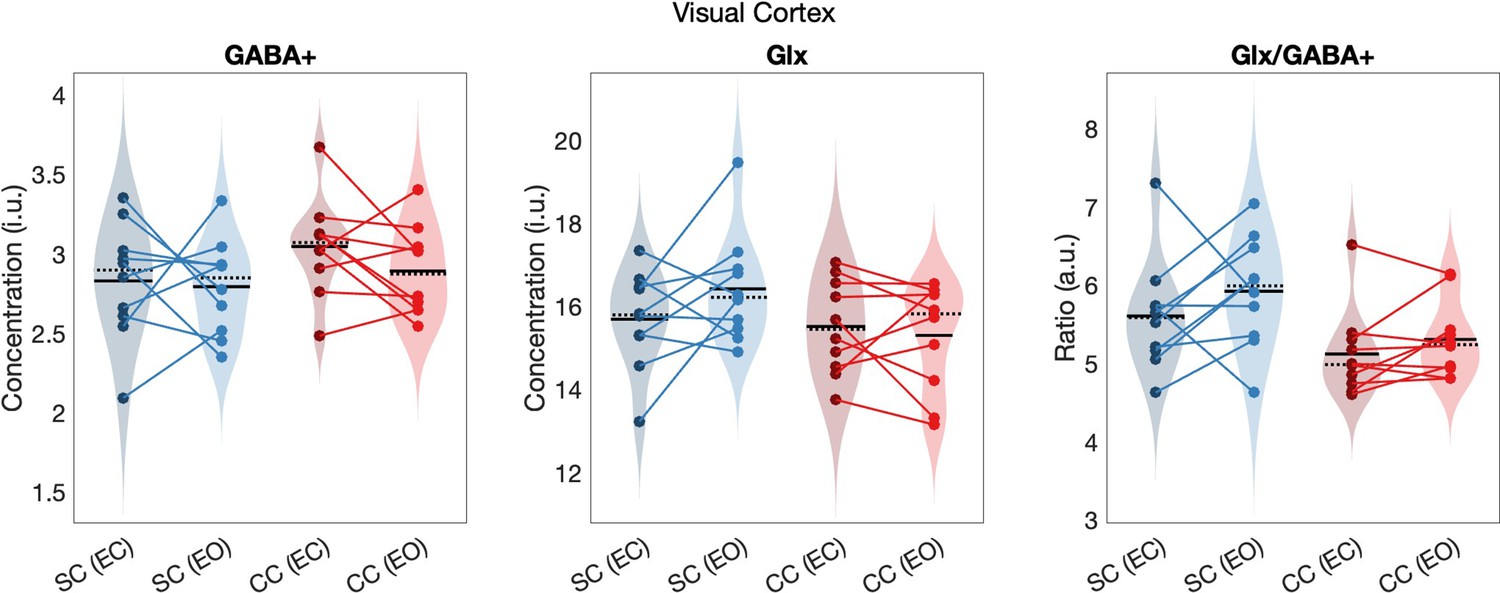
(a) Average edited spectra showing GABA+ and edited Glx peaks in the visual cortices of normally sighted individuals (SC, green) and individuals with reversed congenital cataracts (CC, red) are shown. Edited MRS DIFF spectra are separately displayed for the eyes open (EO), and eyes closed (EC) conditions using dashed and solid lines respectively. The standard error of the mean is shaded. Water-normalized GABA+, water-normalized Glx, and Glx/GABA+ concentration distributions for each group and condition are depicted as violin plots on the right. The solid black lines indicate mean values, and dotted lines indicate median values. The colored lines connect values of individual participants across conditions. (b) Corresponding average edited MRS spectra and water-normalized GABA+, water-normalized Glx and Glx/GABA+ concentration distributions measured from the frontal cortex are displayed. (c) Correlations between visual cortex Glx/GABA+ concentrations in the visual cortex of CC individuals and visual acuity in logMAR units are depicted for the eyes closed (EC, left) and eyes open (EO, right) conditions. The 95% confidence intervals (CI) of the correlation coefficients (r) are reported.
Figure 3
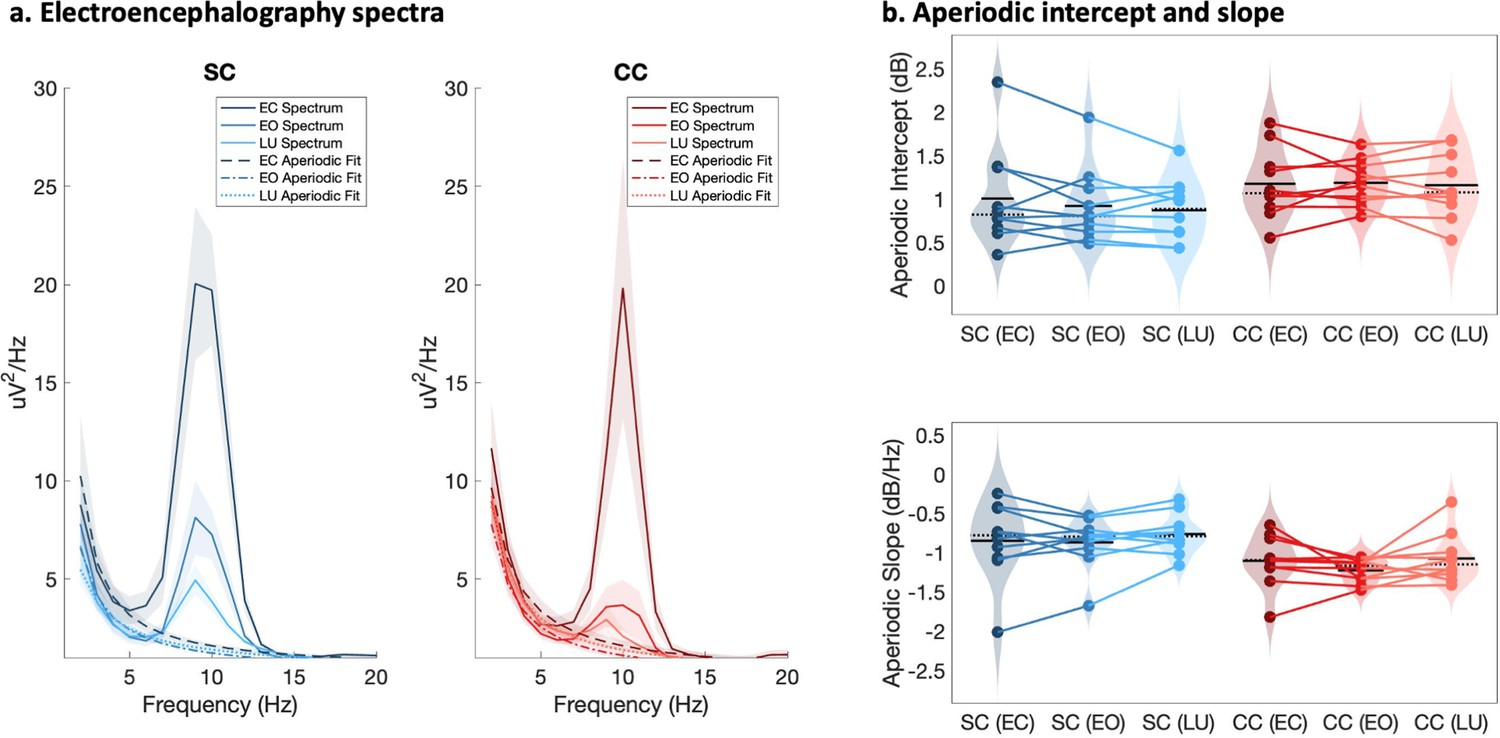
Full spectrum and aperiodic activity of the electroencephalogram (EEG).
(a) EEG spectra across O1 and O2 with the corresponding aperiodic (1 /f) fits for normally sighted individuals (SC, blue, left) and individuals with reversed congenital cataracts (CC, red, right). Spectra of EEG recordings are displayed for the eyes closed (EC) and eyes opened (EO) conditions, as well as while viewing stimuli that changed in luminance (LU). Shaded regions represent the standard error of the mean. (b) Aperiodic intercept (top) and slope (bottom) value distributions for each group and condition are displayed as violin plots. Solid black lines indicate mean values, dotted black lines indicate median values. Colored lines connect values of individual participants across conditions.
Figure 4
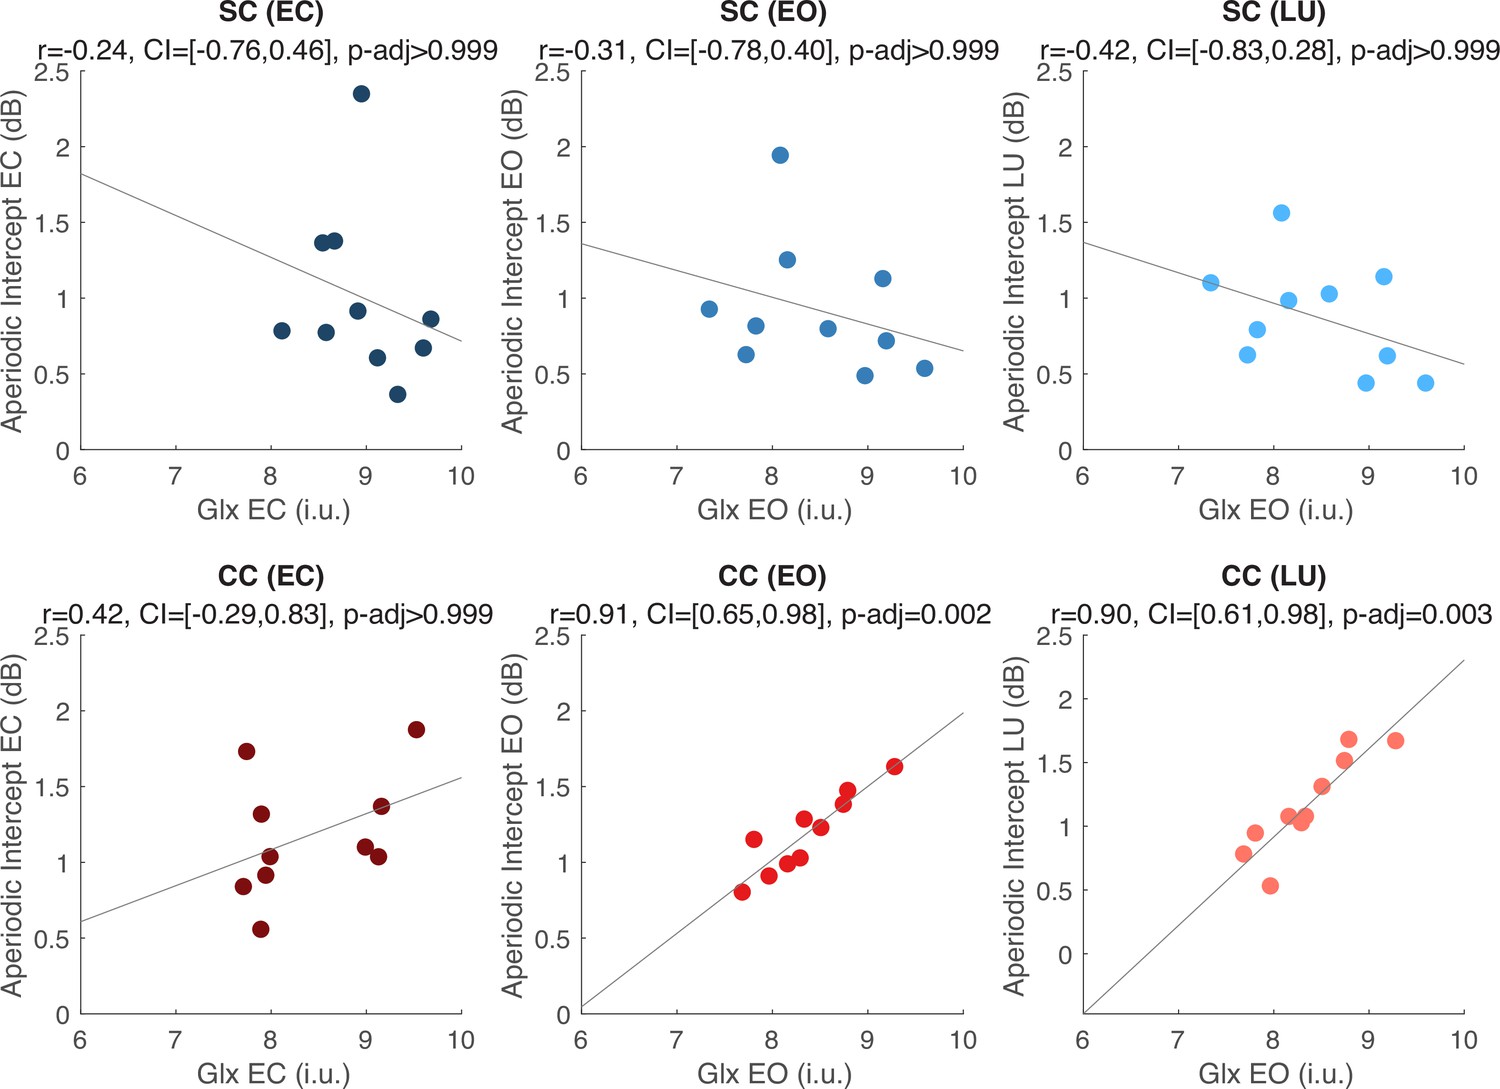
Exploratory correlation analyses between the aperiodic intercept (1–20 Hz) and glutamate/glutamine (Glx) concentration in the visual cortex.
Correlations between water-normalized Glx concentration and aperiodic intercept are shown for the eyes closed (EC, left), eyes open (EO, middle) and visual stimulation (LU, right) conditions for sighted controls (SC, green, top) and individuals with reversed congenital cataracts (CC, red, bottom). The reported adjusted p values (p-adj) are Bonferroni corrected for multiple comparisons. The 95% confidence intervals (CI) of the correlation coefficients (r) are reported.
Appendix 1—figure 1

Visual acuity in normally sighted individuals (SC) and congenital cataract-reversal (CC individuals).
Binocularly measured visual acuity distributions in logarithmic of minimum angle of resolution (logMAR) are displayed as violin plots. Solid black lines indicate mean values, dotted black lines indicate median values.
Appendix 1—figure 2
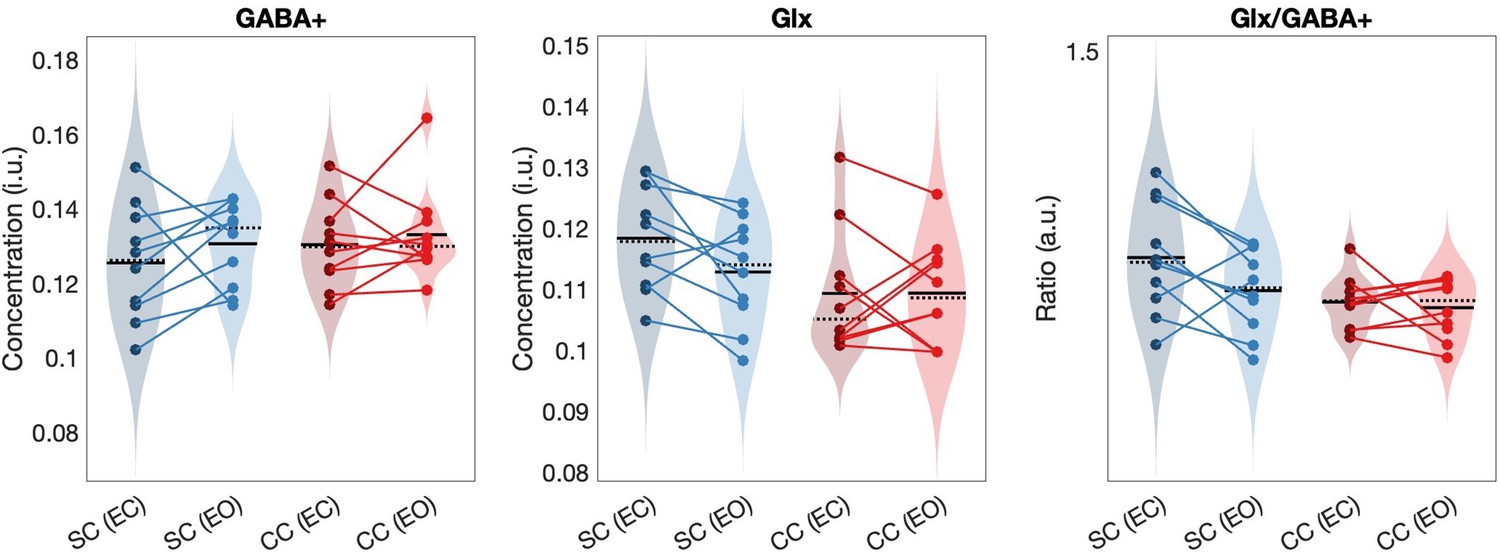
Edited (DIFF) spectrum metabolites quantified via Osprey.
Water-normalized and tissue corrected GABA+, water-normalized and tissue-corrected Glx, and Glx/GABA+ concentration distributions from the visual cortex are depicted as violin plots for each group and condition (left to right). The solid black lines indicate mean values, and dotted lines indicate median values. The colored lines connect values of individual participants across conditions. Results for congenitally cataract-reversal individuals (CC) and for normally sighted controls (SC) are shown in blue and red, respectively. EC = Eyes closed, EO = Eyes open.,
Appendix 1—figure 3

OFF spectrum metabolites quantified via Osprey.
Water-normalized NAA concentration distributions from the visual cortex are depicted as violin plots for each group and condition (left to right). The solid black lines indicate mean values, and dotted lines indicate median values. The colored lines connect values of individual participants across conditions. For abbreviations see Appendix 1—figure 2.
Appendix 1—figure 4
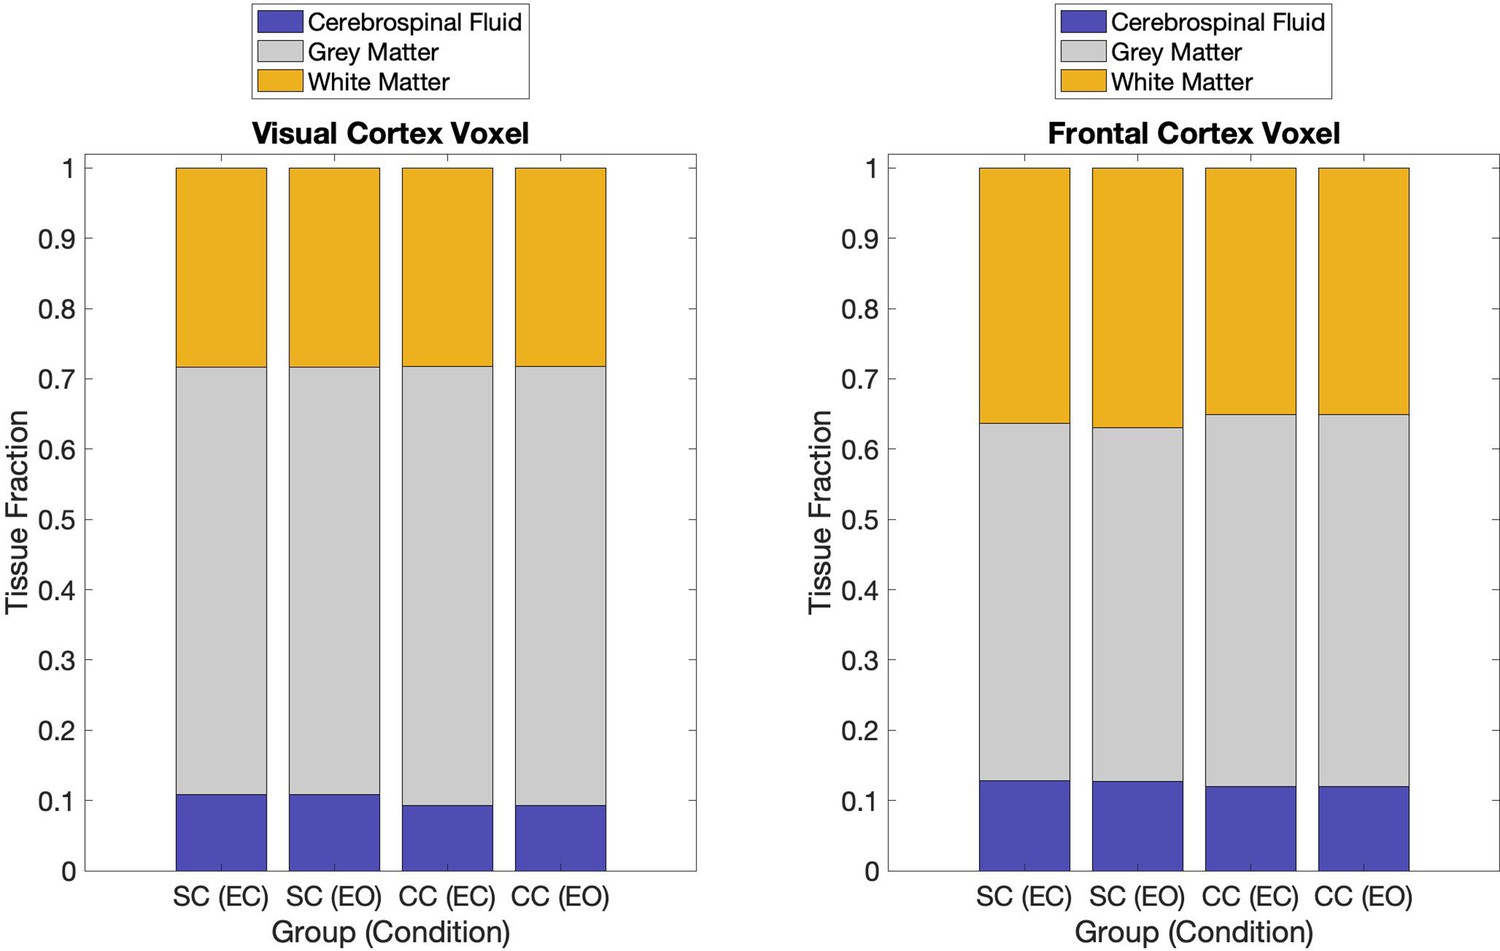
Tissue fractions for Magnetic Resonance Spectroscopy voxels.
The fractions of white matter (yellow), grey matter (grey) and cerebrospinal fluid (blue) are displayed for the eyes open (EO), and eyes closed (EC) conditions in the congenital cataract-reversal group (CC) and the normally sighted control group (SC). Tissue fractions were separately calculated for the visual (left) and frontal (right) cortex voxels.
Appendix 1—figure 5
Cr-normalized edited (DIFF) spectrum metabolites.
Creatine (Cr)-normalized GABA+, Cr-normalized Glx, and Glx/GABA+ concentration distributions from the visual cortex are depicted as violin plots for each group and condition (left to right). The solid black lines indicate mean values, and dotted lines indicate median values. The colored lines connect values of individual participants across conditions.
Appendix 1—figure 6
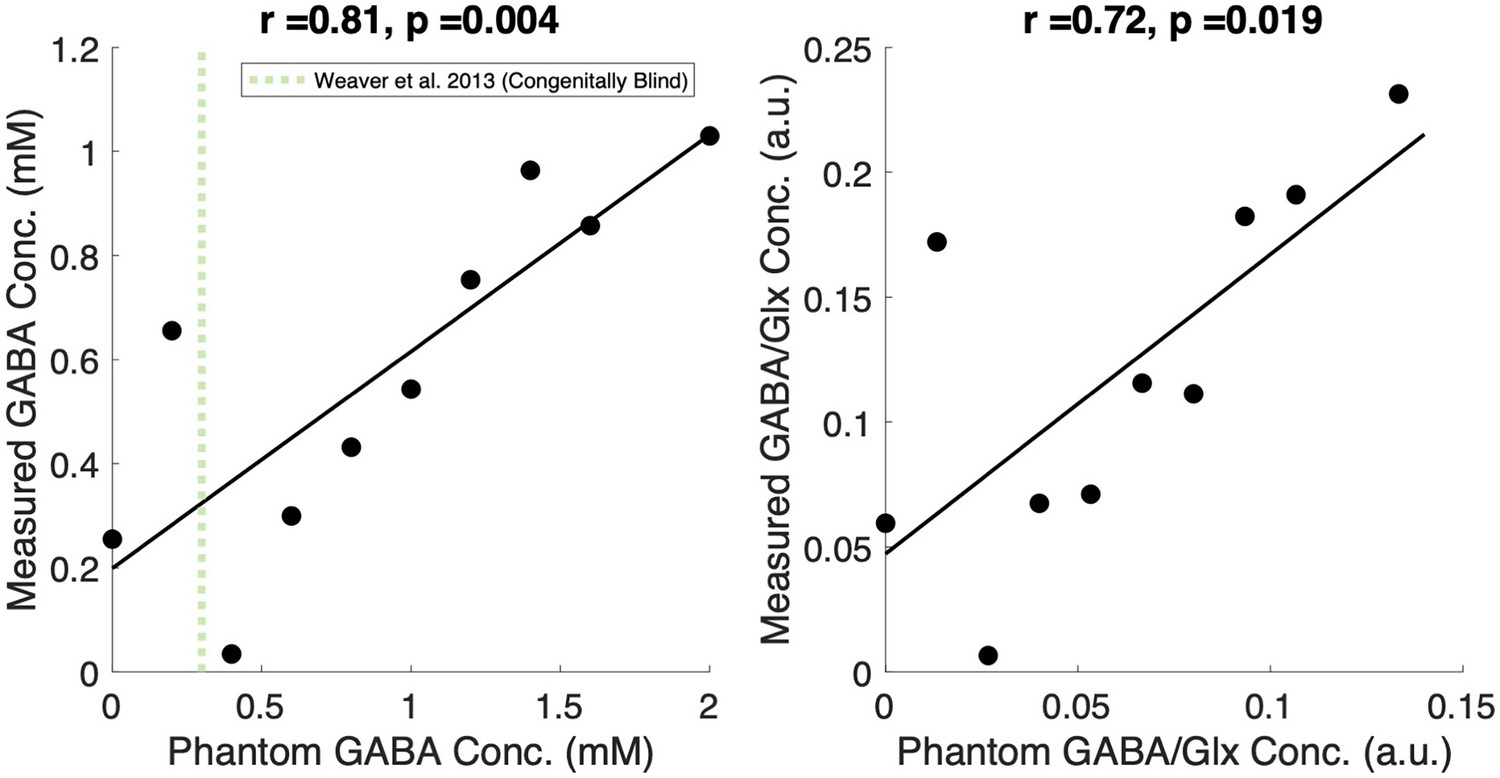
Phantom testing of GABA concentrations.
Plots depicting the correlation between known and measured concentrations from phantom scans of Gamma-Aminobutyric Acid (GABA; left) and the ratio of GABA to Glutamate/Glutamine (GABA/Glx, right) concentration. In the left panel, previously reported GABA concentration from the visual cortex of congenitally blind individuals (Weaver et al., 2013) is marked with a vertical dotted line.
Appendix 1—figure 7
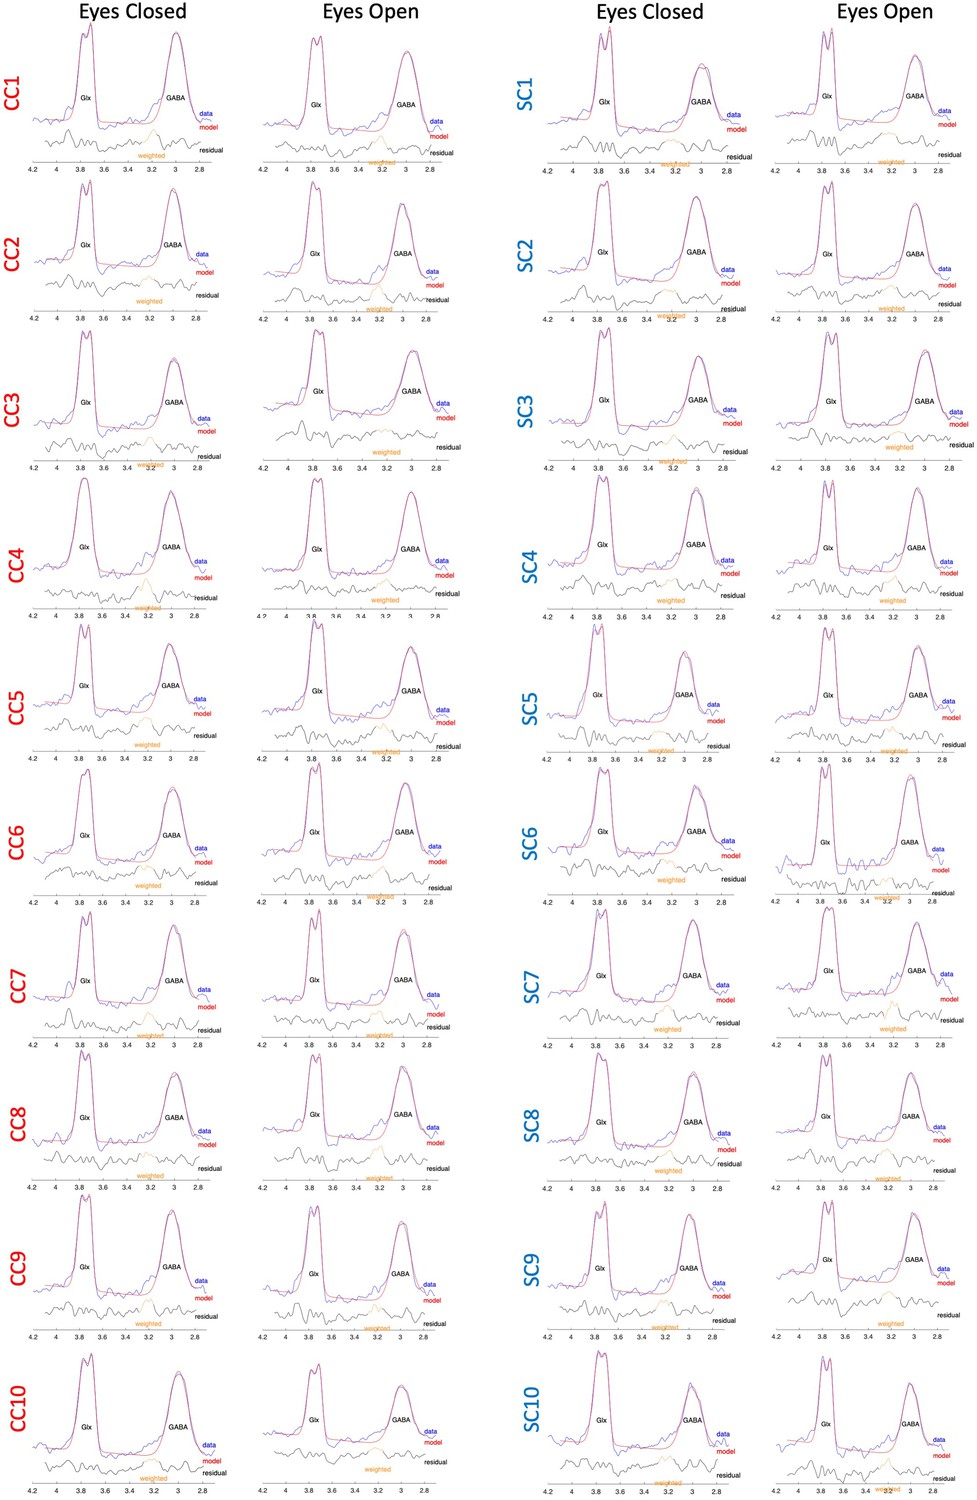
Edited spectra of participants showing GABA+ and Glx peaks.
Individual participants’ edited spectra and the respective model fits for congenital cataract-reversal (CC, left) and normally sighted control (SC, right) individuals. Spectra are shown as output by GannetFit.m for the eyes closed and eyes open conditions for each subject.
Appendix 1—figure 8
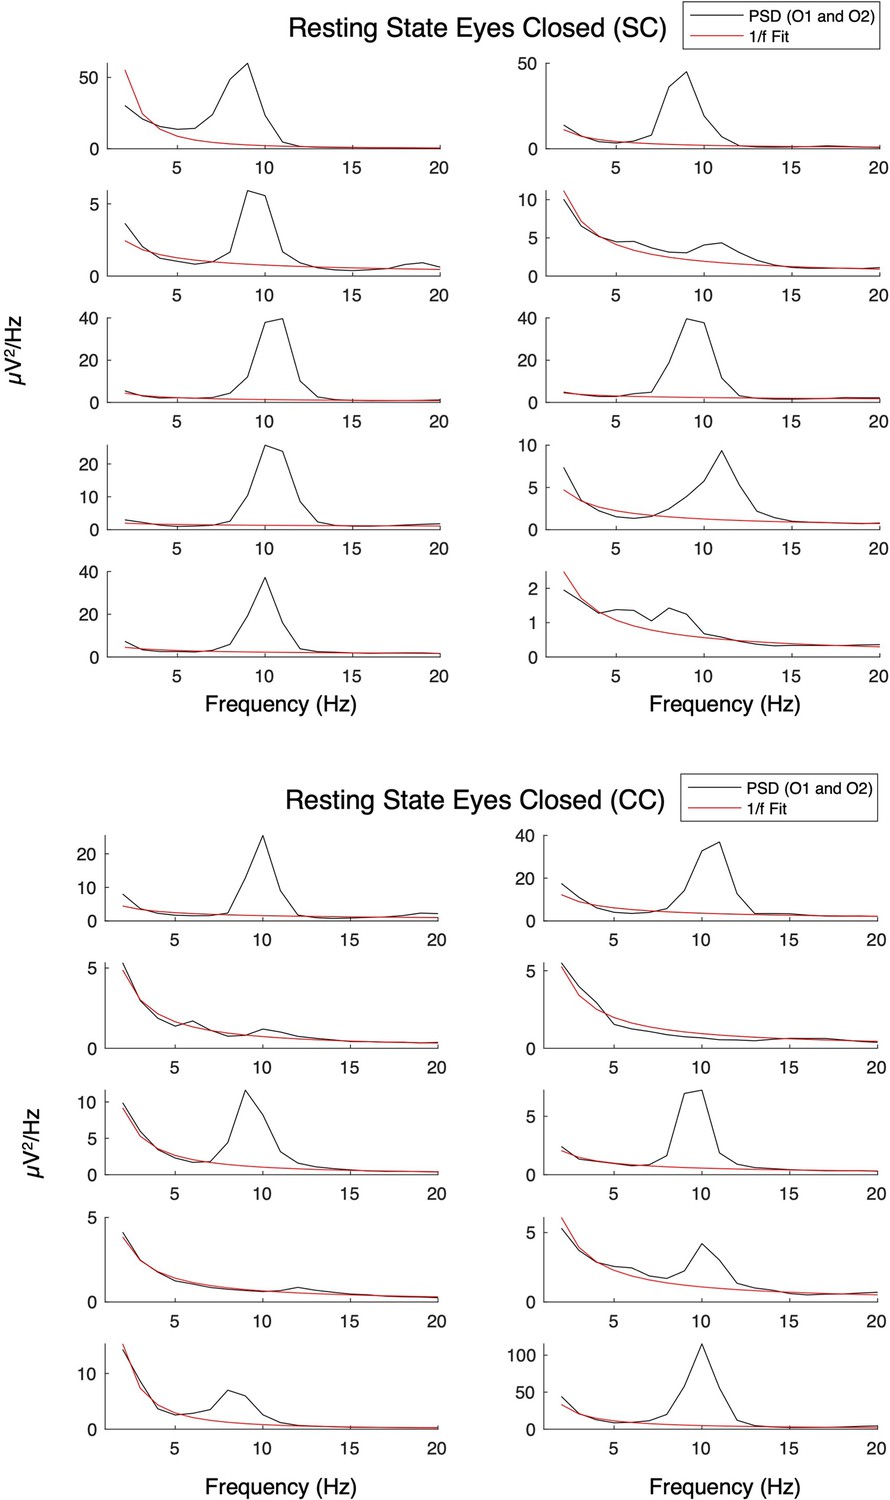
Aperiodic fits for normally sighted control (SC, top) and congenital cataract-reversal (CC, bottom) individuals at occipital electrodes during rest with eyes closed.
Solid black lines indicate the power spectral density, red lines indicate the aperiodic (1 /f) fit in the 1–20 Hz range, excluding alpha frequencies.
Appendix 1—figure 9
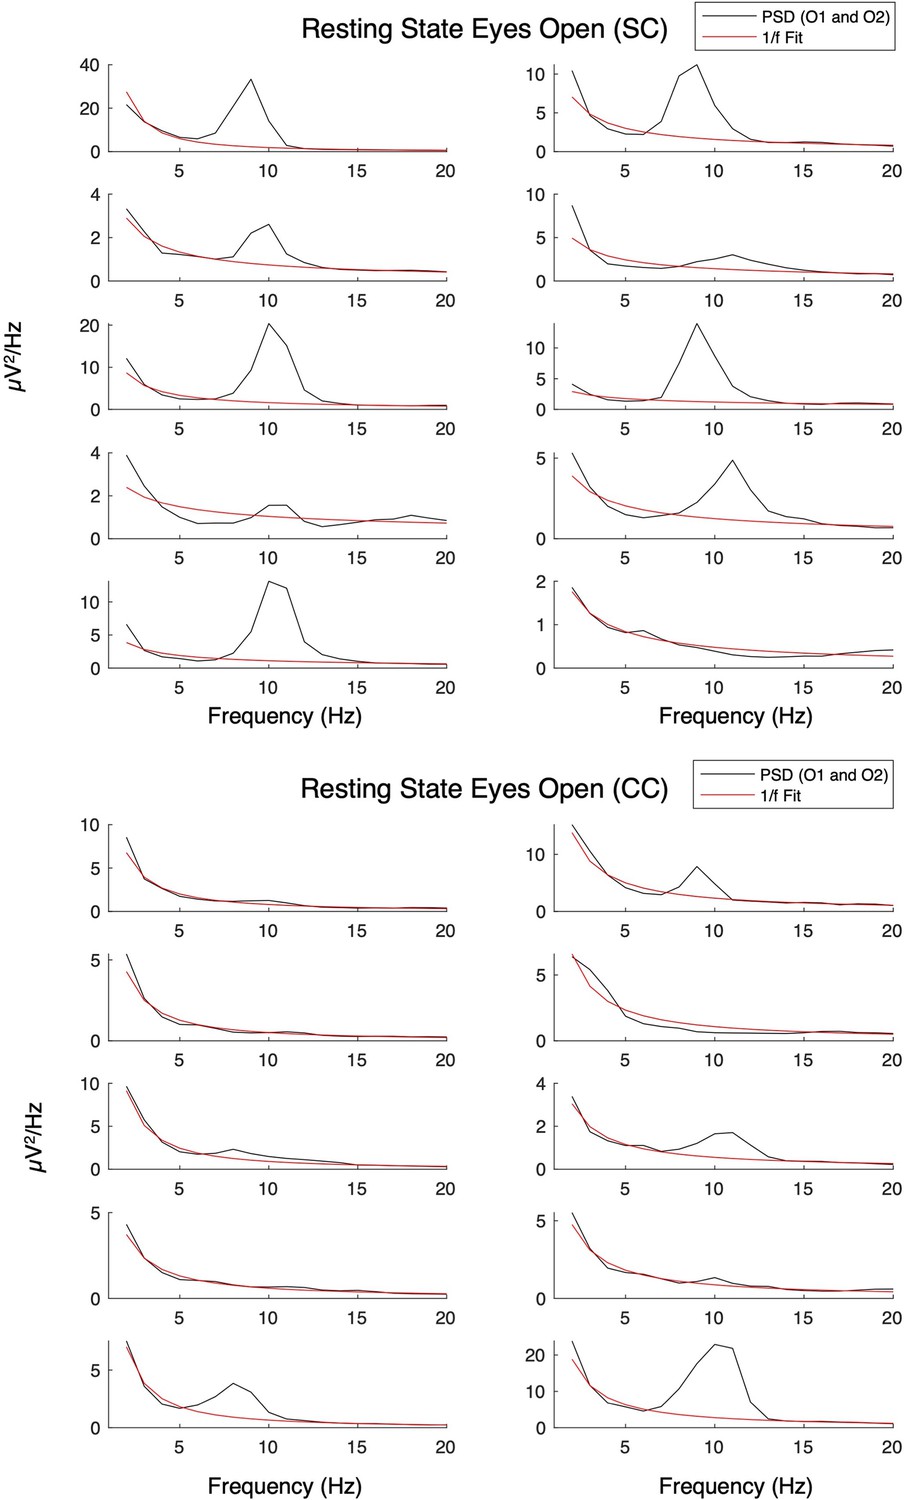
Aperiodic fits for normally sighted control (SC, top) and congenital cataract-reversal (CC, bottom) individuals at occipital electrodes during rest with eyes open.
Solid black lines indicate the power spectral density, red lines indicate the aperiodic (1 /f) fit in the 1–20 Hz range, excluding alpha frequencies.
Appendix 1—figure 10
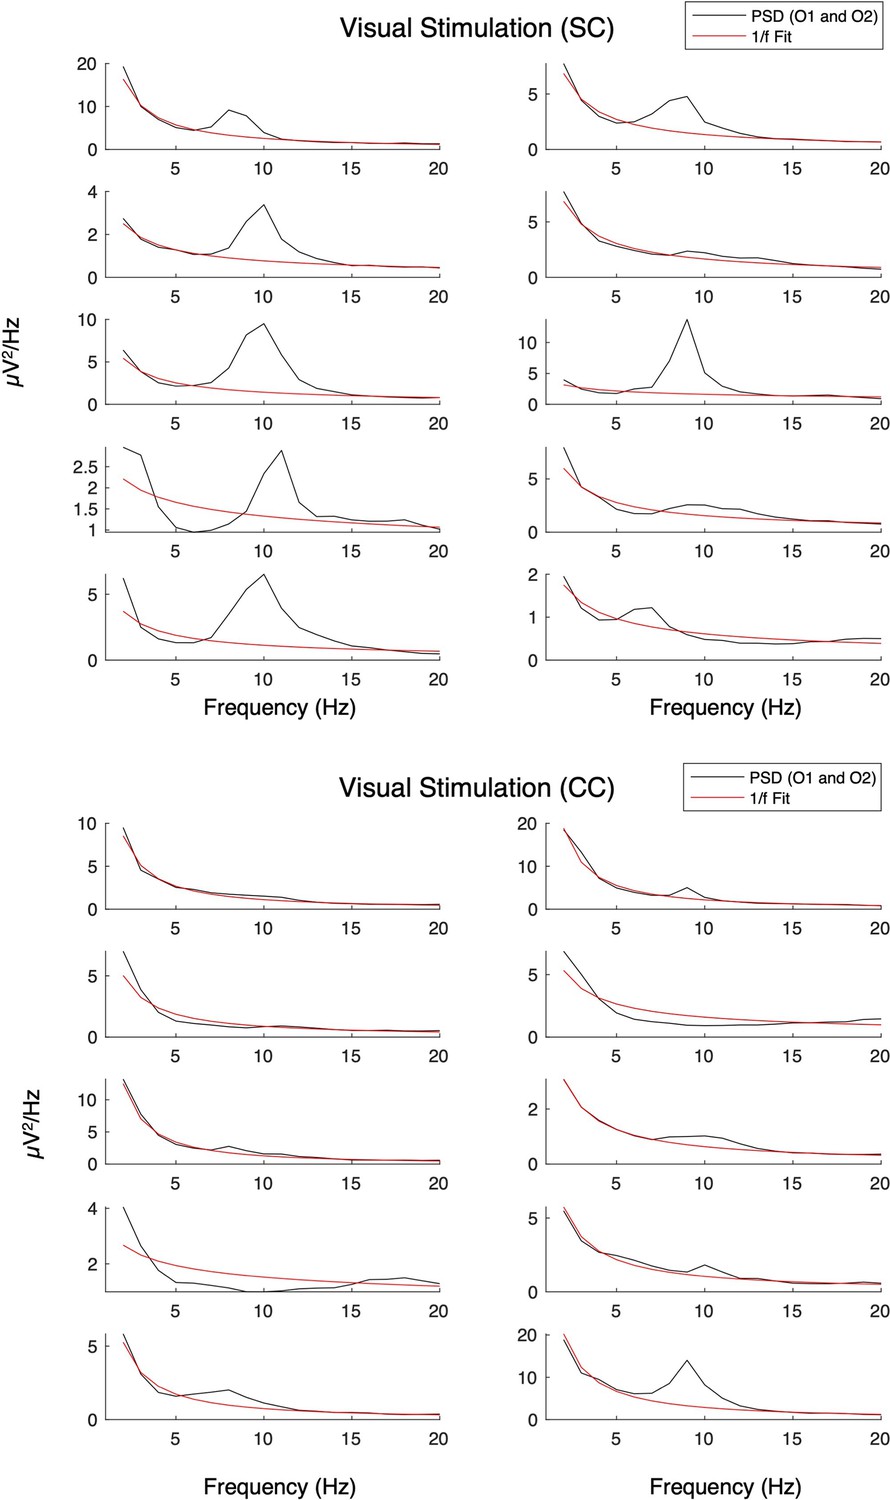
Aperiodic fits for normally sighted control (SC, top) and congenital cataract-reversal (CC, bottom) individuals at occipital electrodes during visual stimulation.
Solid black lines indicate the power spectral density, red lines indicate the aperiodic (1 /f) fit in the 1–20 Hz range, excluding alpha frequencies.
Appendix 1—figure 11
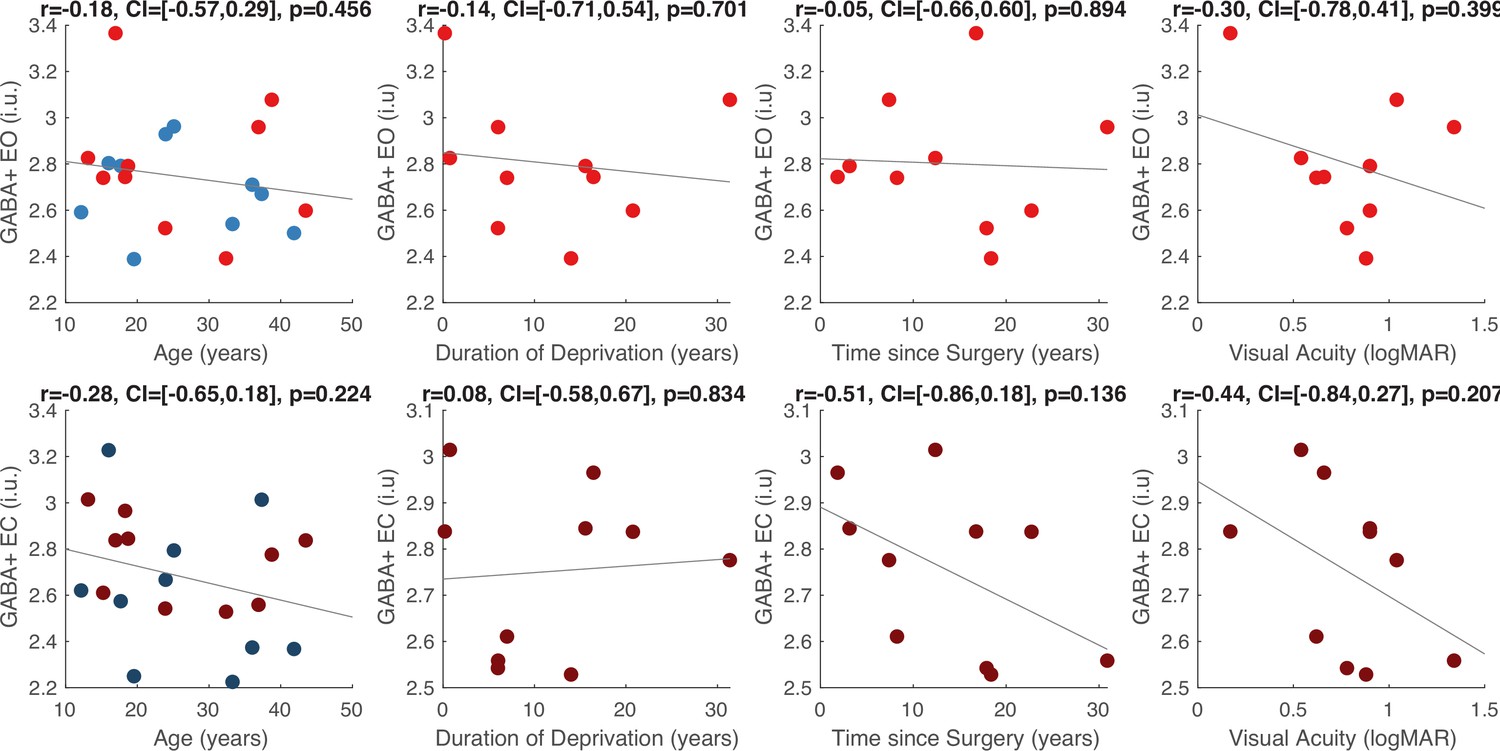
Effect of visual deprivation history on GABA+ concentration.
Correlations between visual cortex GABA+ concentration and chronological age of the congenital cataract-reversal (CC, red) and normally sighted individuals (SC, blue, see left panel). Second to fourth panels depict correlations between visual cortex GABA+ concentration and duration of visual deprivation, time since surgery and visual acuity in the CC individuals, respectively. Correlations were separately calculated for the eyes open (EO, top row) and eyes closed (EC, bottom row) conditions. The 95% confidence intervals (CI) of the correlation coefficients (r) are reported.
Appendix 1—figure 12
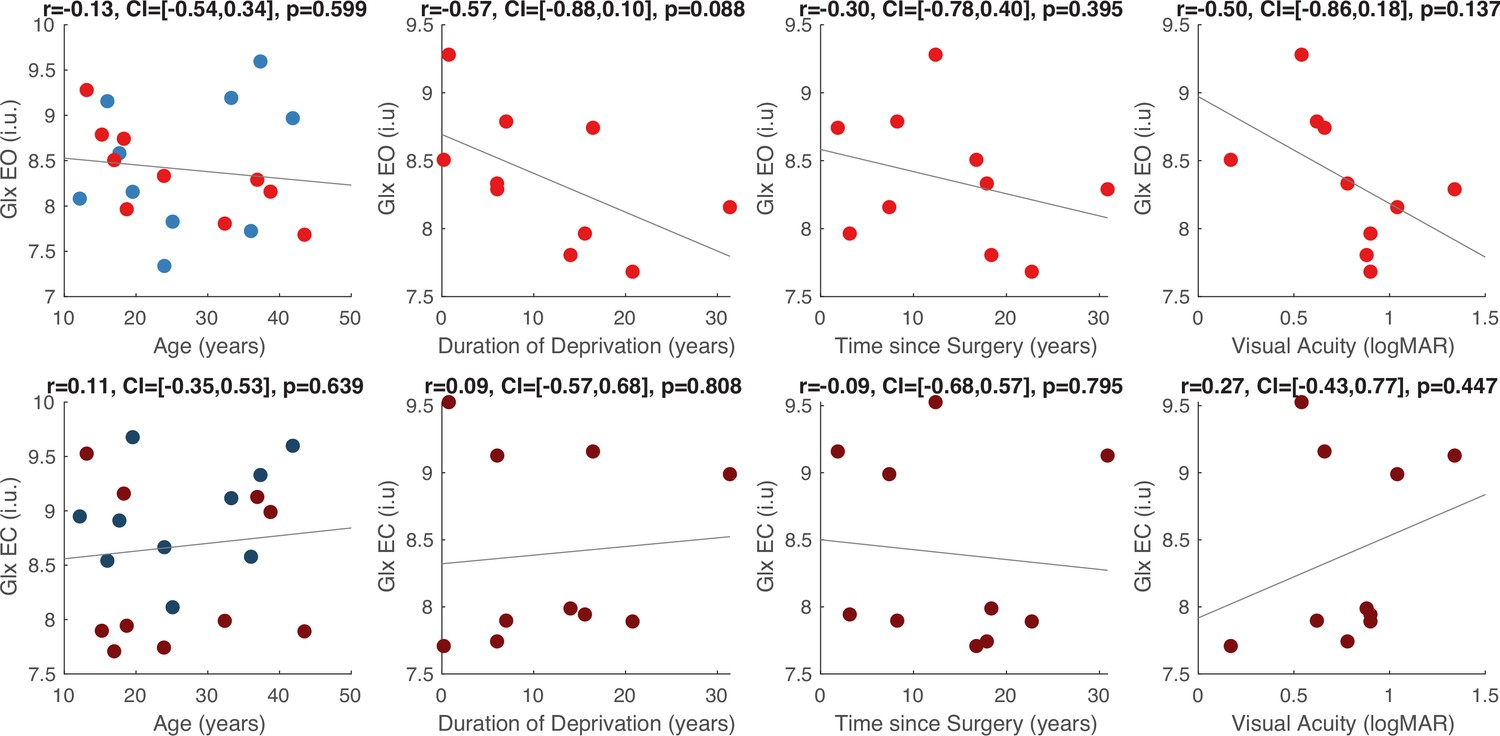
Effect of visual deprivation history on Glx concentration.
Correlations between visual cortex Glx concentration and chronological age of the congenital cataract-reversal (CC, red) and normally sighted individuals (SC, blue, see left panel). Second to fourth panels depict correlations between visual cortex Glx concentration and duration of visual deprivation, time since surgery and visual acuity in the CC individuals, respectively. Correlations were separately calculated for the eyes open (EO, top row) and eyes closed (EC, bottom row) conditions. The 95% confidence intervals (CI) of the correlation coefficients (r) are reported.
Appendix 1—figure 13
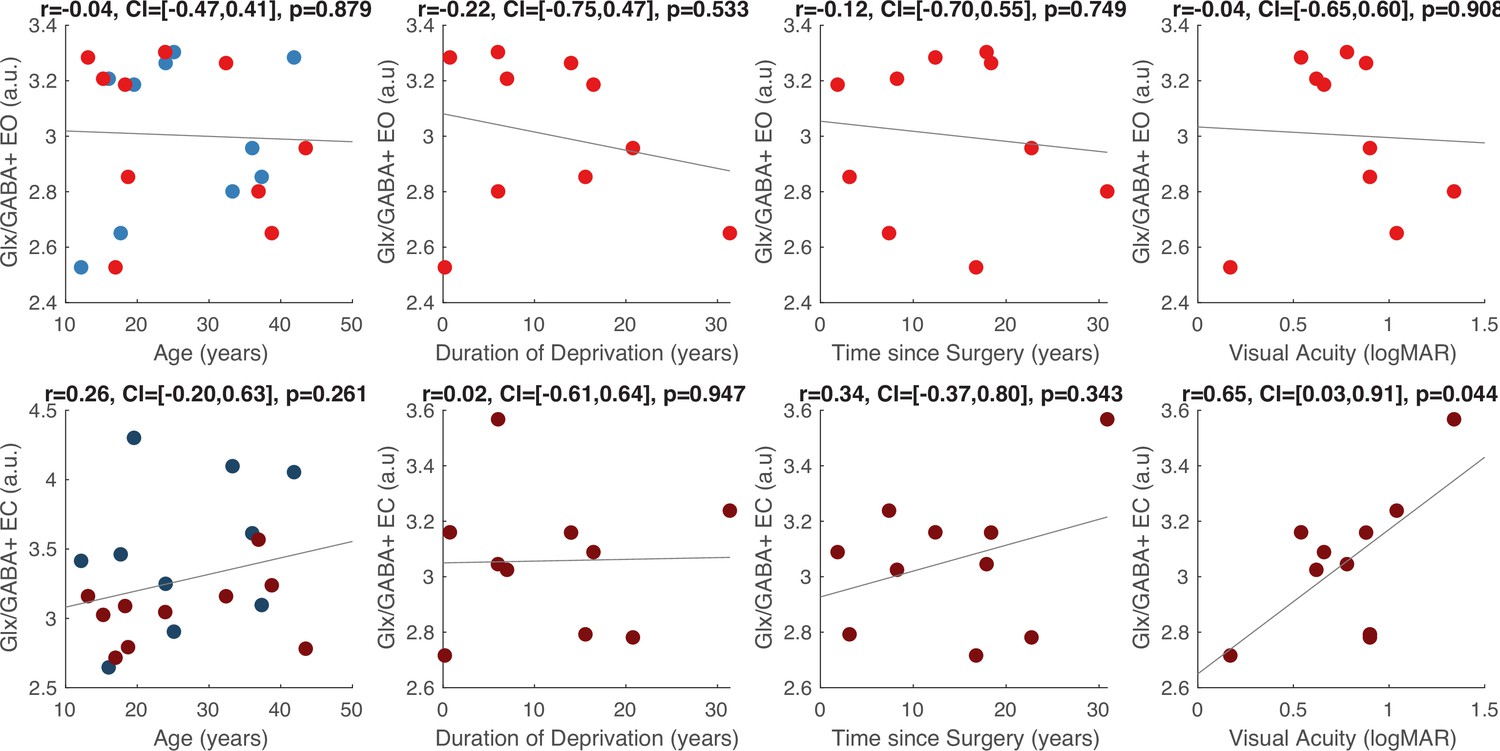
Effect of visual deprivation history on Glx/GABA concentration.
Correlations between visual cortex Glx/GABA+ concentration and chronological age of the congenital cataract-reversal (CC, red) and normally sighted individuals (SC, blue, see left panel). Second to fourth panels depict correlations between visual cortex Glx/GABA+ concentration and duration of visual deprivation, time since surgery and visual acuity in the CC individuals, respectively. Correlations were separately calculated for the eyes open (EO, top row) and eyes closed (EC, bottom row) conditions. The 95% confidence intervals (CI) of the correlation coefficients (r) are reported.
Appendix 1—figure 14
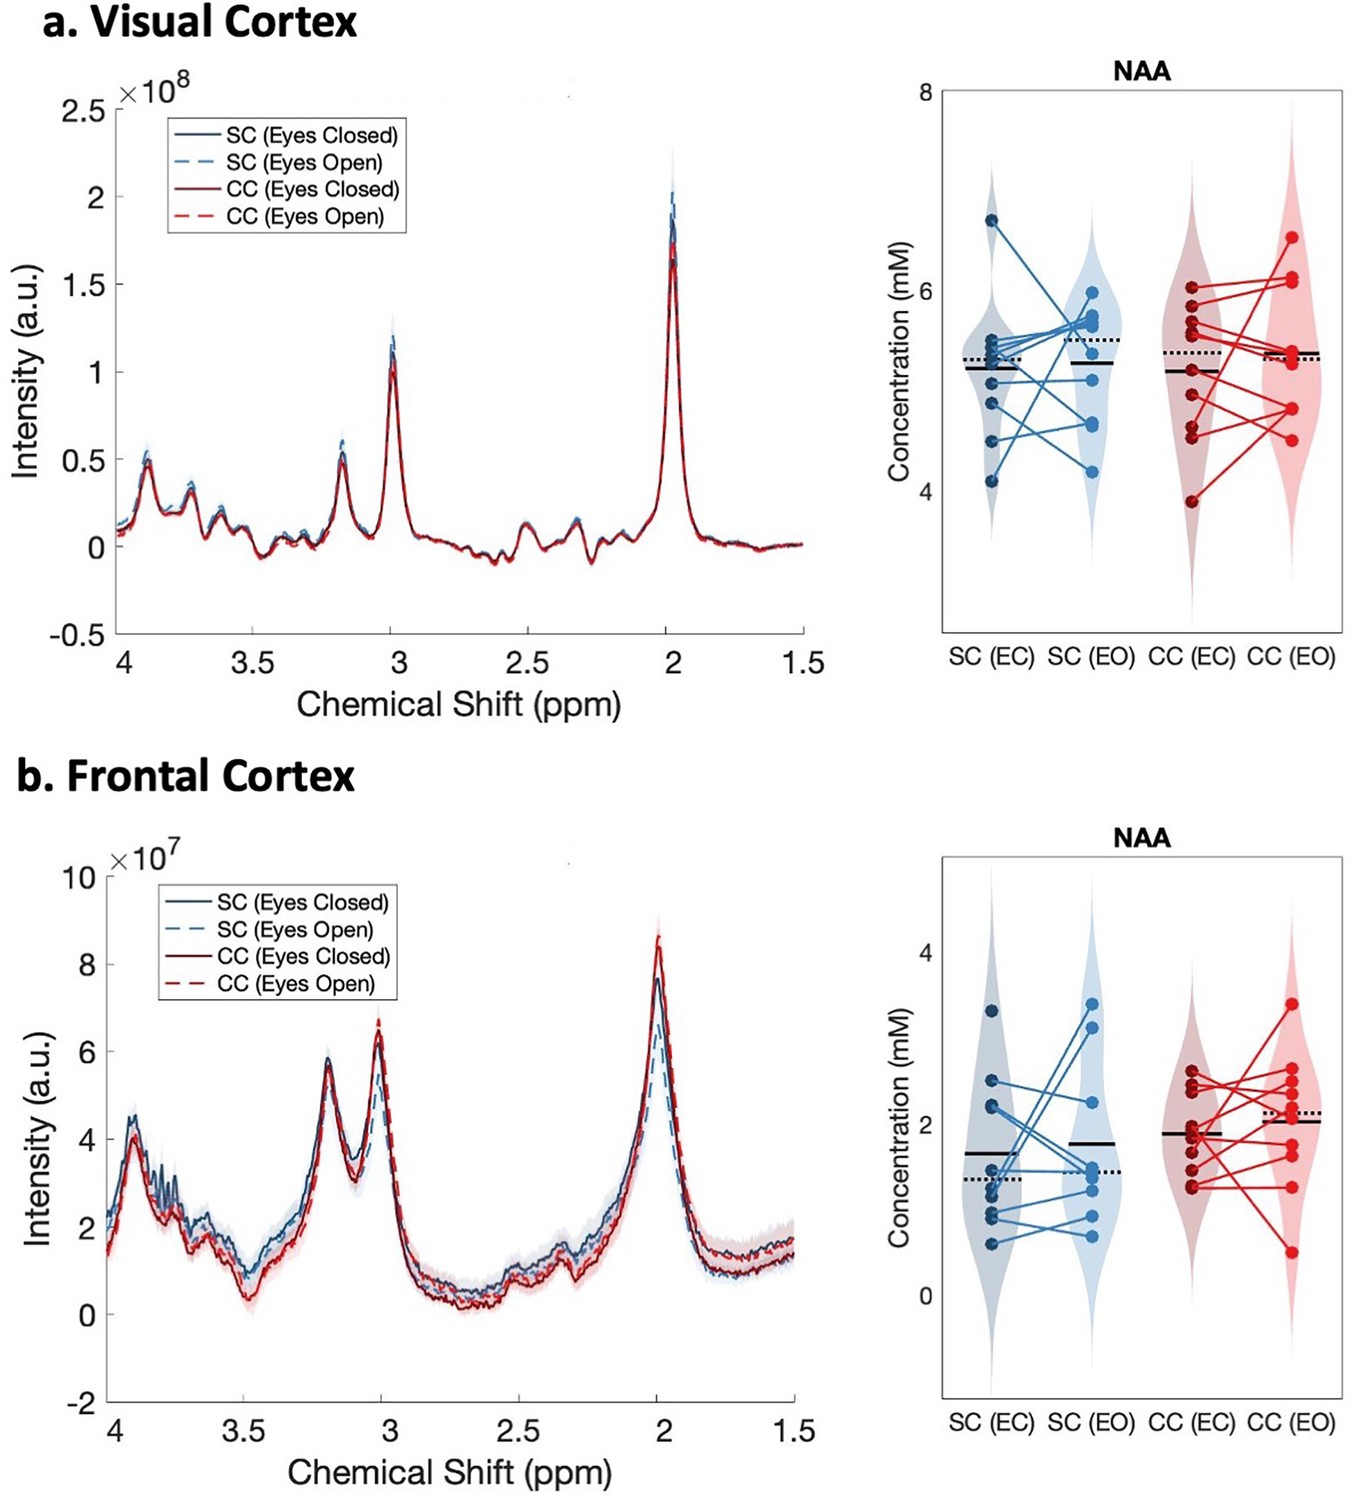
OFF spectra obtained from Magnetic Resonance Spectroscopy (MRS).
(a) The average spectra show NAA peaks in the visual cortices of normally sighted individuals (SC, green) and individuals with reversed congenital cataracts (CC, red) are shown. Spectra are displayed for the eyes open (EO), and eyes closed (EC) conditions. The standard error of the mean is shaded. NAA concentration distributions for each group and condition are demonstrated as violin plots on the right. The solid black lines indicate mean values, and dotted lines indicate median values. The colored lines connect values of individual participants across conditions. (b) Corresponding average MRS spectra and NAA concentration distributions measured from the frontal cortex are displayed.
Appendix 1—figure 15

Aperiodic intercept (top) and slope (bottom) for congenital cataract-reversal (CC, red) and age-matched normally sighted control (SC, blue) individuals in frontal electrodes.
Distributions of these parameters are displayed as violin plots for three conditions; at rest with eyes closed (EC), at rest with eyes open (EO) and during visual stimulation (LU). Aperiodic parameters were calculated across electrodes Fp1 and Fp2. Solid black lines indicate mean values, dotted black lines indicate median values. Colored lines connect values of individual participants across conditions.
Appendix 1—figure 16
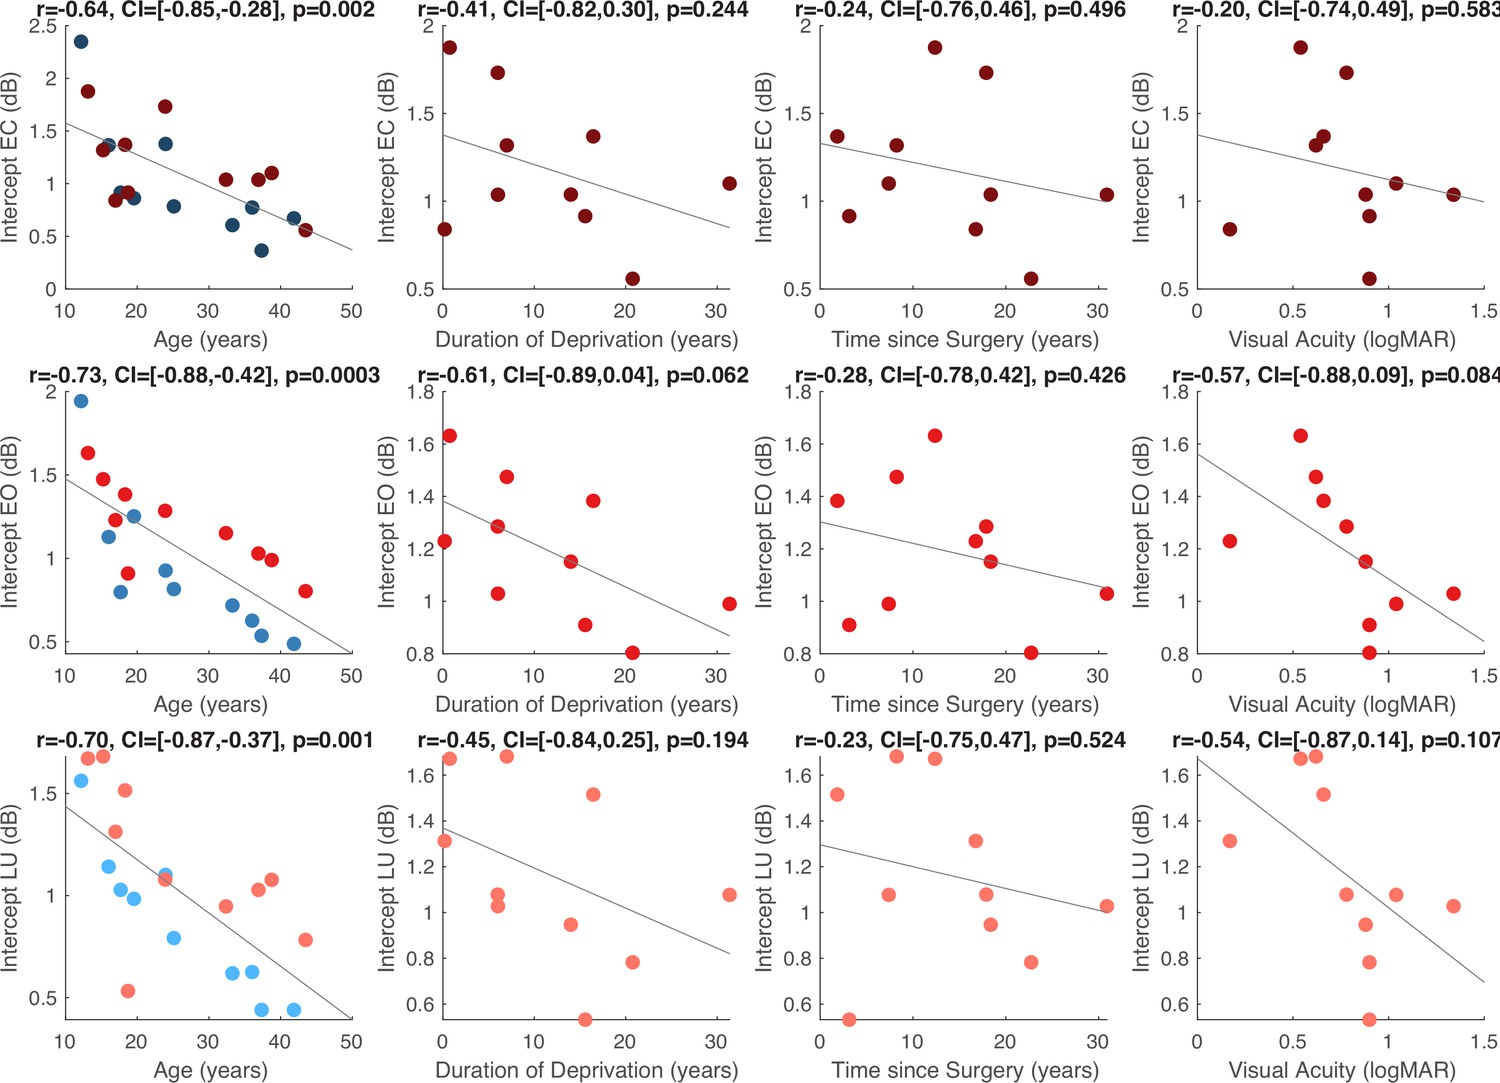
Effect of visual deprivation history on aperiodic intercept.
Correlations between aperiodic intercept at occipital electrodes and chronological age of the congenital cataract-reversal (CC, red) and normally sighted individuals (SC, blue, see left panel). Second to fourth panels depict correlations between aperiodic intercept and duration of visual deprivation, time since surgery and visual acuity in the CC individuals, respectively. Correlations were separately calculated for the aperiodic intercept while participants viewed stimuli that changed in luminance (LU, top row) and the eyes open (EO, middle row) and eyes closed (EC, bottom row) conditions. The 95% confidence intervals (CI) of the correlation coefficients (r) are reported.
Appendix 1—figure 17
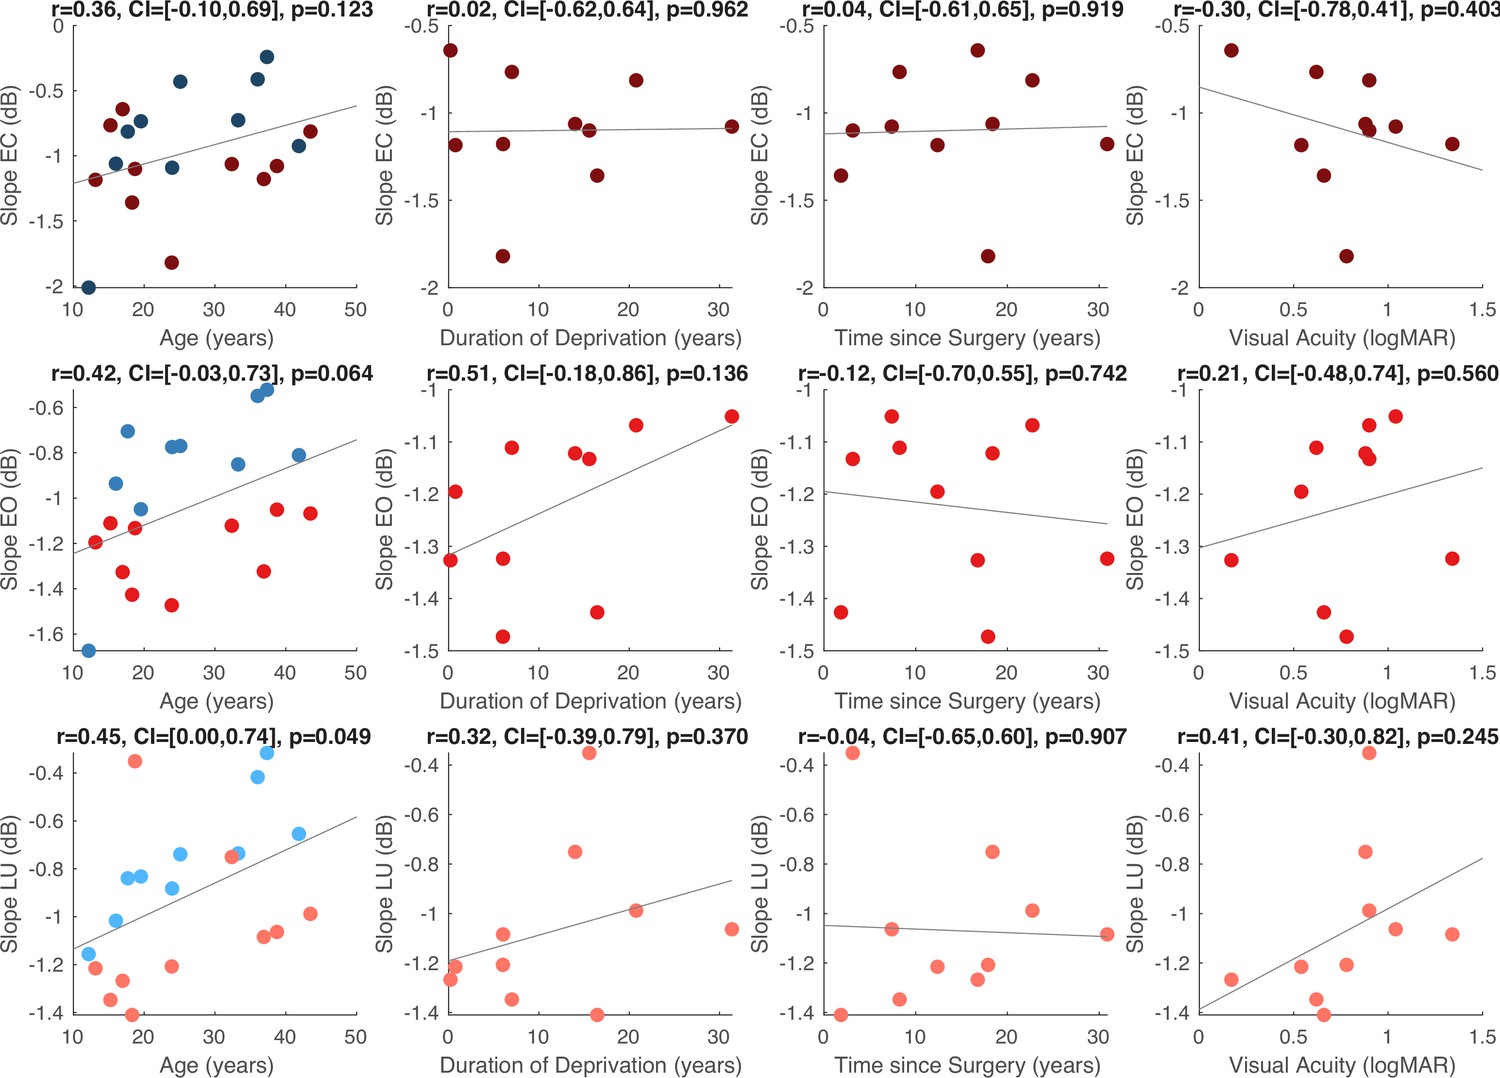
Effect of visual deprivation history on aperiodic slope.
Correlations between aperiodic slope across occipital electrodes and chronological age of the congenital cataract-reversal (CC, red) and normally sighted individuals (SC, blue, see left panel). Second to fourth panels depict correlations between aperiodic slope and duration of visual deprivation, time since surgery and visual acuity in the CC individuals, respectively. Correlations separately calculated for the aperiodic slope while participants viewed flickering stimuli (LU, top row) and the eyes open (EO, middle row) and eyes closed (EC, bottom row) conditions. The 95% confidence intervals (CI) of the correlation coefficients (r) are reported.
Appendix 1—figure 18
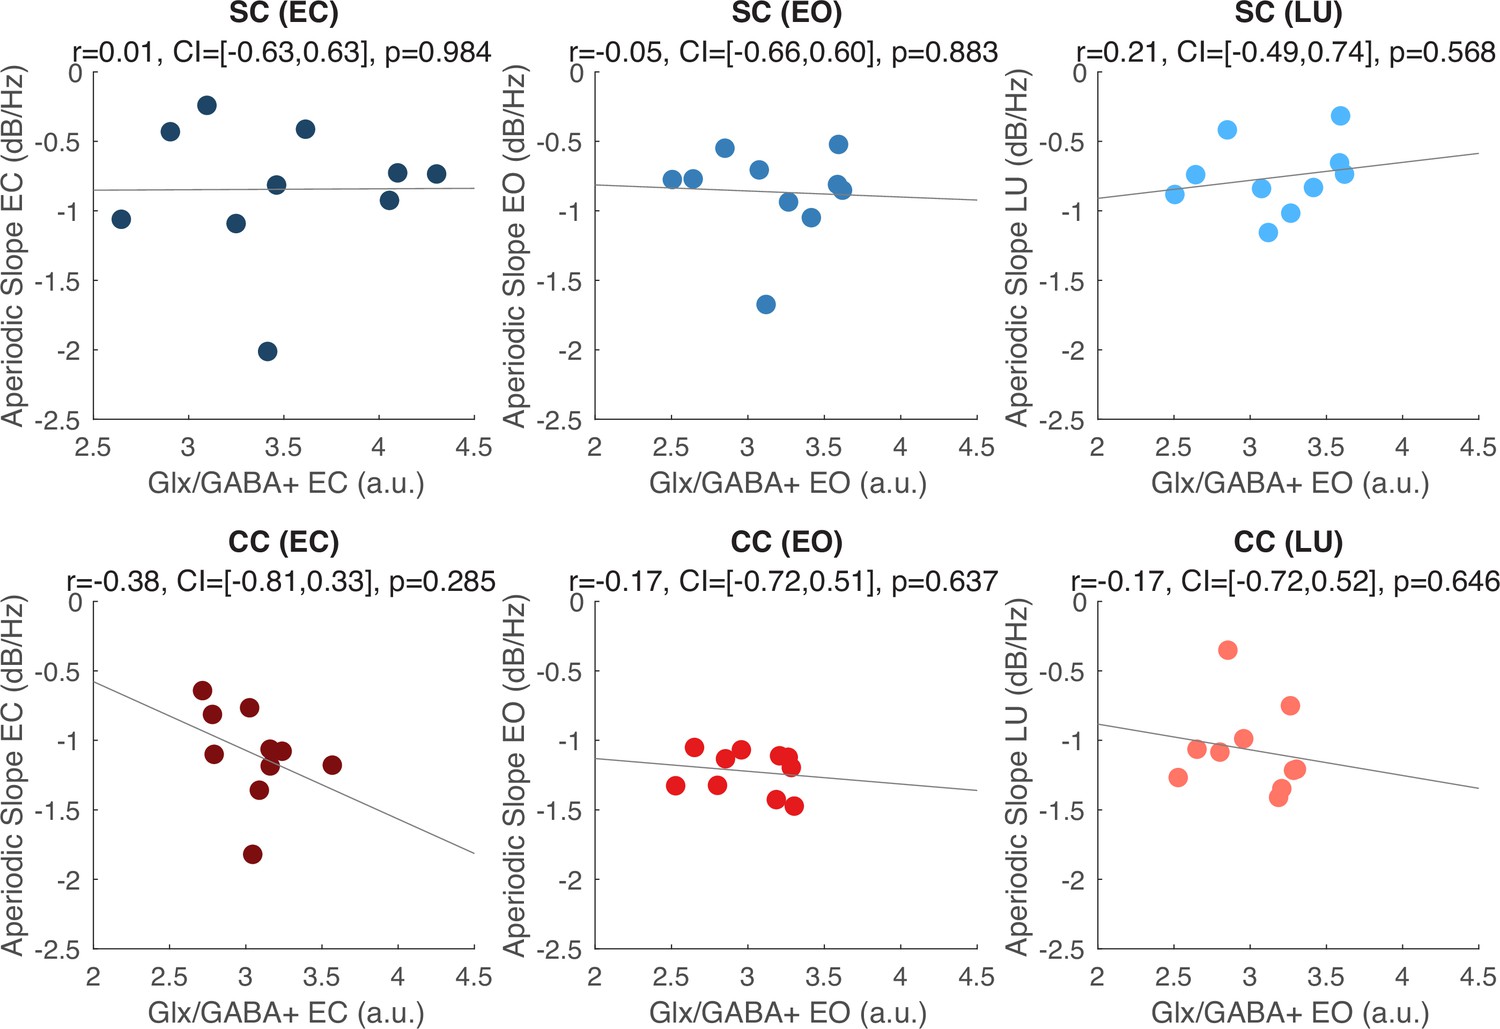
Correlation between aperiodic slope and Glx/GABA+ concentration.
Correlations between the aperiodic slope and visual cortex Glx/GABA+ concentration measured at rest with eyes closed (EC) (left panels) and eyes open (EO) (middle panels), and the correlation between aperiodic slope measured while subjects viewed flickering stimuli (LU) and visual cortex Glx/GABA+ concentration measured in the EO condition (right panels), are depicted. Correlations were calculated separately for normally sighted control (SC, blue, top row) and congenital cataract-reversal (CC, red, bottom row) individuals. The 95% confidence intervals (CI) of the correlation coefficients (r) are reported.
Appendix 1—figure 19
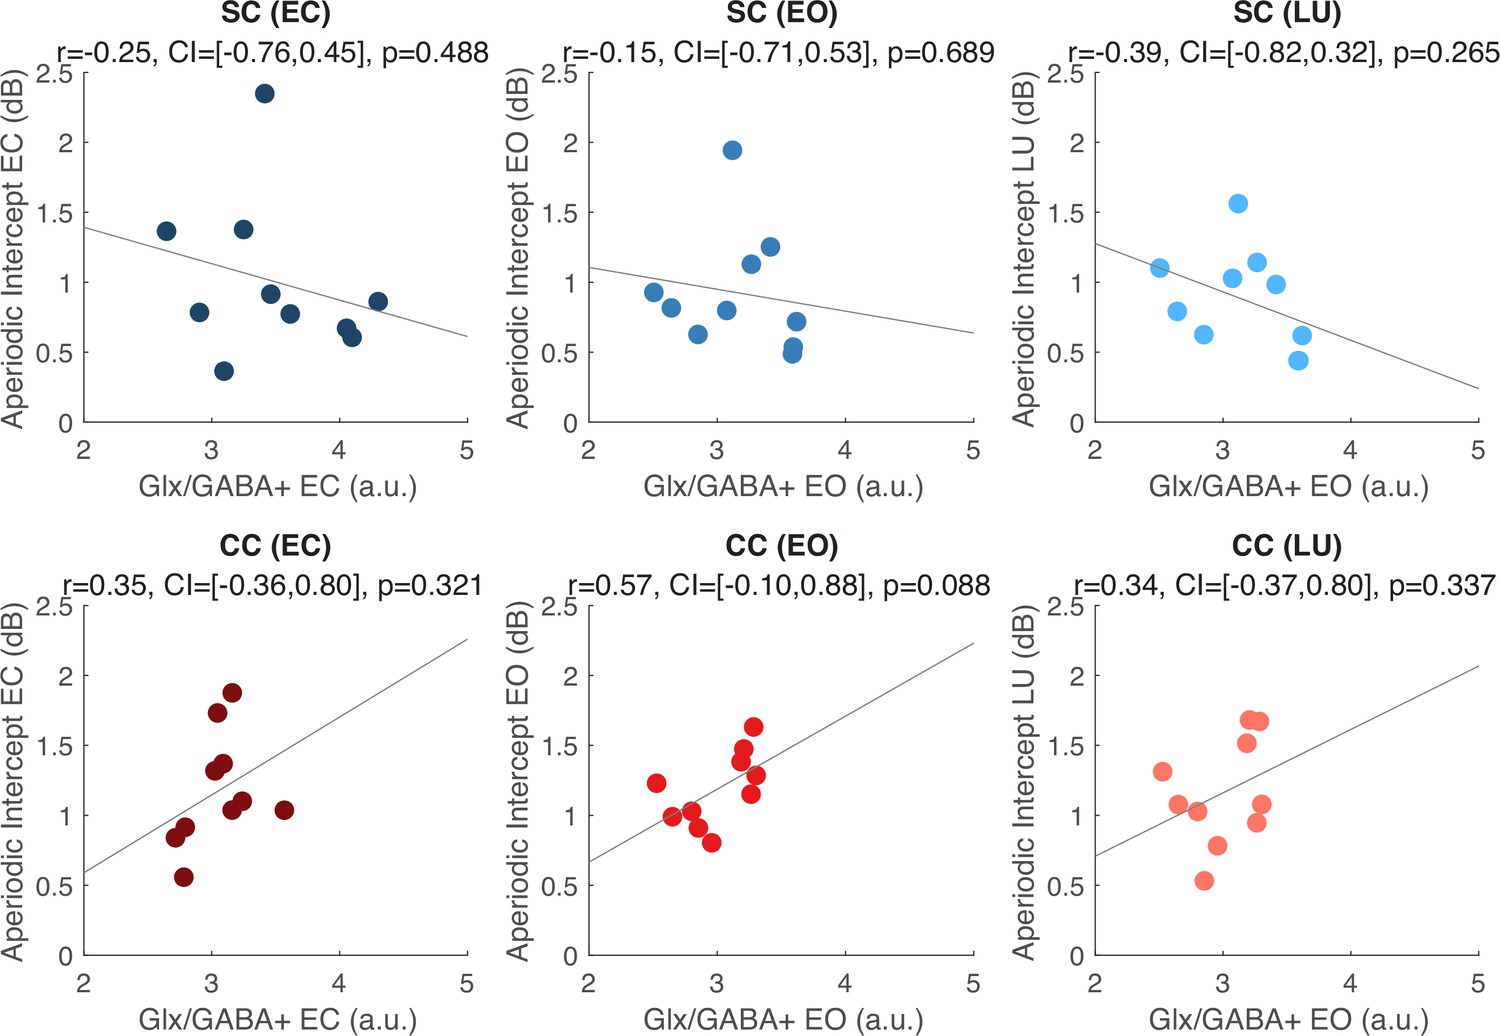
Correlation between aperiodic intercept and Glx/GABA+ concentration.
Correlations between the aperiodic intercept and visual cortex Glx/GABA+ concentration measured at rest with eyes closed (EC) (left panels) and eyes open (EO) (middle panels), and the correlation between aperiodic intercept measured while subjects viewed flickering stimuli (LU) and visual cortex Glx/GABA+ concentration measured in the EO condition (right panels), are depicted. Correlations were calculated separately for normally sighted control (SC, blue, top row) and congenital cataract-reversal (CC, red, bottom row) individuals. The 95% confidence intervals (CI) of the correlation coefficients (r) are reported.
Appendix 1—figure 20
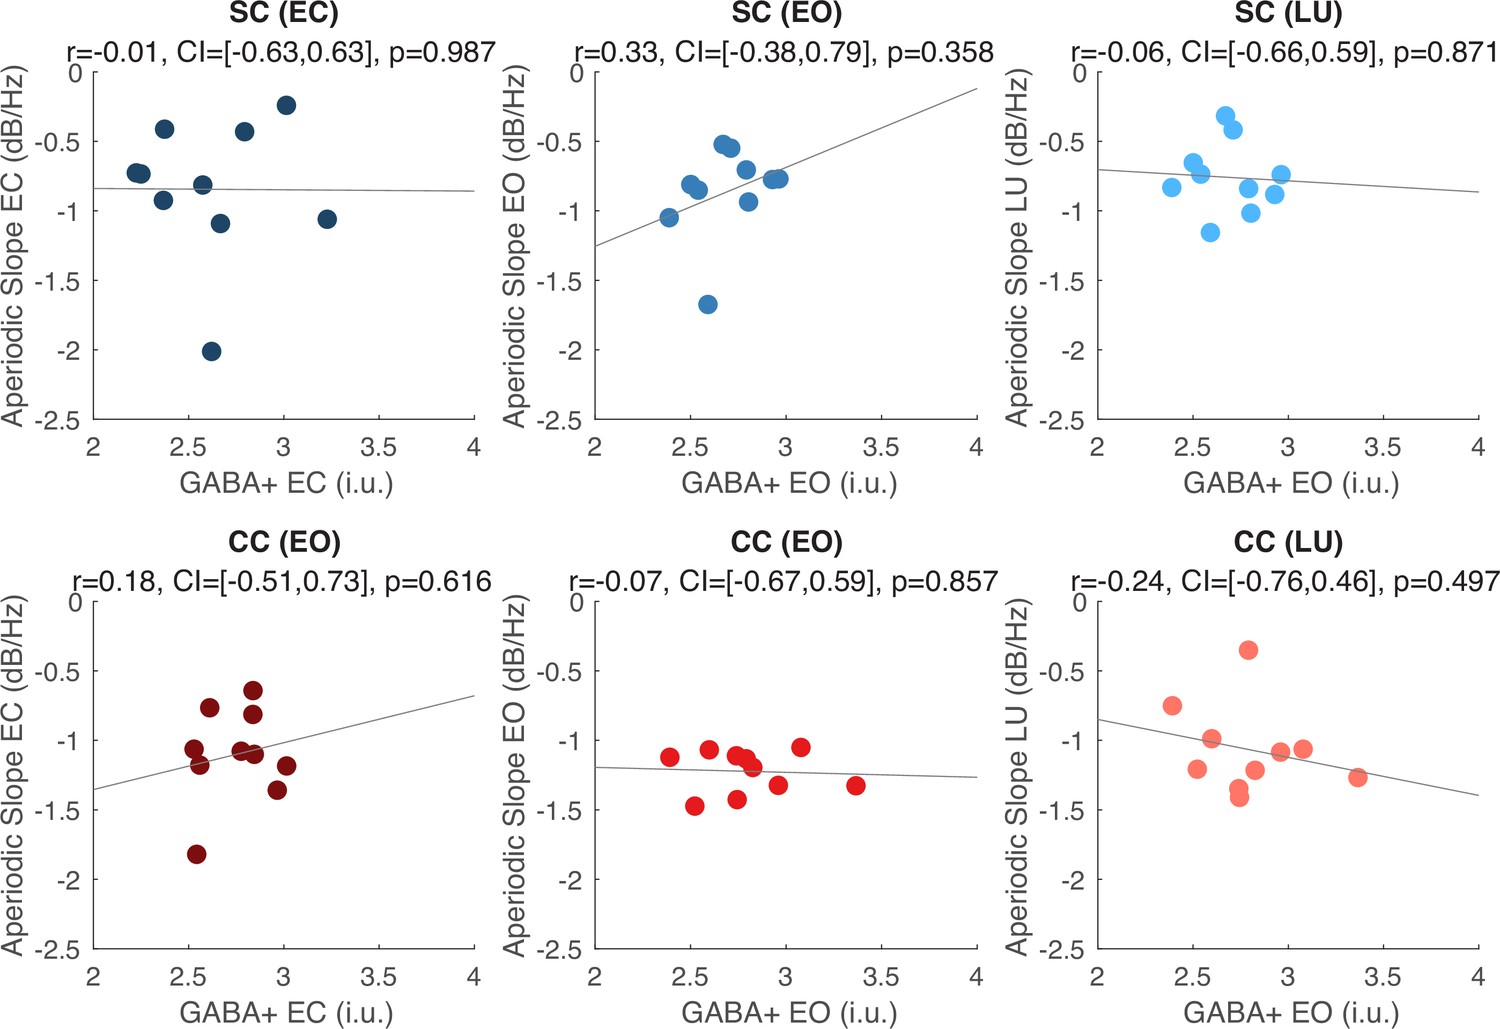
Correlation between aperiodic slope and GABA+ concentration.
Correlations between the aperiodic slope and visual cortex GABA+ concentration measured at rest with eyes closed (EC) (left panels) and eyes open (EO) (middle panels), and the correlation between aperiodic slope measured while subjects viewed flickering stimuli (LU) and visual cortex GABA+ concentration measured in the EO condition (right panels), are depicted. Correlations were calculated separately for normally sighted control (SC, blue, top row) and congenital cataract-reversal (CC, red, bottom row) individuals. The 95% confidence intervals (CI) of the correlation coefficients (r) are reported.
Appendix 1—figure 21
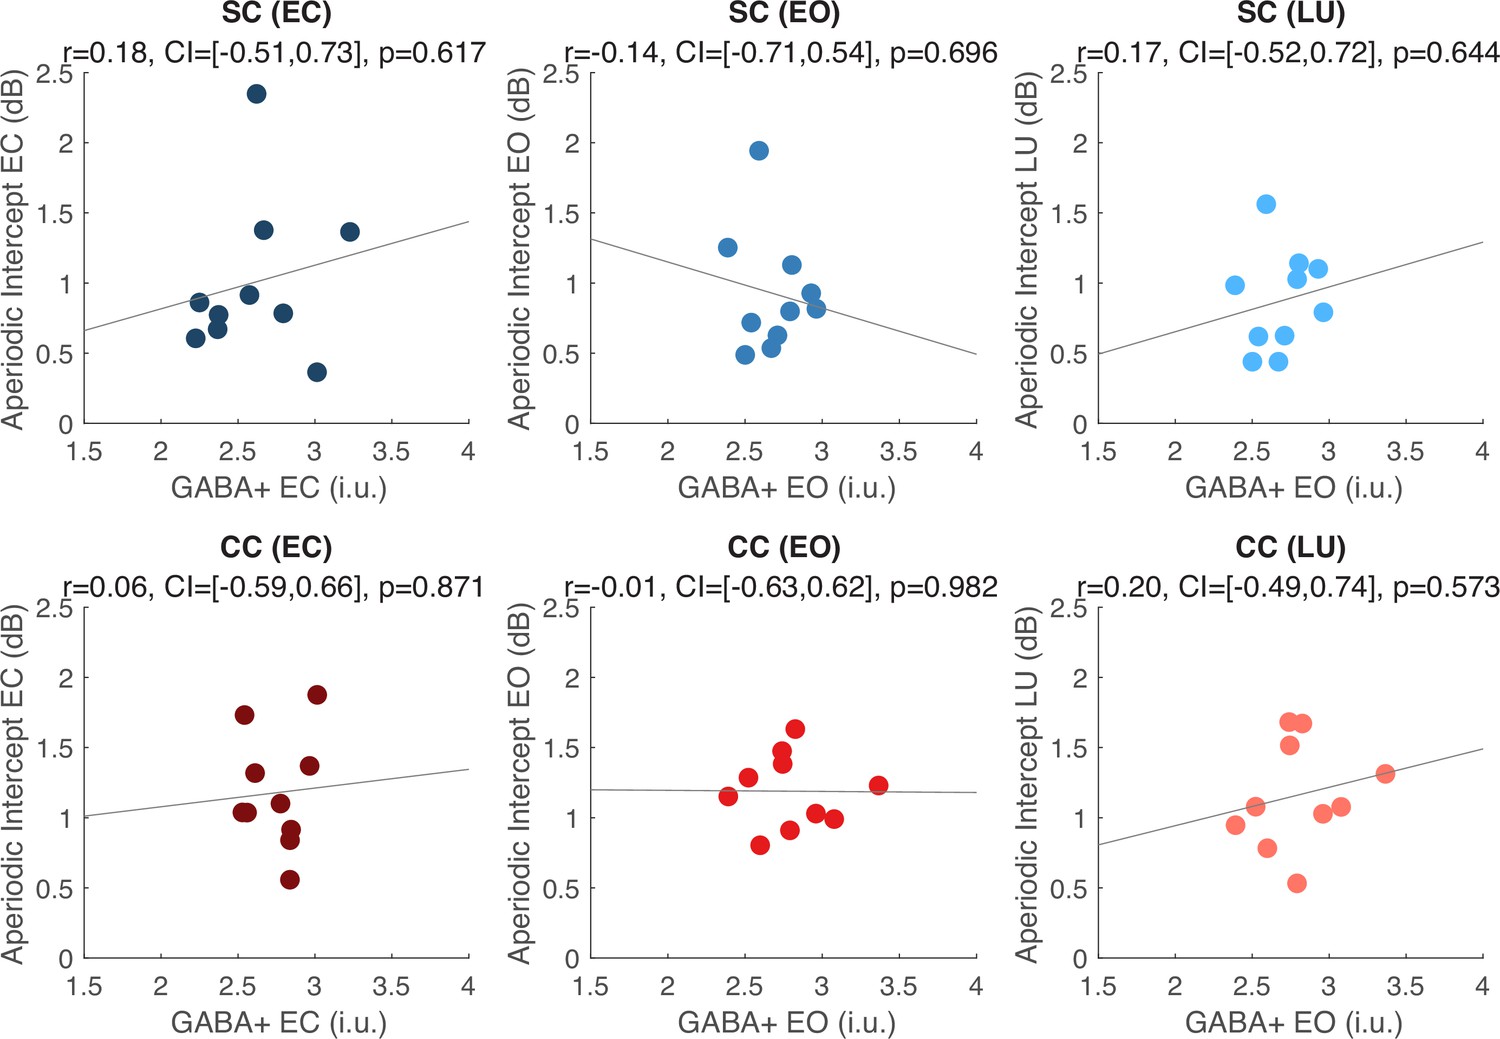
Correlation between aperiodic intercept and GABA+ concentration.
Correlations between the aperiodic intercept and visual cortex GABA+ concentration measured at rest with eyes closed (EC) (left panels) and eyes open (EO) (middle panels), and the correlation between aperiodic intercept measured while subjects viewed flickering stimuli (LU) and visual cortex GABA+ concentration measured in the EO condition (right panels), are depicted. Correlations were calculated separately for normally sighted control (SC, blue, top row) and congenital cataract-reversal (CC, red, bottom row) individuals. The 95% confidence intervals (CI) of the correlation coefficients (r) are reported.
Appendix 1—figure 22
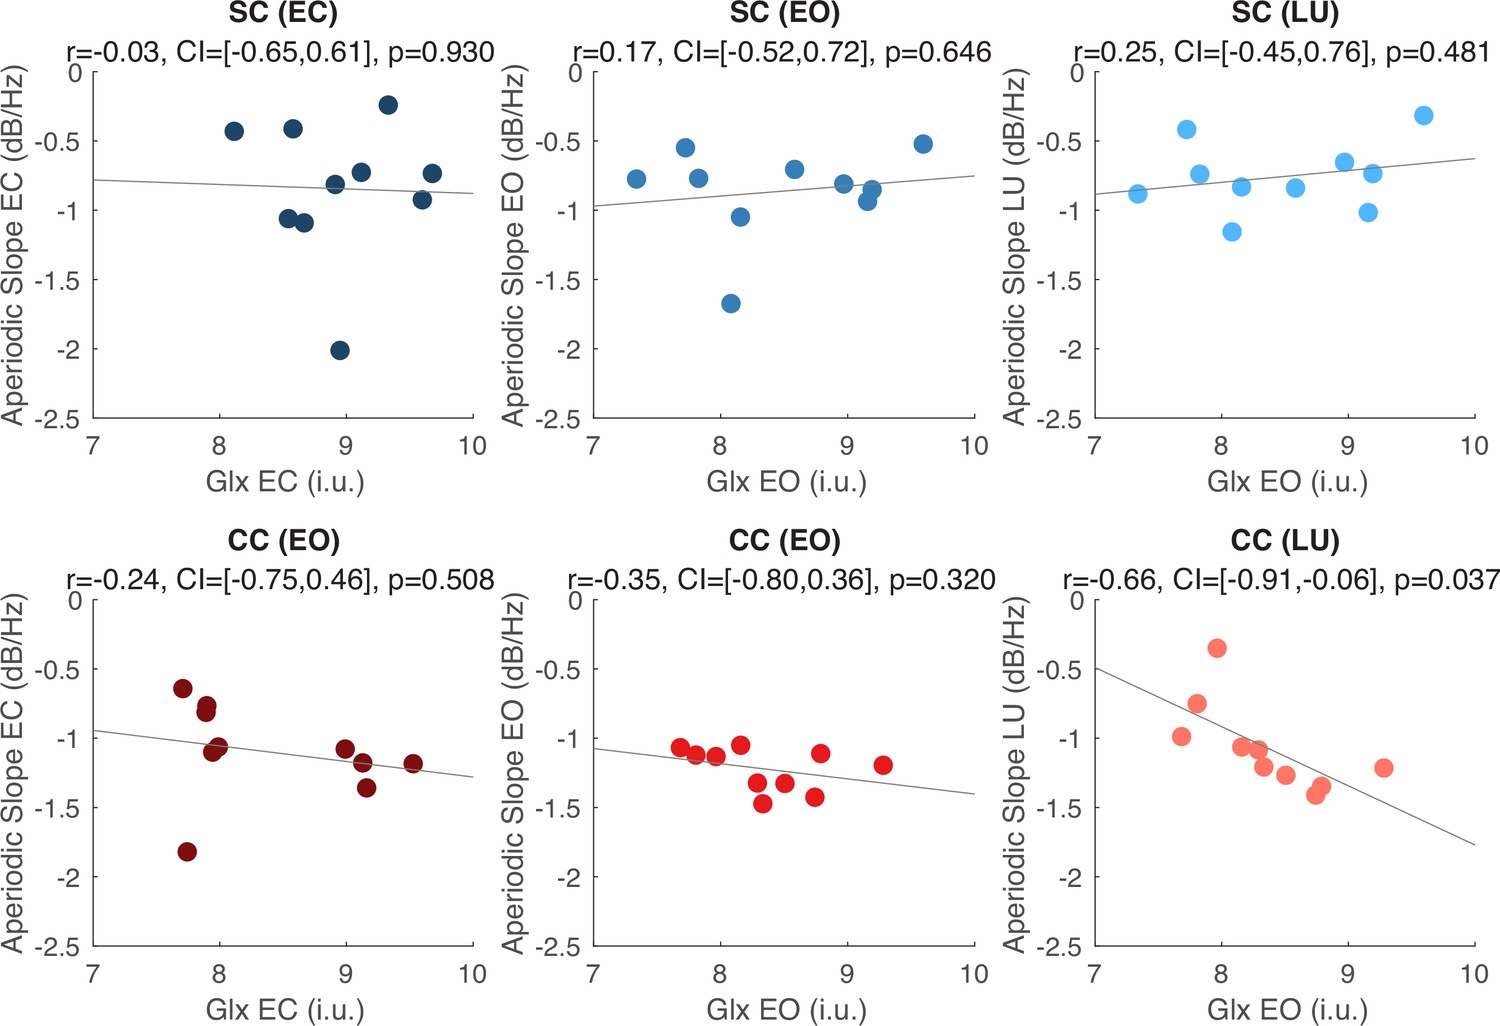
Correlation between aperiodic slope and Glx concentration.
Correlations between the aperiodic slope and visual cortex Glx concentration measured at rest with eyes closed (EC) (left panels) and eyes open (EO) (middle panels), and the correlation between aperiodic slope measured while subjects viewed flickering stimuli (LU) and visual cortex Glx concentration measured in the EO condition (right panels), are depicted. Correlations were calculated separately for normally sighted control (SC, blue, top row) and congenital cataract-reversal (CC, red, bottom row) individuals. The 95% confidence intervals (CI) of the correlation coefficients (r) are reported.
Appendix 1—figure 23
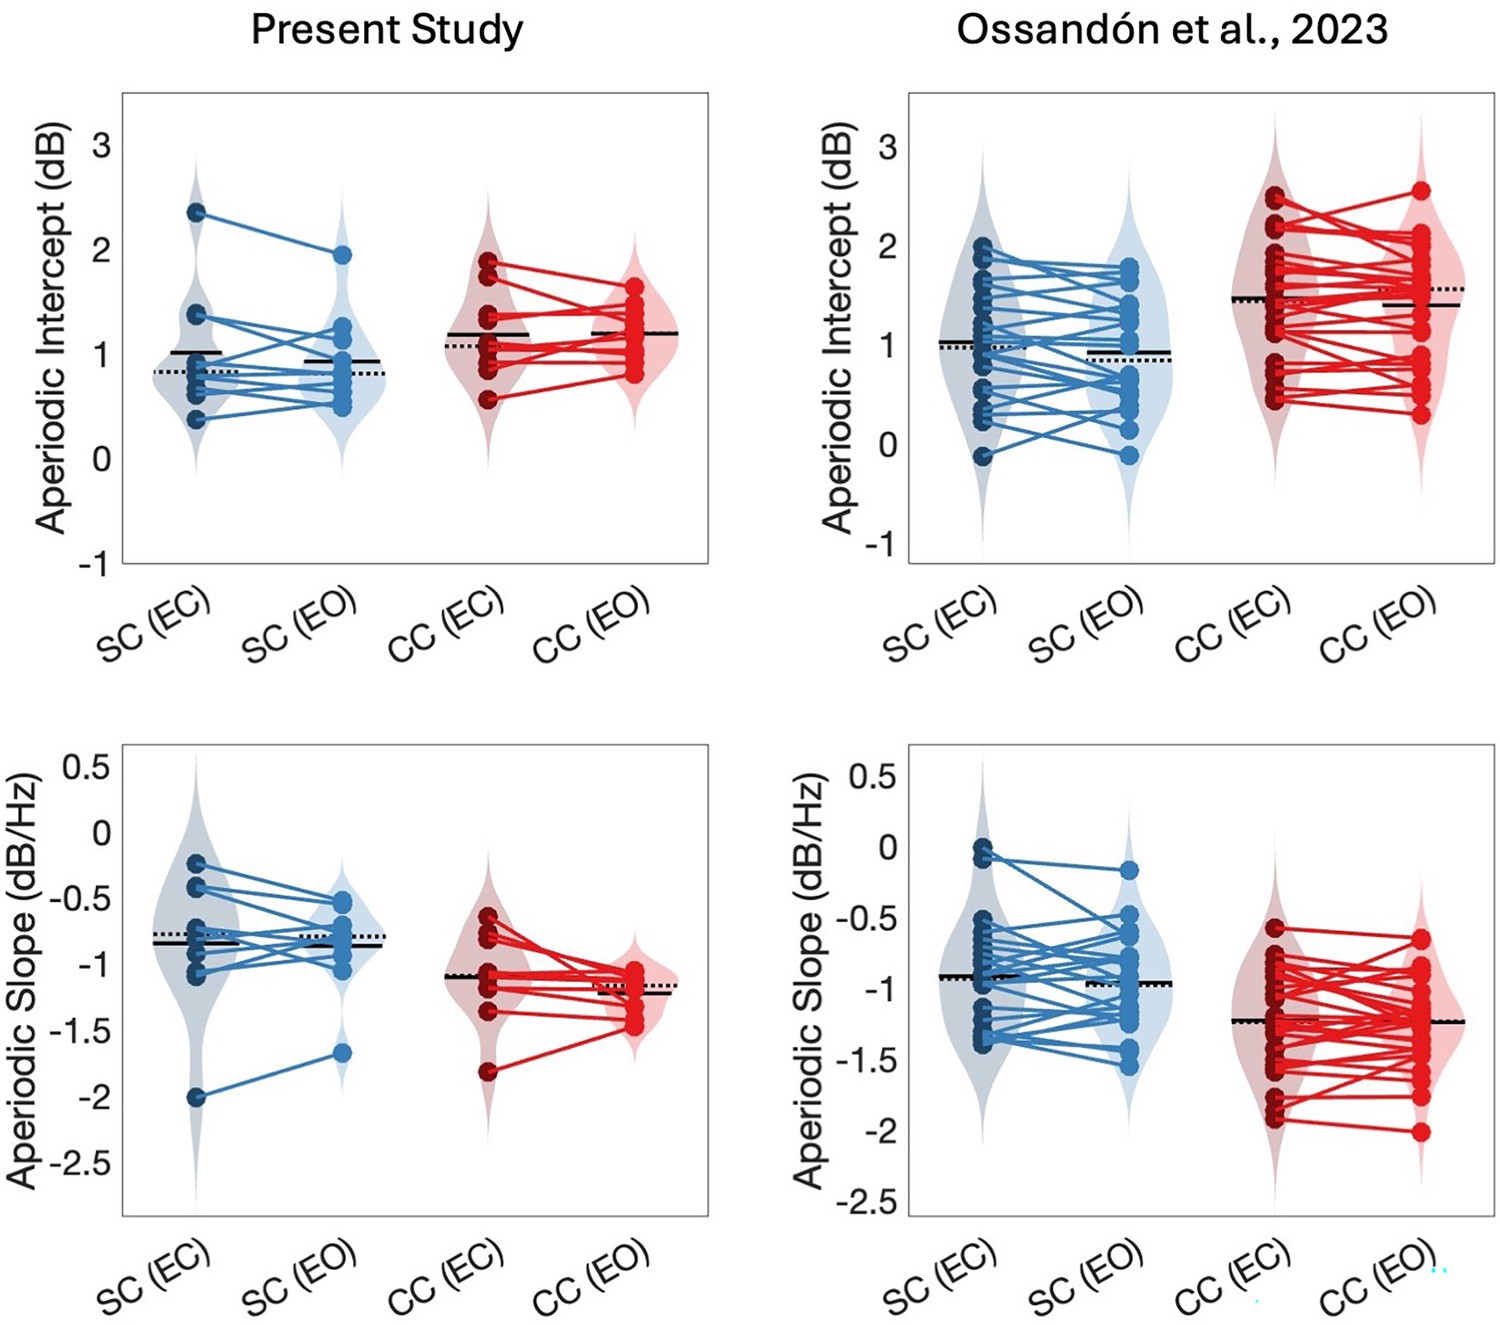
Aperiodic offset and slope in the 1–20 Hz range from occipital electrodes in congenital cataract reversal (CC) and normally sighted control (SC) individuals of the present study (left) and additional 28 subjects of Ossandón et al., 2023.
Aperiodic intercepts (top) and slope (bottom) distributions for each group and condition are displayed as violin plots. Solid black lines indicate mean values, dotted black lines indicate median values. Colored lines connect values of individual participants across conditions.
Appendix 1—figure 24

Aperiodic-corrected alpha amplitude in congenital cataract-reversal and normally sighted individuals.
Aperiodic-corrected alpha amplitudes (8–14 Hz) distributions for each group and condition are displayed as violin plots. Solid black lines indicate mean values, dotted black lines indicate median values. Colored lines connect values of individual participants across conditions.
Author response image 1
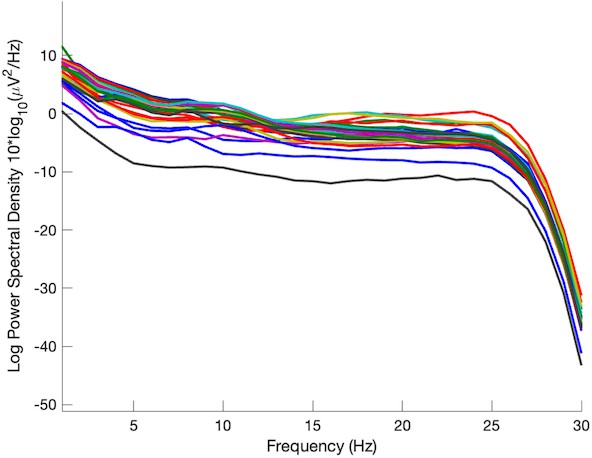
Power spectral density of one congenital cataract-reversal (CC) participant in the visual stimulation condition across all channels.
The reduced power at 30 Hz shows the effects of the anti-aliasing filter applied by EEGLAB’s pop_resample function.
Tables
Table 1
Clinical and demographic information of the participants with a history of dense bilateral congenital cataracts (CC) as well as demographic information and visual acuity of age-matched normally sighted control participants (SC).
NA indicates that patient’s data for the field were not available. FFL: Fixating and Following Light; CF: Counting Fingers; PL: Perceiving Light. Duration of visual deprivation was calculated by subtracting the date of birth from the date of surgery on the first eye (and thus corresponds to the age at surgery). Time since surgery was calculated by subtracting the date of surgery on the first eye from the date of testing. Visual acuity on the date of testing was measured binocularly with the Freiburg Vision Test (FrACT).
| Gender | Age | Visual acuity on date tested (logMAR) | Comorbidities | Visual acuity pre surgery | Duration of visual deprivation (Years) | Time since surgery (Years) | Family history | ||||
|---|---|---|---|---|---|---|---|---|---|---|---|
| Absorbed lenses | Strabismus | Nystagmus | OD | OS | |||||||
| CC1 | Male | 17.0 | 0.17 | No | Yes | Yes | FFL - | FFL + | 0.2 | 16.8 | No |
| CC2 | Male | 43.5 | 0.9 | Yes | Yes | Yes | 1.18 | 1 | 20.8 | 22.7 | Yes |
| CC3 | Male | 18.7 | 0.9 | Yes | Yes | Yes | 1.48 | 1.77 | 15.6 | 3.1 | No |
| CC4 | Male | 15.2 | 0.62 | Yes | NA | Yes | CF at 1.5 m | CF at 3 m | 7.0 | 8.2 | No |
| CC5 | Male | 32.4 | 0.88 | No | Yes | Yes | NA | NA | 14.0 | 18.4 | Yes |
| CC6 | Male | 23.9 | 0.78 | No | Yes | Yes | NA | NA | 6.0 | 17.9 | Yes |
| CC7 | Male | 13.1 | 0.54 | No | Yes | Yes | PL+ | PL+ | 0.8 | 12.4 | No |
| CC8 | Male | 18.3 | 0.66 | Yes | No | Yes | 1.2 | 1.3 | 16.4 | 1.9 | Yes |
| CC9 | Male | 36.9 | 1.34 | No | NA | Yes | NA | NA | 6.0 | 30.9 | Yes |
| CC10 | Female | 38.8 | 1.04 | Yes | Yes | Yes | 1.48 | 1.48 | 31.4 | 7.4 | Yes |
| SC1 | Male | 17.7 | 0.2 | ||||||||
| SC2 | Male | 41.9 | –0.27 | ||||||||
| SC3 | Male | 19.5 | –0.25 | ||||||||
| SC4 | Male | 16.0 | –0.11 | ||||||||
| SC5 | Male | 33.3 | –0.12 | ||||||||
| SC6 | Male | 24.0 | –0.16 | ||||||||
| SC7 | Male | 12.2 | –0.25 | ||||||||
| SC8 | Female | 25.1 | –0.28 | ||||||||
| SC9 | Female | 36.0 | –0.21 | ||||||||
| SC10 | Male | 37.3 | –0.22 | ||||||||
Table 2
Quality metrics for Magnetic Resonance Spectroscopy data.
Mean quality metrics in each group are reported with the standard deviation in parentheses. The displayed quality metrics for signal-to-noise ratio, full-width half maxima and fit error are those output by Gannet 3.0: signal-to-noise-ratio (SNR), was calculated in GannetFit.m by estimating the noise in the GABA+/Glx/NAA signal across acquisitions and by dividing the absolute peak height of the GABA+/Glx/NAA signal by the estimated noise; full-width-half-maxima (FWHM), is defined as the width of the peak in Hertz (Hz); and fit error, is defined as the standard deviation of the residual of the GABA+/Glx/NAA peak fit. The fit error is expressed as a percentage of the GABA+/Glx peak height. The Cramer-Rao lower bound is reported as output by TARQUIN 4.3.11 for the NAA signal (not calculated for GABA+ or Glx as these metabolites were quantified using Gannet 3.0).
| Signal-to-noise ratio | CC | SC | |
|---|---|---|---|
| Visual cortex | NAA | 293.16 (47.50) | 289.01 (50.91) |
| GABA+ | 21.53 (3.66) | 19.08 (3.99) | |
| Glx | 23.75 (3.75) | 22.18 (5.26) | |
| Frontal cortex | NAA | 108.37 (21.84) | 97.20 (28.08) |
| GABA+ | 10.311 (2.20) | 8.30 (1.93) | |
| Glx | 15.82 (4.85) | 13.58 (3.86) | |
| Full-width-half maxima | CC | SC | |
| Visual cortex | NAA | 9.04 (0.94) | 8.69 (0.75) |
| GABA+ | 19.84 (1.13) | 19.10 (0.71) | |
| Glx | 16.62 (1.63) | 16.46 (1.63) | |
| Frontal cortex | NAA | 19.26 (2.33) | 21.42 (3.79) |
| GABA+ | 21.69 (3.15) | 23.23 (3.41) | |
| Glx | 27.54 (8.70) | 30.63 (12.64) | |
| Fit error | CC | SC | |
| Visual cortex | NAA | 0.81 (0.20) | 0.77 (0.15) |
| GABA+ | 3.42 (0.63) | 3.68 (0.63) | |
| Glx | 3.10 (0.58) | 3.18 (0.47) | |
| Frontal cortex | NAA | 1.33 (0.41) | 1.70 (0.57) |
| GABA+ | 6.57 (2.20) | 8.31 (3.65) | |
| Glx | 4.44 (1.54) | 5.15 (1.90) | |
| Cramer-Rao lower bound | CC | SC | |
| Visual cortex | NAA | 0.13 (0.02) | 0.14 (0.03) |
| Frontal cortex | NAA | 0.33 (0.22) | 0.26 (0.24) |
Appendix 1—table 1
ANOVA results for quality metrics on Magnetic Resonance Spectroscopy data.
Quality metrics were compared for each signal (GABA+, Glx and NAA) in a group (congenital cataract-reversal, normally sighted control)-by-region (visual cortex, frontal cortex) ANOVA.
| Main effect of group | Main effect of region | Group-by-region interaction | ||||||||
|---|---|---|---|---|---|---|---|---|---|---|
| F(1,39) | ηp² | p | F(1,39) | ηp² | p | F(1,39) | ηp² | p | ||
| Signal-to-noise ratio | NAA | 0.38 | 0.011 | 0.539 | 232.00 | 0.865 | <0.001 | 0.08 | 0.002 | 0.778 |
| GABA+ | 3.37 | 0.084 | 0.080 | 127.12 | 0.779 | <0.001 | 0.01 | <0.001 | 0.936 | |
| Glx | 0.39 | 0.011 | 0.534 | 26.75 | 0.426 | <0.001 | <0.001 | <0.001 | 0.989 | |
| Full-width half maxima | NAA | 1.53 | 0.041 | 0.224 | 247.71 | 0.873 | <0.001 | 2.94 | 0.076 | 0.095 |
| GABA+ | 0.09 | 0.002 | 0.765 | 21.71 | 0.376 | <0.001 | 0.56 | 0.015 | 0.457 | |
| Glx | 0.20 | 0.005 | 0.660 | 31.56 | 0.467 | <0.001 | 0.11 | 0.003 | 0.743 | |
| Fit error | NAA | 1.97 | 0.052 | 0.168 | 38.36 | 0.515 | <0.001 | 3.00 | 0.077 | 0.092 |
| GABA+ | 2.78 | 0.070 | 0.104 | 69.14 | 0.657 | <0.001 | 1.65 | 0.043 | 0.206 | |
| Glx | 0.26 | 0.007 | 0.610 | 12.91 | 0.264 | <0.001 | 0.22 | 0.006 | 0.643 | |
| Cramer-Rao lower bound | NAA | 0.05 | 0.001 | 0.821 | 9.34 | 0.206 | 0.004 | 0.09 | 0.002 | 0.760 |
Appendix 1—table 2
Results from the Shapiro-Wilk test for normality within each group and Levene’s test for homogeneity of variance across groups, for all dependent variables in the reported analyses.
The assumption of normality or homogeneity of variance was rejected if p was smaller than 0.05.
| Dependent variable | Shapiro-Wilk test for normality | Levene’s Test for homogeneity of variance | ||||
|---|---|---|---|---|---|---|
| CC (W value) | CC (p-value) | SC (W value) | SC (p-value) | F(1,18) | p-value | |
| Aperiodic intercept (EO) | 0.86 | 0.076 | 0.98 | 0.975 | 0.48 | 0.499 |
| Aperiodic slope (EO) | 0.94 | 0.574 | 0.92 | 0.363 | 0.71 | 0.411 |
| Aperiodic intercept (EC) | 0.84 | 0.050 | 0.96 | 0.761 | 0.15 | 0.700 |
| Aperiodic slope (EC) | 0.88 | 0.141 | 0.93 | 0.431 | 0.64 | 0.434 |
| Aperiodic intercept (LU) | 0.94 | 0.526 | 0.95 | 0.650 | 0.00 | 0.993 |
| Aperiodic slope (LU) | 0.96 | 0.810 | 0.88 | 0.121 | 0.15 | 0.700 |
| GABA+ (EC) | 0.94 | 0.515 | 0.90 | 0.204 | 2.27 | 0.149 |
| GABA+ (EO) | 0.97 | 0.913 | 0.97 | 0.864 | 0.60 | 0.450 |
| Glx (EC) | 0.97 | 0.881 | 0.87 | 0.102 | 0.69 | 0.416 |
| Glx (EO) | 0.95 | 0.720 | 0.97 | 0.906 | 3.38 | 0.083 |
| GABA+/Glx (EC) | 0.96 | 0.834 | 0.94 | 0.501 | 2.07 | 0.172 |
| GABA+/Glx (EO) | 0.92 | 0.347 | 0.89 | 0.173 | 1.51 | 0.235 |
Appendix 1—table 3
Mean percentage of rejected epochs in each condition for the congenital cataract reversal (CC) and normally sighted control (SC) groups.
| Group | Eyes open | Eyes closed | Visual stimulation |
|---|---|---|---|
| CC | 13% | 3.1% | 0.2% |
| SC | 18.37% | 2% | 0.1% |
Appendix 1—table 4
Goodness of fit (R2) values for the EEG aperiodic spectrum.
Average R2 values are reported for each group and condition.
| Eyes closed (EC) | Eyes open (EO) | Visual stimulation (LU) | |
|---|---|---|---|
| Sighted control (SC) | 0.96 | 0.96 | 0.91 |
| Congenital cataract reversal (CC) | 0.95 | 0.98 | 0.99 |
Appendix 1—table 5
Regression summary for the effects of Glutamate/Glutamine (Glx) and age on aperiodic intercept (Visual Stimulation) in the congenital cataract reversal (CC) group in the visual stimulation (LU) condition.
| Predictor | Estimate | SE | t | p |
|---|---|---|---|---|
| Model intercept | –5.75 | 1.71 | –3.36 | 0.012 |
| Age | 0.007 | 0.008 | 0.82 | 0.439 |
| Glx | 0.81 | 0.19 | 4.36 | 0.003 |
Appendix 1—table 6
Regression summary for the effects of Glutamate/glutamine (Glx) concentration and age on aperiodic intercept during eye opening at rest (EO) in the congenital cataract reversal (CC) group.
| Predictor | Estimate | SE | t | p |
|---|---|---|---|---|
| Model intercept | –2.07 | 1.11 | –1.86 | 0.106 |
| Age | –0.005 | 0.005 | –0.90 | 0.400 |
| Glx | 0.40 | 0.12 | 3.35 | 0.012 |
Additional files
-
Supplementary file 1
MRS Minimum Reporting Standards Form as published by Lin et al., 2021.
- https://cdn.elifesciences.org/articles/98143/elife-98143-supp1-v1.xlsx
-
MDAR checklist
- https://cdn.elifesciences.org/articles/98143/elife-98143-mdarchecklist1-v1.docx
Download links
A two-part list of links to download the article, or parts of the article, in various formats.
Downloads (link to download the article as PDF)
Open citations (links to open the citations from this article in various online reference manager services)
Cite this article (links to download the citations from this article in formats compatible with various reference manager tools)
Altered visual cortex excitatory/inhibitory ratio following transient congenital visual deprivation in humans
eLife 13:RP98143.
https://doi.org/10.7554/eLife.98143.4


