Molecular determinants of Neu5Ac binding to a tripartite ATP independent periplasmic (TRAP) transporter
- Biochemical Sciences Division, CSIR-National Chemical Laboratory, India
- Academy of Scientific and Innovative Research (AcSIR), India
- Institute for Stem Cell Science and Regenerative Medicine, India
- Biological Sciences, Purdue University, United States
- Department DiBEST (Biologia, Ecologia, Scienze della Terra) Unit of Biochemistry and Molecular Biotechnology, University of Calabria, Italy
- Centre for Antibiotic Resistance Research (CARe) at University of Gothenburg, Sweden
- CNR, Institute of Biomembranes, Bioenergetics and Molecular Biotechnologies (IBIOM), via Amendola, Italy
- Biomolecular Interaction Centre, Maurice Wilkins Centre for Biodiscovery, MacDiarmid Institute for Advanced Materials and Nanotechnology, and School of Biological Sciences, University of Canterbury, New Zealand
- Department of Biochemistry and Pharmacology, Bio21 Molecular Science and Biotechnology Institute, University of Melbourne, Parkville, Australia
- National Centre for Biological Sciences TIFR, GKVK Campus, Bellary Road, India
Figures
Figure 1 with 5 supplements
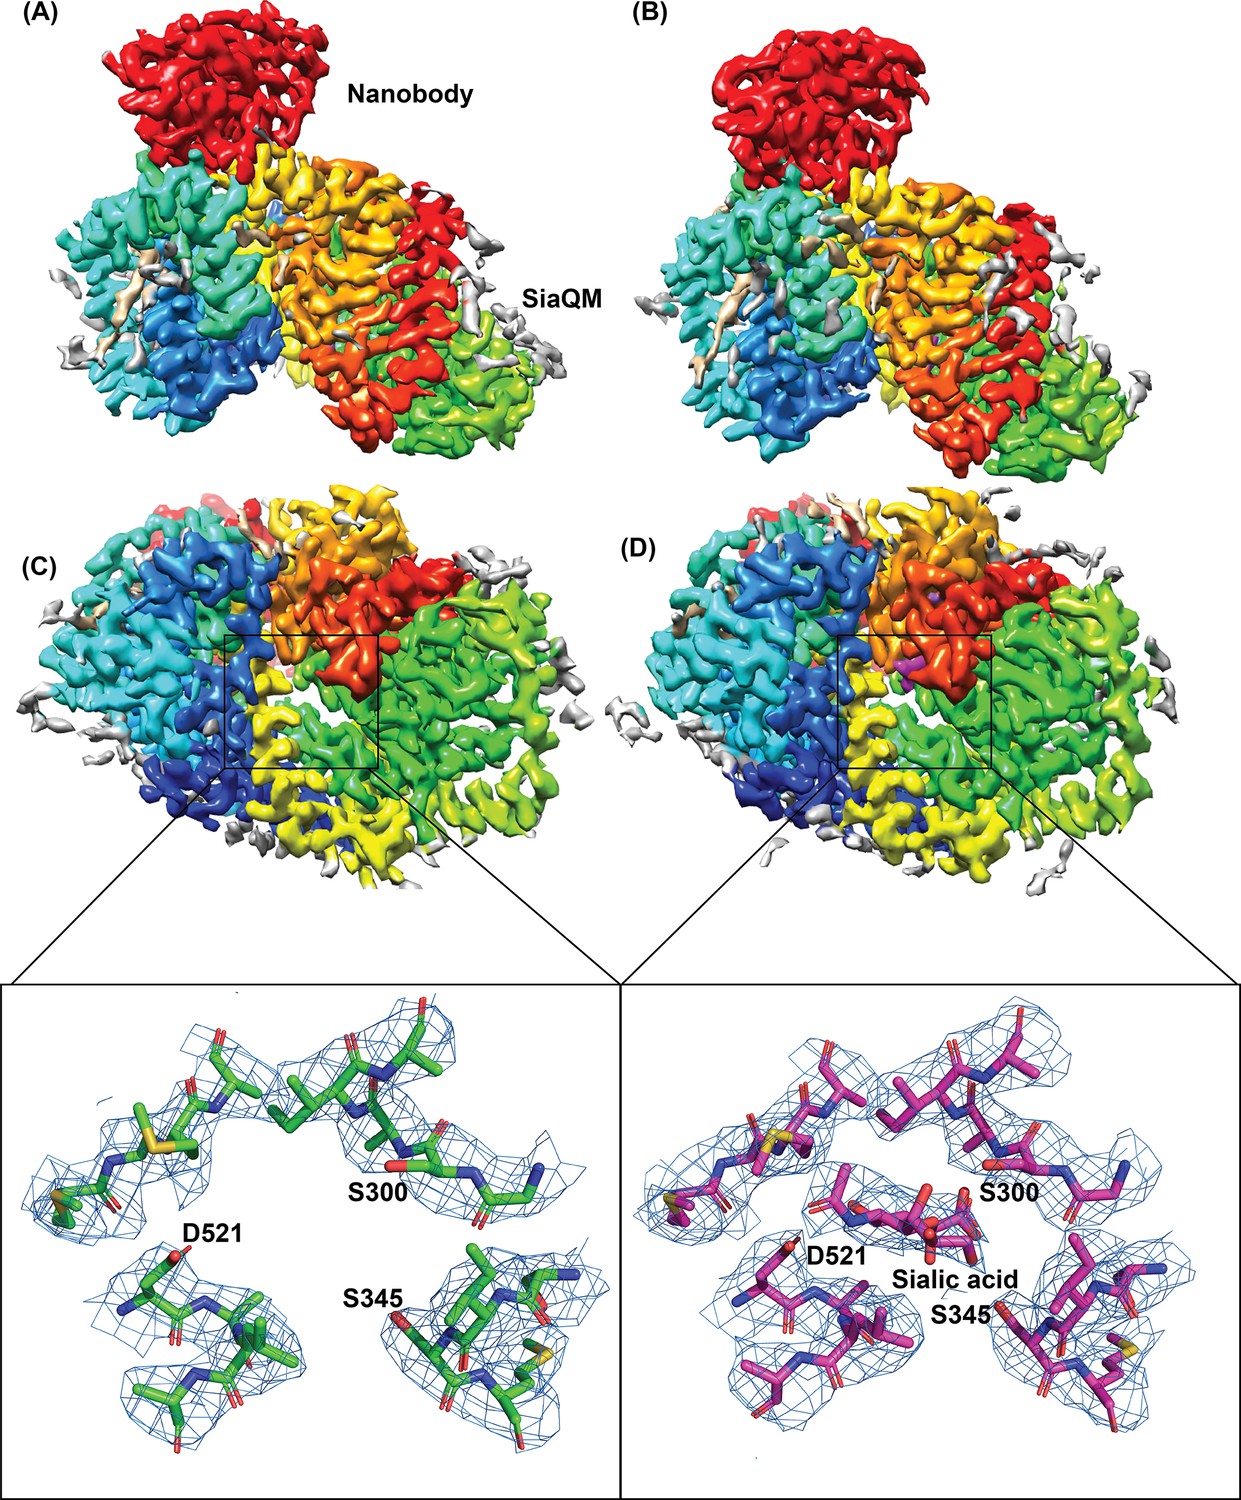
Architecture of Fusobacterium nucleatum (FnSiaQM) with nanobody.
(A and B) Cryo-EM maps of FnSiaQM unliganded and N-Acetylneuraminic acid (Neu5Ac) bound at 3.2 and 3.17 Å, respectively. The TM domain of FnSiaQM is colored using the rainbow model (N-terminus in blue and C-terminus in red). The nanobody density is colored in red. The density for modeled lipids is colored in tan and the unmodeled density in gray. The figures were made with Chimera at thresholds of 1.2 and 1.3 for the unliganded and Neu5Ac-bound maps. (C and D) The cytoplasmic view of apo and Neu5Ac bound FnSiaQM, respectively. Color coding is the same as in panels A and B. The density corresponding to Neu5Ac and sodium ions are in purple. The substrate binding sites of apo and Neu5Ac bound FnSiaQM are shown with key residues labeled. The density (blue mesh) around these atoms was made in Pymol with 2 and 1.5 σ for the apo and the Neu5Ac structures, respectively, with a carve radius of 2 Å.
Figure 1—figure supplement 1

Size exclusion chromatography of Tripartite ATP-independent periplasmic (TRAP) transporter from Fusobacterium nucleatum (FnSiaQM).
The protein purified in the detergent micelles produced homogenous single peak in size exclusion chromatography eluting as monomer. The purified protein migrated around 50 kDa (inset, FnTRAP purified) on a denaturing PAGE, differing from its calculated molecular weight of ~73.8 kDa, which is common for membrane proteins.
-
Figure 1—figure supplement 1—source data 1
Raw, uncropped image for gel shown in Figure 1—figure supplement 1.
- https://cdn.elifesciences.org/articles/98158/elife-98158-fig1-figsupp1-data1-v1.tif
-
Figure 1—figure supplement 1—source data 2
Uncropped, labelled image for gel shown in Figure 1—figure supplement 1.
- https://cdn.elifesciences.org/articles/98158/elife-98158-fig1-figsupp1-data2-v1.pdf
Figure 1—figure supplement 2
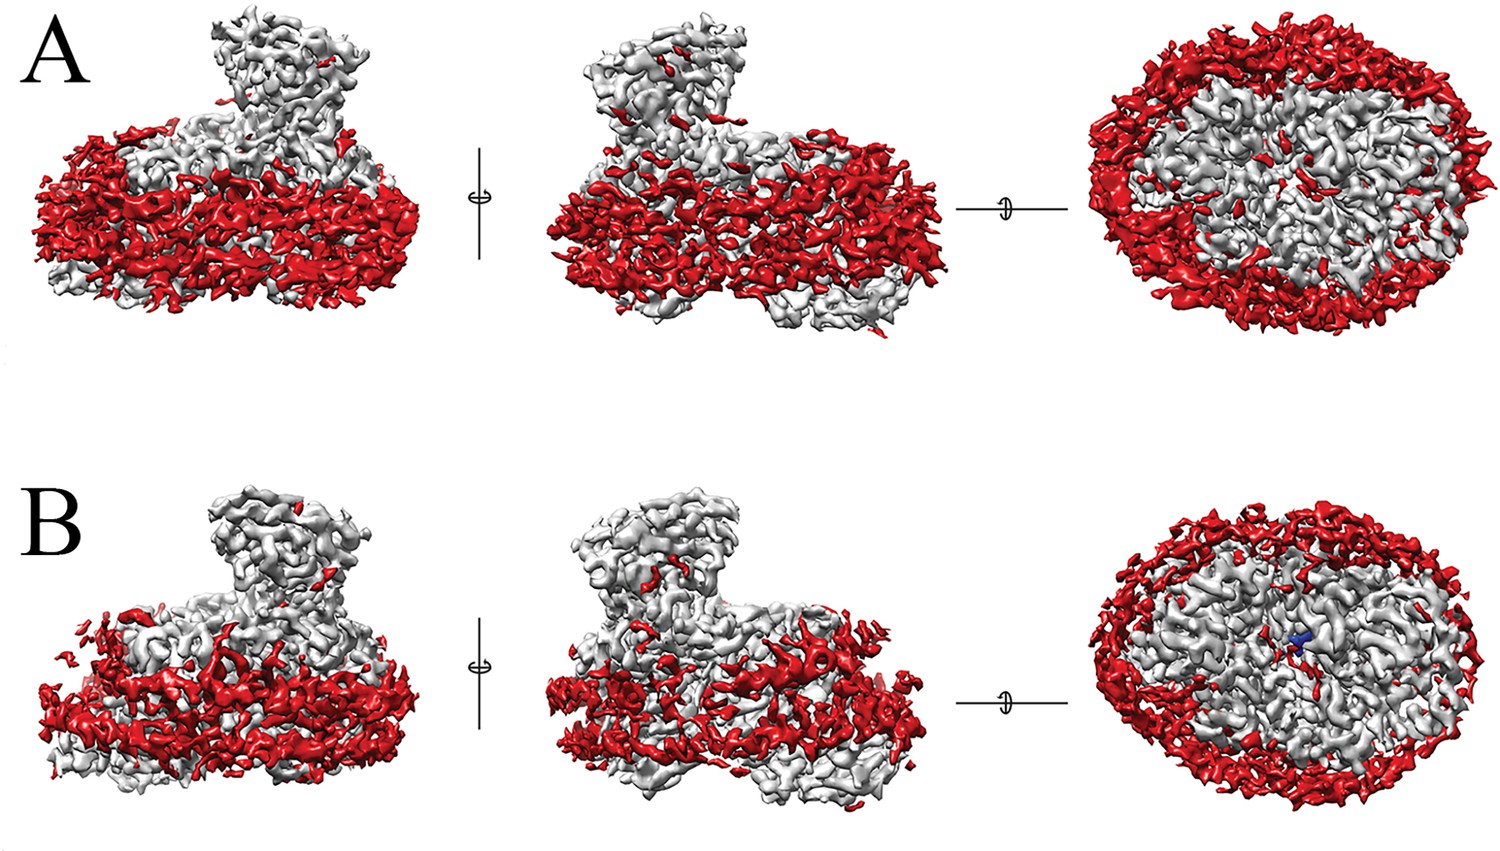
The gray surface represents the areas of the density that have been modeled in the unliganded (A) and the liganded (B) forms.
In red are the unmodeled densities. The nano-disc surrounding the membrane region is visible as well as the number of densities that possibly are lipids bound to the protein. The three figures for each structure represent the different orientations, with the orientation on the right is looking down from the cytosolic side of the protein. The blue density in panel B is the bound sialic acid in the liganded structure.
Figure 1—figure supplement 3
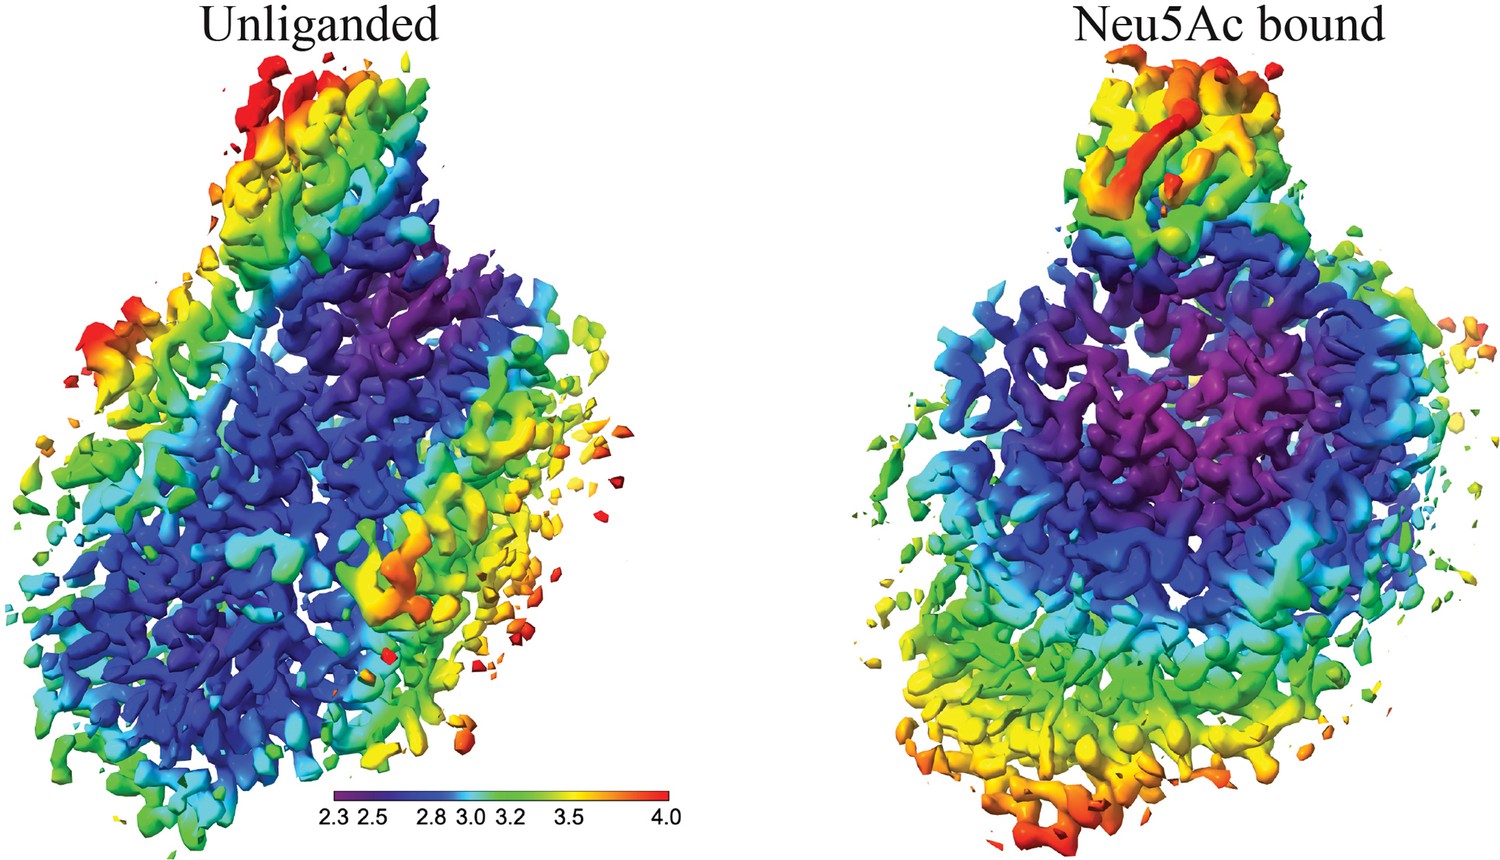
The local resolution maps of the unliganded and the liganded Fusobacterium nucleatum (FnSiaQM) respectively.
Much of the interior of the protein including the ligand binding site are well ordered and are the best resolved regions.
Figure 1—figure supplement 4
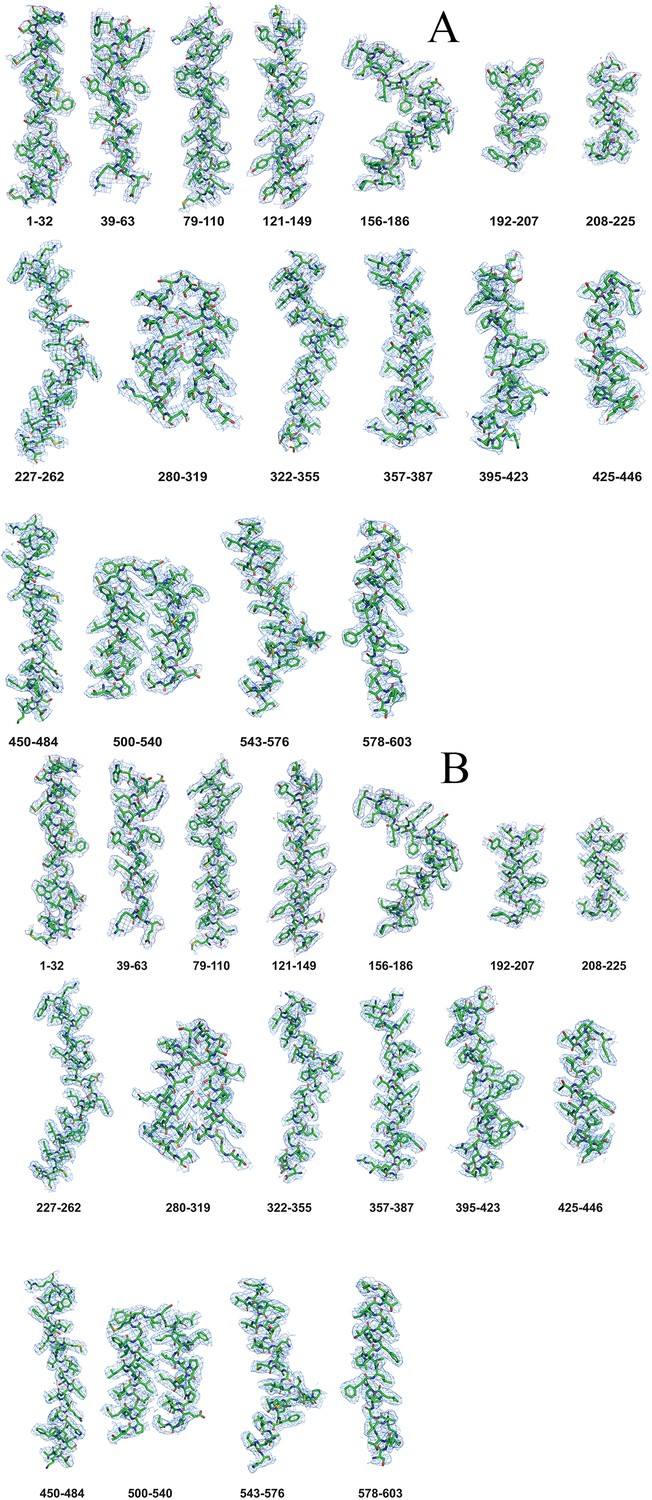
Density maps of the unliganded (A) and liganded (B) FnTRAP helices.
Figure 1—figure supplement 5
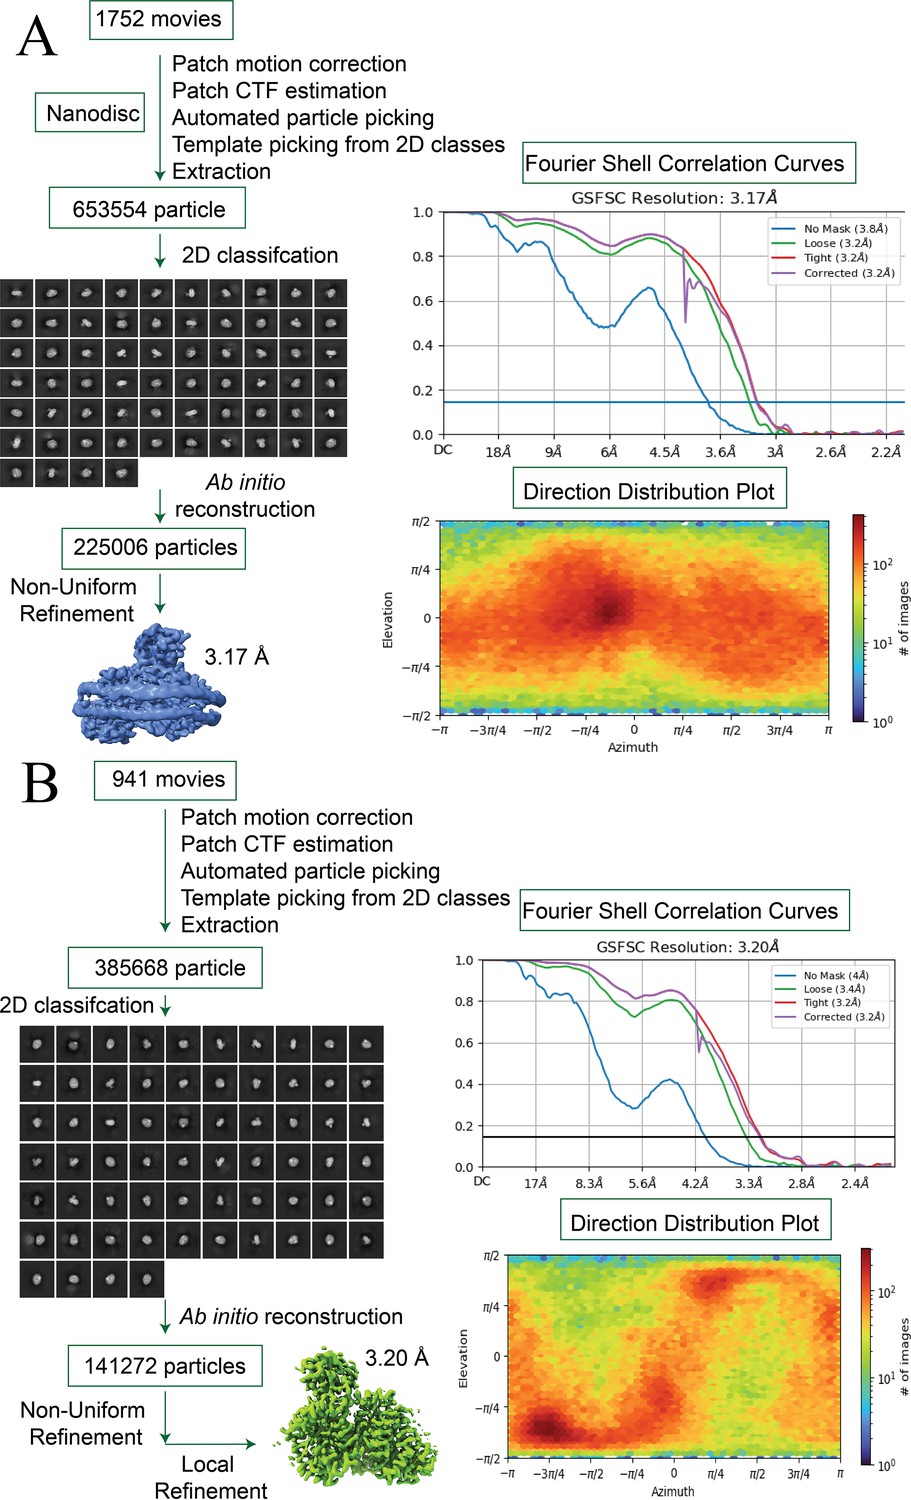
Cryo-EM workflow and analysis of the Fusobacterium nucleatum (FnSiaQM) protein.
(A and B) A detailed workflow outlining the steps involved in cryo-EM image acquisition and processing, leading to the generation of both the bound and unliganded structures of the FnSiaQM protein, respectively. The selected 2D class average utilized for ab initio reconstructions is depicted, and the optimal 3D reconstructions serve as reference models for subsequent non-uniform refinement. Masks generated using RELION 3.0 were applied, and the resulting maps underwent iterative rounds of Non-Uniform refinement, local refinement, 2D classification, selection of 2D classes, and particles representing the selected 2D classes were used for refinement. Final particles were corrected for global and local CTF and reference-based motion correction before final maps were obtained. Fourier shell correlation (FSC) curves for the final 3D reconstructions of the bound and unliganded structures of the FnSiaQM protein are presented.
Figure 2 with 4 supplements
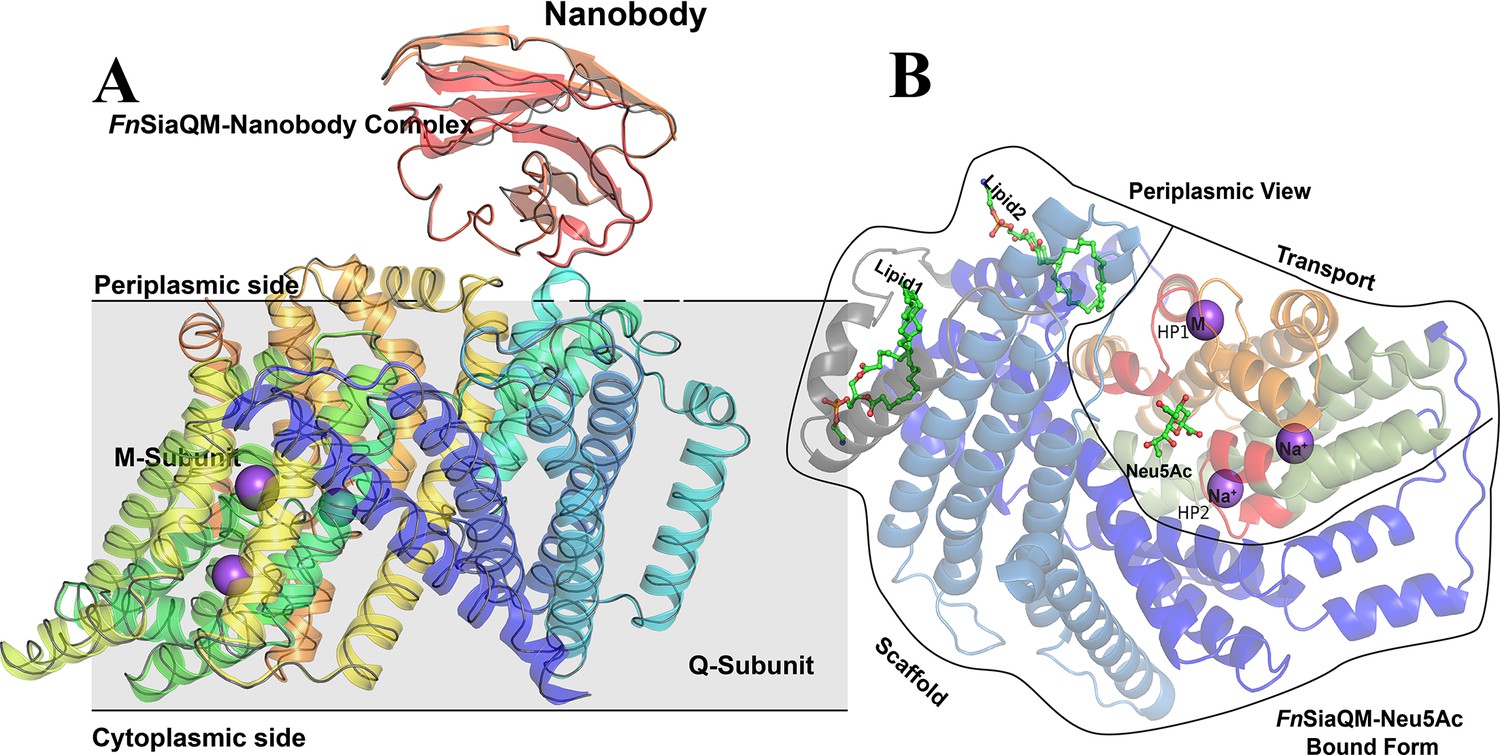
Fusobacterium nucleatum (FnSiaQM)-Nanobody complex with N-Acetylneuraminic acid (Neu5Ac) bound form.
(A) A cartoon representation of the FnSiaQM-Nanobody complex structure. The SiaQM polypeptide has been colored in rainbow with the N-terminus starting in blue and the C-terminus ends in orange. The nanobody is shown in cartoon representation and in red color. Two of the modeled sodium sites are shown as purple spheres. A ribbon representation of the unliganded structure of FnSiaQM is superposed in gray. The superposition reveals that the overall structures are similar. (B) Cartoon representation of the FnSiaQM structure bound to Neu5Ac. In shades of blue are the helices that form the scaffold domain. In gray is the connecting domain. In olive, orange, and red is the elevator domain. HP1 and HP2, the two helix-loop-helix motifs, are in red and marked. The positions of the known Na+ ions and metal ion (M) are in spheres, and the position of Neu5Ac is shown in ball and stick.
Figure 2—figure supplement 1
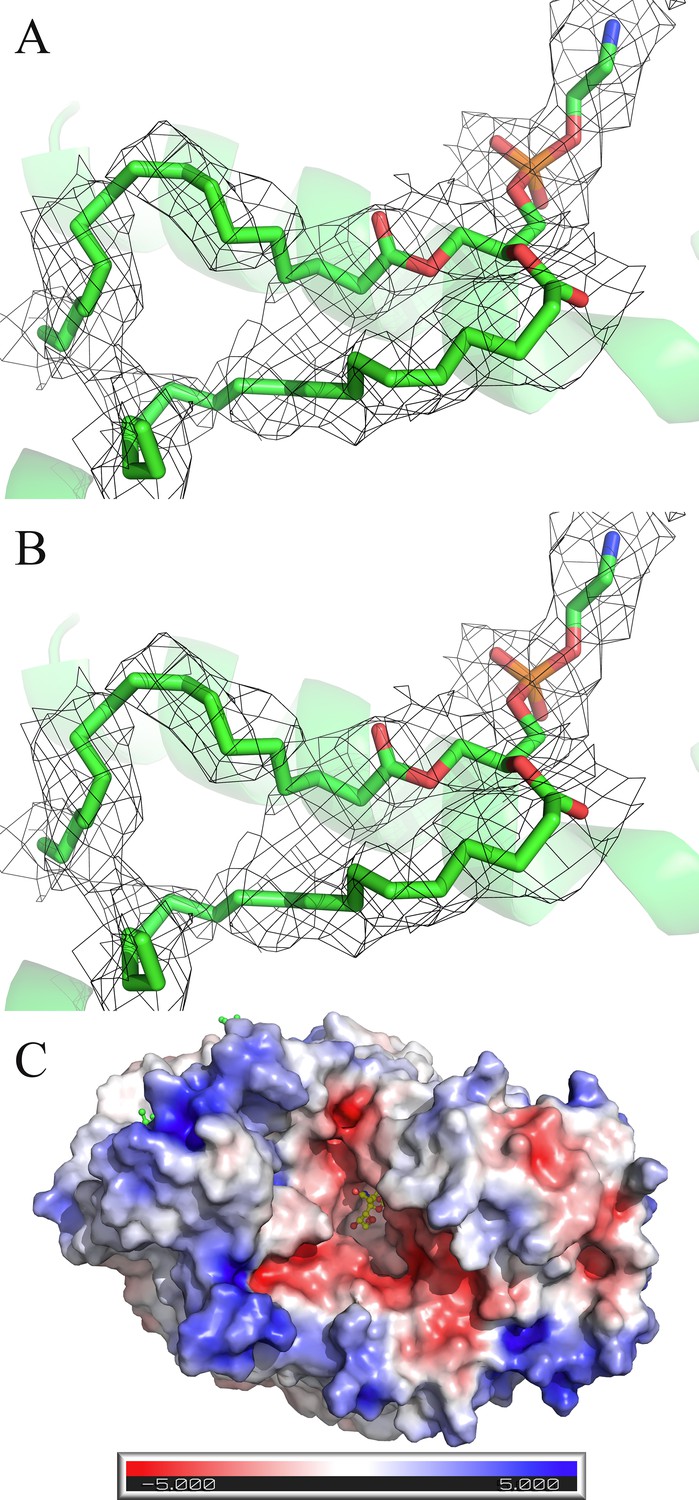
Lipid binding to FnSiaQM and Electrostatic potential map.
(A and B) Density of two lipids (Lipid1 and Lipid2) was observed in the scaffold side of Fusobacterium nucleatum (FnSiaQM) (contour of 1.0 r.m.s.in PyMol). (C) Electrostatic potential visualization of FnSiaQM. N-Acetylneuraminic acid (Neu5Ac) density in the binding pocket of FnSiaQM. ABPS colored in the range from –5 to +5.
Figure 2—figure supplement 2
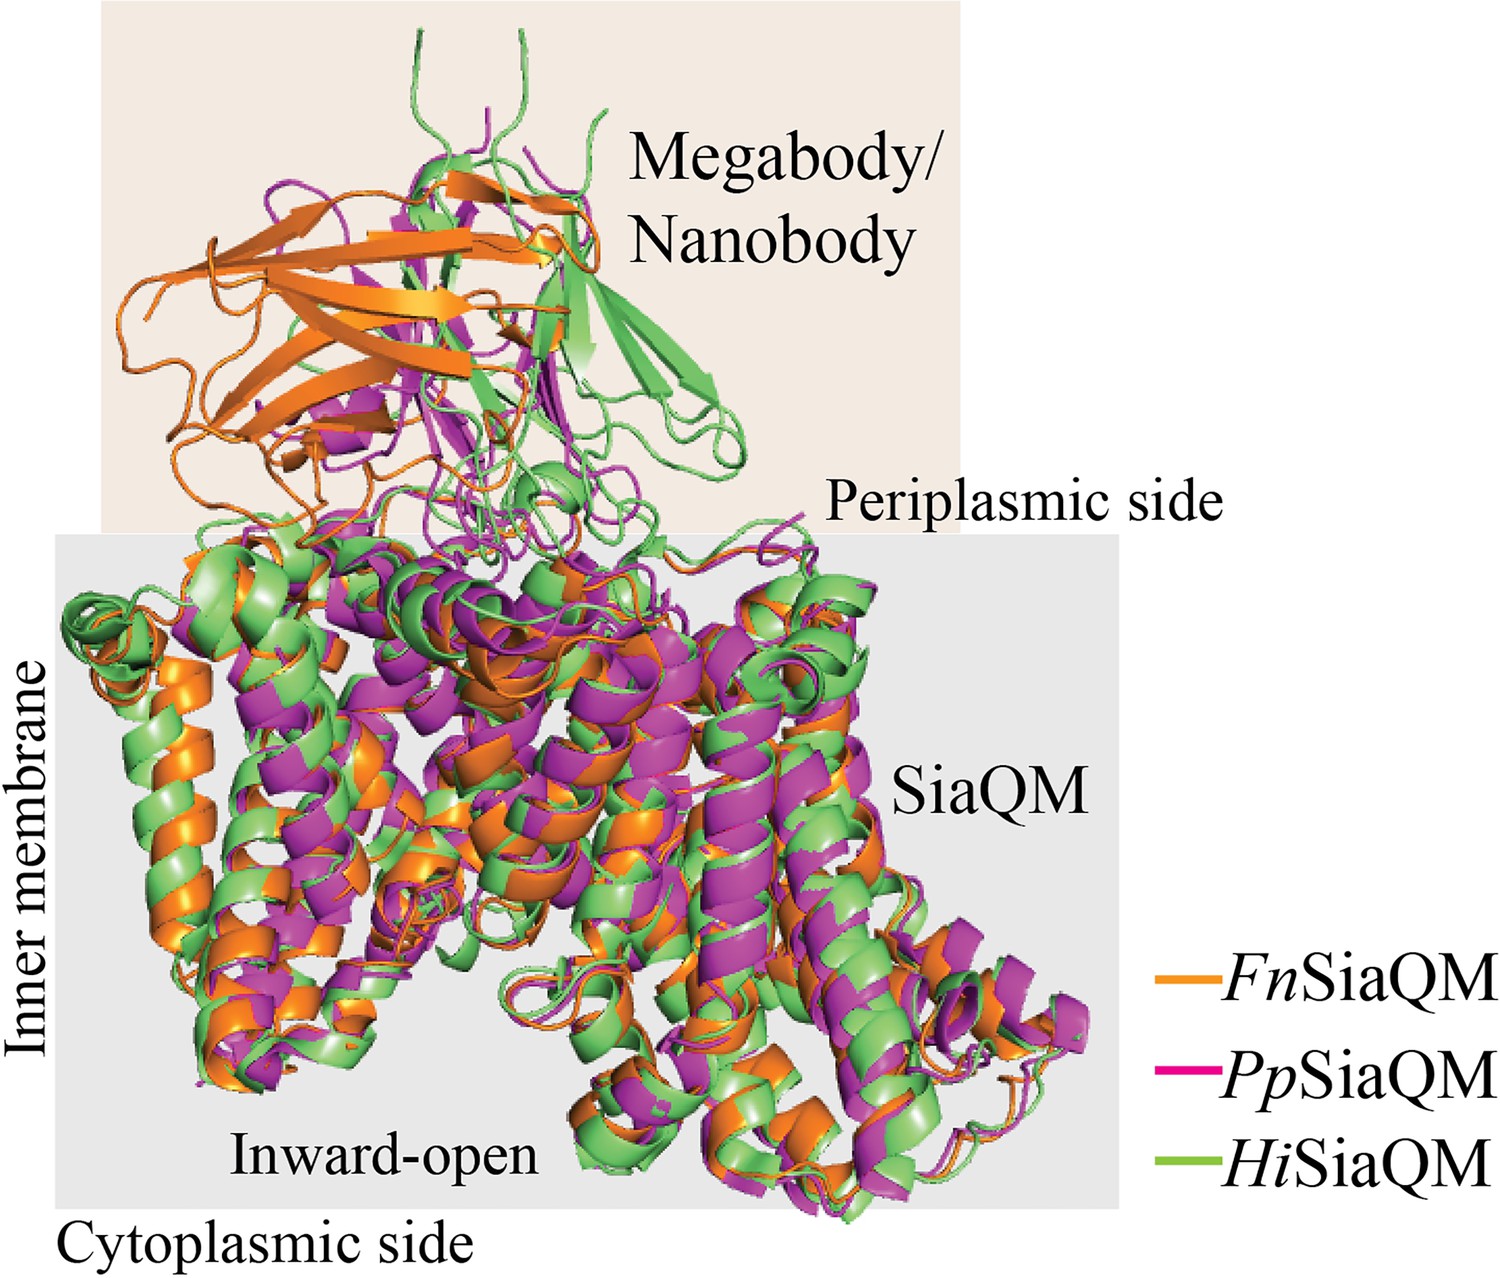
Superposition of SiaQM structure from F.nucleatum, H. influenzae and P. profundum with respective bound nanobody or megabody.
All three structures are in inward-open conformation.
Figure 2—figure supplement 3

SiaQM protein sequence alignment.
SiaQM protein sequences from Photobacterium profundum, Haemophilus influenzae, and Fusobacterium nucleatum. Protein sequences were aligned using ESPript 3.
Figure 2—figure supplement 4
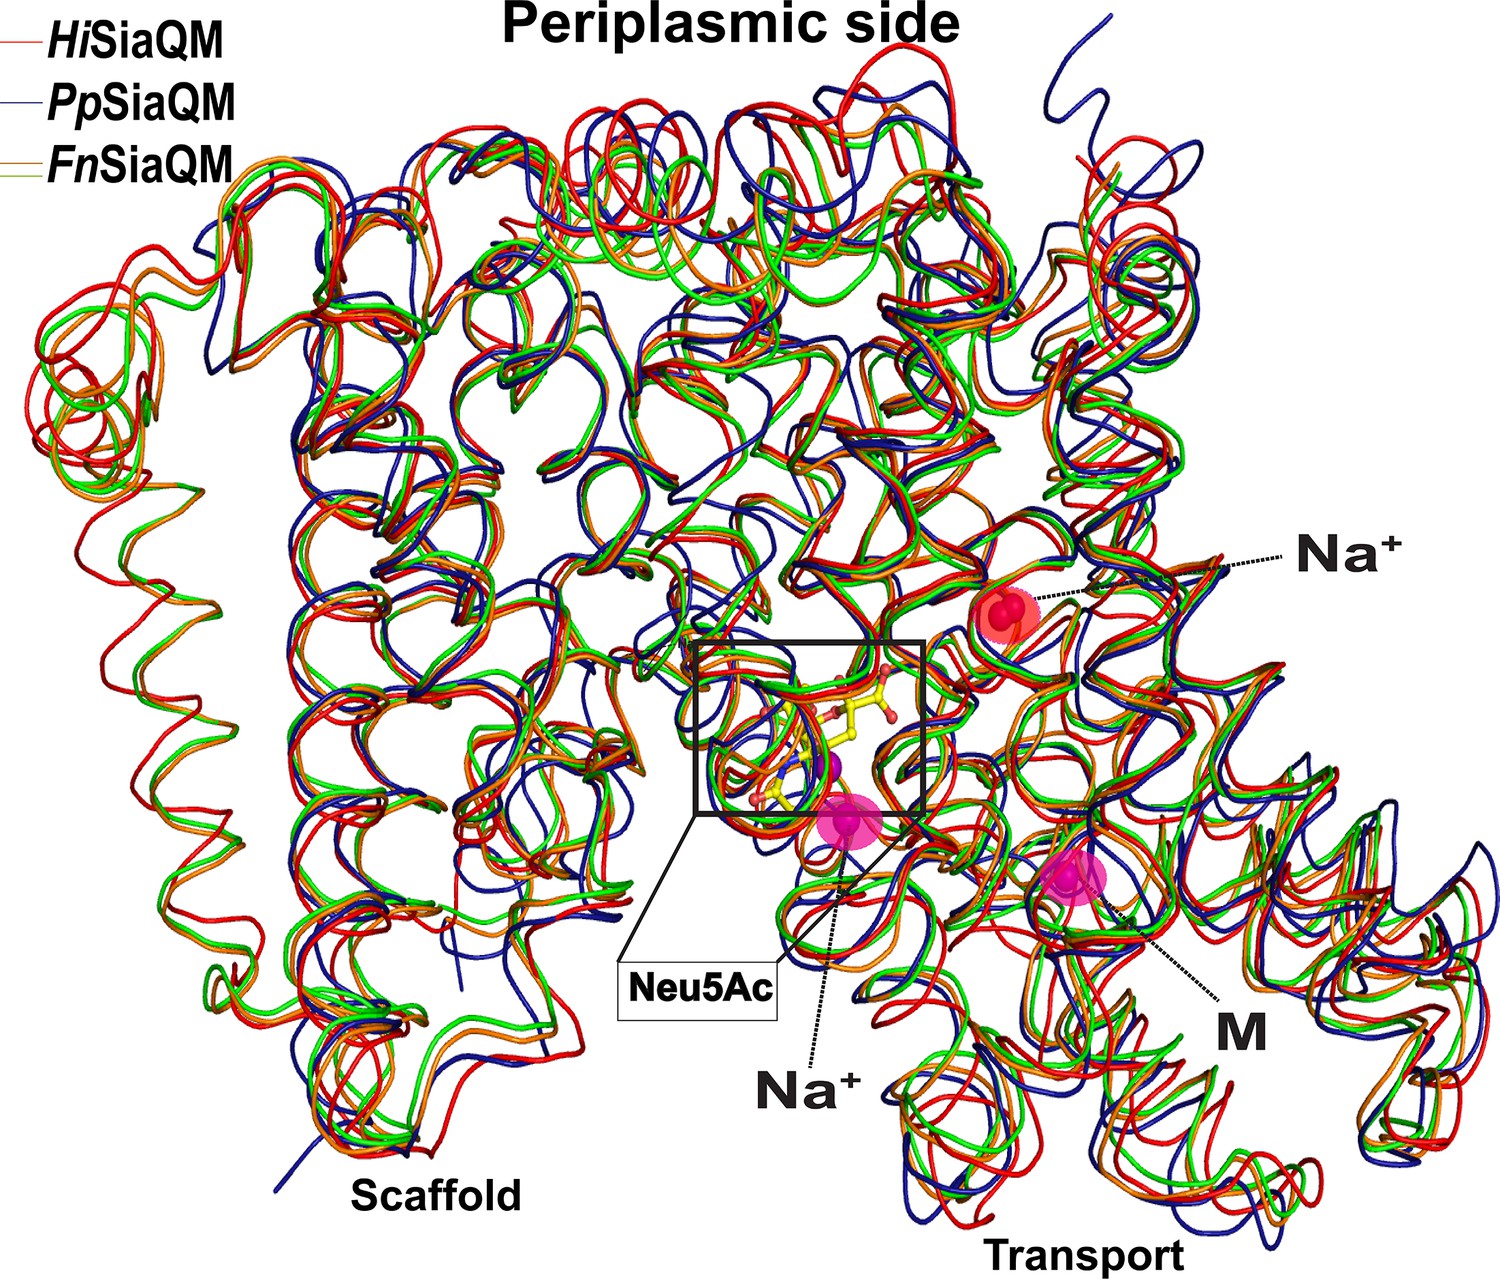
Ribbon diagram showing the superposition of the HiSiaQM, PpSiaQM, and FnSiaQM (liganded and unliganded) structures.
The positions of the known Na+ ions and metal ion (M) are in spheres, and the position of N-Acetylneuraminic acid (Neu5Ac) is shown in ball and stick.
Figure 3 with 2 supplements
Ion binding sites in Fusobacterium nucleatum (FnSiaQM).
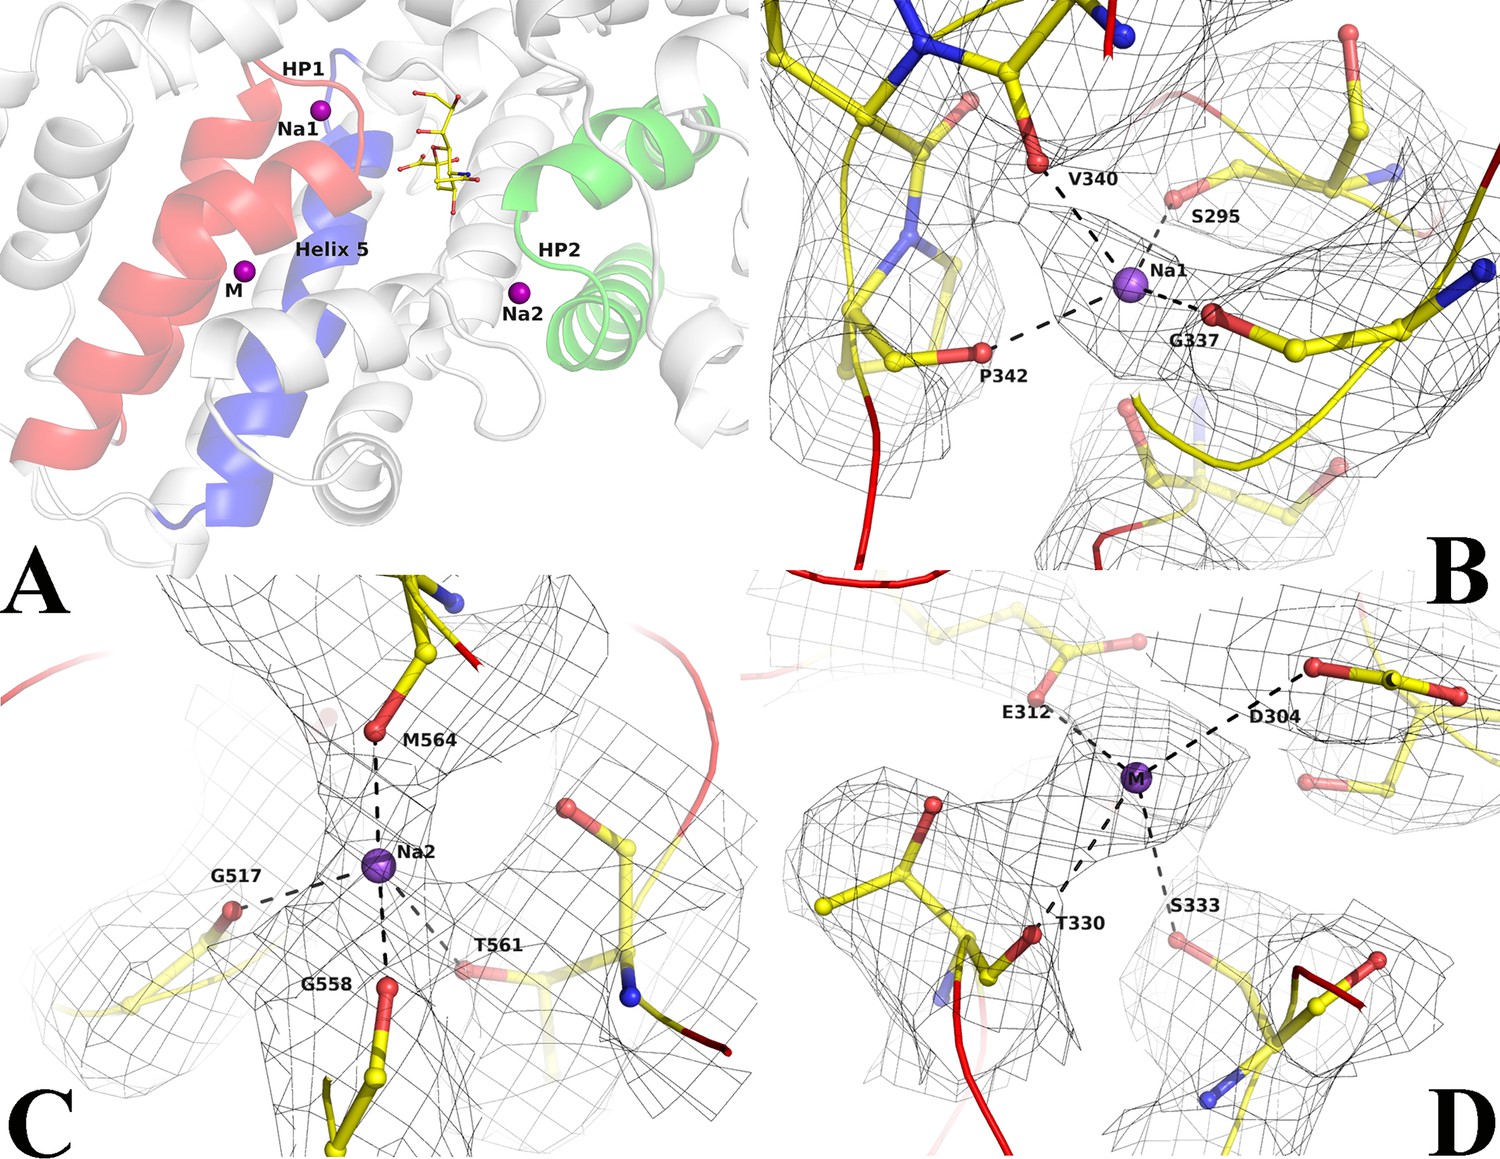
(A) Close-up view of the N-Acetylneuraminic acid (Neu5Ac) and the two Na+ and metal binding sites. In red is the HP1 helix-loop-helix. In green is the HP2 helix-loop-helix. In blue is helix 5 A, the purple spheres are the two Na+ ion binding sites and metal binding site (M), and the bound Neu5Ac is shown in ball and stick. (B–D) Density and interaction details of the Na1, Na2, and M sites, respectively. The figures are made with a contour of 1.0 r.m.s. in PyMol.
Figure 3—figure supplement 1
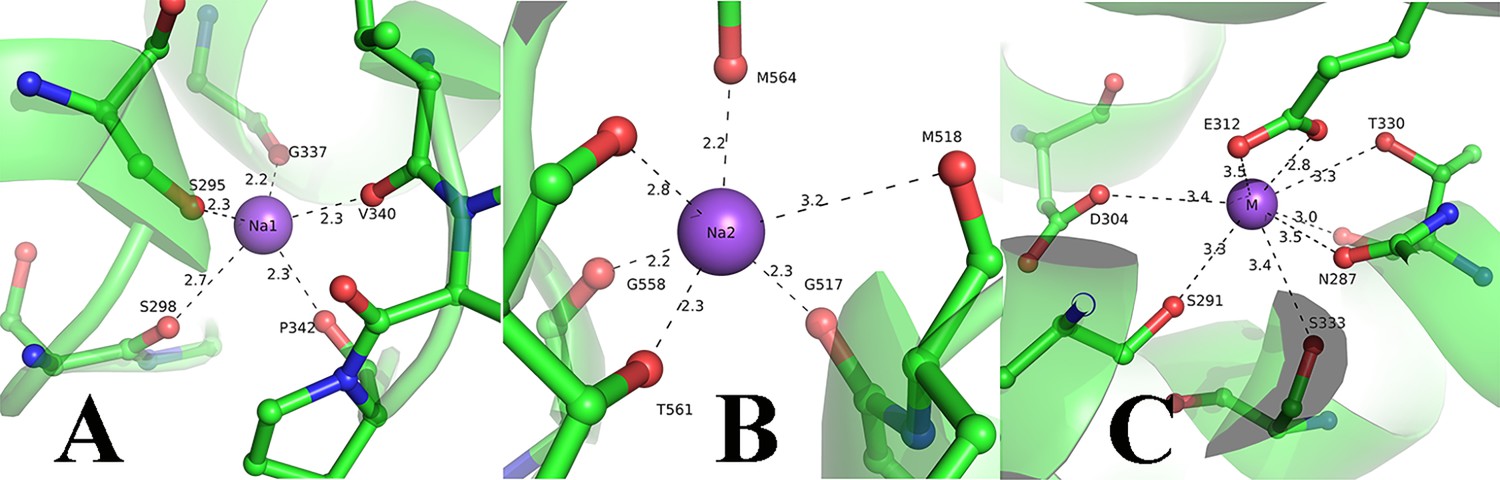
Metal ion co-ordination to FnSiaQM.
(A) Na1 site coordination and its interactions with neighboring amino acids; (B) Na2 site coordination and its interactions with neighboring amino acids; (C) Metal binding site coordination and its interactions with neighboring amino acids.
Figure 3—figure supplement 2
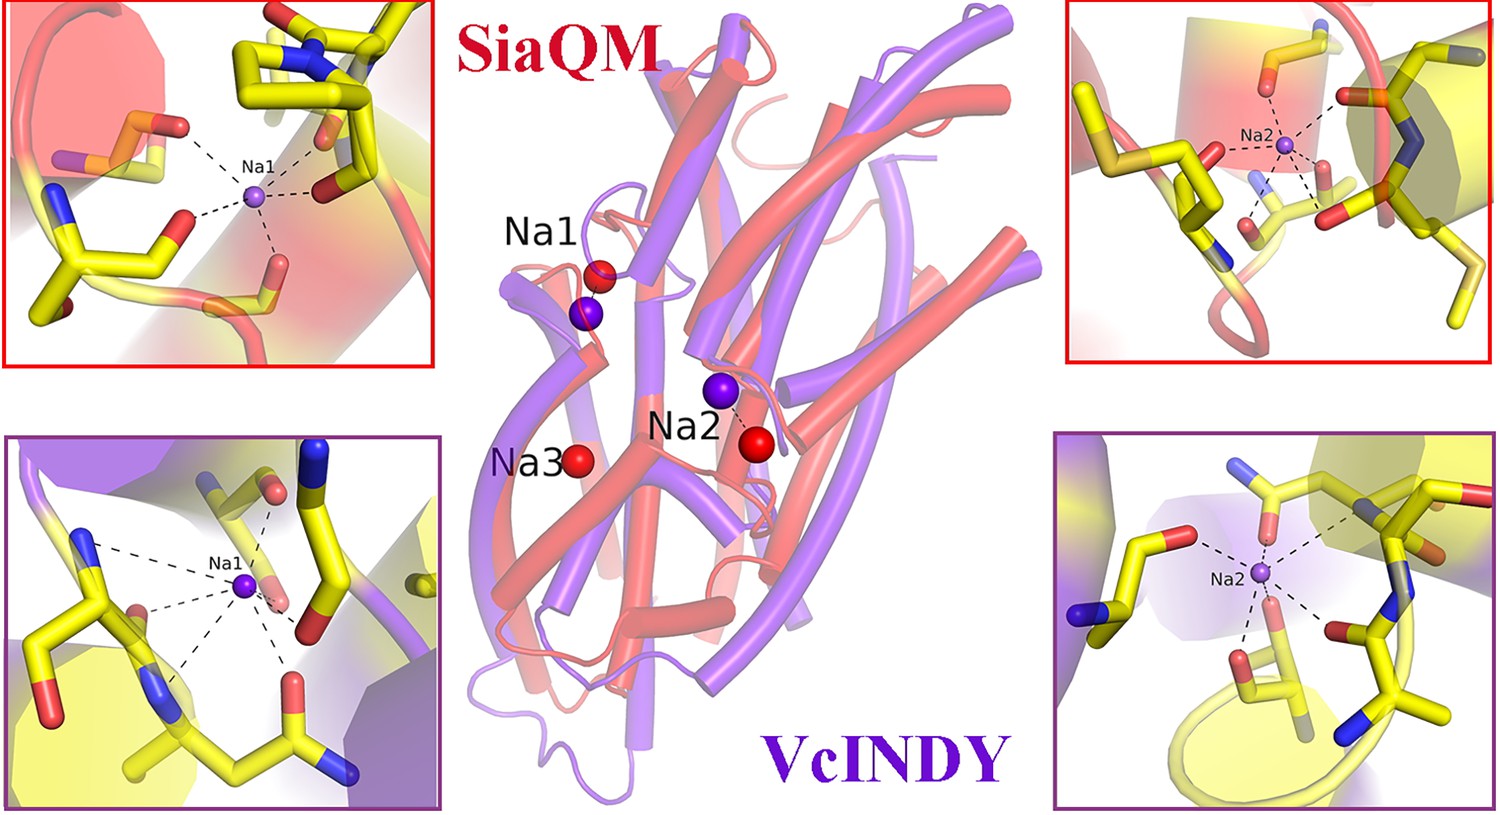
An overlay of sodium ions binding helix-loop-helix regions.
In red is SiaQM, and in purple is the structure of VcIndy (PDB ID: 7T9G). The insets display. the interactions at the two sodium sites. The red insets show the interactions of SiaQM,. while the purple insets represent those of VcIndy.
Figure 4
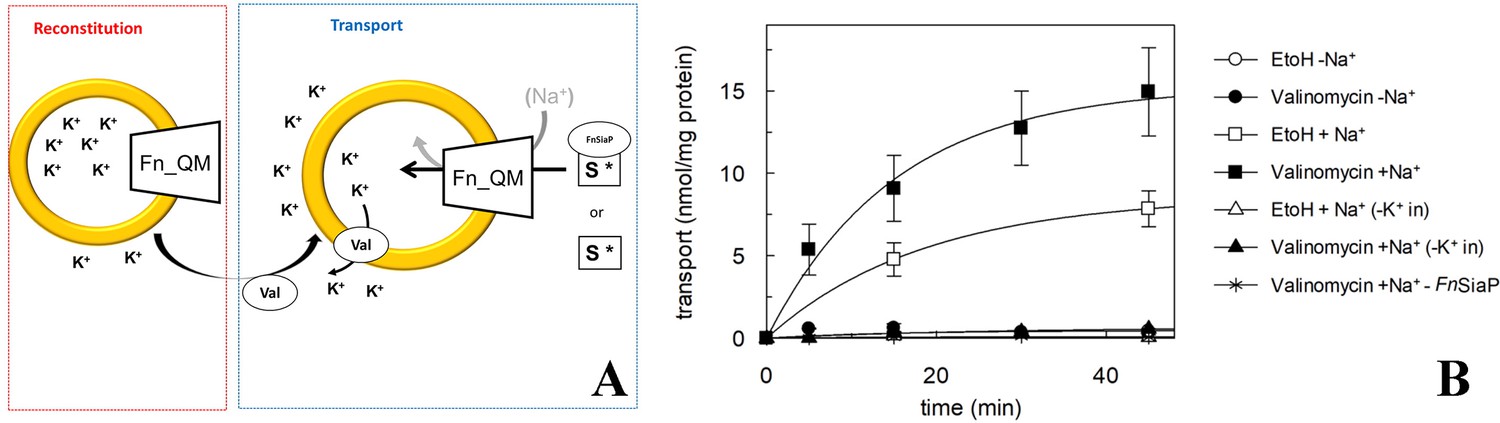
Proteoliposome transporter assays for Fusobacterium nucleatum (FnSiaQM).
(A) Schematic diagram showing the experimental setup. First, FnSiaQM is incorporated into proteoliposome in the presence of internal K+. Then, valinomycin (val) is added to induce the efflux of K+ down its concentration gradient, imposing an artificial membrane potential. To start transport measurement, FnSiaP, [3H]-Neu5Ac, and Na+-gluconate are added in the extraliposomal environment. (B) Time course of N-Acetylneuraminic acid (Neu5Ac) uptake into proteoliposomes reconstituted with FnSiaQM. In black circle, black square, white triangles, black triangle, asterisk, are with conditions, where valinomycin was added to facilitate K+ movement before transport. Ethanol was added instead of valinomycin as a control in the white circle, white square, and white triangle. In white square, black square, white triangle, black triangle, 10 mM Na+-gluconate was added together with 5 µM [3H]-Neu5Ac and 0.5 µM FnSiaP; in white triangle and black triangle proteoliposomes are prepared without internal K+; in black asterisk transport is measured in the presence of 10 mM Na+-gluconate, 5 µM [3H]-Neu5Ac and in the absence of FnSiaP. Uptake data were fitted in a first-order rate equation for time course plots. Data are means±s.d. of three independent experiments.
Figure 5
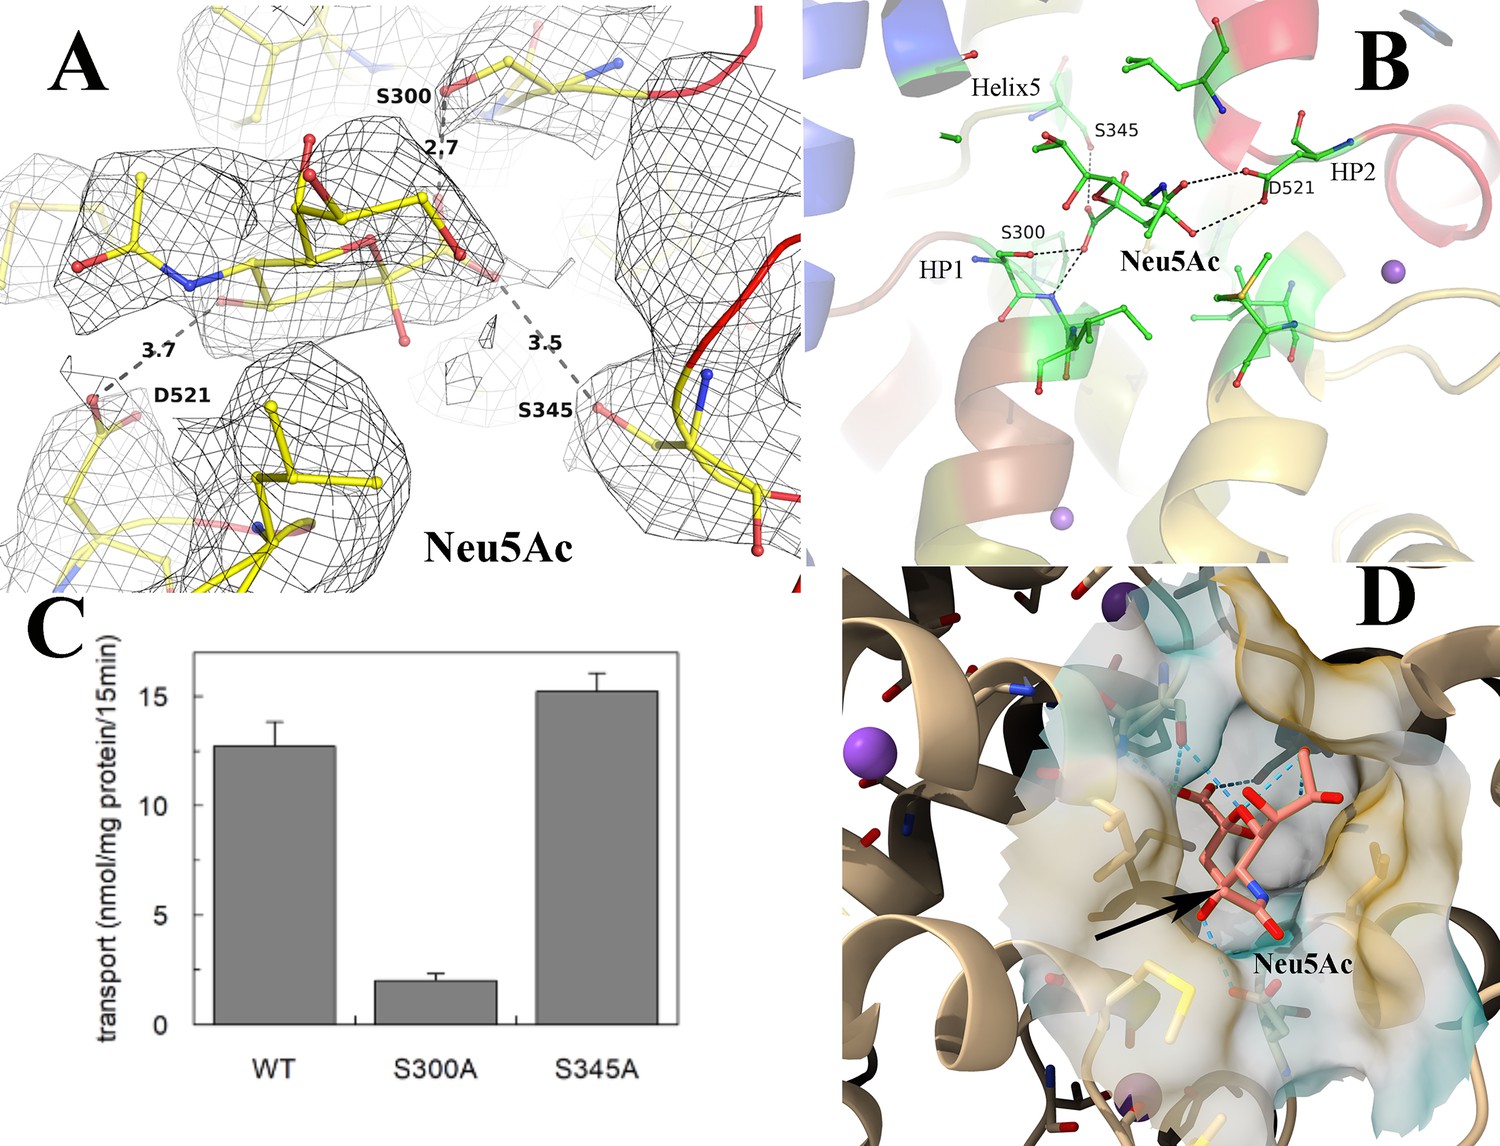
Validation of N-Acetylneuraminic acid (Neu5Ac) binding pocket in Fusobacterium nucleatum (FnSiaQM) transporter.
(A) The fit of the modeled Neu5Ac into the density, contoured to 0.9 * r.m.s. The figure also shows the fit to the density of the residues that interact with Neu5Ac and the distances to key residues discussed in the manuscript. (B) The interactions of Neu5Ac with side chains of interacting residues. Ser300 Oγ is 2.8 Å from the C1-carboxylate oxygen of Neu5Ac, while the main chain NH of residue 301 is 2.6 Å away. The other close polar side chain is that of Ser345γ, which is 3.3 Å away. The Neu5Ac O10 is 2.9 Å from Asp521 Oδ. (C) Transport of Neu5Ac in 15 min. Transport was started by adding 5 µM [3H]-Neu5Ac, 10 mM Na+-gluconate, and 0.5 µM FnSiaP to proteoliposomes in the presence of valinomycin (expected membrane potential, ΔΨ, −117.1 mV). Data are expressed as nmol/mg prot/15 min ±s.d. of three independent experiments. (D) The cavity of Neu5Ac is exposed from the cytoplasmic side. The cavity is large and extends into the cytoplasmic side. The black arrow shows the methyl group with an extra hydroxyl in Neu5Gc.
Figure 6
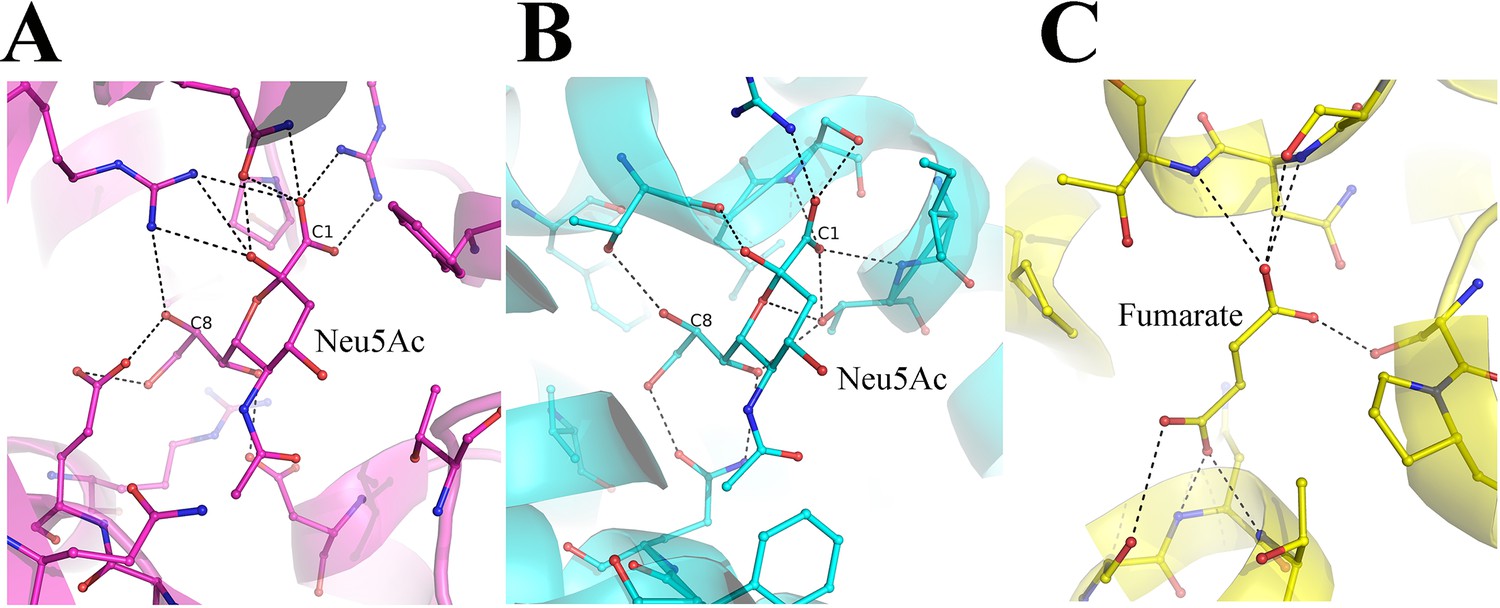
Comparison of N-Acetylneuraminic acid Neu5Ac binding pocket.
(A) The interactions of Neu5Ac with the substrate binding protein SiaP from F.nucleatum (PDB-ID 4MNP). The C1 and the C8 carbon atoms are labeled to show the different ends of the nine-carbon sugar. (B) The interaction of Neu5Ac with the SSS-type Neu5Ac transporter (PDB-ID 5NV9). (C) The interaction of fumarate with the dicarboxylate transporter VcINDY (PDB-ID 6OKZ).
Tables
Table 1
Details of cryo-EM data collection, processing, refinement, and built model.
| Data collection and processingEMDBPDB | Unliganded form389268Y4X | Neu5Ac-bound389258Y4W |
|---|---|---|
| Magnification | 75000 | 75000 |
| Voltage (kV) | 300 | 300 |
| Electron dose (e-/Å3) | 27.7 | 24.67 |
| Defocus Range (nm) | 1800–3000 | 1600–2800 |
| Pixel size (Å) | 1.07 | 1.07 |
| Symmetry imposed | C1 | C1 |
| Initial particle images (no.) | 385668 | 653554 |
| Final particle images (no.) | 141272 | 225006 |
| Map resolution (Å) | 3.20 | 3.16 |
| FSC threshold | 0.143 | 0.143 |
| Map resolution range (Å) | 2.7–5.5 | 2.6–4.1 |
| Refinement | ||
| Model composition | ||
| Non-hydrogen atoms | 5801 | 5873 |
| Protein residues | 732 | 732 |
| Ligand | 2 Na+;1 Lipid | 3 Na+; 2 Lipid; 1 Neu5Ac |
| B-factor (Å2) | ||
| Protein (mean) | 46.72 | 43.60 |
| Ligand (mean) | 45.88 | 56.25 |
| R.m.s deviations | ||
| Bond lengths (Å) | 0.005 | 0.004 |
| Bond angles (o) | 0.531 | 0.512 |
| Validation | ||
| MolProbity score | 1.76 | 1.54 |
| Clashscore | 5.57 | 5.07 |
| CaBALM outliers (%) | 1.52 | 1.52 |
| Rotamer outliers (%) | 1.77 | 1.13 |
| Ramachandran plot (%) (Favored/Allowed/Disallowed) | (96.02/3.98/0) | (96.43/3.57/0) |
Additional files
Download links
A two-part list of links to download the article, or parts of the article, in various formats.
Downloads (link to download the article as PDF)
Open citations (links to open the citations from this article in various online reference manager services)
Cite this article (links to download the citations from this article in formats compatible with various reference manager tools)
Molecular determinants of Neu5Ac binding to a tripartite ATP independent periplasmic (TRAP) transporter
eLife 13:RP98158.
https://doi.org/10.7554/eLife.98158.4


