SRSF2 is a key player in orchestrating the directional migration and differentiation of MyoD progenitors during skeletal muscle development
- CAS Key Laboratory of Nutrition, Metabolism and Food Safety, Shanghai Institute of Nutrition and Health, University of Chinese Academy of Sciences, Chinese Academy of Sciences, China
- Lin He's Academician Workstation of New Medicine and Clinical Translation in Jining Medical University, Jining Medical University, China
Figures
Figure 1 with 1 supplement
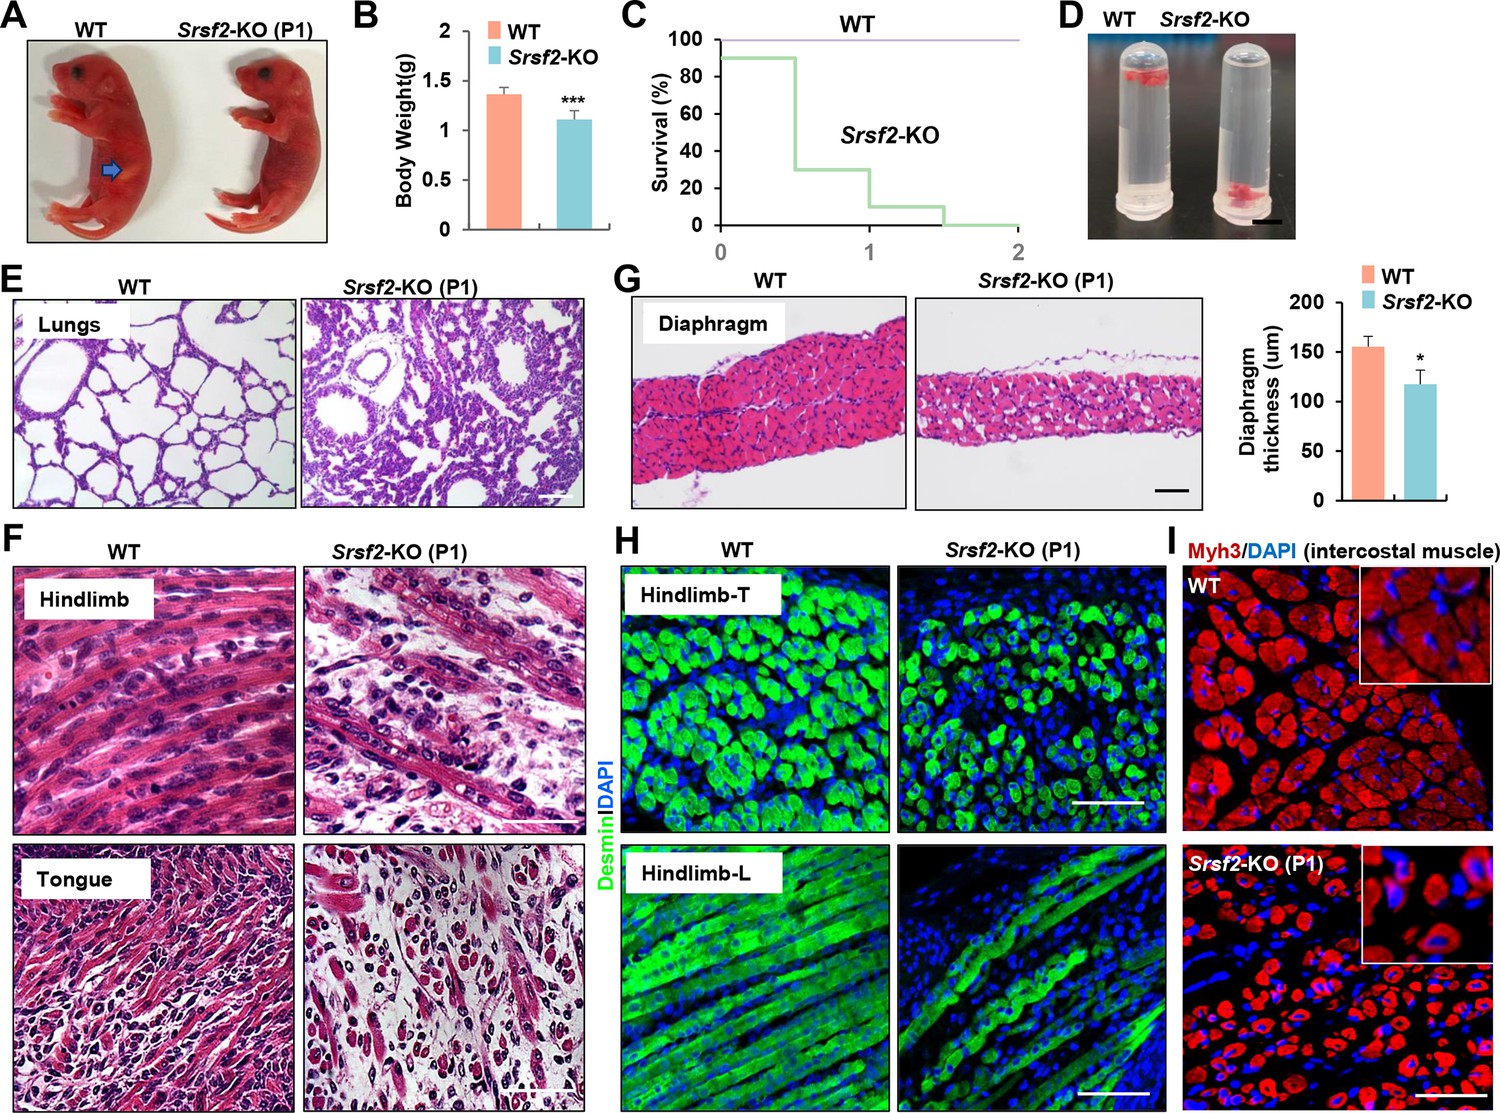
Inactivation of Srsf2 in MyoD + progenitors resulted in skeletal muscle dysfunction and respiratory failure.
(A) Macroscopic appearance of wild-type (WT) and Srsf2-KO pups immediately after birth (P1). Scale bars, 5 mm. (B) Comparison of body weight between WT and KO pups (n=10). (C) Survival curve of WT and KO pups (n=10). (D) Sinking test for lungs excised from P1 WT and KO mice and placed in a 5 ml Ep tube. (E) Representative HE staining of lung sections at P1 (n=3). Scale bars, 50 μm. (F) Representative HE staining on longitudinal sections of hindlimbs (top panels), and transverse tongue sections at P1 (bottom panels) (n=3). Scale bars, 10 μm. (G) Representative HE staining of transverse sections of diaphragms at P1 (n=3). Scale bars, 50 μm. Comparison of diaphragm thickness is displayed on the right. (H) Representative confocal images of desmin staining in transverse sections and longitudinal sections of hindlimbs from WT and KO at P1 (n=3). Scale bars, 10 μm. (I) Representative confocal images of Myh3 staining in intercostal muscle sections of WT and KO at P1 (n=3). Scale bars, 10 μm. Enlarged views are shown in the upper right corners.
Figure 1—figure supplement 1
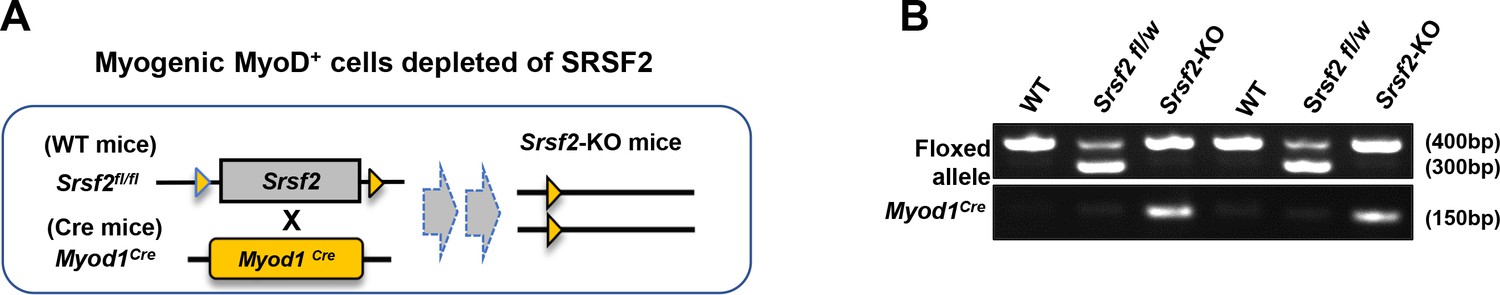
Schematic diagram of Srsf2-KO mice and genotyping.
(A) Schematic diagram of Srsf2-KO (Srsf2fl/fl; Myod1Cre) was generated through the breeding Srsf2fl/fl mice with Myod1Cre. (B) Genotyping of newborns pups.
-
Figure 1—figure supplement 1—source data 1
Original files for the genomic PCR analysis in Figure 1—figure supplement 1B (floxed-allele and Myod1Cre).
- https://cdn.elifesciences.org/articles/98175/elife-98175-fig1-figsupp1-data1-v1.zip
-
Figure 1—figure supplement 1—source data 2
PDF containing annotation of original PCR gels in Figure 1—figure supplement 1B (floxed-allele and Myod1Cre).
- https://cdn.elifesciences.org/articles/98175/elife-98175-fig1-figsupp1-data2-v1.zip
Figure 2
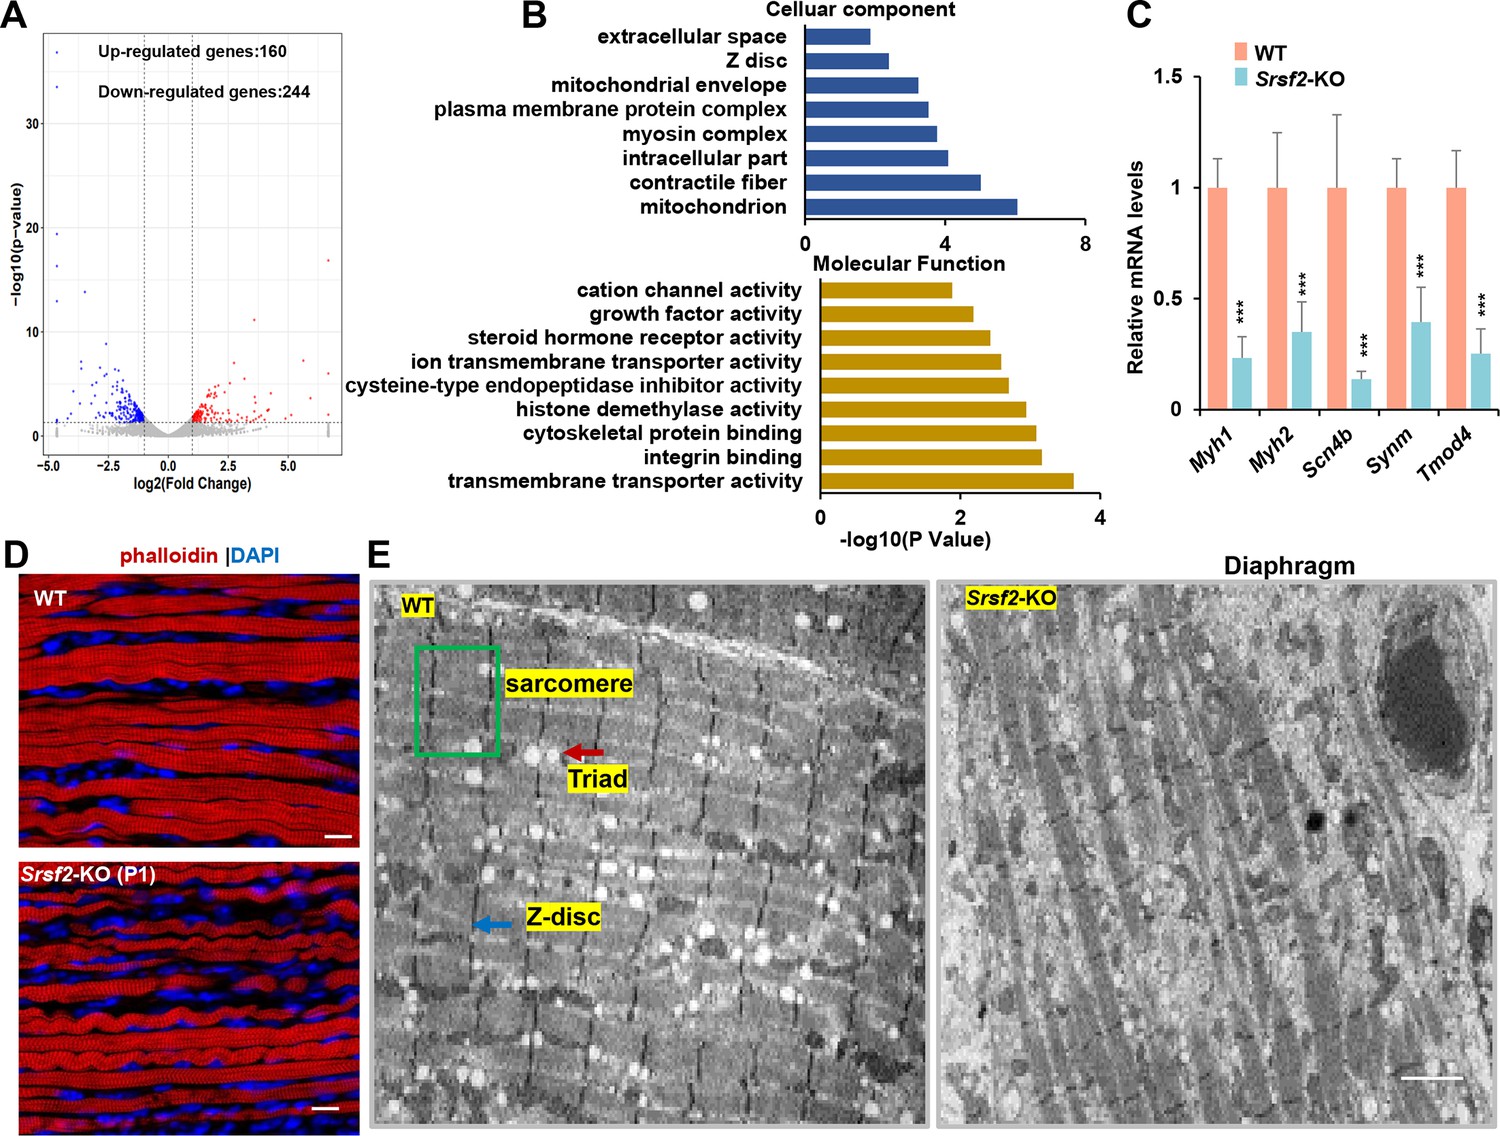
RNA-seq analysis and disrupted sarcomere structures in the KO skeletal muscle.
(A) RNAs-seq was conducted on P1 diaphragm samples. Based on statistical significance (p-value <0.05) and fold change, over 160 upregulated genes and 244 downregulated genes were identified. (B) Gene Ontology (GO) enrichment analysis of differentially expressed genes (DEGs) was performed, focusing on their cellular component and molecular function categories. (C) qPCR analysis on a selection of genes based on RNA-seq data, using P1 diaphragm samples (n=6). (D) Representative confocal images of phalloidin staining in longitudinal sections of P1 diaphragm muscle of WT and Srsf2-KO mice. Scale bars, 10 μm. (E) Transmission electron microscopy images of the diaphragm in newborn WT and KO mice. Sarcomere is indicated by the green box, Z-disc by the blue arrow, and Triad by the red arrow. Scale bars, 20 μm.
Figure 3 with 1 supplement
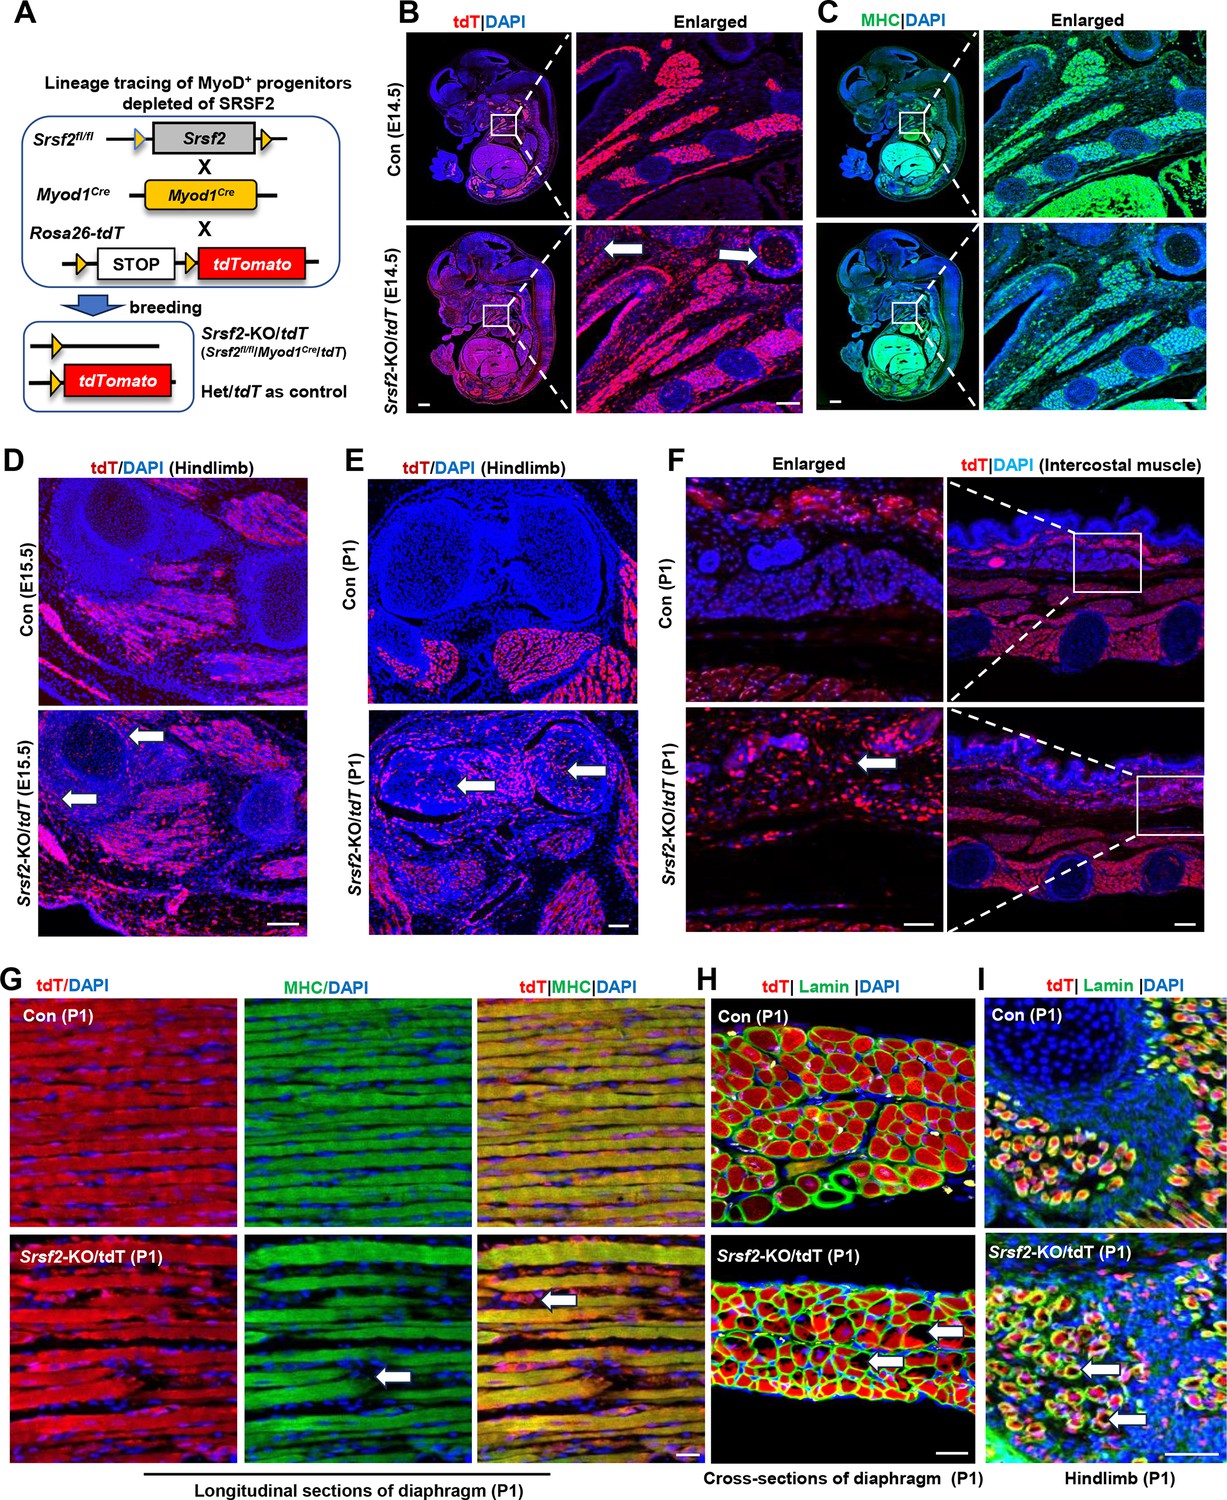
Srsf2-deficinent MyoD-derived cells migrated into non-skeletal muscle regions and displayed significant differentiation defects.
(A) A schematic diagram of Srsf2-KO/tdT mice (Srsf2fl/fl;Myod1Cre;tdT) was generated through the breeding of Srsf2fl/fl mice with Myod1Cre mice and Rosa26-tdTomato mice. Srsf2fl/w; Myod1Cre;tdT mice served as the control group. (B) Representative confocal images of tdT (red) staining on sagittal sections from E14.5 control and KO/tdT embryos. Scale bar is 500 μm. The red boxes indicated the enlarged images on the right, with a scale bar of 100 μm. (C) Representative confocal images of MHC (green) staining on sagittal sections from E14.5 control and KO/tdT embryos. Scale bars, 500 μm. White arrows indicated non-skeletal muscle regions. The enlarged images were shown on the right, with a scale bar of 100 μm. (D) Representative confocal images of tdT (red) staining in hindlimb sections from E15.5 mice. Scale bars, 100 μm. White arrows indicated non-skeletal muscle regions. (E) Representative confocal images of tdT (red) staining in hindlimb sections from P1 mice. Scale bars, 100 μm. White arrows indicated non-skeletal muscle regions. (F) Representative confocal images of tdT staining in transverse sections of intercostal muscle isolated from P1 mice. Scale bars, 200 μm. Enlarged images were shown on the left with a scale bar of 50 μm. (G) Representative confocal images of tdT (red) and MHC staining on longitudinal diaphragm sections from P1 mice. Scale bars, 20 μm. White arrows indicate undifferentiated cells or tdT-labeled cells without MHC staining. (H) Representative confocal images of tdT (red) and Laminin (green) immunostaining in transverse diaphragm sections from P1 mice. Scale bars, 20 μm. (I) Representative confocal images of tdT (red) and Laminin (green) immunostaining in hindlimb sections from P1 mice. Scale bars, 50 μm. White arrows highlight cavities within tdT/Lamin labeled cells.
Figure 3—figure supplement 1
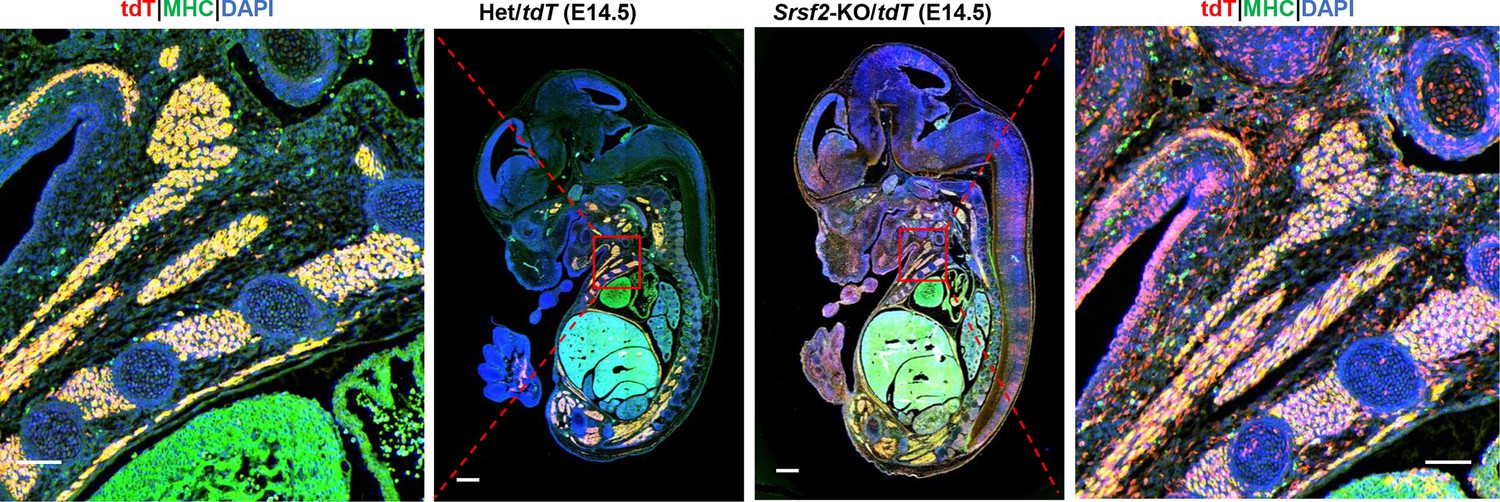
Merged images of tdT and MHC on the sagittal sections of E14.5 embryos.
Representative confocal images of tdT (red) and MHC (green) staining on sagittal sections from E14.5 control and KO/tdT embryos. Scale bar is 500 μm. The red boxes indicated the enlarged images shown on the side, with a scale bar of 100 μm.
Figure 4 with 3 supplements
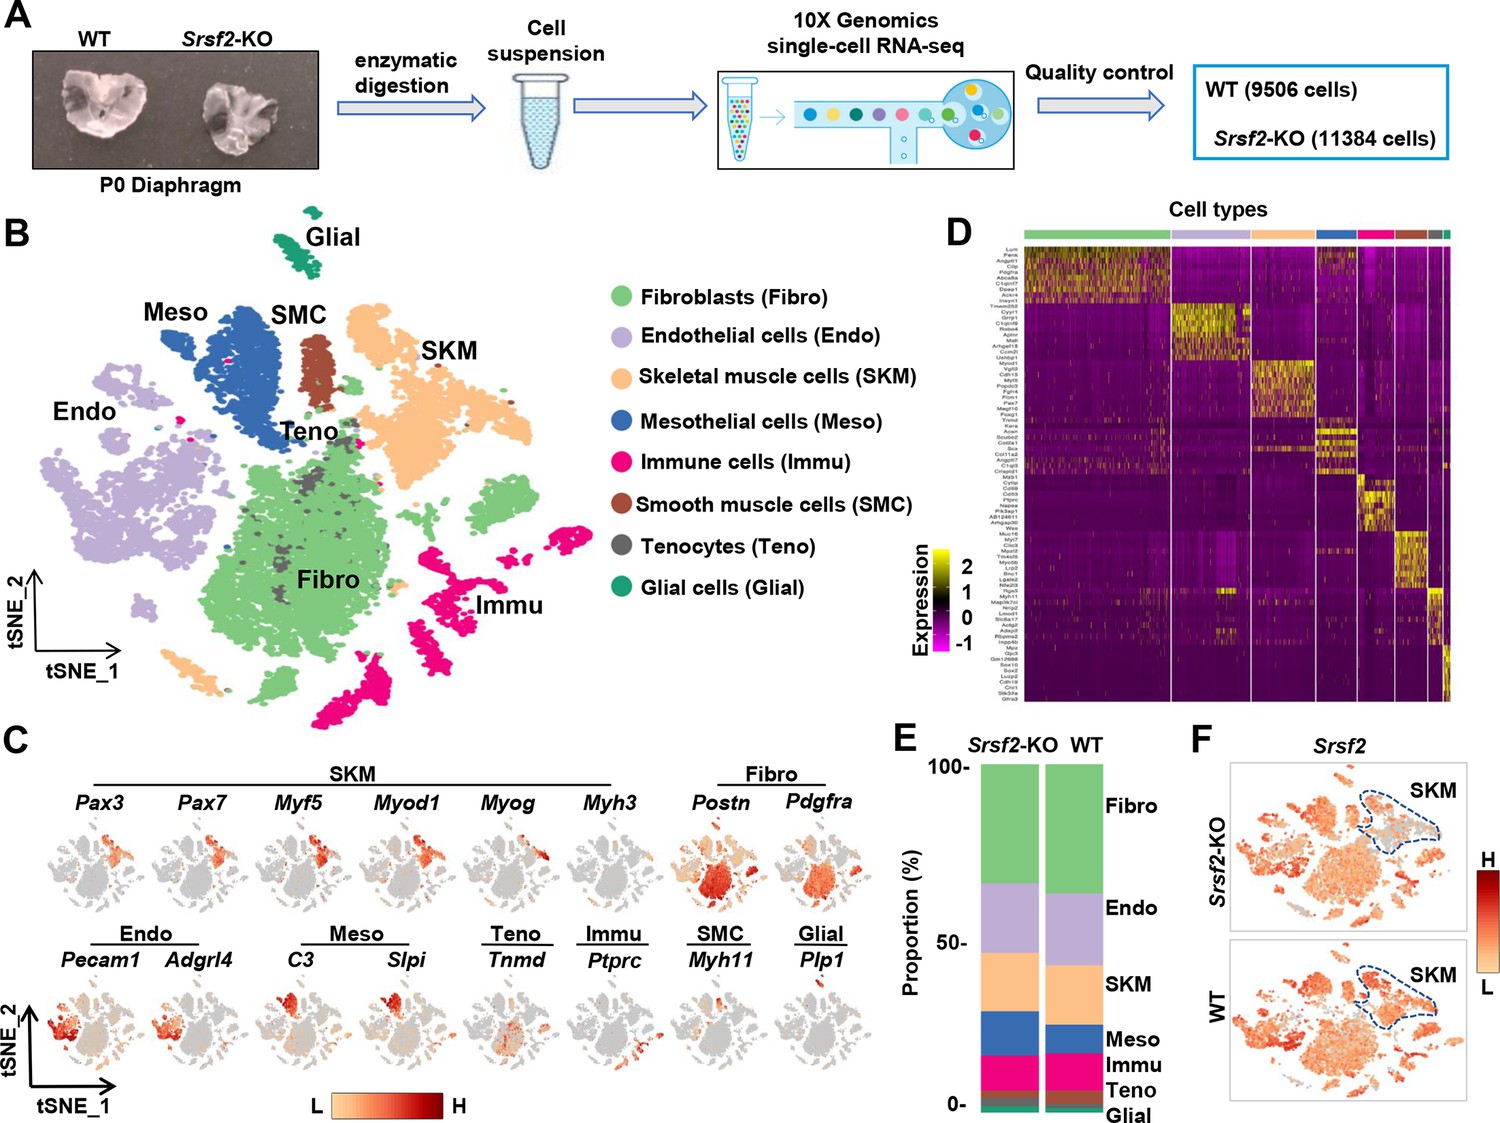
scRNA‐seq analysis identifies distinct cell populations within P1 diaphragms.
(A) Diagram of single-cell preparation from P1 diaphragms and processing using the 10 X Genomics platform for single-cell RNA-sequencing analysis. (B) t-SNE plot showing eight distinct cell populations identified in P1 wild-type (WT) and Srsf2-KO groups. Note that clusters expressing same marker genes were grouped into the same population. (C) t-SNE plot showing the expression of representative marker genes within distinct cell populations. (D) Heatmap showing the top 10 most differently expressed genes among eight distinct cell populations. (E) Proportion comparison of cell populations between WT and Srsf2-KO groups. (F) The levels of Srsf2 are reduced in the Srsf2-KO skeletal muscle (SKM) cells compared to WT cells.
Figure 4—figure supplement 1
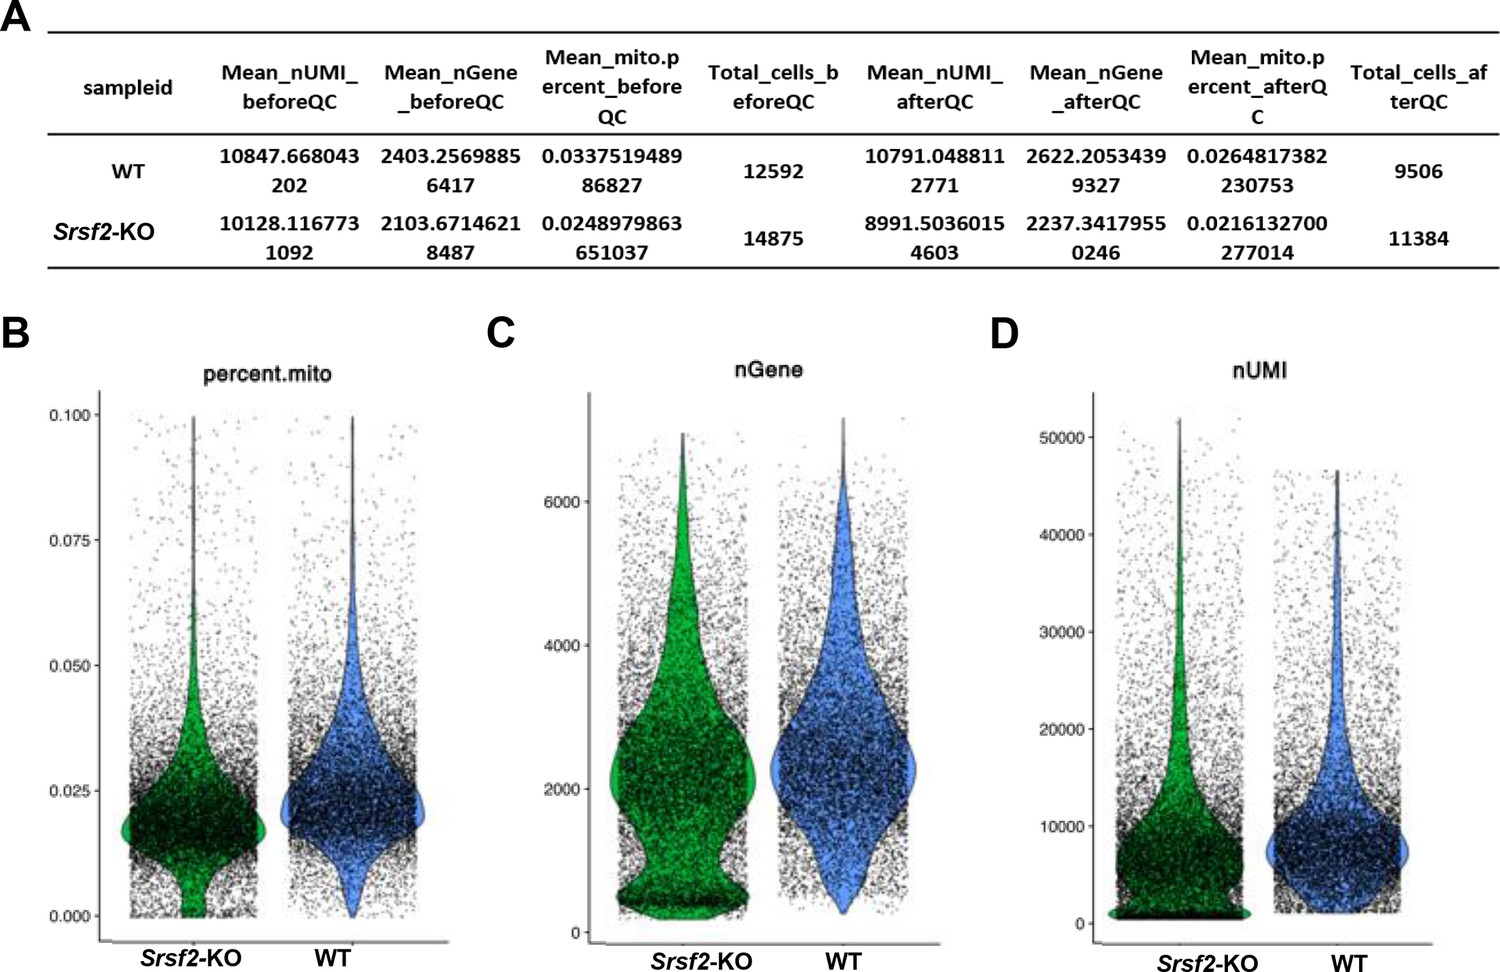
Analysis of scRNA-seq data.
(A) Quality control metrics of the wild-type (WT) and Srsf2-KO samples. (B) Violin distribution of the proportion of mitochondrial genes in each cell after quality control. (C) Violin distribution of the number of gene expression in each cell after quality control. (D) Violin distribution of the number of UMIs per cell after quality control.
Figure 4—figure supplement 2
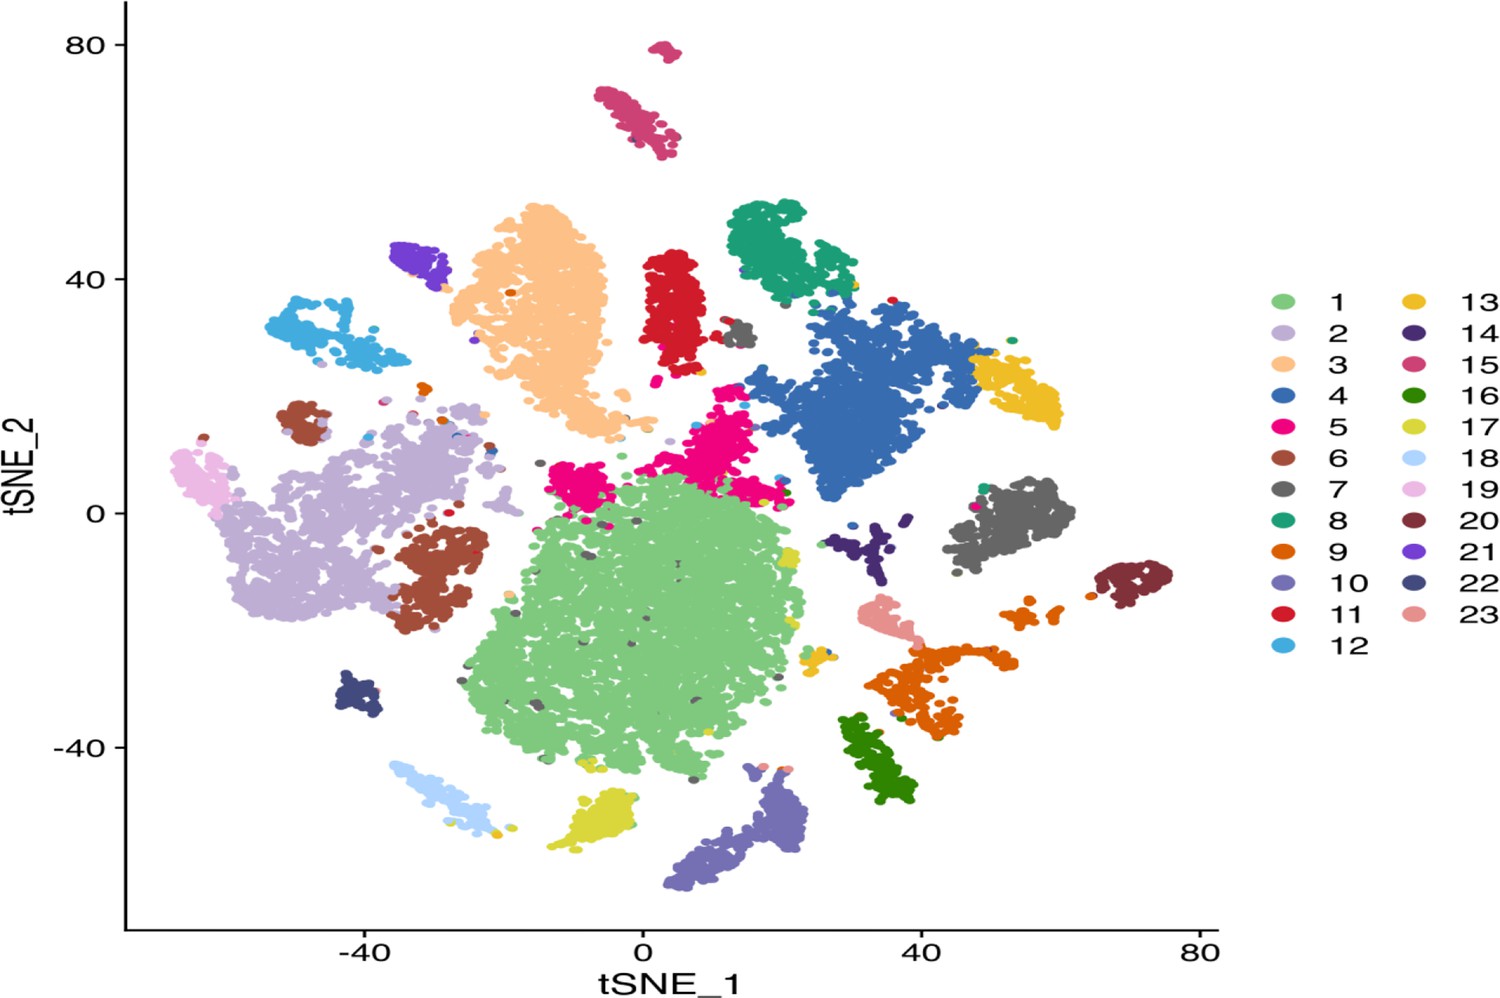
The t-distributed stochastic neighbor embedding (t-SNE plot) reveals 22 cell clusters that have been identified within the combined wild-type (WT) and Srsf2-KO diaphragm cells.
Clusters were indicated by different colors and cell numbers.
Figure 4—figure supplement 3
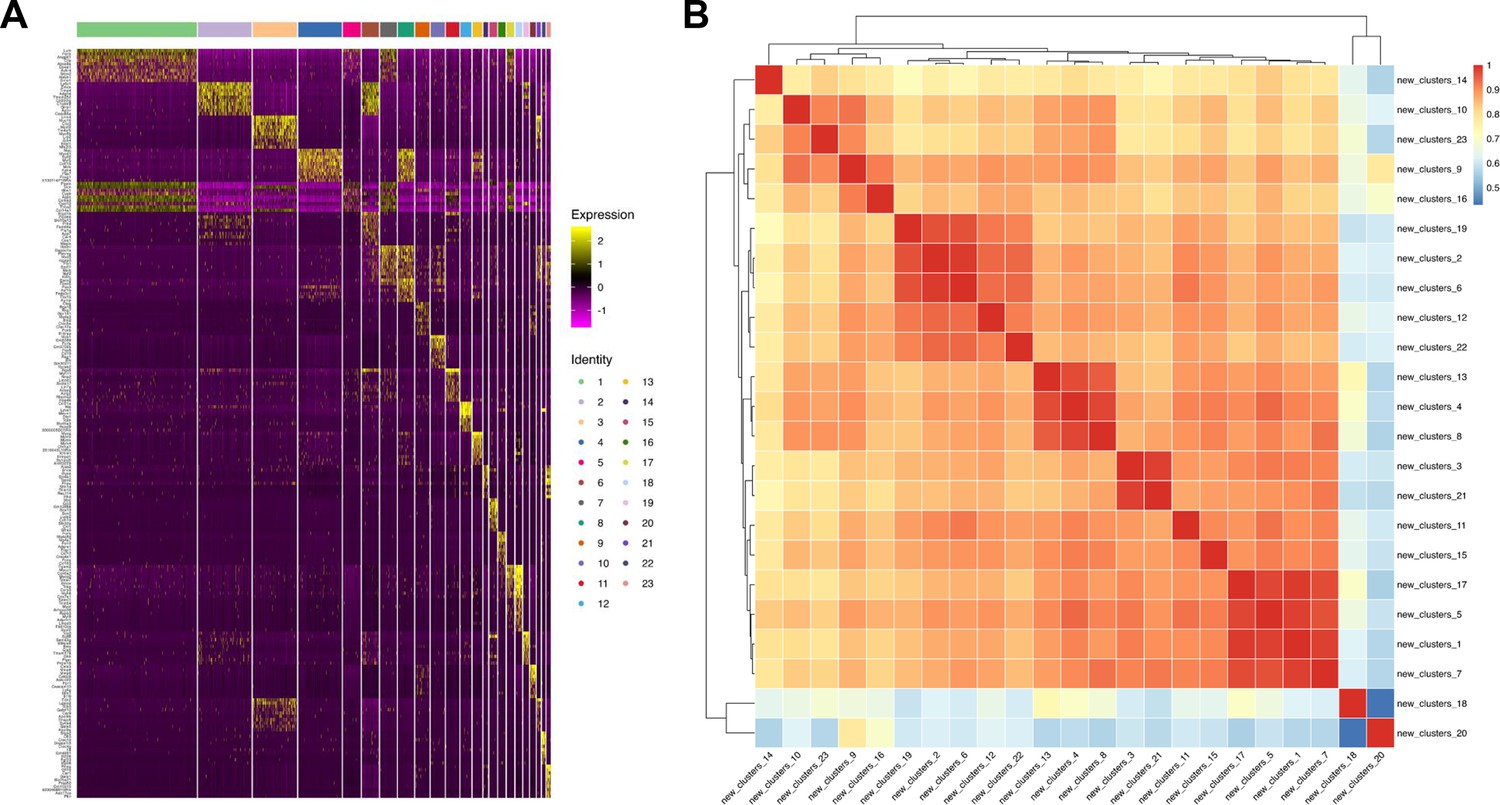
Analysis of cell clusters based on sc-RNAseq data.
(A) Marker gene expression heatmap. The x-axis represents cell clusters, and the y-axis represents marker genes. (B) Cell cluster correlation heatmap. The x and y-axes depict various cell clusters, with numerical values in the heatmap Pearson correlation coefficients. Higher values are represented by a redder color, indicating stronger correlation between cell clusters.
Figure 5 with 1 supplement
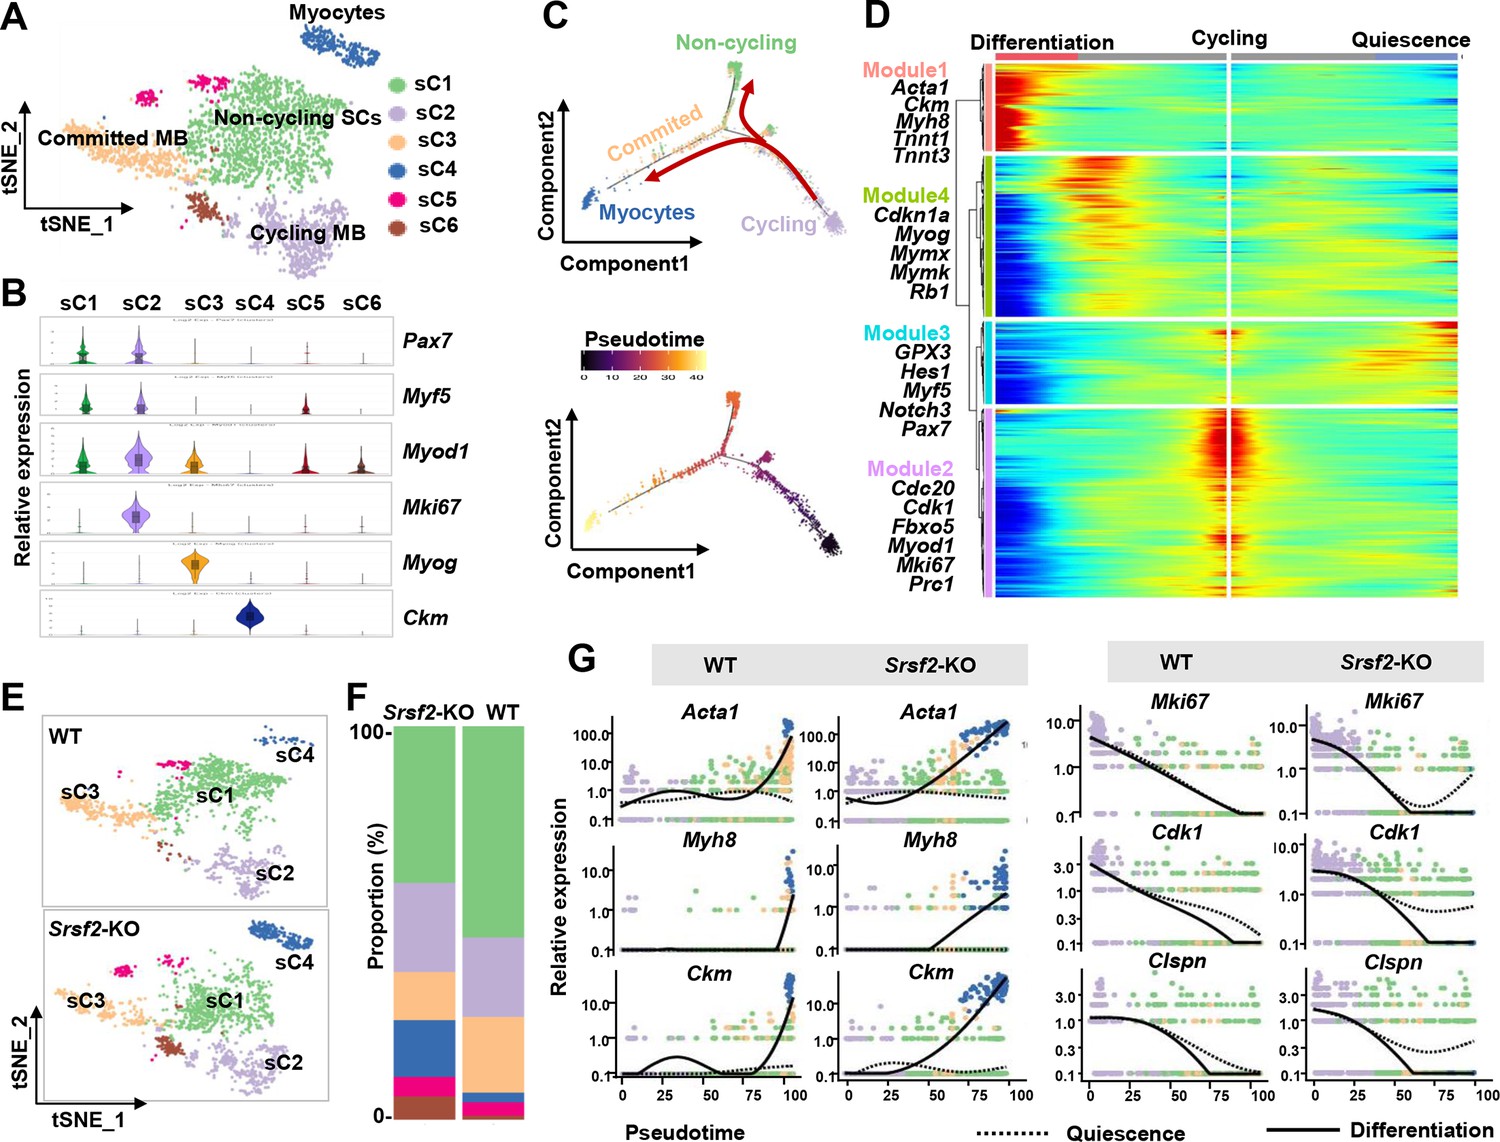
Loss of Srsf2 results in precocious differentiation of myoblasts.
(A) The t-distributed stochastic neighbor embedding (t-SNE) plot reveals six distinct subclusters from wild-type (WT) and Srsf2-KO skeletal muscle cells (SKM) cells. (B) Violin plot showing expression levels of the marker genes in the subclusters. (C) Pseudotime-ordered analysis of SKM subclusters, shown as arrangement of subclusters along the two branches of the pseudotime (top), and their pseudotime order (bottom). (D) Heatmap showing expression dynamics of marker genes along the pseudotime branches. Representative marker genes in the four expression modules along the pseudotime shown on the left to the heatmap. (E) Separate t-SNE subcluster projections of WT (top) and Srsf2-KO (bottom) SKM cells. (F) Proportion comparison of WT and Srsf2-KO SKM subclusters. (G) Plots showing the relative levels of marker genes of WT (left) and Srsf2-KO (right) along the differentiation and quiescence branches of the pseudotime, respectively.
Figure 5—figure supplement 1
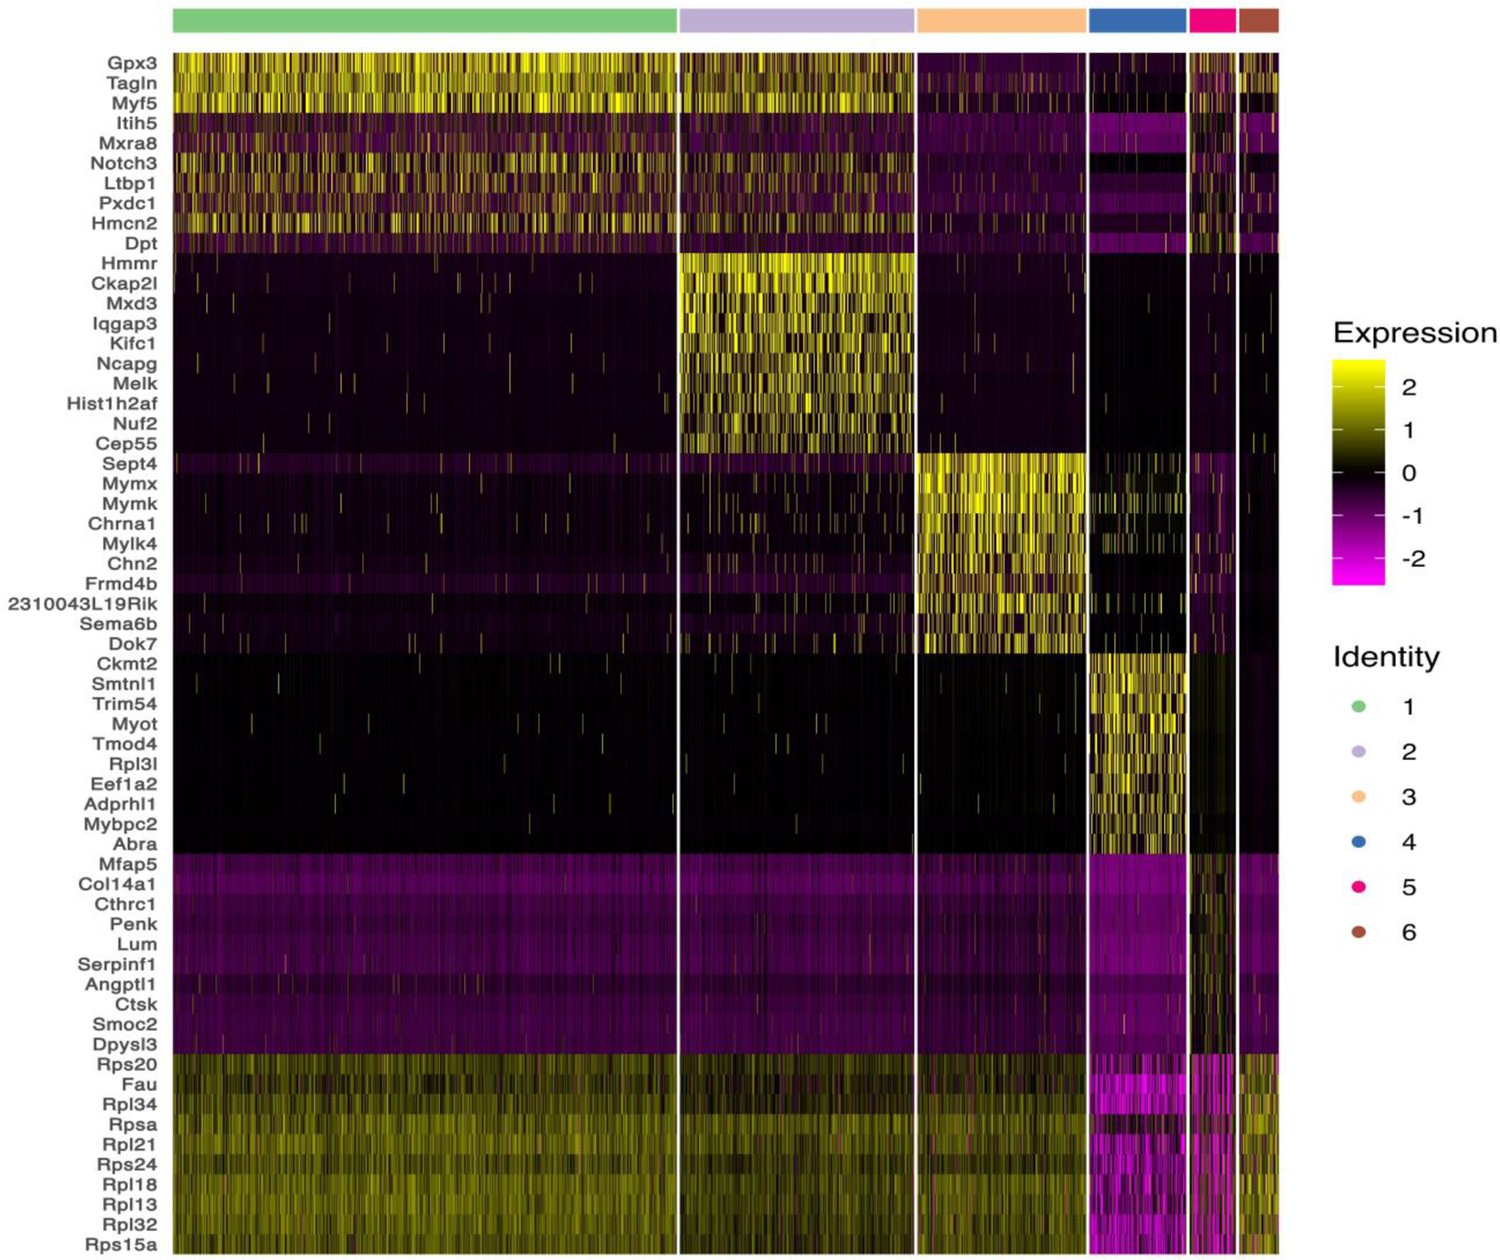
Heatmap showing the top 10 most differently expressed genes between six subclusters of skeletal muscle cells (SKM) cells.
Figure 6
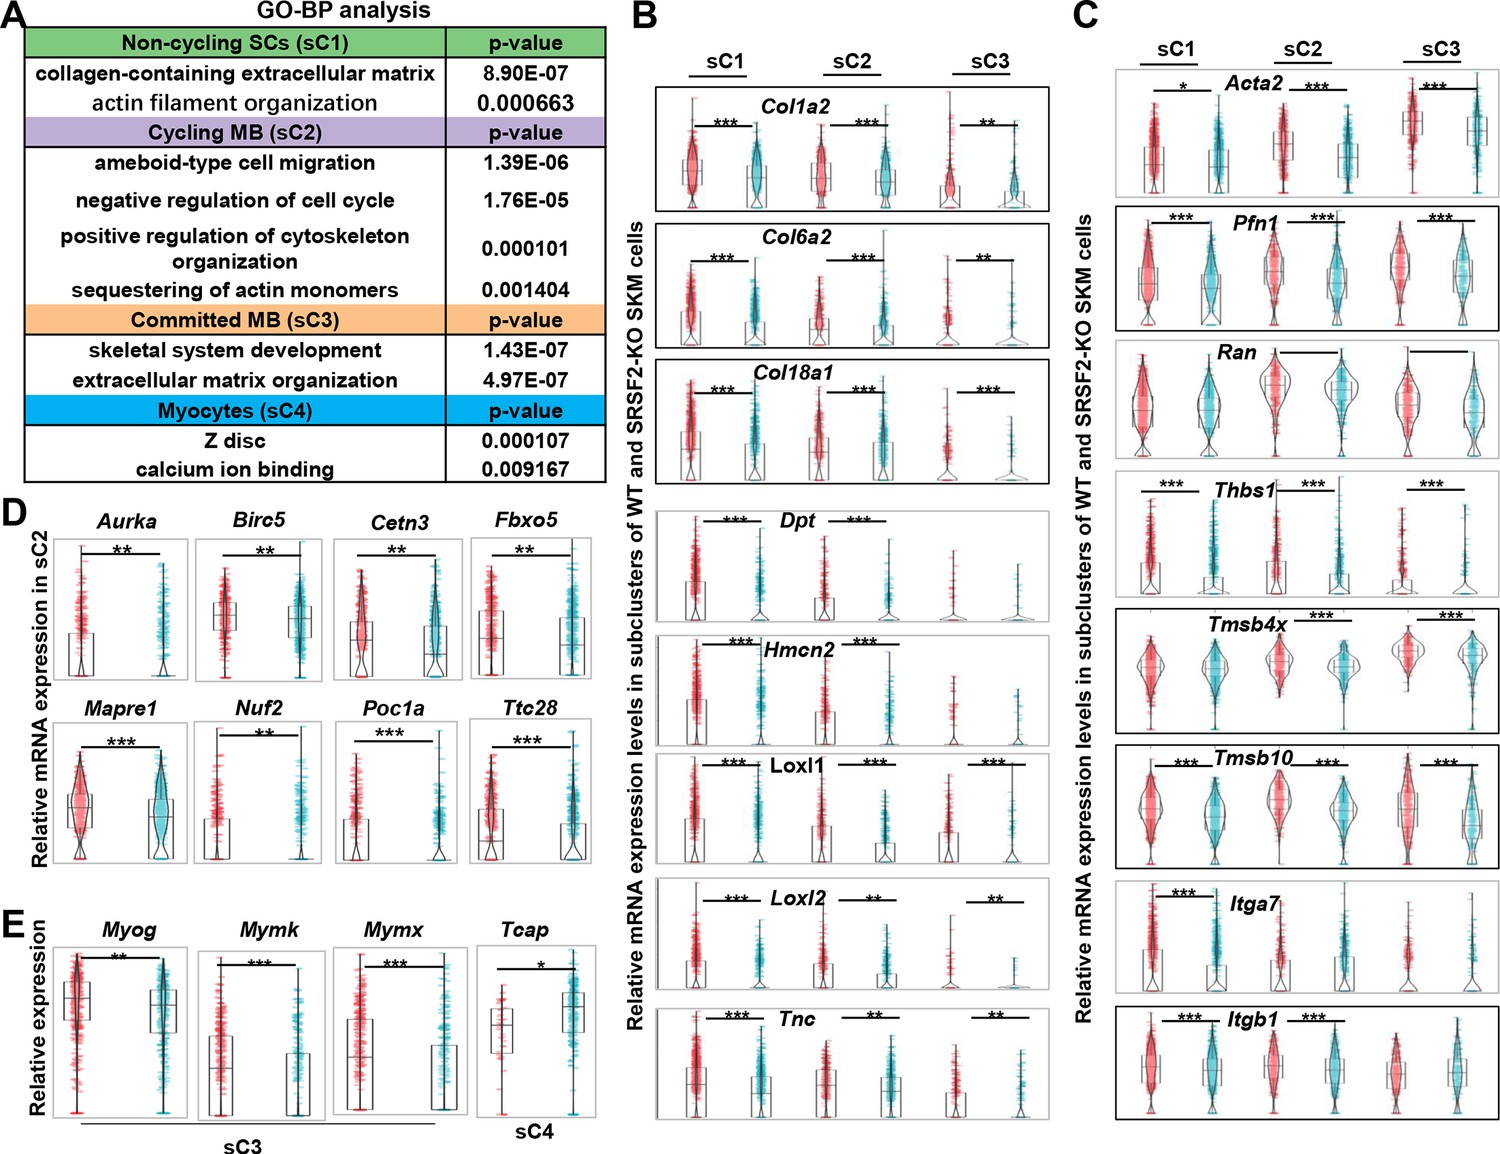
Decreased levels of extracellular matrix (ECM) and cytoskeleton, along with mitosis abnormalities and differentiation defects, were observed in the KO group.
(A) Gene Ontology (GO) analysis of differentially expressed genes (DEGs) within four subclusters of skeletal muscle cells (SKM) cells. (B) Violin plots showing relative expression levels of ECM components between WT and KO subclusters. (C) Violin plots showing relative expression levels of cytoskeleton-related genes between WT and KO subclusters. (D) Violin plots showing relative expression levels of mitosis-related genes between WT and KO sC2 cells. (E) Violin plots showing relative expression levels of differentiation-related genes between WT and KO subclusters.
Figure 7
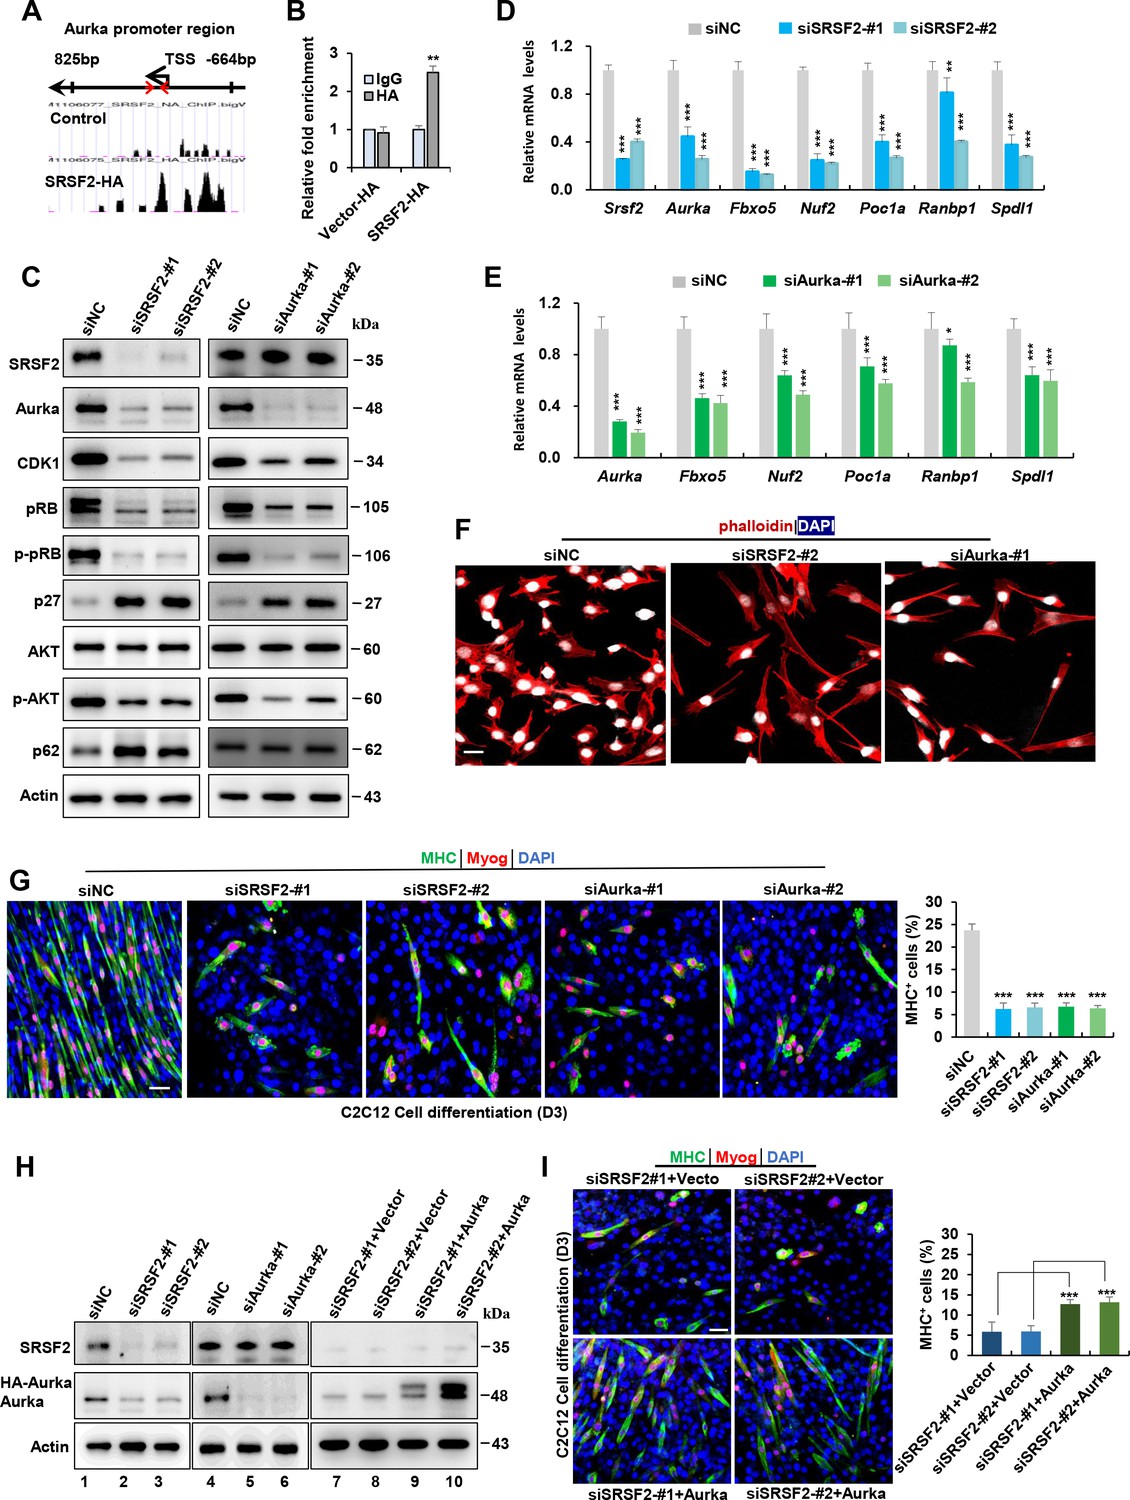
Srsf2 regulates Aurka expression to control mitotic processes and differentiation of C2C12 myoblasts.
(A) UCSC genome browser screenshots illustrate SRSF2 ChIP-seq signals on the Aurka gene. A pair of primers is highlighted by red arrows, indicating their relative positions from the transcription start sites (TSS) within the Aurka promoter region on the top. (B) ChIP-qPCR analysis quantifies Srsf2-bound Aurka promoter regions in C2C12 myoblasts, with relative enrichment folds normalized to the IgG group. (C) Western blot analysis for indicated proteins in C2C12 cells transiently transfected with siRNAs against Srsf2 (siSrsf2-#1, siSrsf2-#2) for 48 hr (left) or against Aurka (siAurka-#1, siAurka-#2) for 48 hr (right). (D) qPCR analysis of spindle formation-related genes in C2C12 cells following Srsf2 knockdown for 48 hr. (E) qPCR analysis of spindle formation-related genes in C2C12 cells with Aurka knockdown for 48 hr. (F) Immunostaining of phalloidin(red) and DAPI (blue) after Srsf2 or Aurka knockdown. Scale bars, 20 μm. (G) Representative confocal images of MHC (green), Myog (red), and DAPI (blue) immunostaining in C2C12 cells. Scale bars, 50 μm. C2C12 cells were transfected with indicated siRNAs, then induced into differentiation for 3 days. Qualification of MHC + cells were shown on the right graphs. (H) Western blot analysis was performed using whole cell extracts isolated from C2C12 cells transfected with indicated siRNAs (lanes 1–6), or with the indicated siRNAs along with either vector plasmid or Aurka plasmid, respectively (lanes 7–10). (I) Representative confocal images of MHC (green), Myog (red), and DAPI (blue) immunostaining in C2C12 cells. Scale bars, 50 μm. C2C12 cells were co-transfected with the indicated siRNAs along with either vector plasmid or Aurka plasmid, respectively, then induced into differentiation for 3 days. Qualification of MHC + cells were shown on the right graphs.
-
Figure 7—source data 1
Original files for the western blotting analysis in Figure 7C (Srsf2, Aurka, CDK1, pRB, p-pRB, p27, AKT, p-AKT, p62, and Actin).
- https://cdn.elifesciences.org/articles/98175/elife-98175-fig7-data1-v1.zip
-
Figure 7—source data 2
PDF containing annotation of original western blots in Figure 7C (Srsf2, Aurka, CDK1, pRB, p-pRB, p27, AKT,p-AKT, p62, and Actin).
- https://cdn.elifesciences.org/articles/98175/elife-98175-fig7-data2-v1.zip
-
Figure 7—source data 3
Original files for the western blotting analysis in Figure 7H (Srsf2, Aurka, and Actin).
- https://cdn.elifesciences.org/articles/98175/elife-98175-fig7-data3-v1.zip
-
Figure 7—source data 4
PDF containing annotation of original western blots in Figure 7H (Srsf2, Aurka, and Actin).
- https://cdn.elifesciences.org/articles/98175/elife-98175-fig7-data4-v1.zip
Figure 8
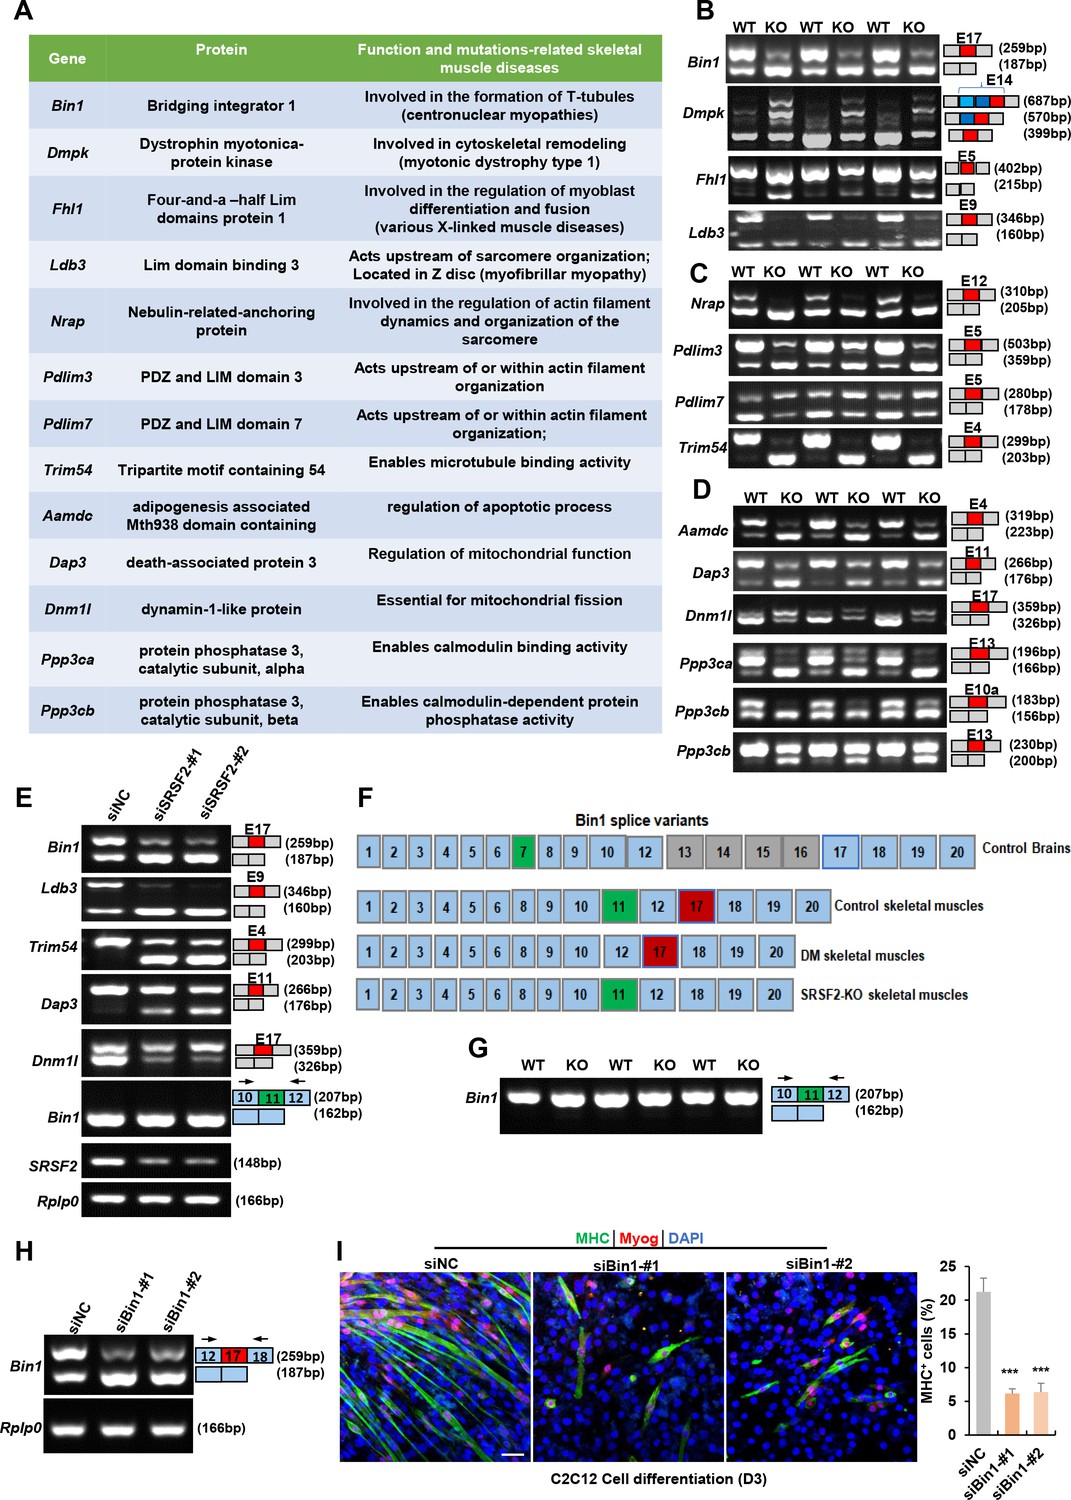
Alternative splicing events affected by Srsf2 during skeletal muscle development.
(A) A table displaying genes alternatively spliced by Srsf2 during skeletal muscle development. (B) RT-PCR analysis of AS events observed in Bin1, Dmpk, Fhl1, and Ldb3 genes due to the absence of Srsf2, using total RNA isolated from three independent wild-type (WT) and KO samples. Alternative exons are highlighted in red with their respective exon number. Note that there were three 3’ alternative sites within exon14 of Dmpk. Srsf2 deficiency resulted in selection of the proximal 3’ site, while the presence of Srsf2 leads to the inclusion of the distal 3’ site. (C) RT-PCR analysis of AS events observed in Nrap, Pdlim3, Pdlim7, and Trim54 genes in three independent WT and KO skeletal muscle samples. (D) RT-PCR analysis of AS events observed in Aamdc, Dap3, Dnm1l, Ppp3ca, and Ppp3cb genes in three independent WT and KO skeletal muscle samples. (E) RT-PCR analysis of AS events observed in indicated targets following knockdown of Srsf2 in C2C12 cells for 48 hr. (F) Diagram of Bin1 splice variants present in both normal and diseased tissues. Note that green, red or gray exons represent alternative exons, while slight blue exons are constitutive. (G) RT-PCR analysis of Bin1 exon 11 inclusion in three independent WT and KO skeletal muscle samples. (H) RT-PCR analysis was conducted to assess the levels of Bin1 exon 17-containing and exon 17-lacking variants after transfection with siBin1-#1 or siBin1-#2 in C2C12 cells for 48 hr. The black arrows indicate primer positions. (I) Representative confocal images of MHC (green), Myog (red), and DAPI (blue) immunostaining in C2C12 cells. Scale bars, 50 μm. C2C12 cells were transfected with siBin1 for 48 hr, then induced into differentiation for 3 days. Quantification of MHC + cells were shown on the right graphs.
-
Figure 8—source data 1
Original files for RT-PCR analysis in Figure 8B (Bin1, Dmpk, Phl1, and Ldb3).
- https://cdn.elifesciences.org/articles/98175/elife-98175-fig8-data1-v1.zip
-
Figure 8—source data 2
PDF containing annotation of original RT-PCR gels in Figure 8B (Bin1, Dmpk, Phl1, and Ldb3).
- https://cdn.elifesciences.org/articles/98175/elife-98175-fig8-data2-v1.zip
-
Figure 8—source data 3
Original files for RT-PCR analysis in Figure 8C (Nrap, Pdlim3, Pdlim7, and Trim54).
- https://cdn.elifesciences.org/articles/98175/elife-98175-fig8-data3-v1.zip
-
Figure 8—source data 4
PDF containing annotation of original RT-PCR gels in Figure 8C (Nrap, Pdlim3, Pdlim7, and Trim54).
- https://cdn.elifesciences.org/articles/98175/elife-98175-fig8-data4-v1.zip
-
Figure 8—source data 5
Original files for RT-PCR analysis in Figure 8D (Aamdc, Dap3, Dnm1l, Ppp3ca, Ppp3cb-E10a, and Ppp3cb-E13).
- https://cdn.elifesciences.org/articles/98175/elife-98175-fig8-data5-v1.zip
-
Figure 8—source data 6
PDF containing annotation of original RT-PCR gels in Figure 8D (Aamdc, Dap3, Dnm1l, Ppp3ca, Ppp3cb-E10a, and Ppp3cb-E13).
- https://cdn.elifesciences.org/articles/98175/elife-98175-fig8-data6-v1.zip
-
Figure 8—source data 7
Original files for RT-PCR analysis in Figure 8E (Bin1-E17, Ldb3, Trim54, Dap3, Dnm1l, Bin1-E11, Srsf2, and Rplp0).
- https://cdn.elifesciences.org/articles/98175/elife-98175-fig8-data7-v1.zip
-
Figure 8—source data 8
PDF containing annotation of original RT-PCR gels in Figure 8E (Bin1-E17, Ldb3, Trim54, Dap3, Dnm1l, Bin1-E11, Srsf2, and Rplp0).
- https://cdn.elifesciences.org/articles/98175/elife-98175-fig8-data8-v1.zip
-
Figure 8—source data 9
Original files for RT-PCR analysis in Figure 8G (Bin1-E11).
- https://cdn.elifesciences.org/articles/98175/elife-98175-fig8-data9-v1.zip
-
Figure 8—source data 10
PDF containing annotation of original RT-PCR gels in Figure 8G (Bin1-E11).
- https://cdn.elifesciences.org/articles/98175/elife-98175-fig8-data10-v1.zip
-
Figure 8—source data 11
Original files for RT-PCR analysis in Figure 8H (Bin1-E17, and Rplp0).
- https://cdn.elifesciences.org/articles/98175/elife-98175-fig8-data11-v1.zip
-
Figure 8—source data 12
PDF containing annotation of original RT-PCR gels in Figure 8H (Bin1-E17, and Rplp0).
- https://cdn.elifesciences.org/articles/98175/elife-98175-fig8-data12-v1.zip
Additional files
-
Supplementary file 1
Antibody information and primer sequences are listed.
(a) Antibodies used in IF, WB, and ChIP analysis. (b) Primer sequences used for RT-PCR. (c) Primer sequence used for qPCR. (d) SiRNA sequence used for RNA interference. (e) Primer sequence used for ChIP-qPCR.
- https://cdn.elifesciences.org/articles/98175/elife-98175-supp1-v1.docx
-
MDAR checklist
- https://cdn.elifesciences.org/articles/98175/elife-98175-mdarchecklist1-v1.docx
Download links
A two-part list of links to download the article, or parts of the article, in various formats.
Downloads (link to download the article as PDF)
Open citations (links to open the citations from this article in various online reference manager services)
Cite this article (links to download the citations from this article in formats compatible with various reference manager tools)
SRSF2 is a key player in orchestrating the directional migration and differentiation of MyoD progenitors during skeletal muscle development
eLife 13:RP98175.
https://doi.org/10.7554/eLife.98175.2


