A Ctnnb1 enhancer transcriptionally regulates Wnt signaling dosage to balance homeostasis and tumorigenesis of intestinal epithelia
- Department of Neurosurgery, Medical Research Institute, Zhongnan Hospital of Wuhan University, Wuhan University, China
- Frontier Science Center of Immunology and Metabolism, Wuhan University, China
- Department of Epidemiology and Biostatistics, School of Public Health, Wuhan University, China
- TaiKang Center for Life and Medical Sciences, Wuhan University, China
- Department of Gastroenterology, Union Hospital, Tongji Medical College, Huazhong University of Science and Technology, China
- College of Life Sciences, Wuhan University, China
- Department of Gastroenterology, Zhongnan Hospital of Wuhan University, China
Figures
Figure 1 with 3 supplements
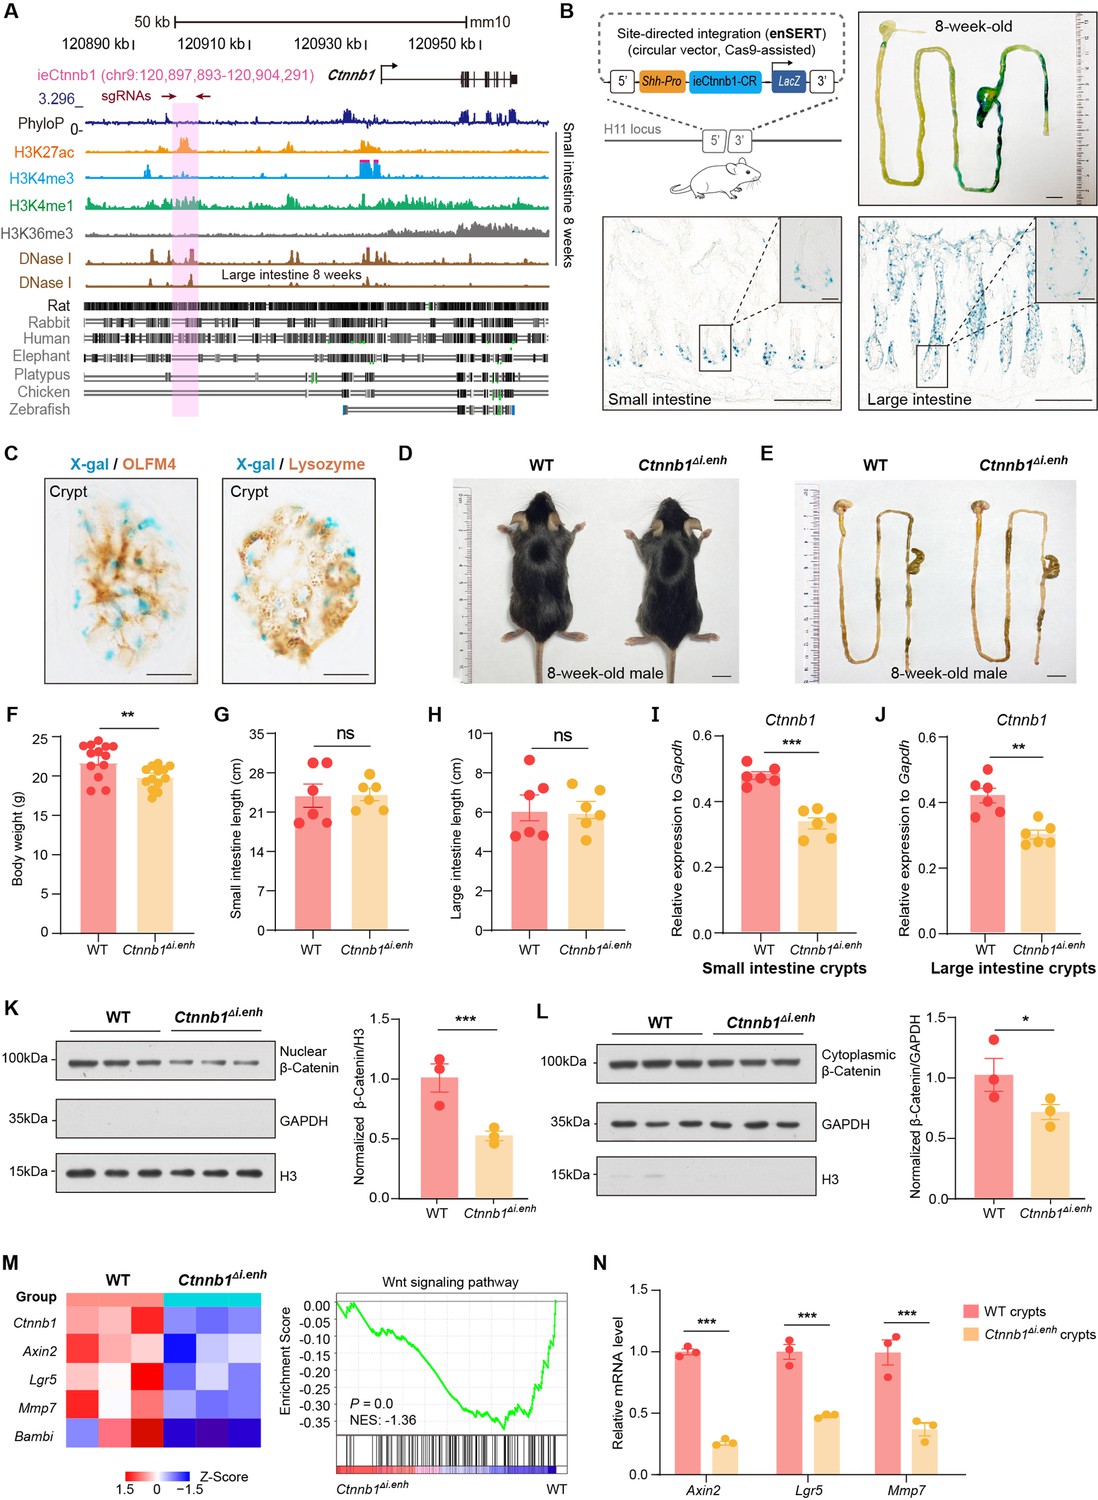
ieCtnnb1 is an intestinal enhancer of Ctnnb1.
(A) Schematic representation of the upstream region of mouse Ctnnb1 gene and the location of ieCtnnb1 (6,399 bp, pink shading), which is marked by H3K27ac and H3K4me1 peaks, and DNase I hypersensitivity in small intestine and large intestine of 8-week-old mice. The sequence conservation of the indicated species is shown at the bottom as vertical lines. Data were obtained from ENCODE. Locations of single-guide RNAs (sgRNAs) for generating ieCtnnb1 knockout mice were marked. (B) Top left: a schematic illustration showing that the knock-in reporter construct carries the Shh promoter, ieCtnnb1 core region sequences (2,153 bp), and the LacZ reporter gene. Top right: X-Gal staining (blue) of the gastrointestinal (GI) tract of an 8-week-old H11i.enh mouse. Bottom: X-Gal staining (blue) of the small intestine (left) and colon (right) of an 8-week-old H11i.enh mouse. Boxed areas were enlarged at top-right corners. (C) Representative images of small intestinal crypts co-labeled by X-Gal with OLFM4 (left), and X-Gal with Lysozyme (right). (D–E) Representative images of whole body (d) and GIs (e) of 8-week-old male wildtype (WT) and Ctnnb1Δi.enh mice. (F) Comparison of the body weight of 8-week-old male WT (n=13) and Ctnnb1Δi.enh (n=13) mice. (G–H) Measurements of small (G) and large (H) intestine length of 8-week-old male WT (n=6) and Ctnnb1Δi.enh (n=6) mice. (I–J) Relative mRNA levels of Ctnnb1 in small (I) and large (J) intestinal crypts of WT (n=6) and Ctnnb1Δi.enh (n=6) mice. (K–L) Left: immunoblotting of nuclear (K) and cytoplasmic (L) β-catenin, GAPDH, and H3 of small intestinal crypts of WT (n=3) and Ctnnb1Δi.enh (n=3) mice. Right: histograms showing protein levels of β-catenin normalized to H3 (K) or GAPDH (L) levels. Values of WT were set as ‘1’. (M) Heatmap of indicated Wnt target genes and gene set enrichment analysis (GSEA) of Wnt signaling pathway according to transcriptome profiles of small intestinal crypts of WT (n=3) and Ctnnb1Δi.enh (n=3) mice. (N) Quantitative reverse transcription PCR (RT-qPCR) showing relative mRNA levels of indicated Wnt target genes (Axin2, Lgr5, and Mmp7) in small intestinal crypts of WT (n=3) and Ctnnb1Δi.enh (n=3) mice. Scale bars, 1 cm (B, top; D and E), 100 μm (B, bottom), 10 μm (B, magnified views; C). Quantification data are shown as means ± SEM, statistical significance was determined using an unpaired two-tailed Student’s t-test (F–L). Quantification data are shown as means ± SD, statistical significance was determined using Multiple t-tests – one per row (N). *p<0.05, **p<0.01, ***p<0.001, and ****p<0.0001. ns, not significant. NES: normalized enrichment score.
-
Figure 1—source data 1
Numerical data for Figure 1F.
- https://cdn.elifesciences.org/articles/98238/elife-98238-fig1-data1-v1.zip
-
Figure 1—source data 2
Numerical data for Figure 1G.
- https://cdn.elifesciences.org/articles/98238/elife-98238-fig1-data2-v1.zip
-
Figure 1—source data 3
Numerical data for Figure 1H.
- https://cdn.elifesciences.org/articles/98238/elife-98238-fig1-data3-v1.zip
-
Figure 1—source data 4
Numerical data for Figure 1I.
- https://cdn.elifesciences.org/articles/98238/elife-98238-fig1-data4-v1.zip
-
Figure 1—source data 5
Numerical data for Figure 1J.
- https://cdn.elifesciences.org/articles/98238/elife-98238-fig1-data5-v1.zip
-
Figure 1—source data 6
Numerical data for Figure 1K.
- https://cdn.elifesciences.org/articles/98238/elife-98238-fig1-data6-v1.zip
-
Figure 1—source data 7
Numerical data for Figure 1L.
- https://cdn.elifesciences.org/articles/98238/elife-98238-fig1-data7-v1.zip
-
Figure 1—source data 8
Numerical data for Figure 1N.
- https://cdn.elifesciences.org/articles/98238/elife-98238-fig1-data8-v1.zip
-
Figure 1—source data 9
Uncropped and labeled gels for Figure 1.
- https://cdn.elifesciences.org/articles/98238/elife-98238-fig1-data9-v1.zip
-
Figure 1—source data 10
Raw unedited gels for Figure 1.
- https://cdn.elifesciences.org/articles/98238/elife-98238-fig1-data10-v1.zip
Figure 1—figure supplement 1
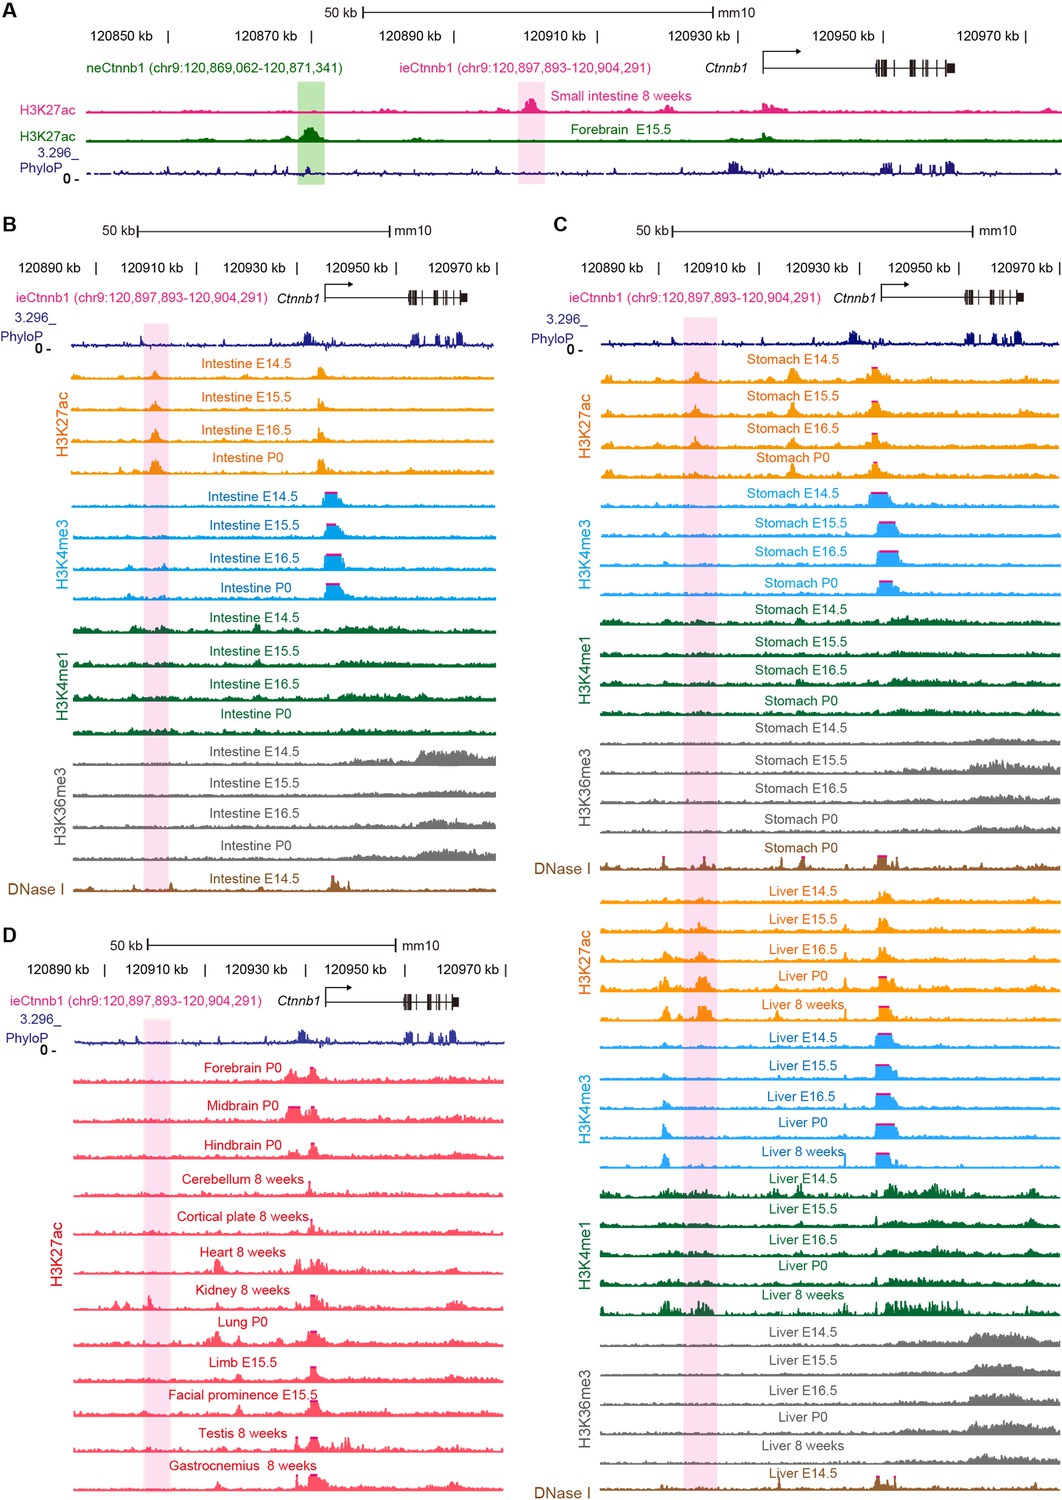
ieCtnnb1 is a putative intestinal enhancer upstream of Ctnnb1.
(A) Schematic representation of the upstream region of mouse Ctnnb1 gene and locations of enhancer neCtnnb1 (green shading) and putative enhancer ieCtnnb1 (pink shading). Data were obtained from ENCODE. (B–C) Enrichment of indicated signals in developing intestine (B), stomach, and liver (C) were shown. Data were obtained from ENCODE. (D) Enrichment of H3K27ac chromatin immunoprecipitation sequencing (ChIP-seq) signals in indicated mouse tissues. Data were obtained from ENCODE.
Figure 1—figure supplement 2
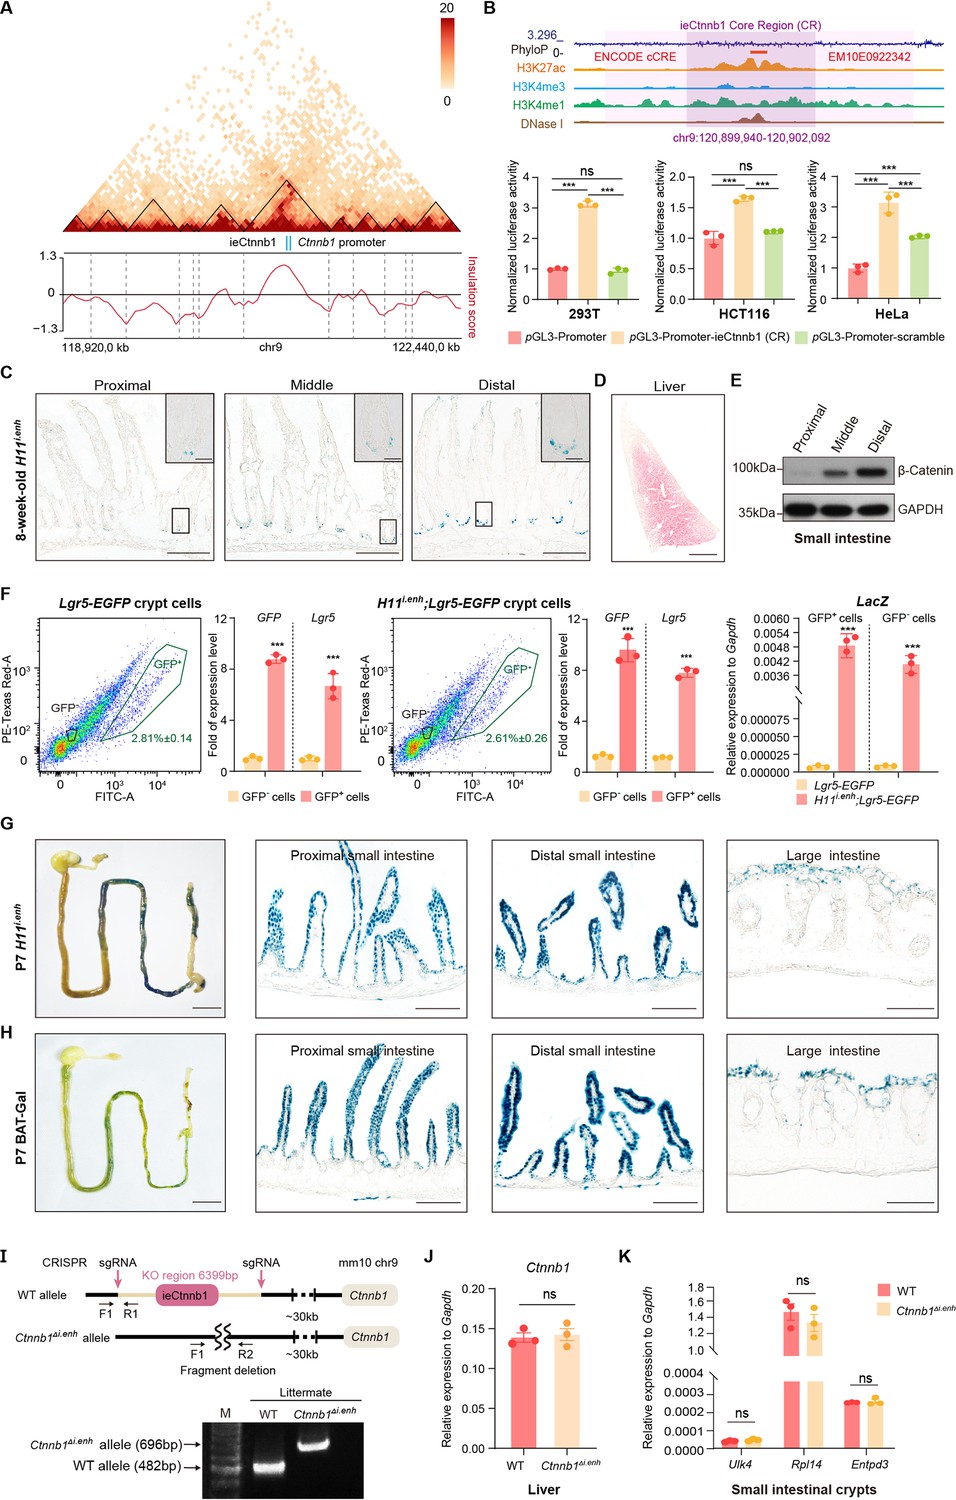
ieCtnnb1 is predominantly active in developing intestine.
(A) Hi-C data of BALB/c mouse large intestine at indicated locus. Boundaries of topologically associating domains (TADs) and locations of Ctnnb1 promoter and ieCtnnb1 (blue bars) were marked. (B) Top: schematic representation of ieCtnnb1 core region (2,153 bp, dark purple shading). The location of an annotated ENCODE cCRE was indicated. Bottom: HEK293T, HCT116, and HeLa cells were transfected with indicated plasmids for 48 hr for luciferase reporter assay. (C) Representative images showing X-Gal staining of proximal, middle, and distal small intestinal sections of 8-week-old H11i.enh mice (blue). (D) Representative image showing X-Gal and eosin staining of the liver of 8-week-old H11i.enh mice (X-Gal: blue, eosin: red). (E) Immunoblotting of indicated proteins derived from proximal, middle, and distal small intestine tissues of WT C57/BL6 mice. (F) Flow cytometry assays to isolate GFP+ and GFP- cells from small intestinal crypts of Lgr5-EGFP (n=3) and Ctnnb1Δi.enh;Lgr5-EGFP (n=3) mice. Quantitative reverse transcription PCR (RT-qPCR) showing relative mRNA levels of GFP, Lgr5, and LacZ in aforementioned GFP+ and GFP- cells. (G–H) Representative images showing X-Gal staining of gastrointestinal tracts, and sections of proximal and distal small intestine, and large intestine of P7 H11i.enh (G) mice and P7 BAT-Gal mice (H). (I) Generation and genotyping of Ctnnb1Δi.enh mice. WT, wild-type; sgRNA, single-guide RNA. (J) Relative mRNA levels of Ctnnb1 in the liver of WT (n=3) and Ctnnb1Δi.enh (n=3) mice. (K) Relative mRNA levels of genes (Ulk4, Rpl14, and Entpd3) located in the same TAD as Ctnnb1 in small intestinal crypts of WT (n=3) and Ctnnb1Δi.enh (n=3) mice. Scale bars, 1 cm (whole mount in F and G), 100 μm (C, D, F, and G), 10 μm (magnified insets in C). Quantification data are shown as means ± SEM. Statistical significance was determined using two-way ANOVA (B) and an unpaired two-tailed Student’s t-test (F, J, and K). *p<0.05, **p<0.01, ***p<0.001, and ****p<0.0001. ns, not significant.
-
Figure 1—figure supplement 2—source data 1
Numerical data for Figure 1—figure supplement 2B.
- https://cdn.elifesciences.org/articles/98238/elife-98238-fig1-figsupp2-data1-v1.zip
-
Figure 1—figure supplement 2—source data 2
Numerical data for Figure 1—figure supplement 2F.
- https://cdn.elifesciences.org/articles/98238/elife-98238-fig1-figsupp2-data2-v1.zip
-
Figure 1—figure supplement 2—source data 3
Numerical data for Figure 1—figure supplement 2J.
- https://cdn.elifesciences.org/articles/98238/elife-98238-fig1-figsupp2-data3-v1.zip
-
Figure 1—figure supplement 2—source data 4
Numerical data for Figure 1—figure supplement 2K.
- https://cdn.elifesciences.org/articles/98238/elife-98238-fig1-figsupp2-data4-v1.zip
-
Figure 1—figure supplement 2—source data 5
Uncropped and labeled gels for Figure 1—figure supplement 2.
- https://cdn.elifesciences.org/articles/98238/elife-98238-fig1-figsupp2-data5-v1.zip
-
Figure 1—figure supplement 2—source data 6
Raw unedited gels for Figure 1—figure supplement 2.
- https://cdn.elifesciences.org/articles/98238/elife-98238-fig1-figsupp2-data6-v1.zip
Figure 1—figure supplement 3
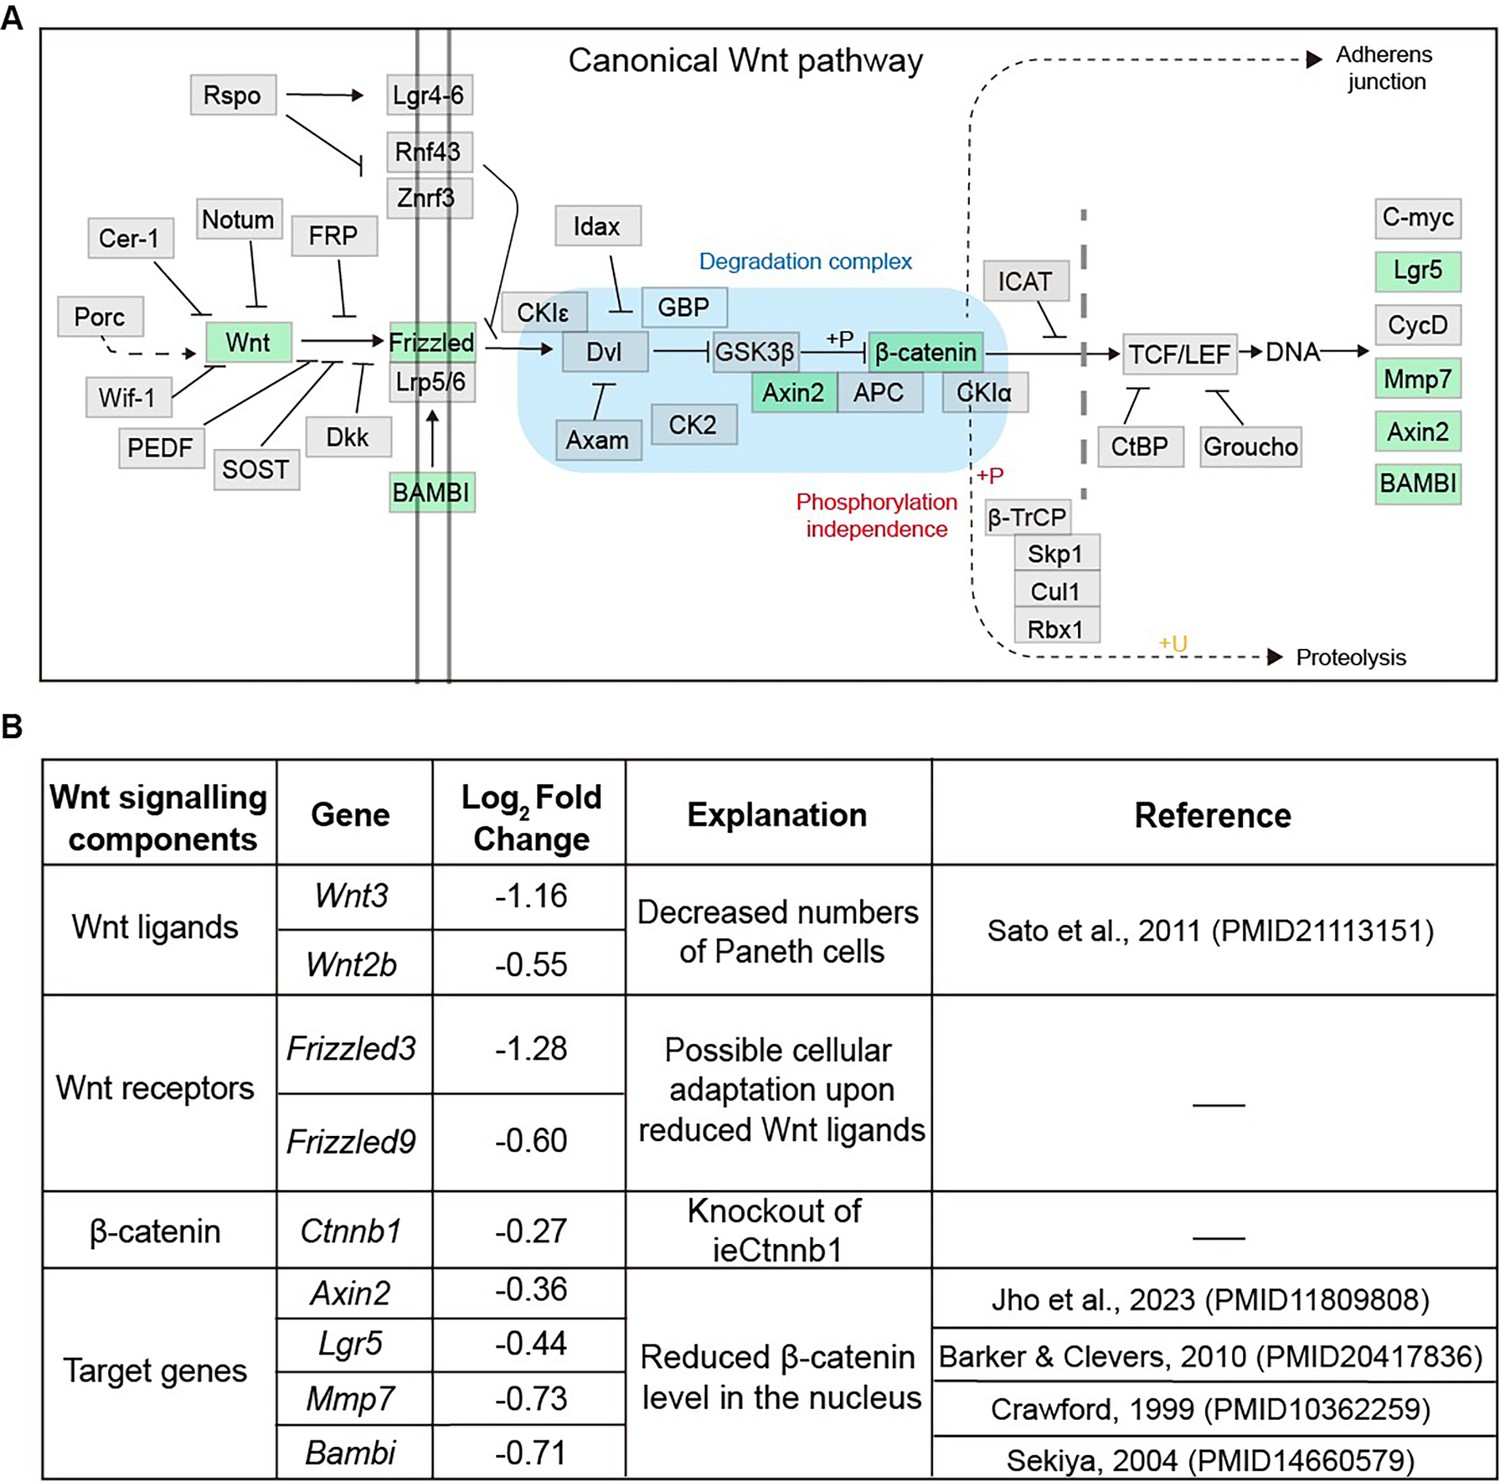
The list of Wnt signaling pathway components downregulated in Ctnnb1Δi.enh crypts.
(A) A schematic diagram highlighting downregulated components of the Wnt signaling pathway in the crypts of the Ctnnb1Δi.enh small intestine. (B) A table showing Wnt signaling pathway components downregulated in Ctnnb1Δi.enh crypts.
Figure 2 with 1 supplement
ieCtnnb1 knockout altered cellular composition and expression profiles of small intestinal crypts.
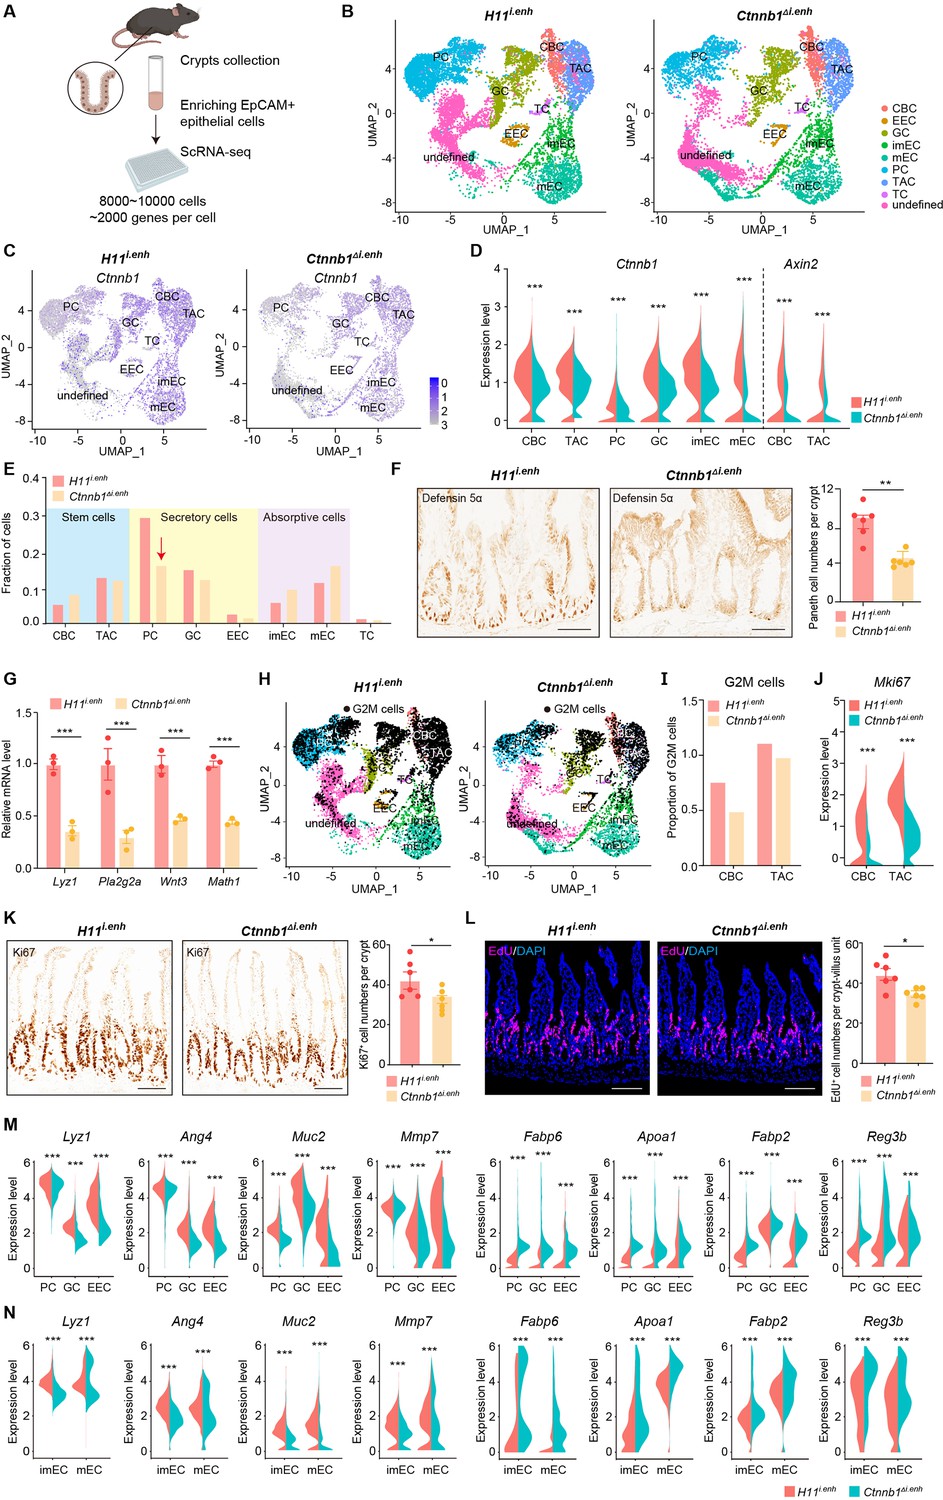
(A) Schematic illustration of single-cell sequencing. Crypts were extracted from small intestines followed by fluorescence activated cell sorting (FACS) to enrich EpCAM+ DAPI- epithelial cells. Cells of two 10-week-old female mice for each genotype were pooled together to perform single-cell transcriptome analyses. (B) Uniform Manifold Approximation and Projection (UMAP) were used to visualize the clustering of 11,824 single cells from H11i.enh mice and 8,094 single cells from Ctnnb1Δi.enh mice. Cell types were assigned according to expressions of marker genes. CBC, crypt base columnar cell; TAC, transit-amplifying cell; EEC, enteroendocrine cell; imEC, immature enterocytes; mEC, mature enterocytes; GC, goblet cell; PC, Paneth cell; TC, tuft cell. (C) Expression and distribution of Ctnnb1 in small intestinal crypt cells of H11i.enh and Ctnnb1Δi.enh mice. (D) Violin plots showing the expression of Ctnnb1 in CBC, TAC, PC, GC, imEC, mEC; and the expression of Axin2 in CBC and TAC, of H11i.enh and Ctnnb1Δi.enh mice. (E) Comparison of the proportion of indicated small intestinal crypt cell types in H11i.enh and Ctnnb1Δi.enh mice. (F) Immunohistochemistry (left and middle) and quantification (right) of PCs in small intestines of H11i.enh (n=6) and Ctnnb1Δi.enh (n=6) mice. (G) Quantitative reverse transcription PCR (RT-qPCR) showing relative mRNA levels of PC marker genes (Lyz1, Pla2g2a, Wnt3, Math1) in small intestinal crypts of H11i.enh (n=3) and Ctnnb1Δi.enh (n=3) mice. (H) Distribution of G2M cells in H11i.enh and Ctnnb1Δi.enh small intestinal crypts, based on the expression of cell cycle marker gene Mki67. (I) Comparison of the proportion of G2M cells in CBC and TAC of H11i.enh and Ctnnb1Δi.enh small intestinal crypts. (J) Violin plots showing the expression of Mki67 in CBC and TAC of H11i.enh and Ctnnb1Δi.enh small intestinal crypts. (K) Immunohistochemistry (left and middle) and quantification (right) of Ki67+ cells in small intestines of H11i.enh (n=6) and Ctnnb1Δi.enh (n=6) mice. (L) Immunofluorescence (left and middle) and quantification (right) of EdU+ cells (red) in small intestines of H11i.enh (n=6) and Ctnnb1Δi.enh (n=6) mice after 4 hr EdU injection. Nuclei were labeled with DAPI (blue). (M–N) Violin plots showing expressions of marker genes for secretory cells (Lyz1, Ang4, Muc2, Mmp7) and absorptive cells (Fabp6, Apoa1, Fabp2, Reg3b) in secretory(M) and absorptive lineages (N) of H11i.enh and Ctnnb1Δi.enh small intestinal crypts. Scale bars, 50 μm (F, K, and L). Quantification data are shown as means ± SEM, statistical significance was determined using an unpaired two-tailed Student’s t-test (D, F, J, K, L, M, and N). Quantification data are shown as means ± SD, statistical significance was determined using Multiple t-tests – one per row (G). *p<0.05, **p<0.01, ***p<0.001, and ****p<0.0001. ns, not significant.
-
Figure 2—source data 1
Numerical data for Figure 2E.
- https://cdn.elifesciences.org/articles/98238/elife-98238-fig2-data1-v1.zip
-
Figure 2—source data 2
Numerical data for Figure 2F.
- https://cdn.elifesciences.org/articles/98238/elife-98238-fig2-data2-v1.zip
-
Figure 2—source data 3
Numerical data for Figure 2G.
- https://cdn.elifesciences.org/articles/98238/elife-98238-fig2-data3-v1.zip
-
Figure 2—source data 4
Numerical data for Figure 2I.
- https://cdn.elifesciences.org/articles/98238/elife-98238-fig2-data4-v1.zip
-
Figure 2—source data 5
Numerical data for Figure 2K.
- https://cdn.elifesciences.org/articles/98238/elife-98238-fig2-data5-v1.zip
-
Figure 2—source data 6
Numerical data for Figure 2L.
- https://cdn.elifesciences.org/articles/98238/elife-98238-fig2-data6-v1.zip
Figure 2—figure supplement 1
Single-cell survey of small intestinal crypt cells upon ieCtnnb1 knockout.
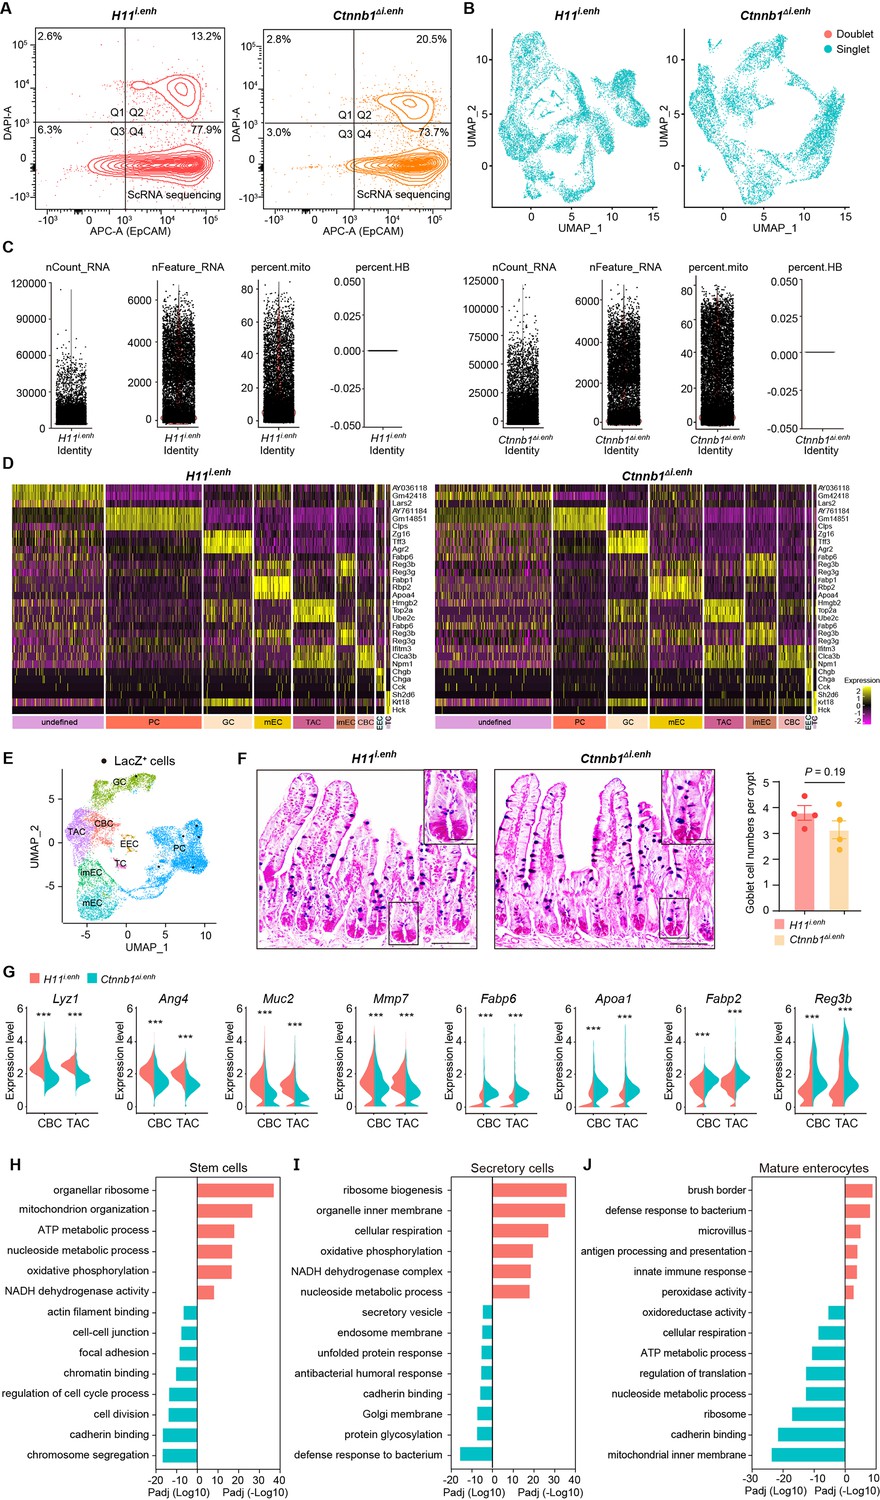
(A) Flow cytometry assays for isolating EpCAM+ DAPI- epithelial cells from H11i.enh (n=2) and Ctnnb1Δi.enh (n=2) small intestinal crypts. (B) Results of cell filtration using DoubletFinder. 1,294 doublets of 11,824 cells from H11i.enh crypts and 567 doublets of 8,094 cells from Ctnnb1Δi.enh crypts were identified (blue dots: singlets, red dots: doublets). (C) Results of cell filtration using Seurat. Cells with more than 30% of reads derived from mitochondrial genes are considered dead and removed from the analysis. (D) Cell-type-specific signatures. Heatmap showing relative expression levels (row-wise Z scores) of genes (rows) in cell-type-specific signatures. (E) Uniform Manifold Approximation and Projection (UMAP) visualizing LacZ+ single cells (black dots) of H11i.enh small intestinal crypts (n=4 mice). (F) Alcian Blue PAS staining and quantification of goblet cells in the small intestine of H11i.enh (n=6) and Ctnnb1Δi.enh (n=6) mice. (G) Violin plots showing expressions of marker genes for secretory cells (Lyz1, Ang4, Muc2, Mmp7) and absorptive cells (Fabp6, Apoa1, Fabp2, Reg3b) in H11i.enh and Ctnnb1Δi.enh crypt base columnar (CBCs) and transit-amplifying cells (TACs). (H–J) Gene ontology (GO) analysis of differential genes in stem cell lineage (H), secretory lineage (I), and mature enterocytes (J) of H11i.enh and Ctnnb1Δi.enh crypts. Scale bars, 50 μm (E), 10 μm (magnified views in E). Quantification data are shown as means ± SEM, statistical significance was determined using an unpaired two-tailed Student’s t-test (F and G). *p<0.05, **p<0.01, ***p<0.001, and ****p<0.0001. ns, not significant.
-
Figure 2—figure supplement 1—source data 1
Numerical data for Figure 2—figure supplement 1F.
- https://cdn.elifesciences.org/articles/98238/elife-98238-fig2-figsupp1-data1-v1.zip
Figure 3 with 1 supplement
Knocking out ieCtnnb1 inhibits tumorigenesis of colorectal cancer.
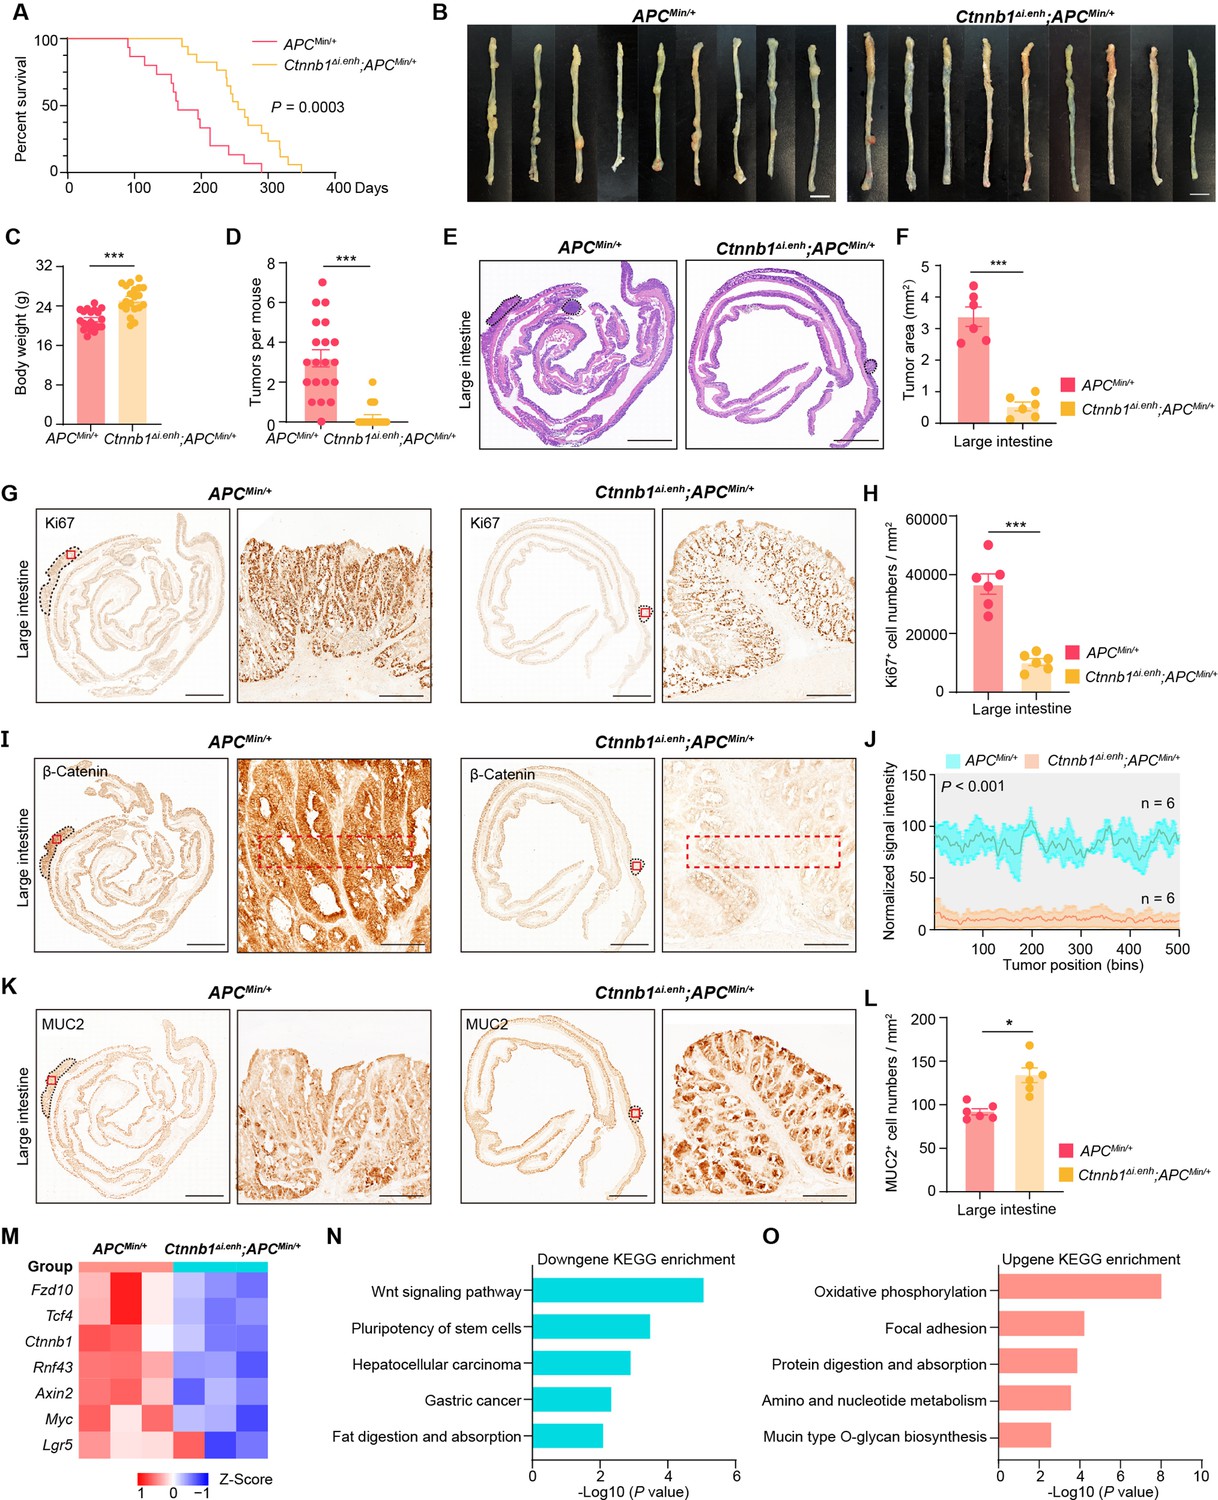
(A) Survival of ApcMin/+ (n=15) and Ctnnb1Δi.enh;ApcMin/+ (n=17) mice. (B) Colon images of 5-month-old ApcMin/+ (n=9) and Ctnnb1Δi.enh;ApcMin/+ (n=9) mice. (C) Weight statistics of 5-month-old ApcMin/+ (n=20) and Ctnnb1Δi.enh;ApcMin/+ (n=20) mice. (D) The statistical analysis of tumor counts in colons of 5-month-old ApcMin/+ (n=9) and Ctnnb1Δi.enh;ApcMin/+ (n=9) mice. (E) Representative H&E staining images of colon sections of 5-month-old ApcMin/+ and Ctnnb1Δi.enh;ApcMin/+ mice. (F) The statistical analysis of colon tumor area in 5-month-old ApcMin/+ (n=6) and Ctnnb1Δi.enh;ApcMin/+ (n=6) mice. (G–H) Immunohistochemistry (G) and quantification (H) of Ki67+ cells in colon tumors of 5-month-old ApcMin/+ (n=6) and Ctnnb1Δi.enh;ApcMin/+ (n=6) mice. (I–J) Immunohistochemistry (I) and signal intensity statistics (J, red dashed boxes of I) of β-catenin in colon tumors of 5-month-old ApcMin/+ (n=6) and Ctnnb1Δi.enh;ApcMin/+ (n=6) mice. (K–L) Immunohistochemistry (K) and quantification (L) of MUC2+ cells in colon tumors of 5-month-old ApcMin/+ (n=6) and Ctnnb1Δi.enh;ApcMin/+ (n=6) mice. (M) The heatmap showing relative expressions of Wnt signaling pathway genes of colon tumors from 5-month-old ApcMin/+ (n=3) and Ctnnb1Δi.enh;ApcMin/+ (n=3) mice. (N–O) KEGG analyses of downregulated (N) and upregulated (O) genes in colon tumors of 5-month-old ApcMin/+ (n=3) and Ctnnb1Δi.enh;ApcMin/+ (n=3) mice. Scale bars, 1 cm (B), 4 mm (E, G, I, and K), 200 μm (magnified views in G and K), 100 μm (magnified views in I). Quantification data are shown as means ± SEM, statistical significance was determined using an unpaired two-tailed Student’s t-test (C, D, F, H, J, and L) or log-rank analysis (A). *p<0.05, **p<0.01, ***p<0.001, and ****p<0.0001. ns, not significant.
-
Figure 3—source data 1
Numerical data for Figure 3A.
- https://cdn.elifesciences.org/articles/98238/elife-98238-fig3-data1-v1.zip
-
Figure 3—source data 2
Numerical data for Figure 3C.
- https://cdn.elifesciences.org/articles/98238/elife-98238-fig3-data2-v1.zip
-
Figure 3—source data 3
Numerical data for Figure 3D.
- https://cdn.elifesciences.org/articles/98238/elife-98238-fig3-data3-v1.zip
-
Figure 3—source data 4
Numerical data for Figure 3F.
- https://cdn.elifesciences.org/articles/98238/elife-98238-fig3-data4-v1.zip
-
Figure 3—source data 5
Numerical data for Figure 3H.
- https://cdn.elifesciences.org/articles/98238/elife-98238-fig3-data5-v1.zip
-
Figure 3—source data 6
Numerical data for Figure 3L.
- https://cdn.elifesciences.org/articles/98238/elife-98238-fig3-data6-v1.zip
Figure 3—figure supplement 1
Knocking out ieCtnnb1 inhibits tumorigenesis of small intestine.
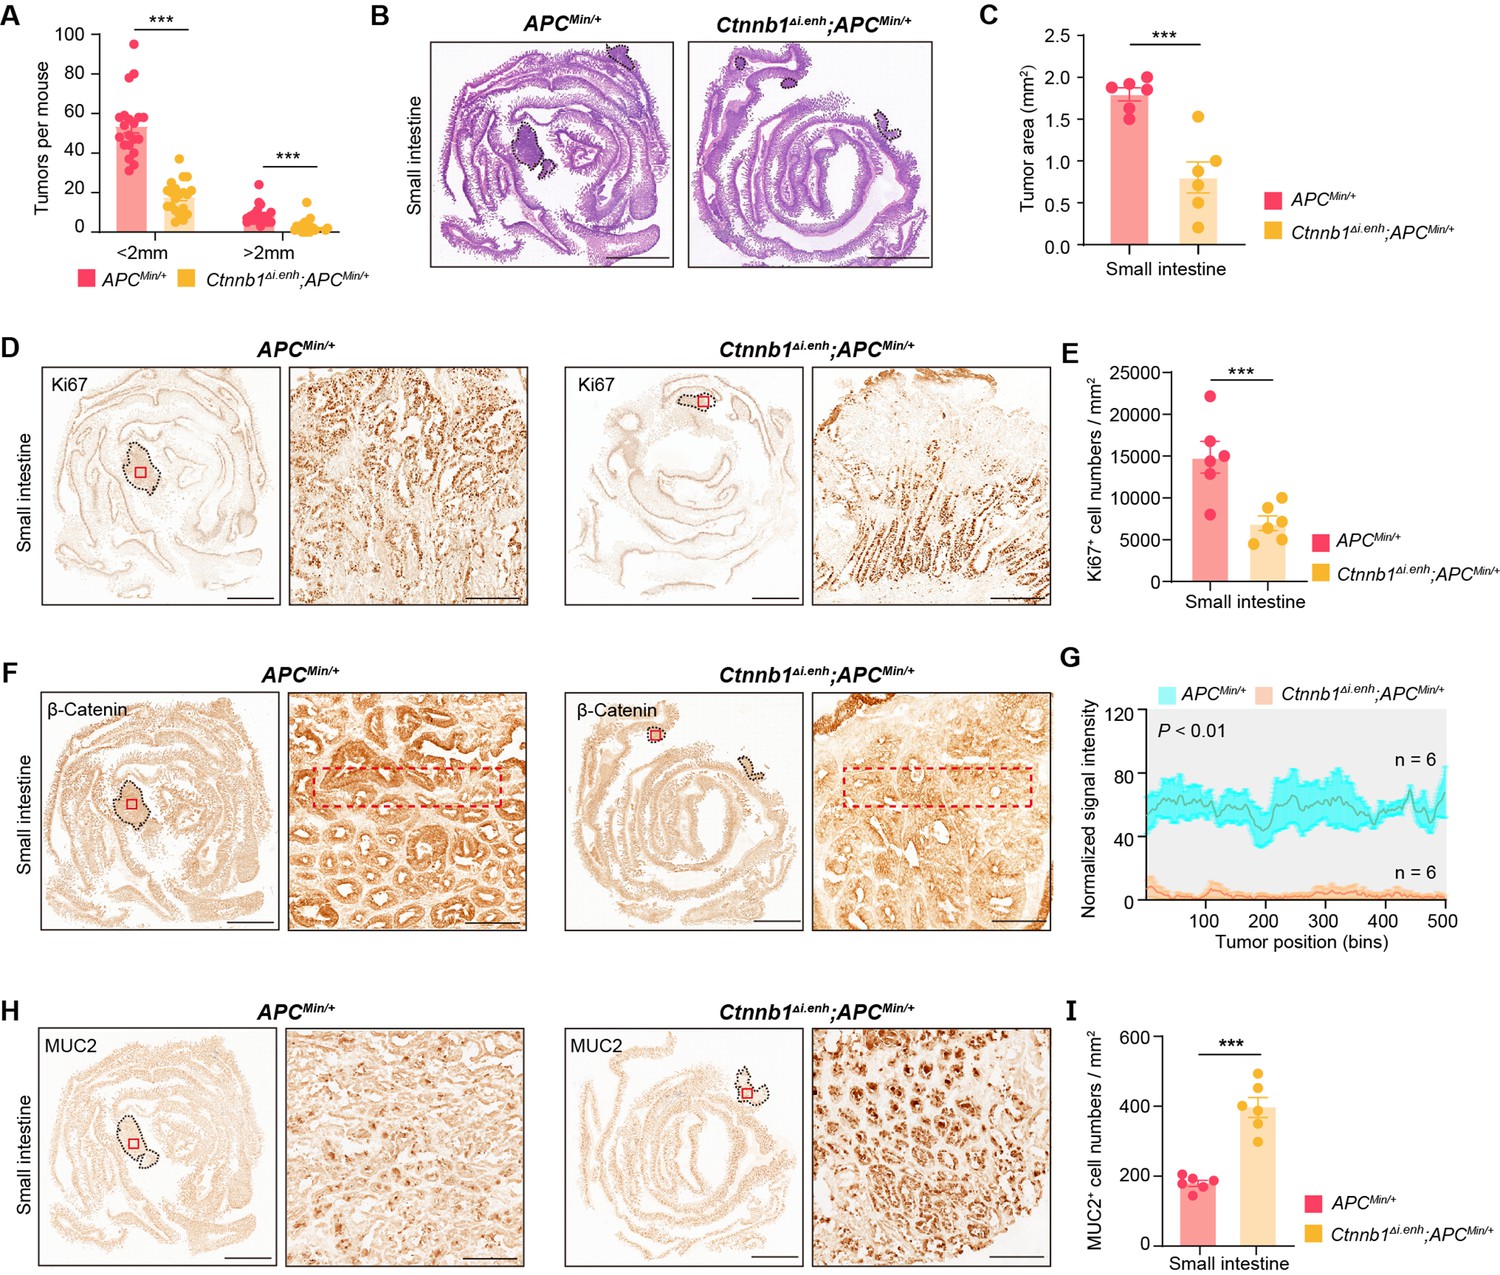
(A) Statistical analyses of tumor counts in small intestines of 5-month-old ApcMin/+ (n=20) and Ctnnb1Δi.enh;ApcMin/+ (n=20) mice. (B) Representative H&E staining images of small intestine sections of 5-month-old ApcMin/+ and Ctnnb1Δi.enh;ApcMin/+ mice. (C) The statistical analysis of small intestinal tumor area in 5-month-old ApcMin/+ (n=6) and Ctnnb1Δi.enh;ApcMin/+ (n=6) mice. (D–E) Immunohistochemistry (D) and quantification (E) of Ki67+ cells in small intestinal tumors of 5-month-old ApcMin/+ (n=6) and Ctnnb1Δi.enh;ApcMin/+ (n=6) mice. (F–G) Immunohistochemistry (F) and signal intensity statistics (G, red dashed boxes of F) of β-catenin in small intestinal tumors of 5-month-old ApcMin/+ (n=6) and Ctnnb1Δi.enh;ApcMin/+ (n=6) mice. (H–I) Immunohistochemistry (H) and quantification (I) of MUC2+ cells in small intestinal tumors of 5-month-old ApcMin/+ (n=6) and Ctnnb1Δi.enh;ApcMin/+ (n=6) mice. Scale bars, 4 mm (B, D, F, and H), 200 μm (magnified views in D and H), 100 μm (magnified views in F). Quantification data are shown as means ± SEM, statistical significance was determined using an unpaired two-tailed Student’s t-test (C, E, G, and I) or Multiple t-tests – one per row (A). *p<0.05, **p<0.01, ***p<0.001, and ****p<0.0001. ns, not significant.
-
Figure 3—figure supplement 1—source data 1
Numerical data for Figure 3—figure supplement 1A.
- https://cdn.elifesciences.org/articles/98238/elife-98238-fig3-figsupp1-data1-v1.zip
-
Figure 3—figure supplement 1—source data 2
Numerical data for Figure 3—figure supplement 1C.
- https://cdn.elifesciences.org/articles/98238/elife-98238-fig3-figsupp1-data2-v1.zip
-
Figure 3—figure supplement 1—source data 3
Numerical data for Figure 3—figure supplement 1E.
- https://cdn.elifesciences.org/articles/98238/elife-98238-fig3-figsupp1-data3-v1.zip
-
Figure 3—figure supplement 1—source data 4
Numerical data for Figure 3—figure supplement 1I.
- https://cdn.elifesciences.org/articles/98238/elife-98238-fig3-figsupp1-data4-v1.zip
Figure 4 with 1 supplement
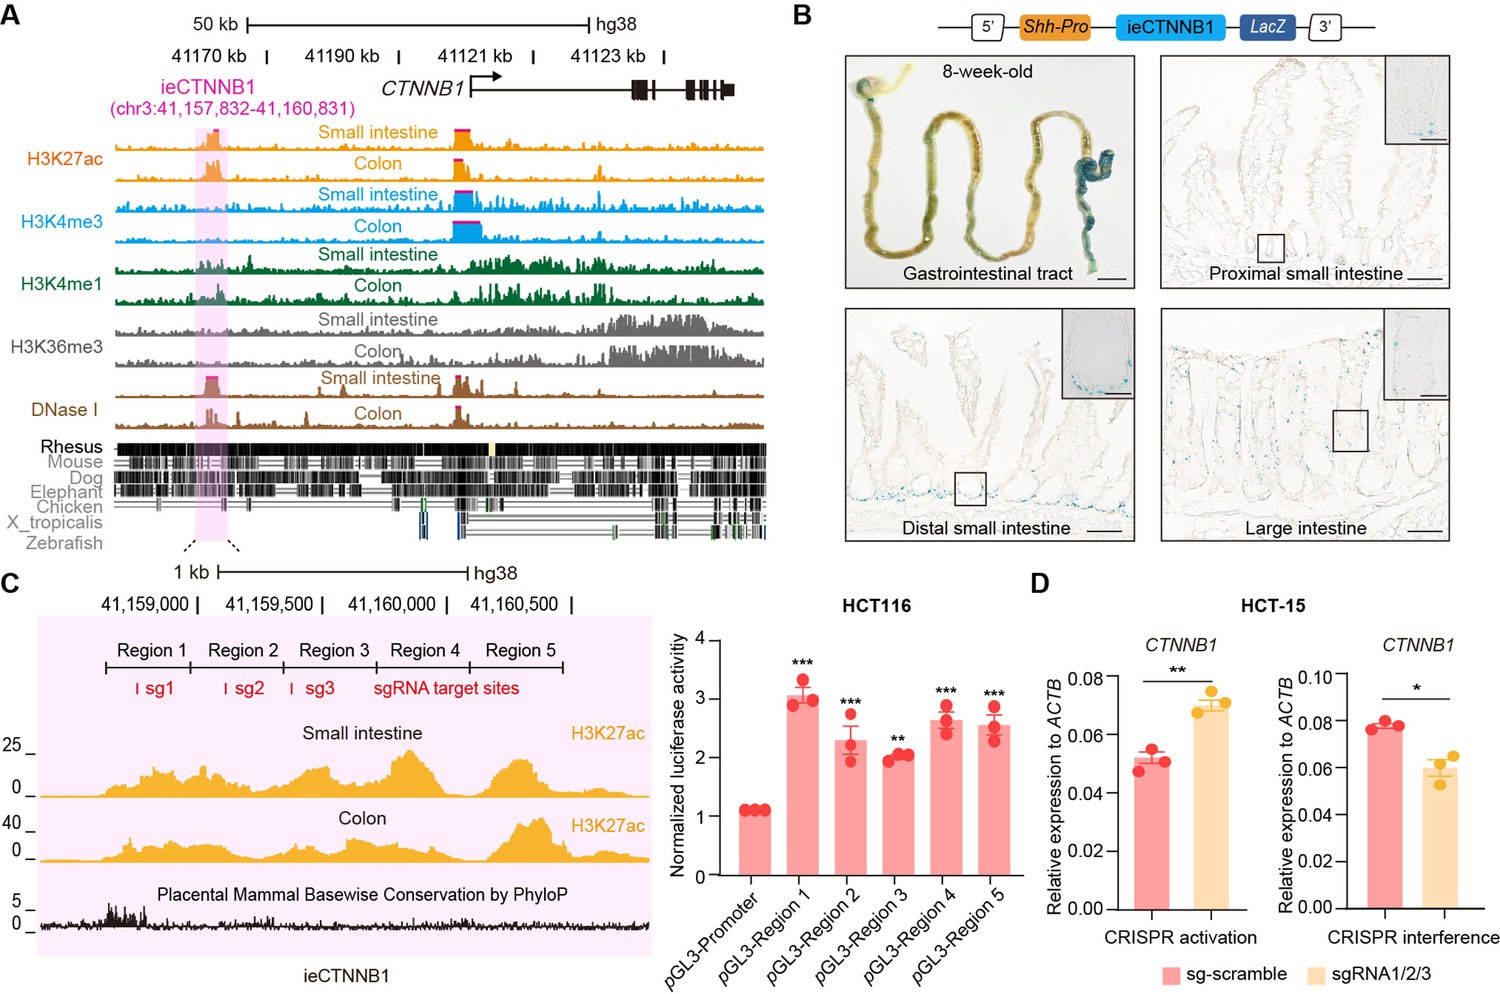
ieCTNNB1 is the intestinal enhancer of human CTNNB1.
(A) Schematic representation of human CTNNB1 gene and the location of ieCTNNB1 (3,000 bp, pink shading), which is marked by H3K27ac and H3K4me1 peaks, and DNaseI hypersensitivity in human small intestine (30-year-old female) and colon (34-year-old male). Data were obtained from ENCODE. (B) Top: a schematic illustration showing that the knock-in construct containing the Shh promoter, ieCTNNB1 sequences (3,000 bp), and the LacZ reporter gene. Bottom: X-Gal staining (blue) of the gastrointestinal tract, and sections of the proximal small intestine, distal small intestine, and large intestine in 8-week-old H11hi.enh mice. (C) Left: ieCTNNB1 is marked by enrichment of H3K27ac in human small intestine (30-year-old female) and colon (34-year-old male). Data were obtained from ENCODE. Locations of single-guide RNA (sgRNA) target sites were indicated. Five subregions of ieCTNNB1 were shown. Right: luciferase reporter assay in HCT116 cells transfected with indicated plasmids for 48 hr. (D) Quantitative reverse transcription PCR (RT-qPCR) showing relative mRNA levels of CTNNB1 in HCT-15 cells transfected with indicated CRISPR activation or CRISPR interference vectors for 48 hr. Scale bars, 1 cm (whole mount in B), 100 μm (sections in B), 10 μm (magnified views in B). Quantification data are shown as means ± SEM, statistical significance was determined using one-way ANOVA (C) and an unpaired two-tailed Student’s t-test (D). *p<0.05, **p<0.01, ***p<0.001, and ****p<0.0001. ns, not significant.
-
Figure 4—source data 1
Numerical data for Figure 4C.
- https://cdn.elifesciences.org/articles/98238/elife-98238-fig4-data1-v1.zip
-
Figure 4—source data 2
Numerical data for Figure 4D.
- https://cdn.elifesciences.org/articles/98238/elife-98238-fig4-data2-v1.zip
Figure 4—figure supplement 1
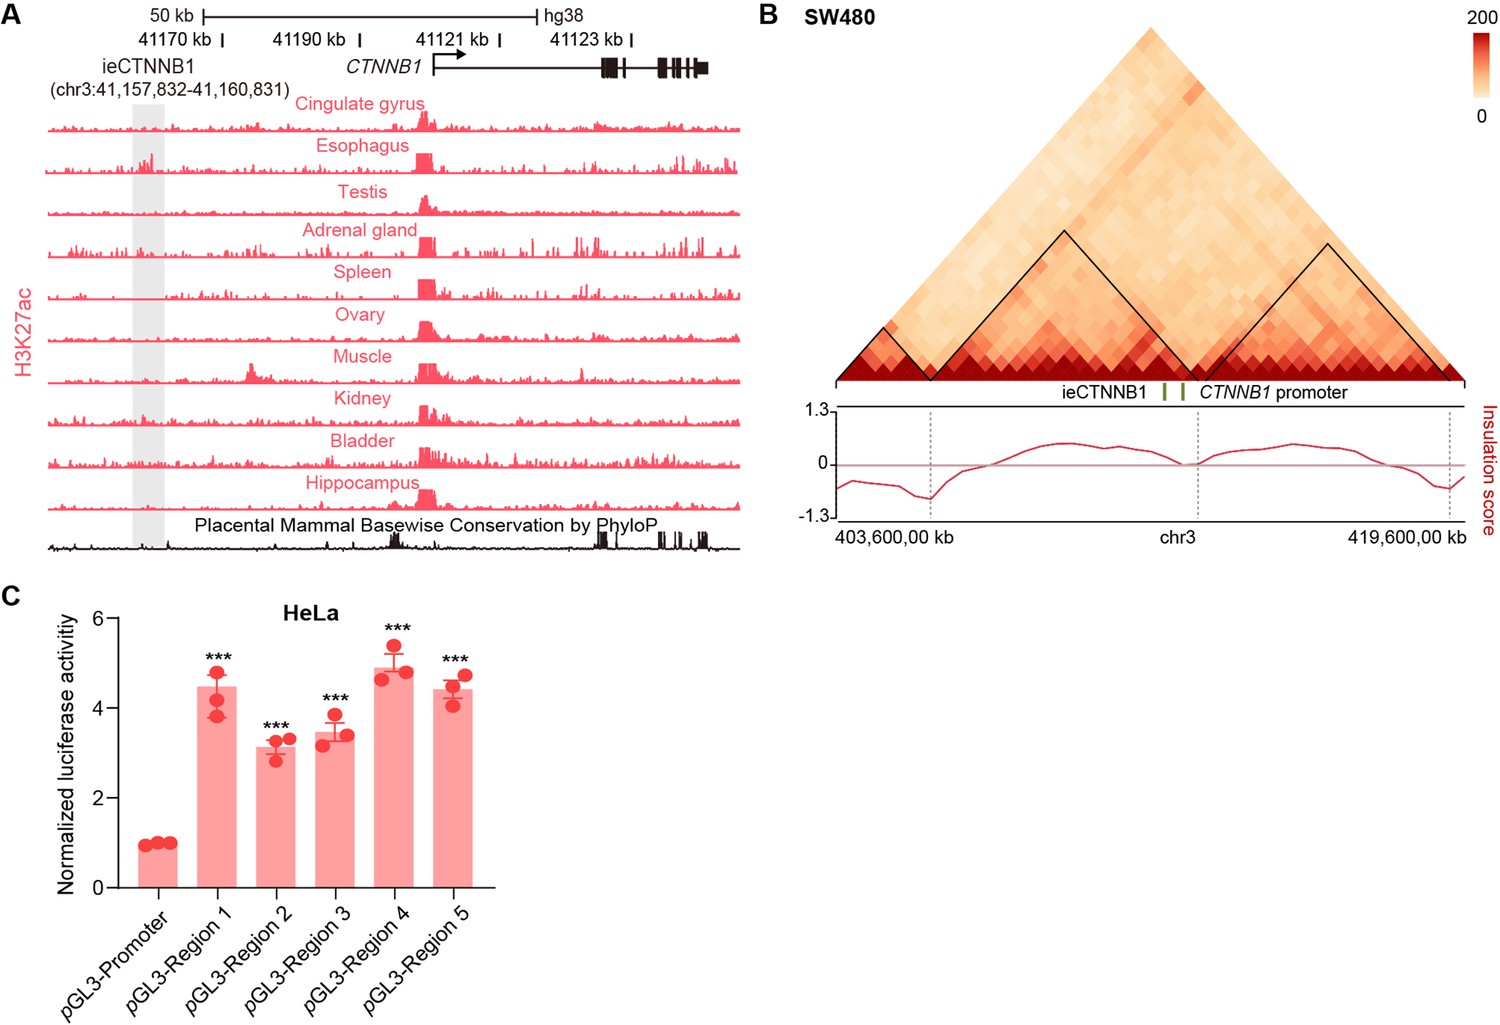
ieCTNNB1 is the intestinal enhancer of human CTNNB1.
(A) Schematic representation of the upstream region of human CTNNB1 gene and the location of ieCTNNB1 (gray shading). Enrichment of H3K27ac chromatin immunoprecipitation sequencing (ChIP-seq) signals in indicated human tissues was shown. Data were obtained from ENCODE. (B) Hi-C data of SW480 cells. Boundaries of the topologically associating domains (TADs) and locations of CTNNB1 promoter and ieCTNNB1 (green bar) were marked. (C) Luciferase reporter assays of HeLa cells transfected with indicated plasmids for 48 hr. Quantification data are shown as means ± SEM, statistical significance was determined using one-way ANOVA (C). *p<0.05, **p<0.01, ***p<0.001, and ****p<0.0001. ns, not significant.
-
Figure 4—figure supplement 1—source data 1
Numerical data for Figure 4—figure supplement 1C.
- https://cdn.elifesciences.org/articles/98238/elife-98238-fig4-figsupp1-data1-v1.zip
Figure 5 with 1 supplement
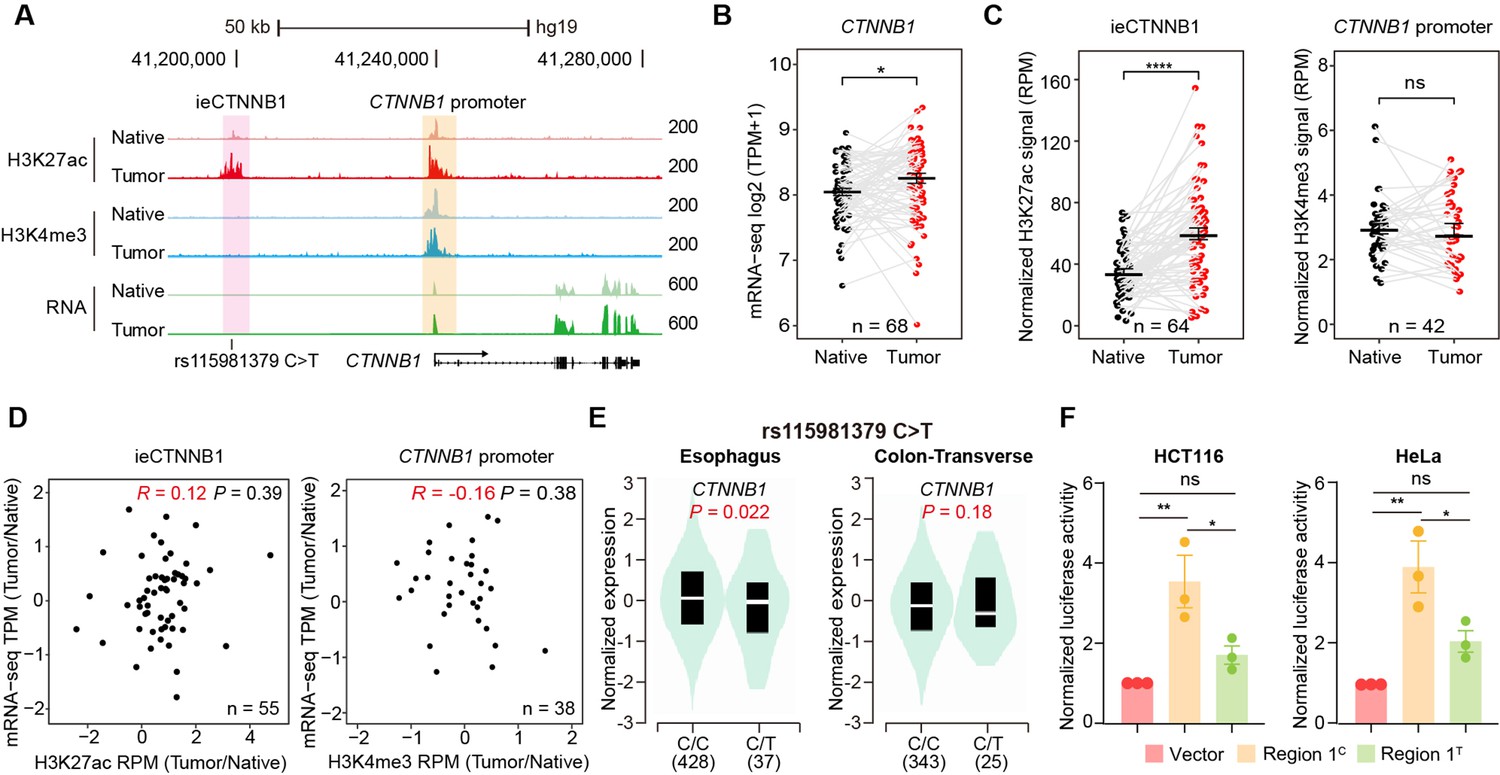
ieCTNNB1 is activated in colorectal cancer and its activity positively correlates with the expression of CTNNB1.
(A) Schematic representation of ieCTNNB1 (pink shading) and CTNNB1 promoter (yellow shading), which is respectively marked by H3K27ac and H3K4me3 peaks, and mRNA signals in native and tumor tissues of a patient with colorectal cancer. The location of risk mutation site was indicated. (B) Comparison of CTNNB1 expression levels in native and tumor tissues of colorectal cancer patients (n=68). (C) Left: comparison of H3K27ac signals at ieCTNNB1 in native and tumor tissues of colorectal cancer patients (n=64). Right: comparison of H3K4me3 signals at CTNNB1 promoter in native and tumor tissues of colorectal cancer patients (n=42). (D) Left: correlation between H3K27ac signals at ieCTNNB1 and CTNNB1 expression in native and tumor tissues of colorectal cancer patients (n=55). Right: correlation between H3K4me3 signals at CTNNB1 promoter and CTNNB1 expression in native and tumor tissues of colorectal cancer patients (n=38). (E) Left: comparison of CTNNB1 expression in esophagus between subjects with common sequence (C/C, n=428) and variant sequence (C/T, n=37). Right: comparison of CTNNB1 expression in transverse colon between subjects with common sequence (C/C, n=343) and variant sequence (C/T, n=25). (F) Luciferase reporter assay in HCT116 and HeLa cells transfected with indicated plasmids for 48 hr. Quantification data are shown as means ± SEM, statistical significance was determined using a paired (B, C, and D) or unpaired (E) two-tailed Student’s t-test and two-way ANOVA (F). *p<0.05, **p<0.01, ***p<0.001, and ****p<0.0001. ns, not significant. R: Pearson correlation.
-
Figure 5—source data 1
Numerical data for Figure 5F.
- https://cdn.elifesciences.org/articles/98238/elife-98238-fig5-data1-v1.zip
Figure 5—figure supplement 1
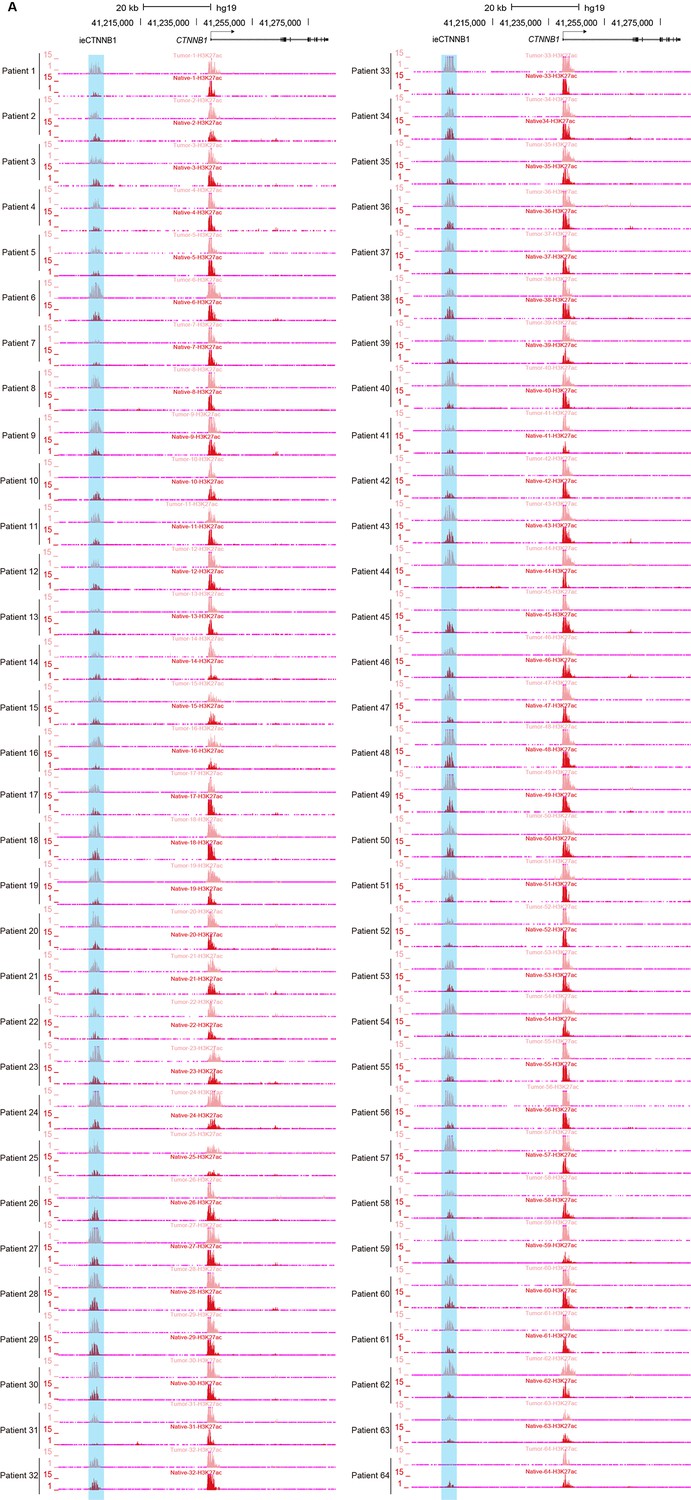
ieCTNNB1 is activated in colorectal cancer.
(A) H3K27ac chromatin immunoprecipitation sequencing (ChIP-seq) signals at ieCTNNB1 (blue shading) in paired tumor (top) and native (bottom) tissues of patients with colorectal cancer (n=64).
Figure 6 with 1 supplement
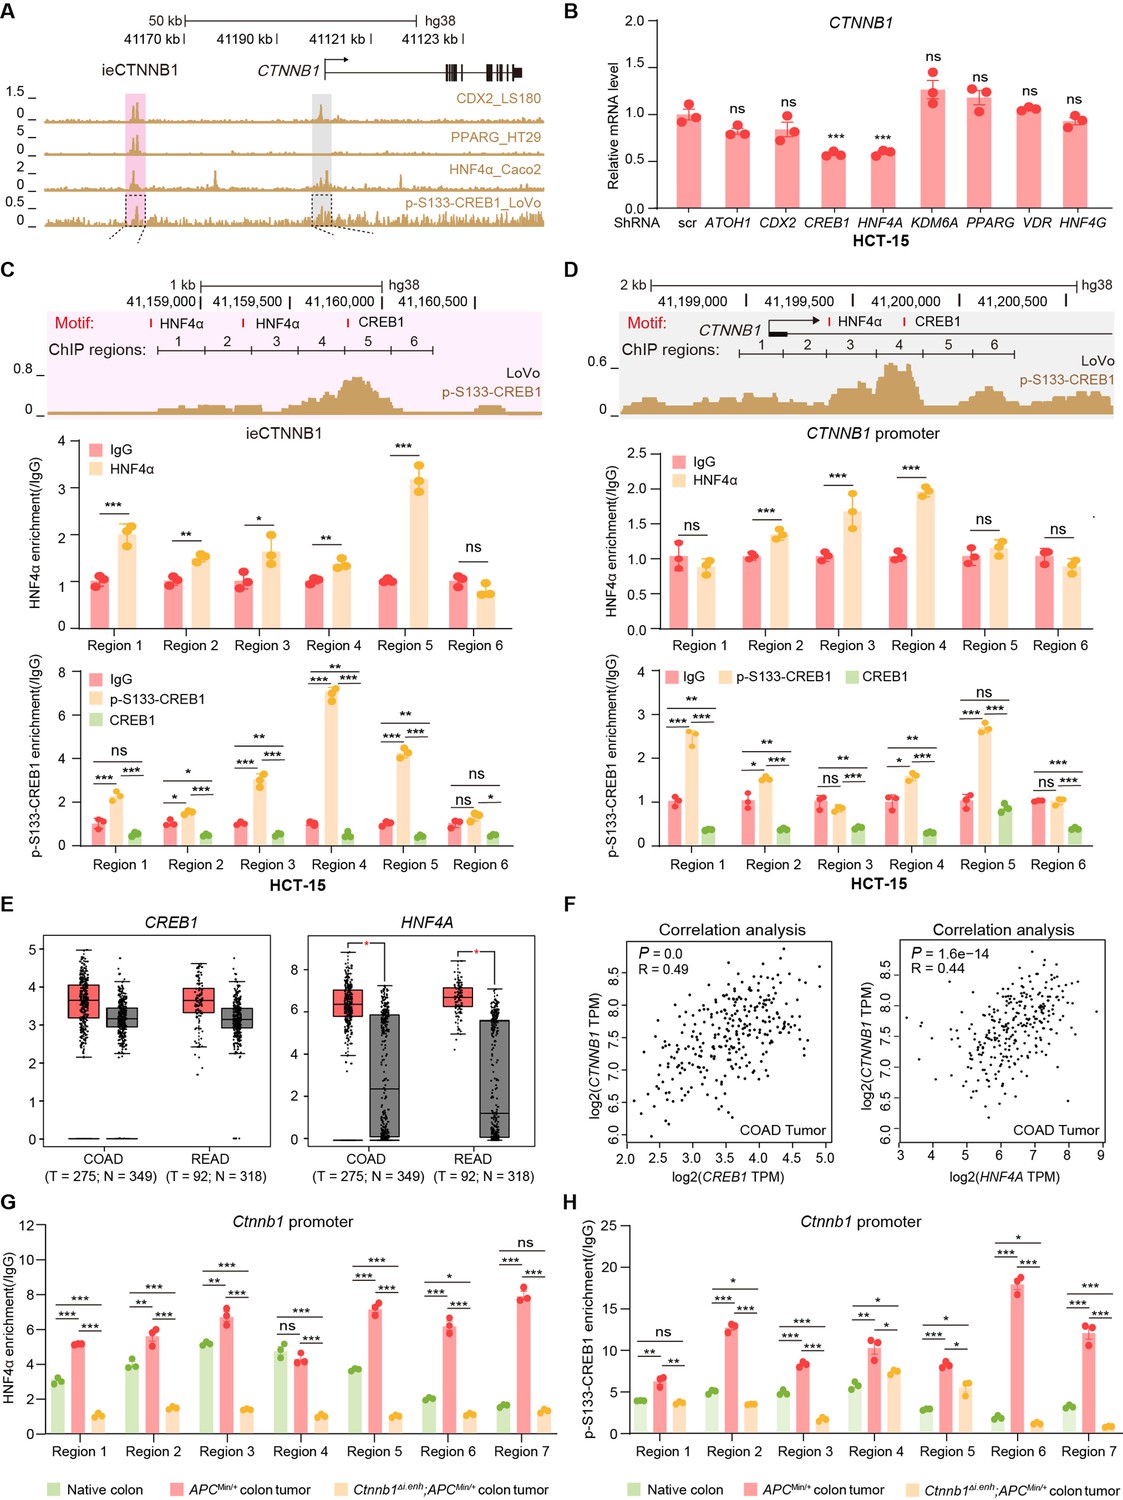
HNF4α and p-S133-CREB1 associate with ieCTNNB1 to regulate CTNNB1’s transcription.
(A) Chromatin immunoprecipitation sequencing (ChIP-seq) tracks of indicated trans-acting factors enriched at ieCTNNB1 (pink shading) and CTNNB1 promoter (gray shading) in indicated colorectal cancer cell lines. Shaded regions were enlarged in C (pink) and D (gray) respectively. (B) Quantitative reverse transcription PCR (RT-qPCR) showing relative mRNA levels of CTNNB1 in HCT-15 cells transfected with indicated shRNA-expressing plasmids for 48 hr. The expression level of CTNNB1 in cells transfected with scramble (scr) shRNA was set to ‘1’. (C–D) Top: schematic diagram showing the enrichment of p-S133-CREB1 at ieCTNNB1 (C) and CTNNB1’s promoter (D). Locations of HNF4α and CREB1 binding motif sites were indicated. Middle and bottom: ChIP-qPCR showing enrichment of HNF4α (middle), CREB1 and p-S133-CREB1 (bottom) at ieCTNNB1 (C), and CTNNB1’s promoter (D) in HCT-15 cells. Locations of ChIP regions were indicated. (E) Comparison of expression levels of CREB1 and HNF4A between native and tumor tissues in colon adenocarcinoma (COAD) and rectum adenocarcinoma (READ) tumors. (F) Correlations between the expression level of CTNNB1 and those of CREB1 or HNF4A in COAD tumors. (G–H) ChIP-qPCR showing enrichment of HNF4α (G) and p-S133-CREB1 (H) at Ctnnb1 promoter in native colon tissues of WT (n= 3) mice, tumor tissues of ApcMin/+ (n= 3) mice, and Ctnnb1Δi.enh;ApcMin/+ (n= 3) mice. Quantification data are shown as means ± SEM, statistical significance was determined using one-way ANOVA (B), unpaired two-tailed Student’s t-test (E and F), and Multiple t-tests – one per row (C, D, G, and H). *p<0.05, **p<0.01, ***p<0.001, and ****p<0.0001. ns, not significant. R: Pearson correlation.
-
Figure 6—source data 1
Numerical data for Figure 6B.
- https://cdn.elifesciences.org/articles/98238/elife-98238-fig6-data1-v1.zip
-
Figure 6—source data 2
Numerical data for Figure 6C.
- https://cdn.elifesciences.org/articles/98238/elife-98238-fig6-data2-v1.zip
-
Figure 6—source data 3
Numerical data for Figure 6D.
- https://cdn.elifesciences.org/articles/98238/elife-98238-fig6-data3-v1.zip
-
Figure 6—source data 4
Numerical data for Figure 6G.
- https://cdn.elifesciences.org/articles/98238/elife-98238-fig6-data4-v1.zip
-
Figure 6—source data 5
Numerical data for Figure 6H.
- https://cdn.elifesciences.org/articles/98238/elife-98238-fig6-data5-v1.zip
Figure 6—figure supplement 1
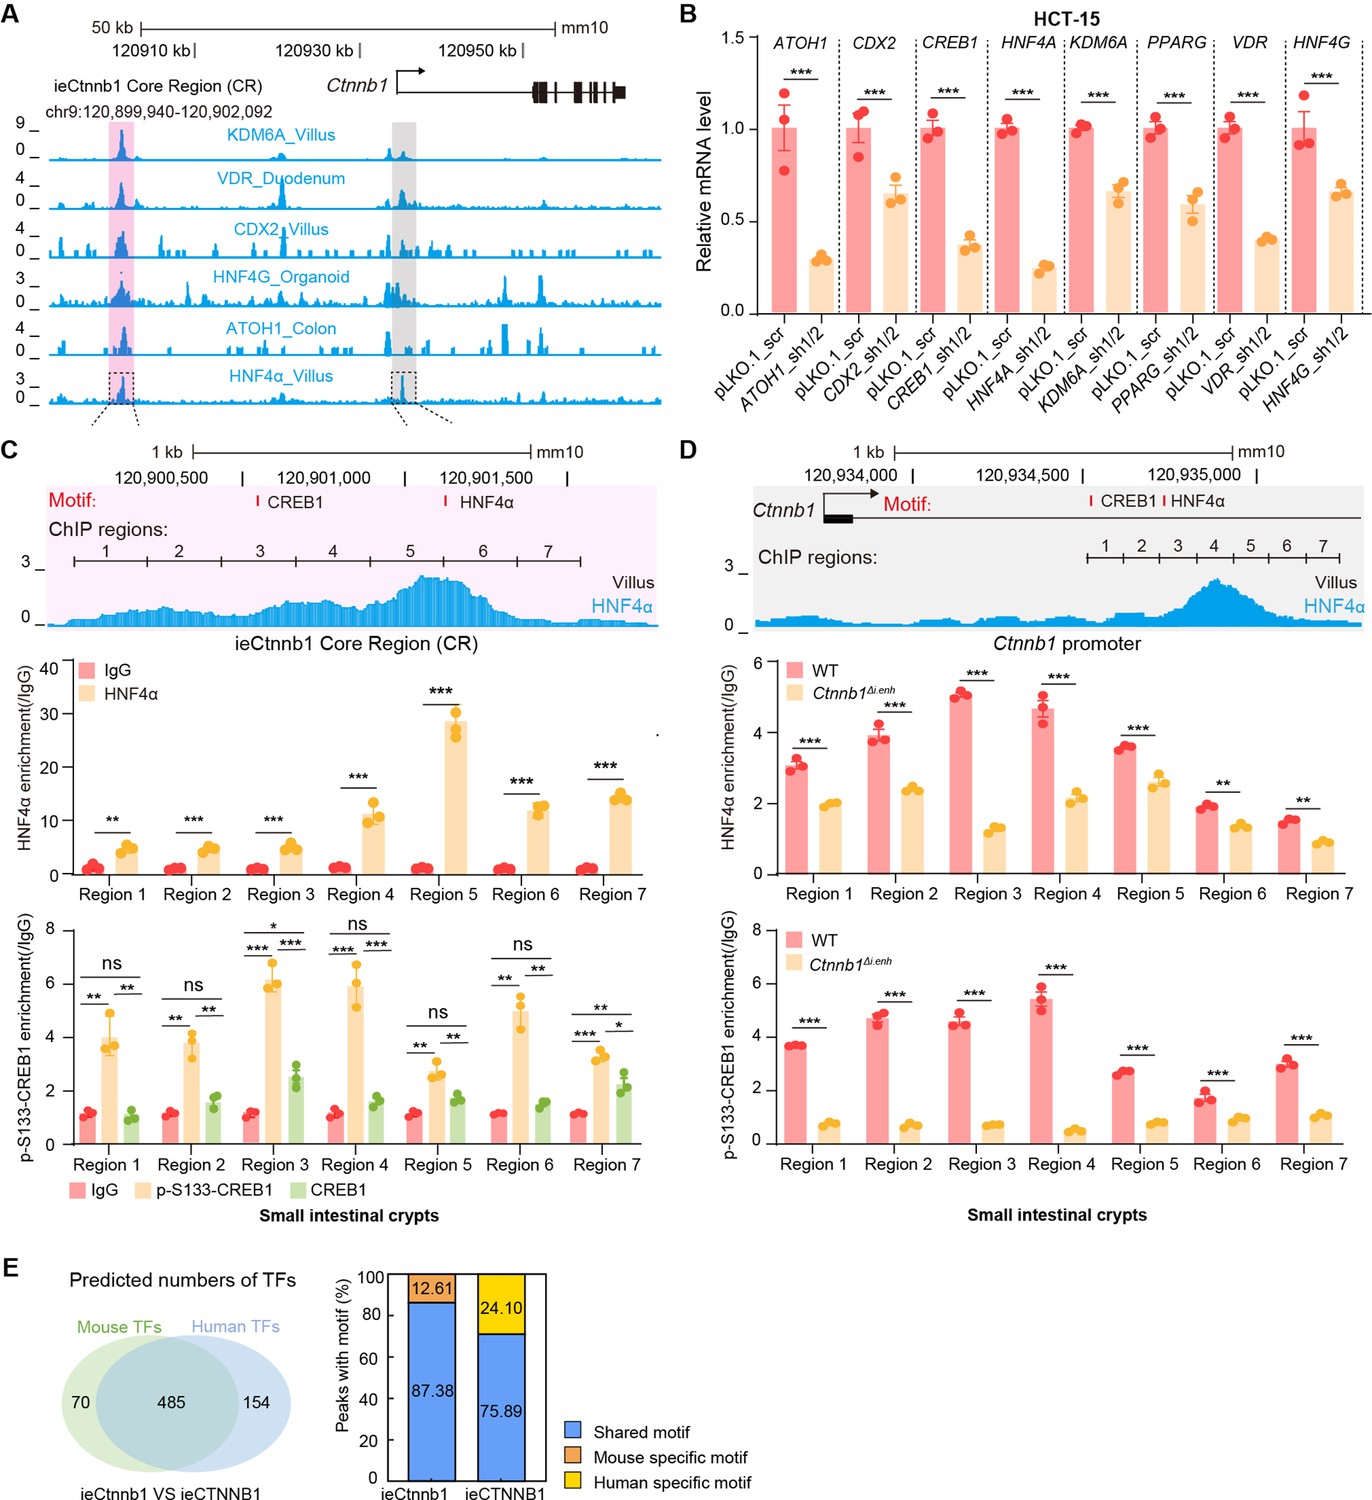
HNF4α and p-S133-CREB1 associate with ieCtnnb1 to regulate Ctnnb1’s transcription.
(A) Chromatin immunoprecipitation sequencing (ChIP-seq) tracks of indicated trans-acting factors enriched at ieCtnnb1 (pink shading) and Ctnnb1 promoter (gray shading) in mouse intestinal tissues and organoids. Shaded regions were enlarged in C (pink) and D (gray) respectively. (B) Relative mRNA levels of indicated genes in HCT-15 cells transfected with indicated shRNA-expressing plasmids for 48 hr. (C–D) Top: schematic diagram showing the enrichment of HNF4α at ieCtnnb1 (C) and Ctnnb1’s promoter (D). Locations of the HNF4α and CREB1 binding motif sites were indicated. Middle and bottom: ChIP-qPCR showing enrichment of HNF4α (middle), CREB1 and p-S133-CREB1 (bottom) at ieCtnnb1 (C), and Ctnnb1’s promoter (D) in small intestinal crypts. ChIP regions were indicated. (E) The comparison of numbers (left) and proportions (right) of species-specific and shared transcription factor binding sites within ieCtnnb1 and ieCTNNB1. Quantification data are shown as means ± SEM, statistical significance was determined using an unpaired two-tailed Student’s t-test (B) and Multiple t-tests – one per row (C and D). *p<0.05, **p<0.01, ***p<0.001, and ****p<0.0001. ns, not significant.
-
Figure 6—figure supplement 1—source data 1
Numerical data for Figure 6—figure supplement 1B.
- https://cdn.elifesciences.org/articles/98238/elife-98238-fig6-figsupp1-data1-v1.zip
-
Figure 6—figure supplement 1—source data 2
Numerical data for Figure 6—figure supplement 1C.
- https://cdn.elifesciences.org/articles/98238/elife-98238-fig6-figsupp1-data2-v1.zip
-
Figure 6—figure supplement 1—source data 3
Numerical data for Figure 6—figure supplement 1D.
- https://cdn.elifesciences.org/articles/98238/elife-98238-fig6-figsupp1-data3-v1.zip
-
Figure 6—figure supplement 1—source data 4
Numerical data for Figure 6—figure supplement 1E.
- https://cdn.elifesciences.org/articles/98238/elife-98238-fig6-figsupp1-data4-v1.zip
Figure 7
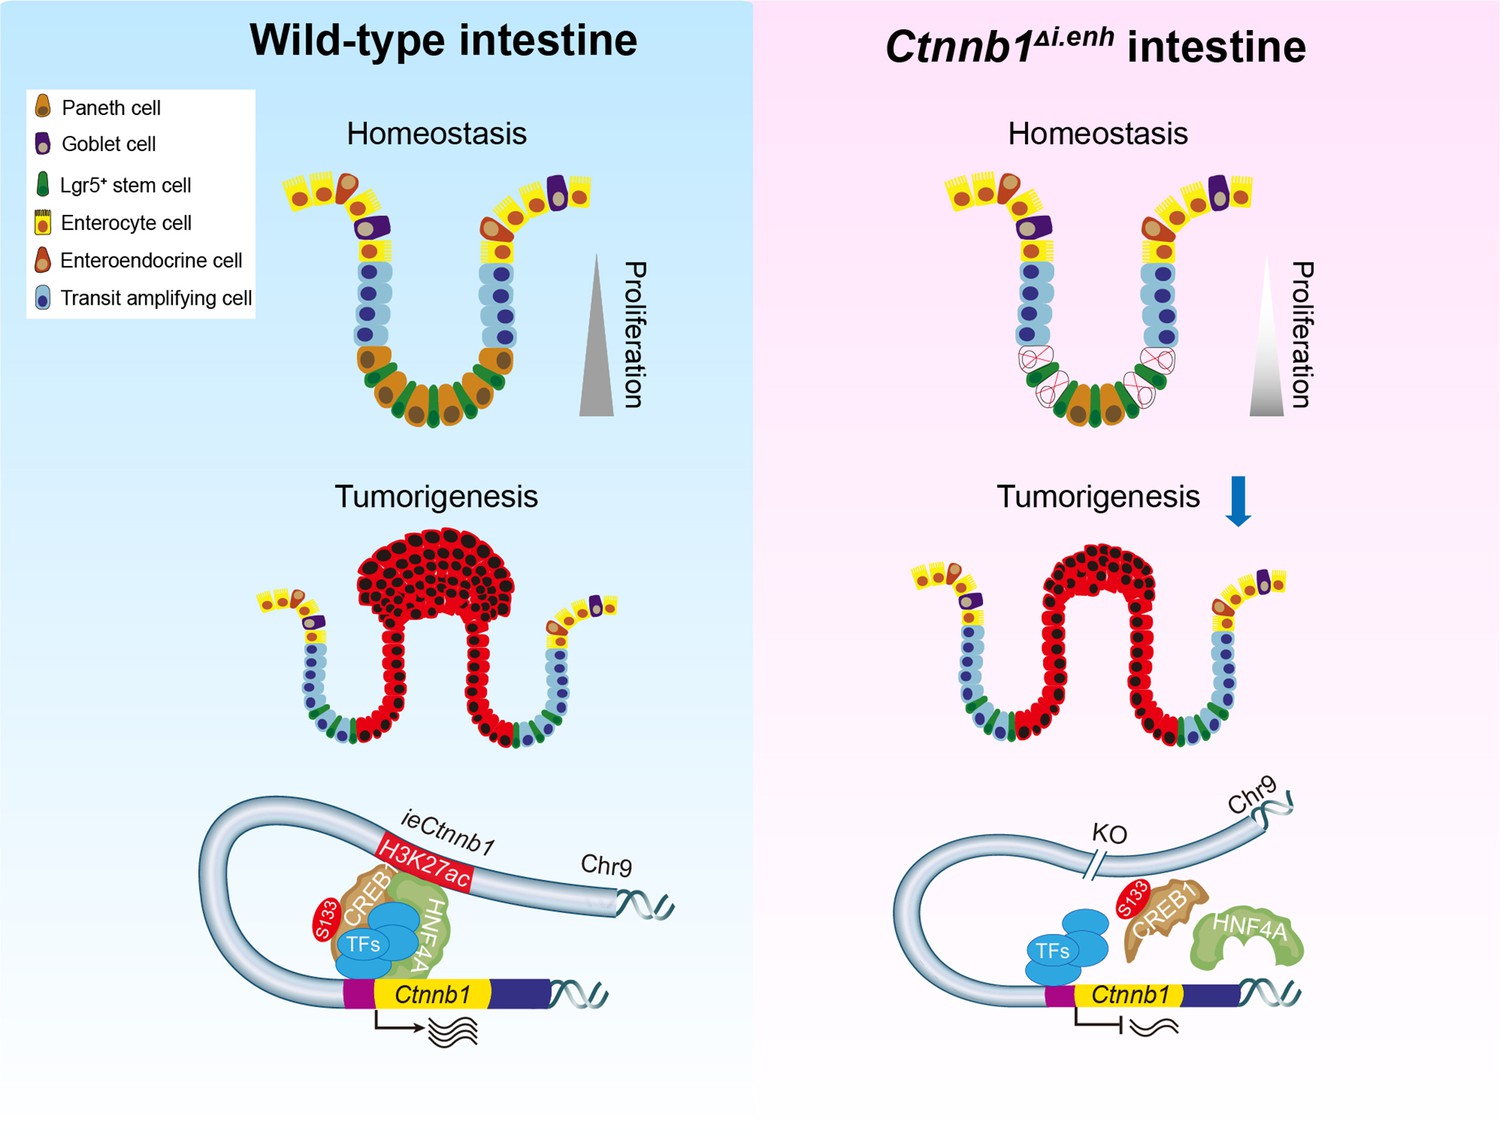
The working model.
ieCtnnb1, the intestinal enhancer of Ctnnb1, balances epithelial homeostasis and tumorigenesis by transcriptionally controlling Wnt signaling dosage.
Author response image 1

Quality control assays for ChIP-qPCR.
(A) Agarose gel electrophoresis of sonicated DNA. (B-E) Tests of amplification efficiency for primer sets used in ChIP-qPCR.
Tables
Key resources table
| Reagent type (species) or resource | Designation | Source or reference | Identifiers | Additional information |
|---|---|---|---|---|
| Gene (Mus musculus) | Ctnnb1 | GenBank | Gene ID: 12387 | |
| Gene (Homo sapiens) | CTNNB1 | GenBank | Gene ID: 1499 | |
| Genetic reagent (Mus musculus) | ieCtnnb1 knockout | This paper | N/A | Received from Beijing Biocytogen, China |
| Genetic reagent (Mus musculus) | ieCtnnb1-LacZ | This paper | N/A | Received from Shanghai Model Organisms Center Inc, China |
| Genetic reagent (Homo sapiens) | ieCTNNB1-LacZ | This paper | N/A | Received from Shanghai Model Organisms Center Inc, China |
| Strain, strain background (Mus musculus) | BAT-Gal | The Jackson Laboratory | JAX#005317; RRID:IMSR_JAX:005317 | |
| Strain, strain background (Mus musculus) | Lgr5-EGFP-IRES-CreERT2 | The Jackson Laboratory | JAX#008875; RRID:IMSR_NM-KI-200154 | |
| Strain, strain background (Mus musculus) | ApcMin/+ | The Jackson Laboratory | JAX#002020; RRID:MGI:3834882 | |
| Cell line (Homo sapiens) | HEK293T | ATCC | CRL-1573; RRID:CVCL_0045 | |
| Cell line (Homo sapiens) | HCT116 | China Center for Type Culture Collection | GDC0625; RRID:CVCL_0291 | |
| Cell line (Homo sapiens) | HCT-15 | China Center for Type Culture Collection | GDC0250; RRID:CVCL_0292 | |
| Cell line (Homo sapiens) | HeLa | China Center for Type Culture Collection | GDC0009; RRID:CVCL_0030 | |
| Transfected construct (Homo sapiens) | pHR-SFFV-dCas9-BFP-KRAB | Addgene | RRID:Addgene #46911 | |
| Transfected construct (Homo sapiens) | lenti sgRNA (MS2)_zeo backbone vector | Addgene | RRID:Addgene #61427 | |
| Transfected construct (Homo sapiens) | dCAS9-VP64_GFP | Addgene | RRID:Addgene #61422 | |
| Transfected construct (Homo sapiens) | lenti MS2-P65-HSF1_Hygro | Addgene | RRID:Addgene #61426 | |
| Antibody | Anti-α-defensin5 (Rabbit monoclonal) | Abcam | CAT#ab180515; RRID:AB_2923196 | IHC (1:500) |
| Antibody | Anti-Ki67 (Rabbit polyclonal) | Abcam | CAT#ab15580; RRID:AB_443209 | IHC (1:500) |
| Antibody | Anti-β-catenin (Rabbit monoclonal) | Cell Signaling Technology | CAT#8480T; RRID:AB_11127855 | IHC (1:100) WB (1:1000) |
| Antibody | Anti-HNF4α (Rabbit monoclonal) | Abcam | CAT#ab181604; RRID:AB_2890918 | ChIP (1 µg/ml) |
| Antibody | Anti-CREB1(S133) (Rabbit monoclonal) | Abcam | CAT#ab32096; RRID:AB_731734 | ChIP (1 µg/ml) |
| Antibody | Anti-Muc2 (Rabbit polyclonal) | Thermo Fisher | CAT#PA5-21329; RRID:AB_11153058 | IHC (1:500) |
| Antibody | Anti-EpCAM FITC (Mouse monoclonal) | eBioScience | CAT#347197; RRID:AB_400261 | FACS (1:200) |
| Recombinant DNA reagent | pGL3-promoter-ieCtnnb1 | This paper | N/A | Obtained from Zhou Lab of Wuhan University |
| Recombinant DNA reagent | pGL3-promoer-ieCTNNB1 Region1 | This paper | N/A | Obtained from Zhou Lab of Wuhan University |
| Recombinant DNA reagent | pLKO.1-shRNAs | This paper | N/A | Obtained from Zhou Lab of Wuhan University |
| Sequence-based reagent | TF-shRNAs | This paper | PCR primers | See Supplementary file 1 |
| Sequence-based reagent | ieCtnnb1/ ieCTNNB1 ChIP-qPCR primers | This paper | ChIP-qPCR primers | See Supplementary file 1 |
| Sequence-based reagent | Genotyping primers | This paper | PCR primers | See Supplementary file 1 |
| Commercial assay or kit | Dual-Luciferase Reporter Assay System | Promega | CAT#E1910 | |
| Commercial assay or kit | Alcian Blue PAS Stain Kit | Abcam | CAT#ab245876 | |
| Commercial assay or kit | BeyoClick EdU Cell Promotion Kit | Beyotime | CAT#C0075S | |
| Software | Fiji/ImageJ | https://fiji.sc | v2.0.0; RRID:SCR_003070 | |
| Software | GraphPad Prism | https://www.graphpad.com | v8.0; RRID:SCR_002798 | |
| Other | DAPI | BD Pharmingen | CAT#564907 | (1 µg/ml) |
Additional files
-
Supplementary file 1
Primers used in this study.
- https://cdn.elifesciences.org/articles/98238/elife-98238-supp1-v1.docx
-
Supplementary file 2
Summary of high-throughput data used in this study.
- https://cdn.elifesciences.org/articles/98238/elife-98238-supp2-v1.docx
-
Supplementary file 3
HNF4α and CREB1 motifs analyses at ieCtnnb1/ieCTNNB1 and Ctnnb1/CTNNB1 promoter.
- https://cdn.elifesciences.org/articles/98238/elife-98238-supp3-v1.docx
-
MDAR checklist
- https://cdn.elifesciences.org/articles/98238/elife-98238-mdarchecklist1-v1.docx
Download links
A two-part list of links to download the article, or parts of the article, in various formats.
Downloads (link to download the article as PDF)
Open citations (links to open the citations from this article in various online reference manager services)
Cite this article (links to download the citations from this article in formats compatible with various reference manager tools)
A Ctnnb1 enhancer transcriptionally regulates Wnt signaling dosage to balance homeostasis and tumorigenesis of intestinal epithelia
eLife 13:RP98238.
https://doi.org/10.7554/eLife.98238.3


