RAG suppresses group 2 innate lymphoid cells
- Division of Allergy and Immunology, Department of Medicine, Washington University School of Medicine, United States
- Immunology and Inflammation Research Therapeutic Area, Sanofi, United States
- Kimberly and Eric J. Waldman Department of Dermatology, Icahn School of Medicine at Mount Sinai, United States
- Mark Lebwohl Center for Neuroinflammation and Sensation, Icahn School of Medicine at Mount Sinai, United States
- Marc and Jennifer Lipschultz Precision Immunology Institute, Icahn School of Medicine at Mount Sinai, United States
- Friedman Brain Institute, Icahn School of Medicine at Mount Sinai, United States
- Division of Dermatology, Department of Medicine, Washington University School of Medicine, United States
- Department of Pathology and Immunology, Washington University School of Medicine, United States
- Department of Life Science, College of Natural Sciences, Hanyang University, Republic of Korea
- Division of Rheumatology, Department of Medicine, Washington University School of Medicine, United States
- Immunology and Microbial Pathogenesis Program, Graduate School of Medical Sciences, Weill Cornell Medical College, United States
- Immunology Program, Memorial Sloan Kettering Cancer Center, United States
- Allen Discovery Center for Neuroimmune Interactions, Icahn School of Medicine at Mount Sinai, United States
Figures
Figure 1 with 2 supplements
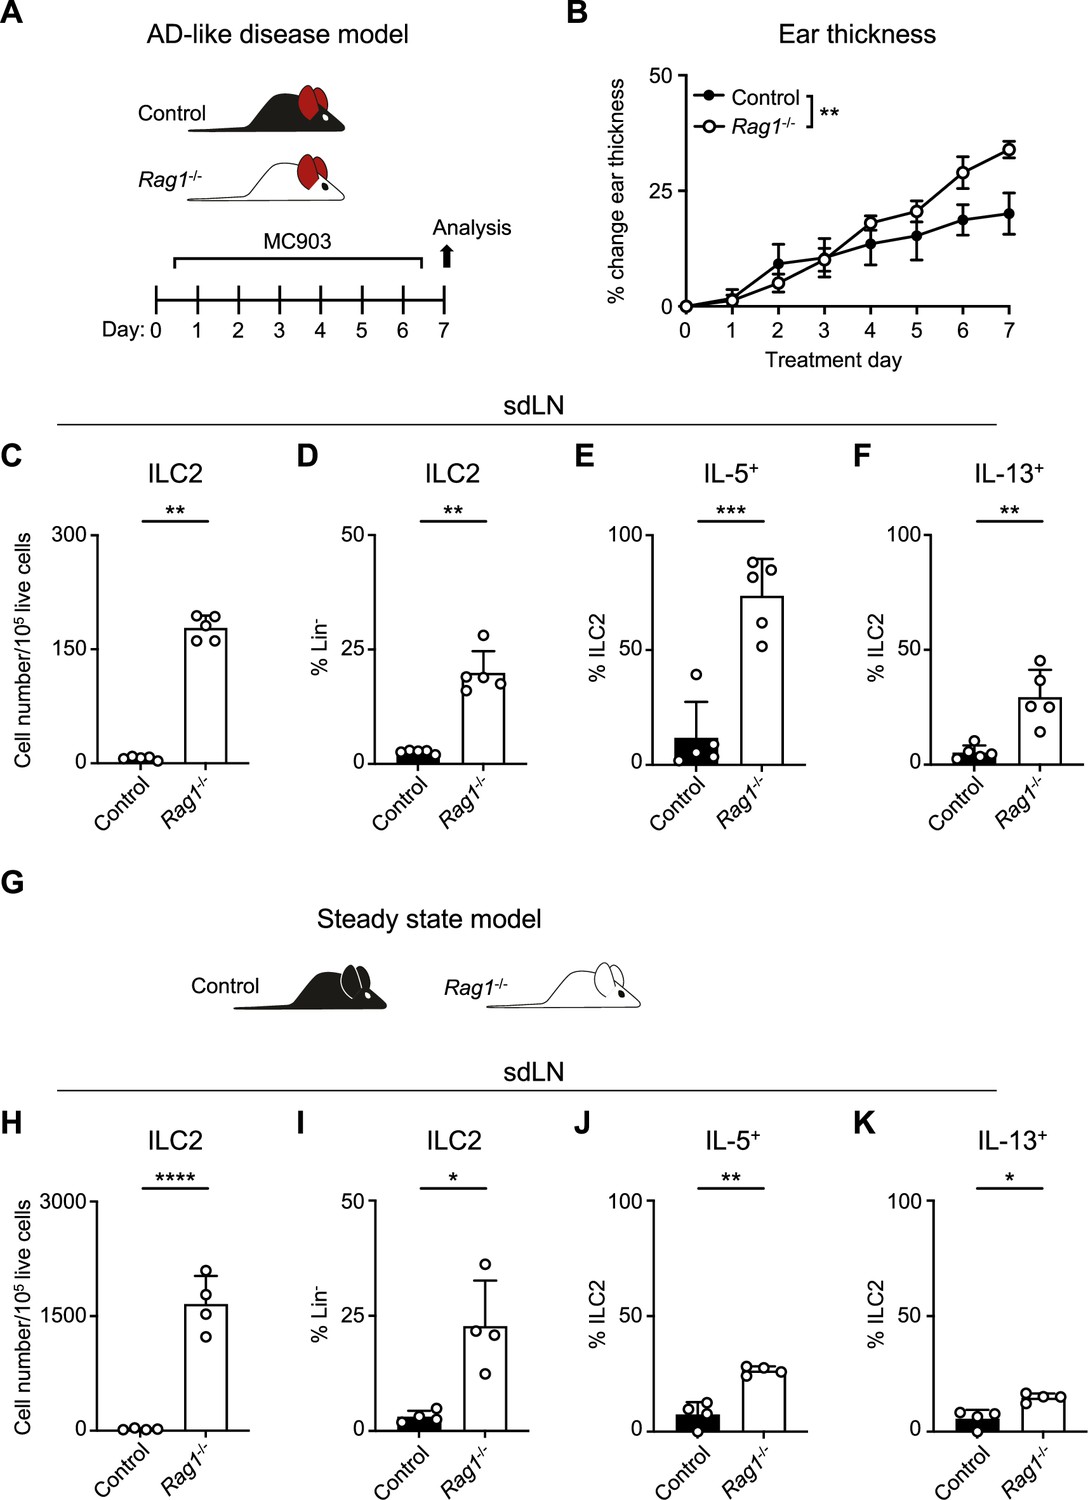
Recombinase activating gene (RAG) deficiency leads to the expansion and activation of group 2 innate lymphoid cells (ILC2s) during inflammation and at a steady state.
(A) Experimental schematic of atopic dermatitis (AD)-like disease. Wild-type (WT) B6 (Control) mice or Rag1-/- mice treated topically to the inner surface of each ear with 2 nmol MC903 in 10 μL ethanol vehicle daily for 7 days develop AD-like inflammation. (B) Ear thickness measured daily in AD-like inflammation. Data representative of at least two independent experiments, 5 mice/group. ** p<0.01 by two-way ANOVA with Sidak’s multiple comparisons test, day 7. (C) Total number ILC2s normalized to 105 live cells and (D) proportion of CD90+, Lin- cells (Lin- defined as CD3-, CD5-, CD11b-, CD11c-, CD19-, NK1.1-, and FcεR1-) determined to be ILC2s (IL-33R+) in skin-draining lymph nodes (sdLN) from WT or Rag1-/- mice with AD-like ear inflammation. Percent ILC2 from sdLN in AD-like disease following Phorbol 12-myristate 13-acetate (PMA)/ionomycin stimulation positive for (E) IL-5 or (F) IL-13 staining. (G) Schematic of steady state analysis of sdLN from WT (Control) or Rag1-/- mice. (H) Total number ILC2s normalized to 105 live cells and (I) ILC2 proportion of steady state sdLN CD90+, Lin- cells determined to be ILC2s as in (C, D). Percent ILC2 from sdLN in steady state following PMA/ionomycin stimulation positive for (J) IL-5 or (K) IL-13 staining. (C-F; H–K) Data representative of at least two independent experiments, with 4–5 mice/group. *p<0.05, **p<0.01, ***p<0.001 by two-tailed Welch’s t-test. All data is represented as mean with scale bars representing standard deviation.
Figure 1—figure supplement 1
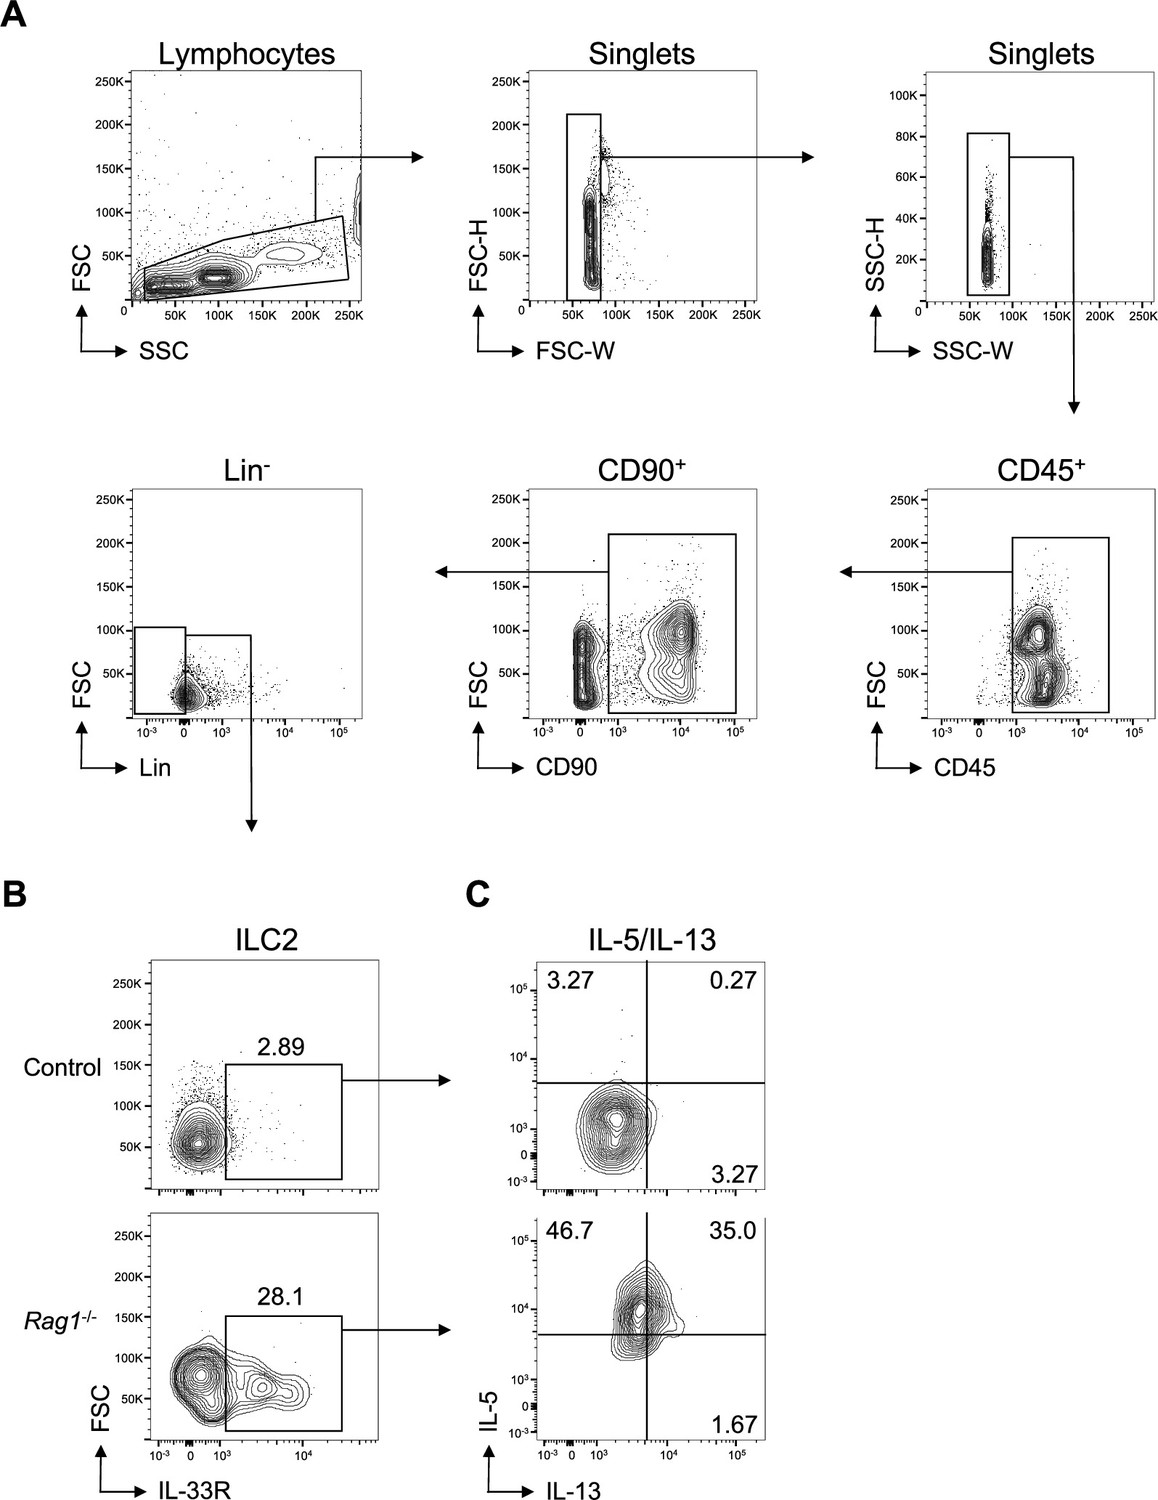
Group 2 innate lymphoid cell (ILC2) and IL-5/IL-13 gating.
Gating for (A) CD45+, CD90+, Lin- cells (Lin- defined as CD3-, CD5-, CD11b-, CD11c-, CD19-, NK1.1-, and FcεR1-), then gating on (B) ILC2 (IL-33R+ Lin-) corresponding to Figure 1C and D , with subsequent gating of (C) IL-5+ and IL-13+ ILC2, corresponding to Figure 1E and F.
Figure 1—figure supplement 2
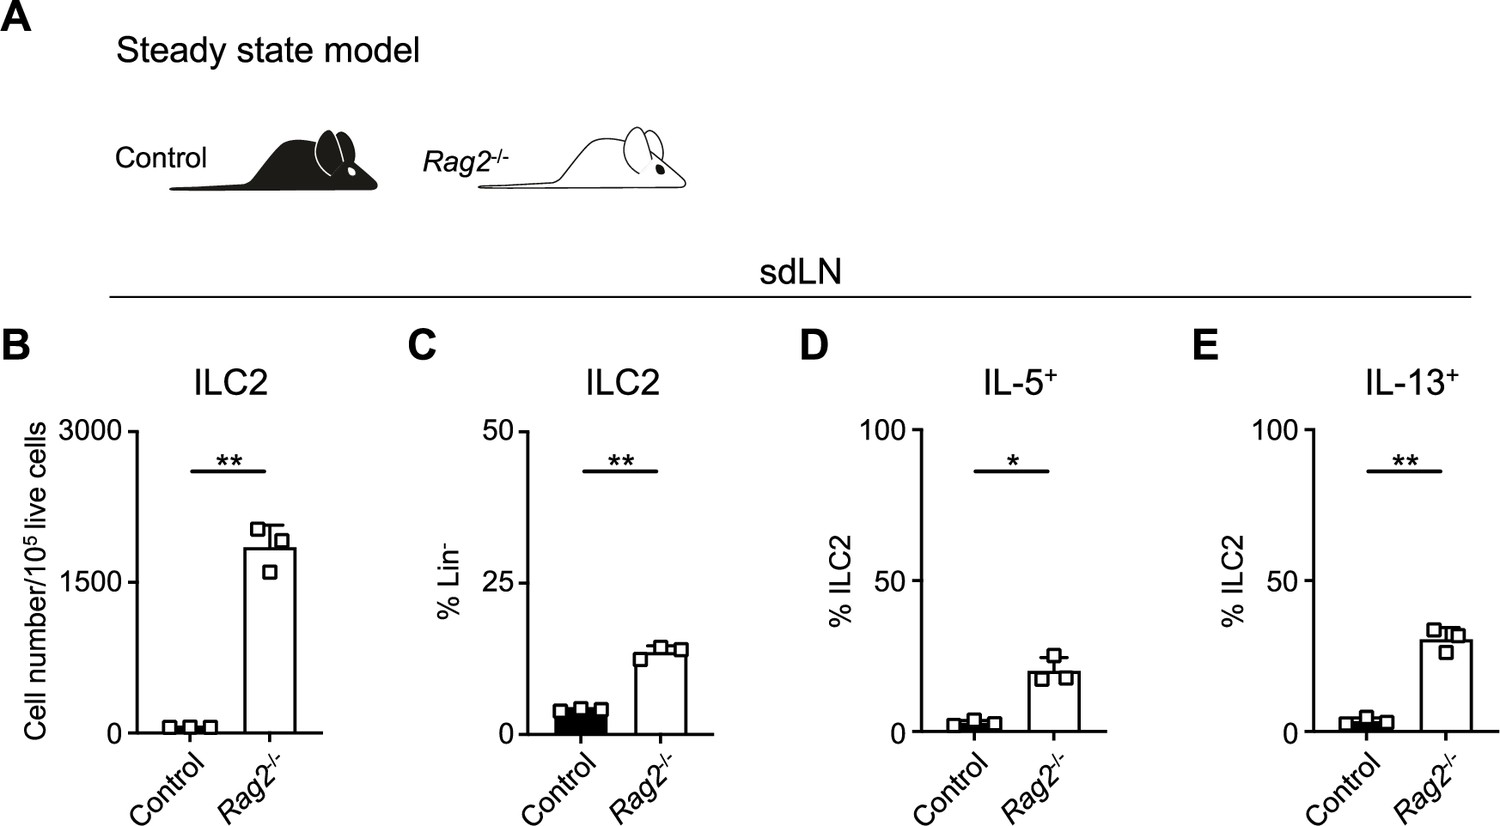
Expansion and activation of group 2 innate lymphoid cells (ILC2s) in recombinase activating gene (RAG2) deficiency compared to littermates.
(A) Schematic of steady state analysis of wild-type (WT) B6 (Control) mice or Rag2-/- mice. (B) Total number ILC2s normalized to 105 live cells and (C) proportion of CD90+ Lin- cells (Lin- defined as CD3-, CD5-, CD11b-, CD11c-, CD19-, NK1.1-, and FcεR1-) determined to be ILC2s (IL-33R+) in skin-draining lymph node (sdLN) at steady state from WT or Rag2-/- mice. Percent ILC2 from sdLN at steady state following Phorbol 12-myristate 13-acetate (PMA)/ionomycin stimulation positive for (D) IL-5 or (E) IL-13 staining. Data representative of two independent experiments with 2–3 mice per group. *p<0.05, **p<0.01 by two-tailed Welch’s t-test. All data is represented as mean with scale bars representing standard deviation.
Figure 2 with 2 supplements
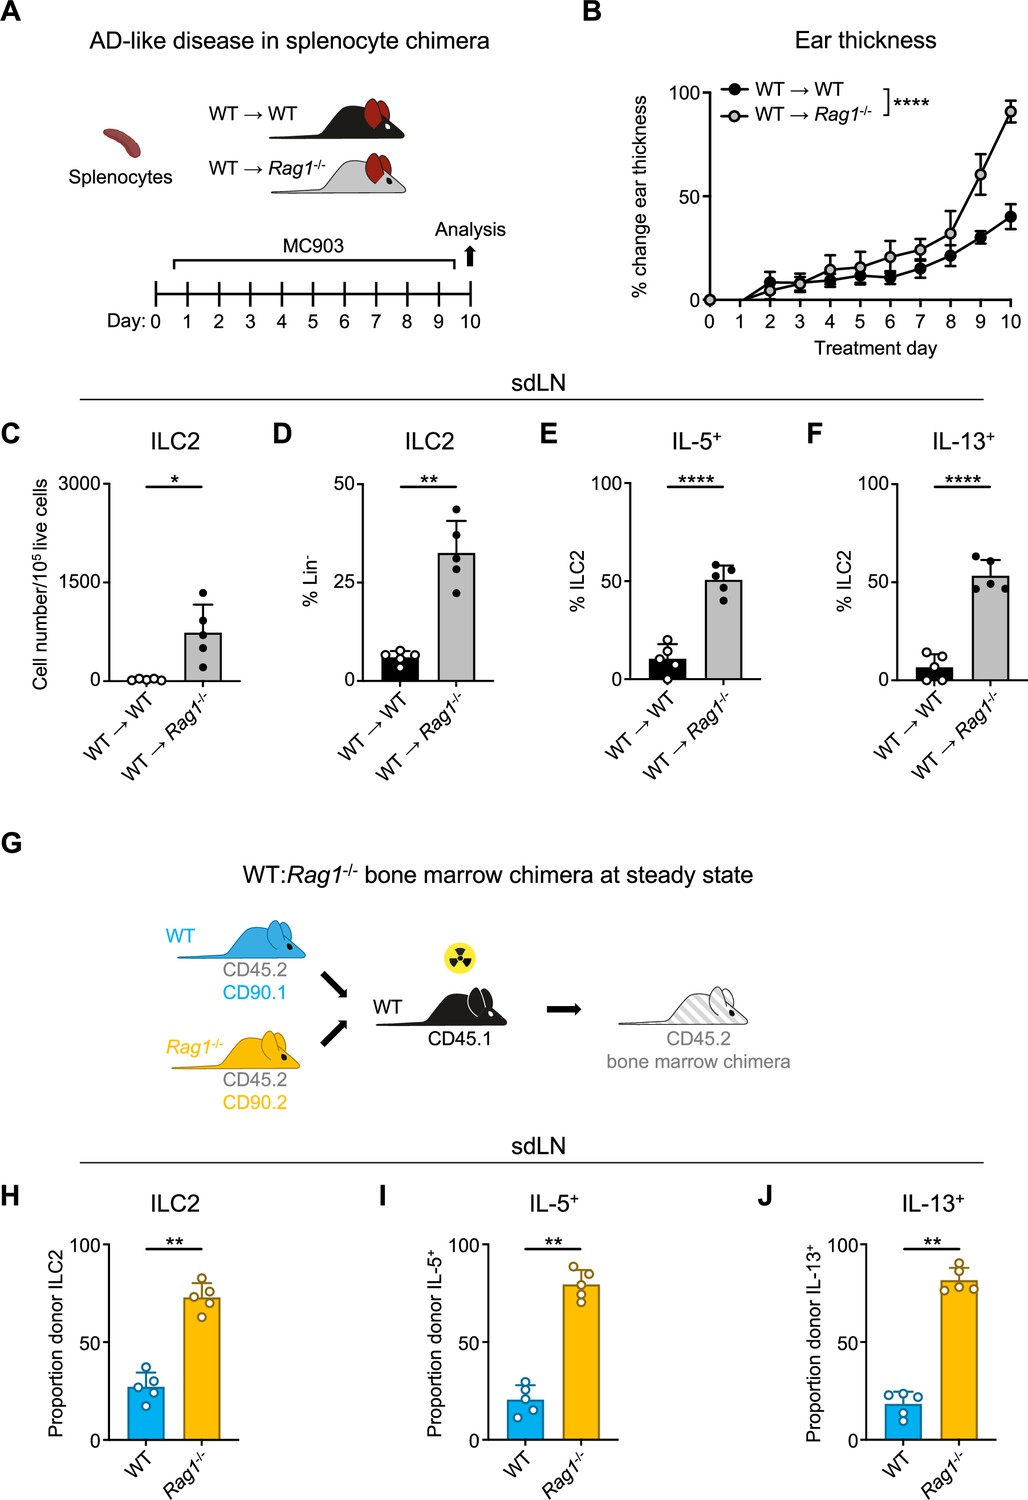
Homeostatic expansion and activation of recombinase activating gene (RAG)-deficient group 2 innate lymphoid cells (ILC2s) is cell intrinsic.
(A) Experimental schematic of atopic dermatitis (AD)-like disease in splenocyte chimera experiment. Wild-type (WT) B6 or Rag1-/- mice received WT splenocytes and developed AD-like inflammation after subsequent topical treatment with 2 nmol MC903 in 10 μL ethanol vehicle to each ear daily for 10 days. (B) Ear thickness measured daily in AD-like inflammation. Data representative of two independent experiments, 4–5 mice per group. ****p<0.0001 by two-way ANOVA with Sidak’s multiple comparisons test, day 10. (C) Total number ILC2s normalized to 105 live cells and (D) proportion of CD90+, Lin- cells (Lin- defined as CD3-, CD5-, CD11b-, CD11c-, CD19-, NK1.1-, and FcεR1-) determined to be ILC2s (IL-33R+). Percent ILC2 from skin-draining lymph node (sdLN) in splenocyte chimera mice with AD-like disease after Phorbol 12-myristate 13-acetate (PMA)/ionomycin stimulation positive for (E) IL-5 or (F) IL-13 staining. (G) Schematic of bone marrow chimera experiment. Equal quantities of bone marrow cells from Rag1-/- (CD45.2, CD90.2 - orange) and WT (CD45.2, CD90.1 - blue) C57BL/6J donor mice were used to reconstitute the immune systems of irradiated recipient WT (CD45.1 - black) C57BL/6J mice. (H) Proportion of donor (CD45.2+) ILC2 defined as in (C and D) in sdLN by donor source (CD90.1+ - WT, CD90.2- - Rag1-/-). Proportion of Lin- ILCs by donor source positive for (I) IL-5 and (J) IL-13 following PMA/ionomycin stimulation and cytokine staining. (C–F) Data representative of at least two independent experiments, 4–5 mice per group. **p<0.01, ****p<0.0001 by two-tailed Welch’s t test. (H–J) Data representative of at least two independent experiments with 4–5 mice per group. **p<0.01 by two-tailed ratio means paired t test. All data represented as mean with scale bars representing standard deviation.
Figure 2—figure supplement 1
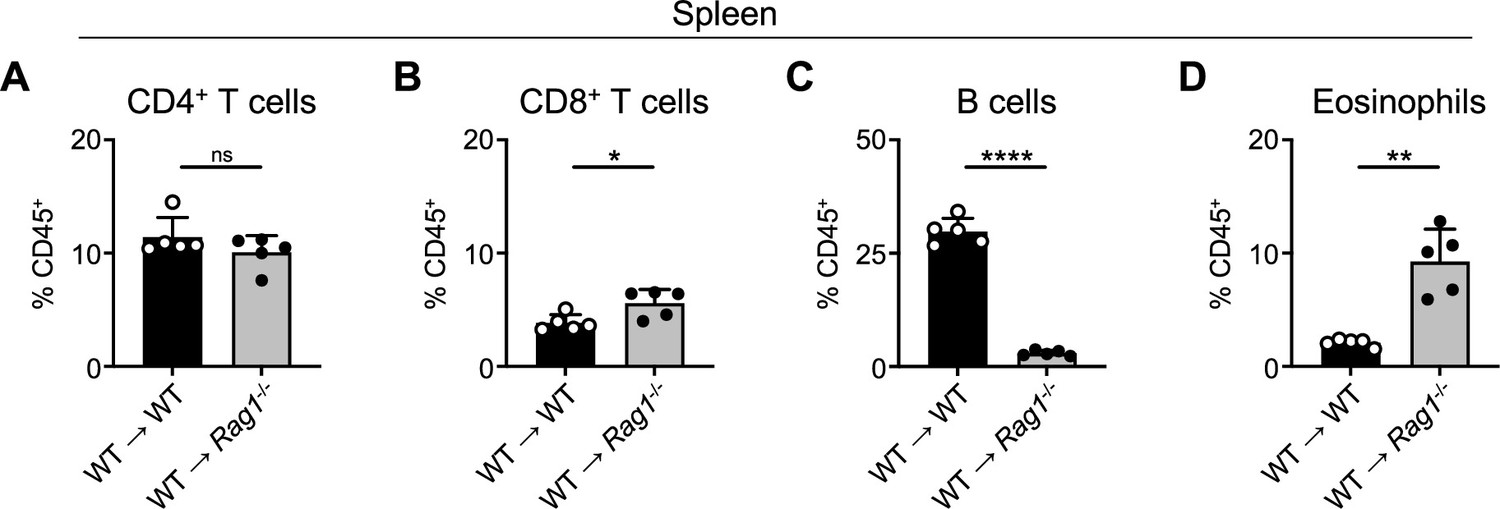
Confirmation of splenocyte reconstitution in splenocyte chimera mice.
Proportion of CD45+ splenocytes from splenocyte chimera mice (related to Figure 2A–F) determined to be (A) CD4+ T cells (CD4+, CD8-, CD19-), (B) CD8+ T cells (CD4-, CD8+, CD19-), (C) B cells (CD4-, CD8-, CD19+), and (D) Eosinophils (SiglecF+, CD4-, CD8-). Data representative of at least two independent experiments, 4–5 mice per group. *p<0.05, **p<0.01, ****p<0.0001 by two-tailed Welch’s t test. All data represented as mean with scale bars representing standard deviation.
Figure 2—figure supplement 2
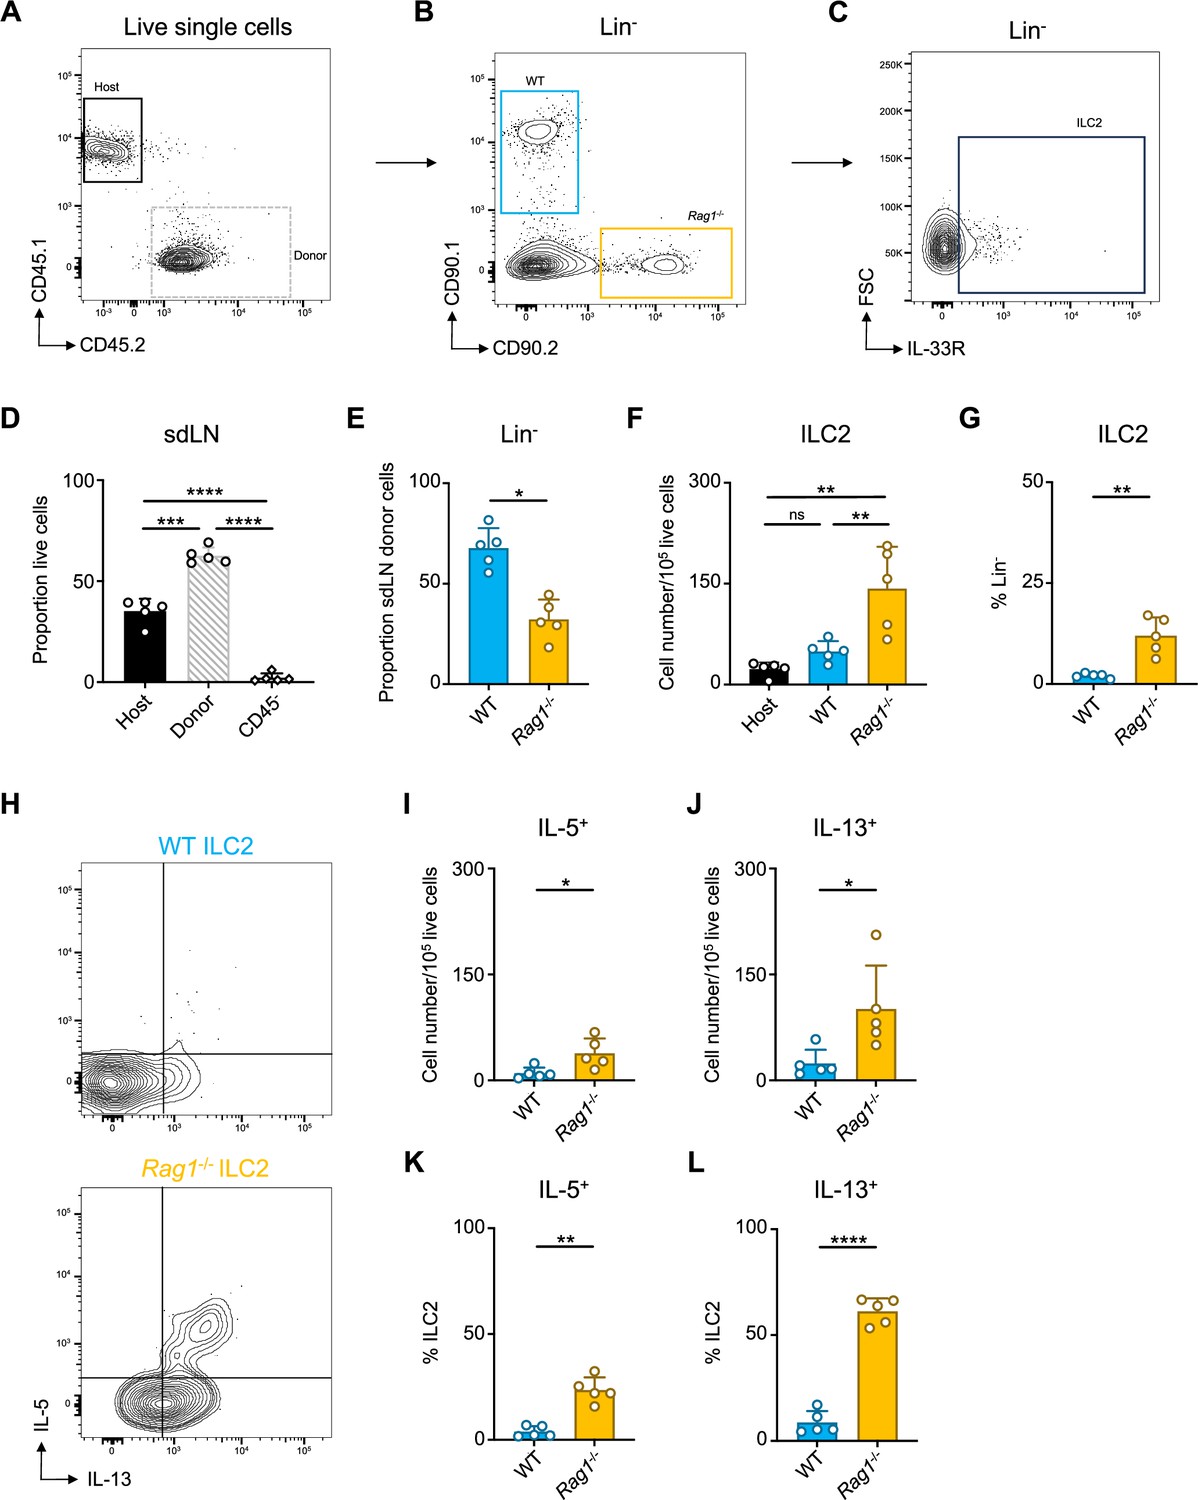
Donor cell reconstitution and gating in sdLN of wild-type (WT):Rag1-/- bone marrow chimera mice.
(A) Gating of live host (CD45.1+) and donor (CD45.2+) cells then (B) Gating on donor cells by genotype (CD90.1+ = WT [blue]; CD90.2+ = Rag1-/- [orange]) in Lin- population then (C) Gating on Lin- IL-33R+ group 2 innate lymphoid cells (ILC2s) in the skin draining lymph node (sdLN). (D) Host/donor CD45+ cell reconstitution in sdLN of WT:Rag1-/- bone marrow chimera mice. (E) Quantification of CD45.2+ Lin- donor cells by genotype in sdLN of WT:Rag1-/- bone marrow chimera mice. (F) Total numbers of ILC2s normalized to 105 live cells and (G) ILC2 proportion of Lin- cells in the sdLN. (H) Gating for IL-5 and IL-13 after in vitro stimulation and intracellular cytokine staining of ILC2s from sdLN. Quantification of total positive cells normalized to 105 live cells for (I) IL-5 and (J) IL-13 and proportion of ILC2 positive for (K) IL-5 and (L) IL-13. Data representative of at least two independent experiments, 4–5 mice per group. (E, G, I–L) *p<0.05, **p<0.01 by ratio means paired t-test. (D, F) **p<0.01, ***p<0.001, ****p<0.0001, by RM one-way ANOVA test with Geisser-Greenhouse correction. All data represented as mean with scale bars representing standard deviation. Related to Figure 2G–J.
Figure 3
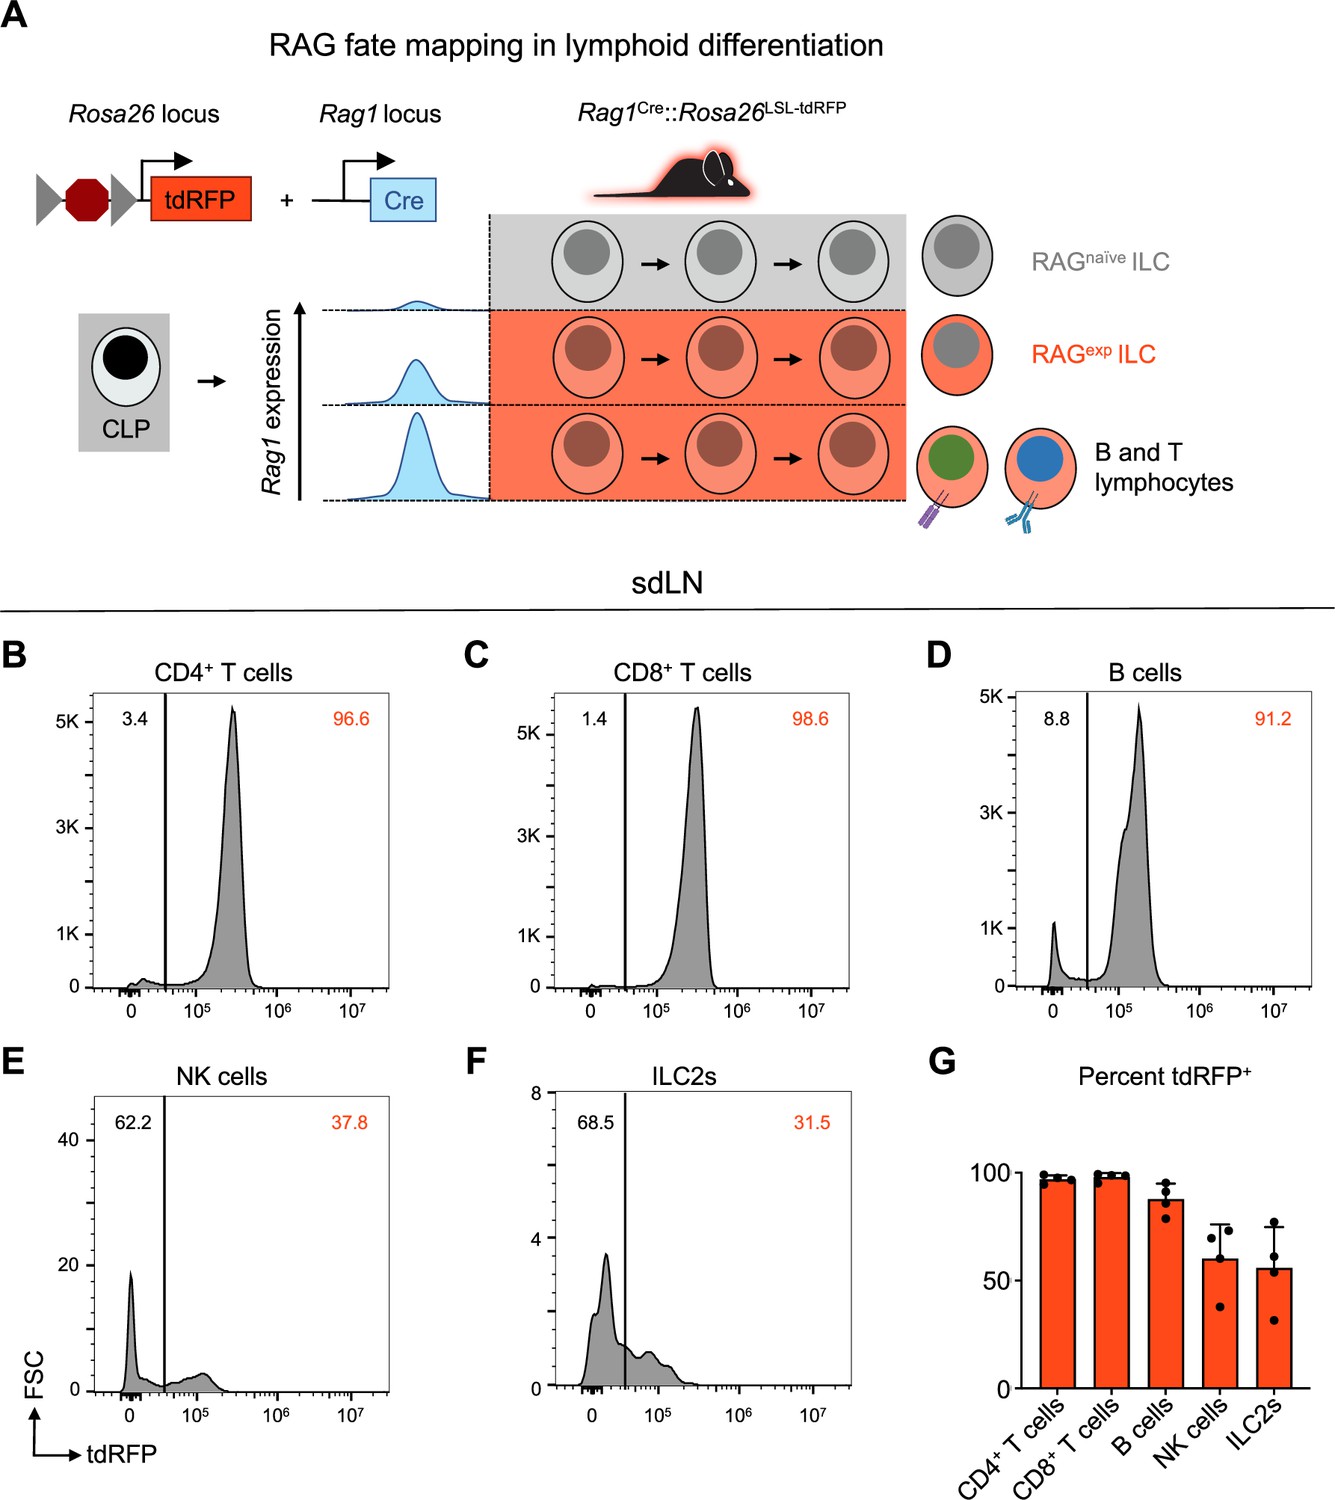
A history of recombinase activating gene (RAG) expression marks a population of group 2 innate lymphoid cells (ILC2s) in the skin-draining lymph node (sdLN).
(A) Schematic of RAG fate mapping in the lymphoid cell compartment using reporter mice expressing Cre-inducible tandem dimer red fluorescent protein (tdRFP) from the Rosa26 locus crossed to mice expressing Cre recombinase from the Rag1 locus. (B–F) Histograms of tdRFP signal in CD45+ sdLN cells by cell type for (B) CD4+ T cells (B220-, CD3+, CD4+), (C) CD8+ T cells (B220-, CD3+, CD8+), (D) B cells (MHCII+, B220+), (E) NK cells (B220-, CD3-, CD4-, CD8-, CD49b+, NK1.1+), (F) ILC2s (B220-, CD3-, CD4-, CD8-, CD49b-, NK1.1-, CD11b-, CD11c-, SiglecF-, CD90+, KLRG1+ or ICOS+ or IL-33R+), (G) quantification of tdRFP+ proportion of each cell type. Data representative of at least two independent experiments, 3-4 mice per group. Data in (G) represented as mean with scale bars representing standard deviation. Statistical analyses were not performed.
Figure 4 with 3 supplements
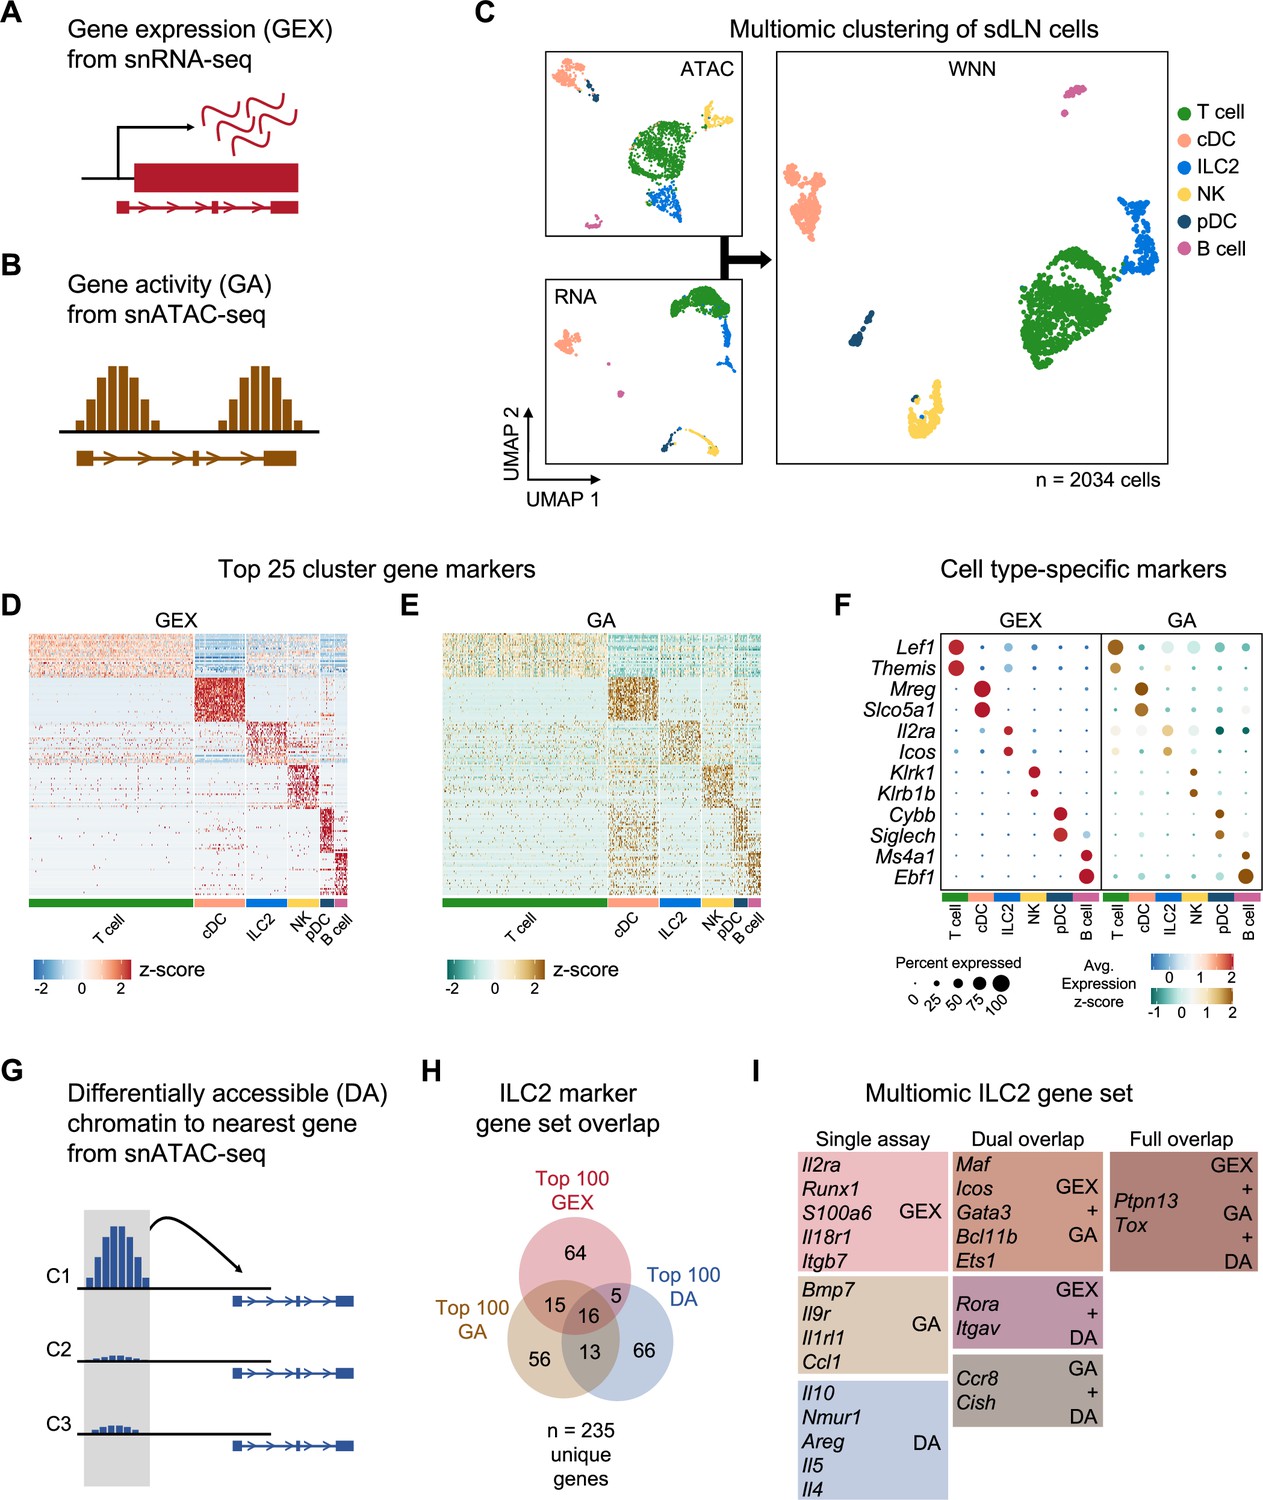
Multiomic analysis of group 2 innate lymphoid cells (ILC2s) through single nuclei sequencing of the skin-draining lymph node (sdLN).
(A) Schematic of the gene expression (GEX) assay derived from single-nuclei RNA sequencing (snRNA-seq) data. (B) Schematic of the gene activity (GA) assay, representing estimated transcription scores derived from single-nuclei ATAC sequencing (snATAC-seq) data using Signac. (C) UMAP visualizations of independent analyses of RNA-seq and ATAC-seq data for 2034 sdLN cells after dimensional reduction and clustering combined using weighted nearest neighbor (WNN) analysis in Seurat. Cluster identities are color coded consistently throughout the following panels. Heatmaps of (D) top 25 GEX marker genes and (E) top 25 GA marker genes identified for each cluster. See Supplementary file 1, Table S1 for full lists of genes. (F) Dotplots comparing selected marker genes for each cluster between the GEX and GA assays, with emphasis on known cell type-specific markers. (G) Schematic of differentially accessible (DA) chromatin assay, which finds the nearest gene to any peak calculated to be differentially open in a particular cell cluster. See Supplementary file 1, Table S2 for full lists of the top 25 DA cluster markers. (H) Overlap of top 100 markers for the ILC2 cluster from the GEX, GA, and DA assays. See Supplementary file 1, Table S3 for the top 100 DA peaks and distances to the nearest genes and Supplementary file 1, Table S4 for the full list of the top 100 ILC2 markers. (I) Selected genes from the ILC2 gene set for each assay individually and for overlaps.
Figure 4—figure supplement 1
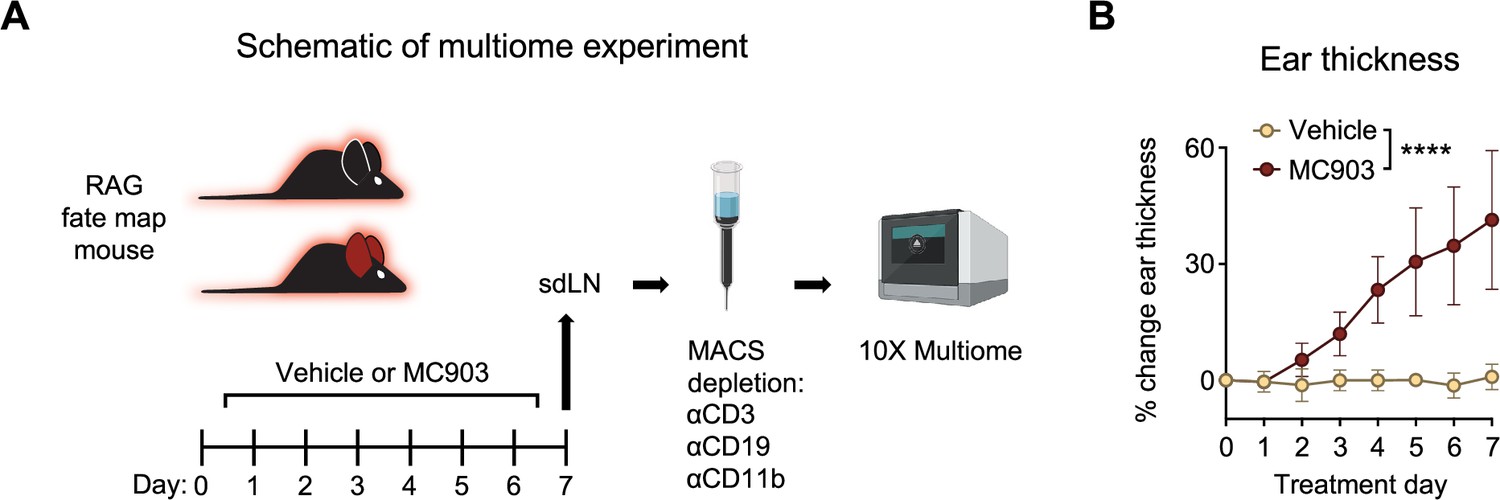
Skin-draining lymph node (sdLN) multiome experiment.
(A) Rag1Cre::Rosa26LSL-tdRFP reporter mice were given topical treatments with 2 nmol MC903 dissolved in ethanol vehicle or with ethanol vehicle alone to each ear daily for 7 days. Harvested sdLN processed using Magnetic Activated Cell Sorting (MACS) led to depletion of cells expressing the CD3, CD19, and CD11b lineage markers, and the remaining cells were further processed in the 10 X Multiome pipeline, generating both single cell RNA-sequencing and single cell ATAC-sequencing data for each cell. (B) Ear thickness measured daily in the atopic dermatitis (AD)-like disease multiome experiment. Data representative of one experiment, with 4 mice per group pooled for sequencing. ****p<0.0001 by two-way ANOVA with Sidak’s multiple comparisons test, day 7. All data is represented as mean with scale bars representing standard deviation.
Figure 4—figure supplement 2
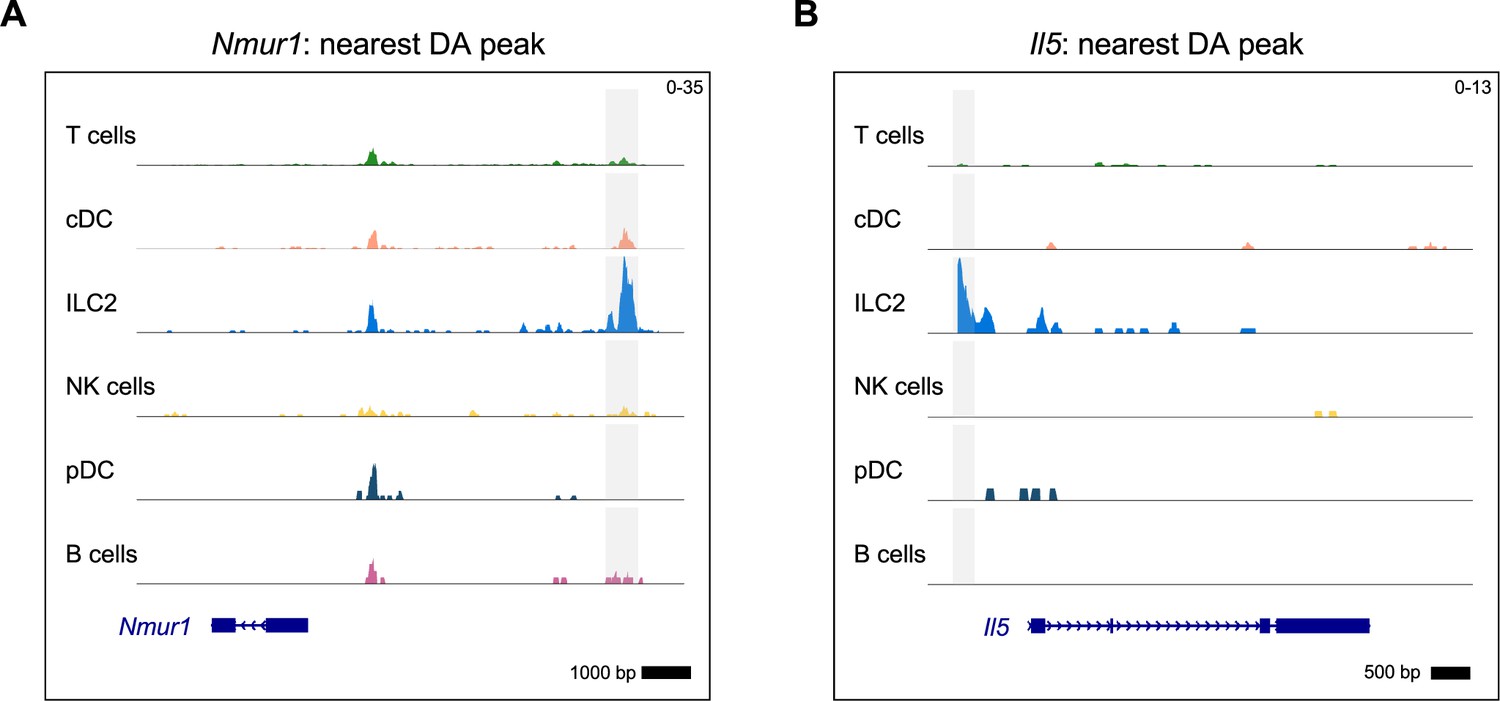
Group 2 innate lymphoid cells (ILC2) marker genes were identified in the differentially accessible open chromatin assay.
Differentially accessible (DA) open chromatin peaks identified for the ILC2 cluster are highlighted in gray and shown next to the closest gene for (A) Neuromedin U receptor 1 (Nmur1) and (B) IL-5 (Il5). See Supplementary file 1, Table S3 for the top 100 DA peaks and distances to the nearest genes for the ILC2 cluster.
Figure 4—figure supplement 3

Dotplots of selected group 2 innate lymphoid cells (ILC2) marker genes.
Dotplots comparing selected marker genes from the multiomic ILC2 gene set (Figure 4I, Supplementary file 1, Table S4) for each cluster between the gene expression (GEX) and gene activity (GA) assays, with genes highlighted by color corresponding to individual assays or overlap of assays in which they were identified. Rora was not detected in the GA assay.
Figure 5 with 3 supplements
A history of recombinase activating gene (RAG) expression imprints transcriptomic and epigenomic modulation of group 2 innate lymphoid cells (ILC2) gene programs.
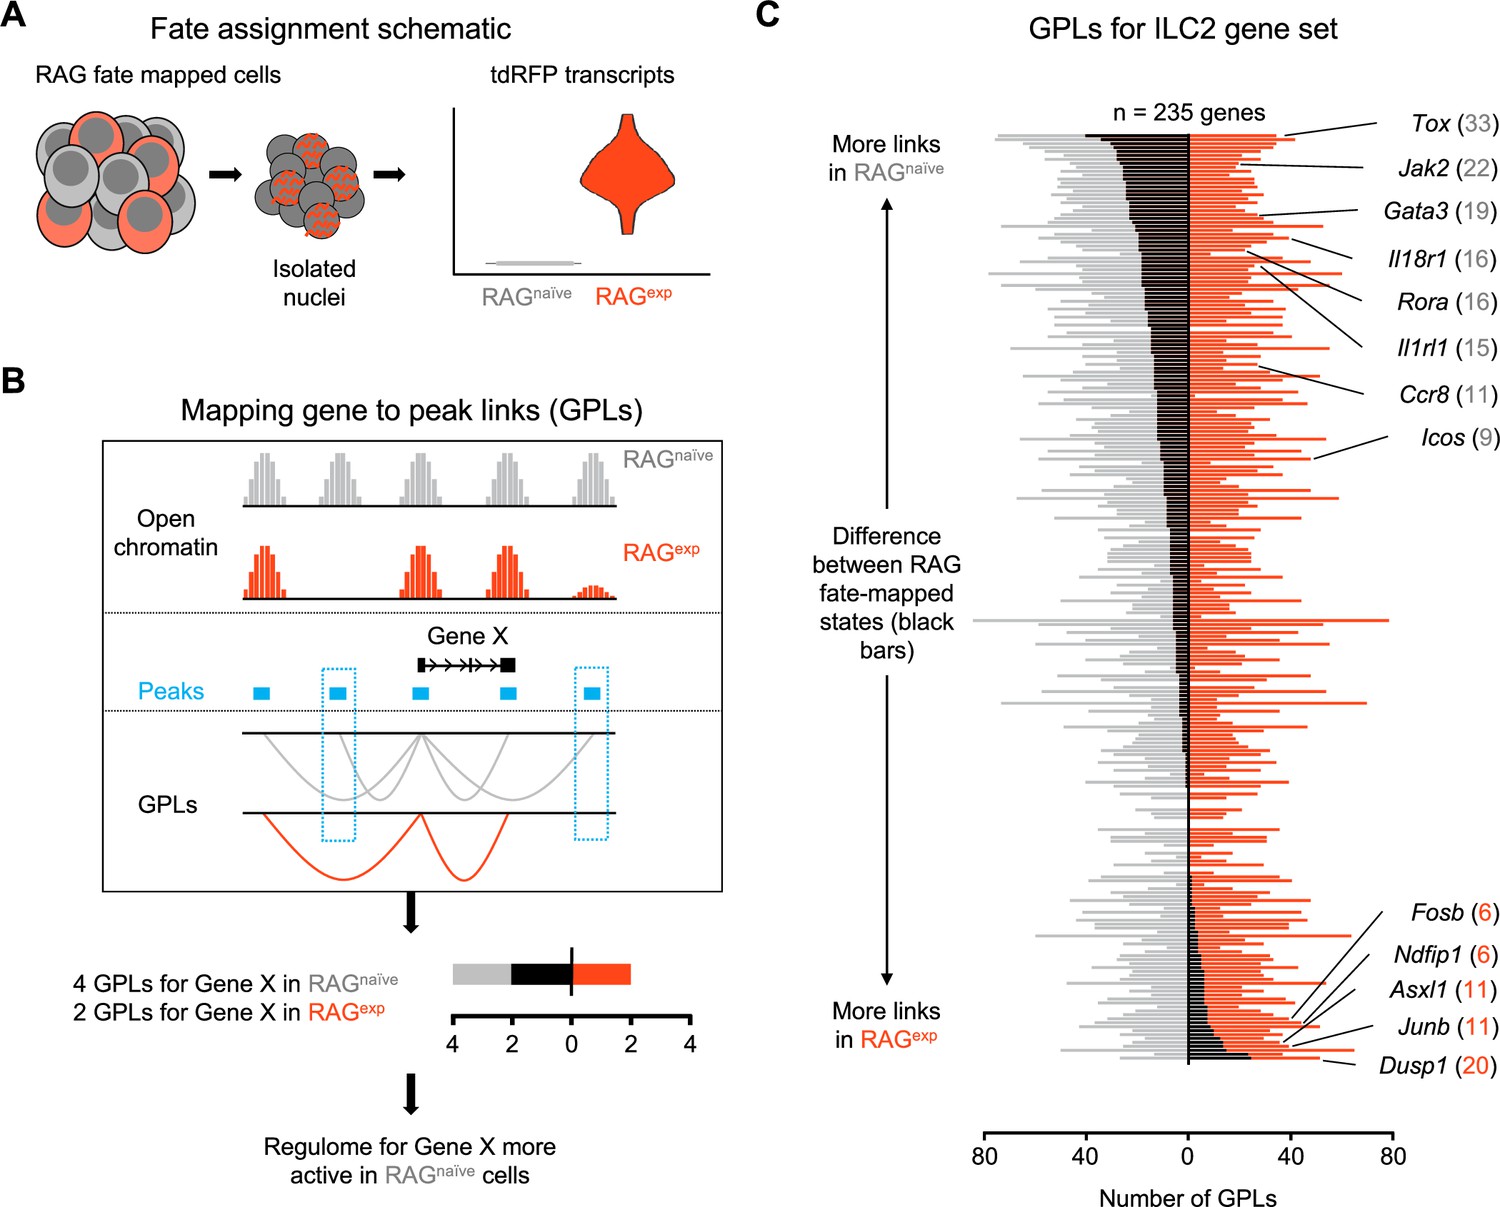
(A) Schematic of transcriptional RAG fate mapping. Sequenced cells from the RAG fate map mouse (see Figure 3A) transcribe tdRFP only after Cre is expressed from the Rag1 locus. Cells were assigned as either having a history of RAG expression (RAGexp - tomato red) or not (RAGnaïve - dark gray) based on the detection of tdRFP transcript in the RNA-seq data (Supplementary file 1, tdRFP sequence). (B) Schematic of mapping gene-to-peak links (GPLs). The LinkPeaks function of Signac (see methods) calculates significant correlations between open chromatin at defined peaks (teal bars) and nearby gene expression. These links represent inferred epigenomic-transcriptomic regulation, or ‘regulomes’ based on the correlated single-nuclei RNA (snRNA)- and single-nuclei ATAC (snATAC)-sequencing data. After calculating GPLs separately for each population (gray for RAGnaïve and tomato red for RAGexp), GPLs found in only one group, but not the other, can be identified (teal boxes). The difference in GPLs based on RAG experience for any given gene (e.g. Gene X) can be visualized on a bar graph, with the number of GPLs for RAGnaïve (gray - left) and RAGexp (red - right) plotted and the difference overlaid as a black bar. (C) GPLs calculated as in (B) for the multiomic ILC2 gene set identified in Figure 4H and (Supplementary file 1, Table S4). All identified GPLs are listed in Supplementary file 1, Table S7, while ILC2 GPLs are listed in Supplementary file 1, Table S8. Genes are sorted from more links identified in the RAGnaïve population at the top to more links identified in the RAGexp population at the bottom. Select genes are labeled. Full ranked list by the difference in GPLs is available in Supplementary file 1, Table S9.
Figure 5—figure supplement 1
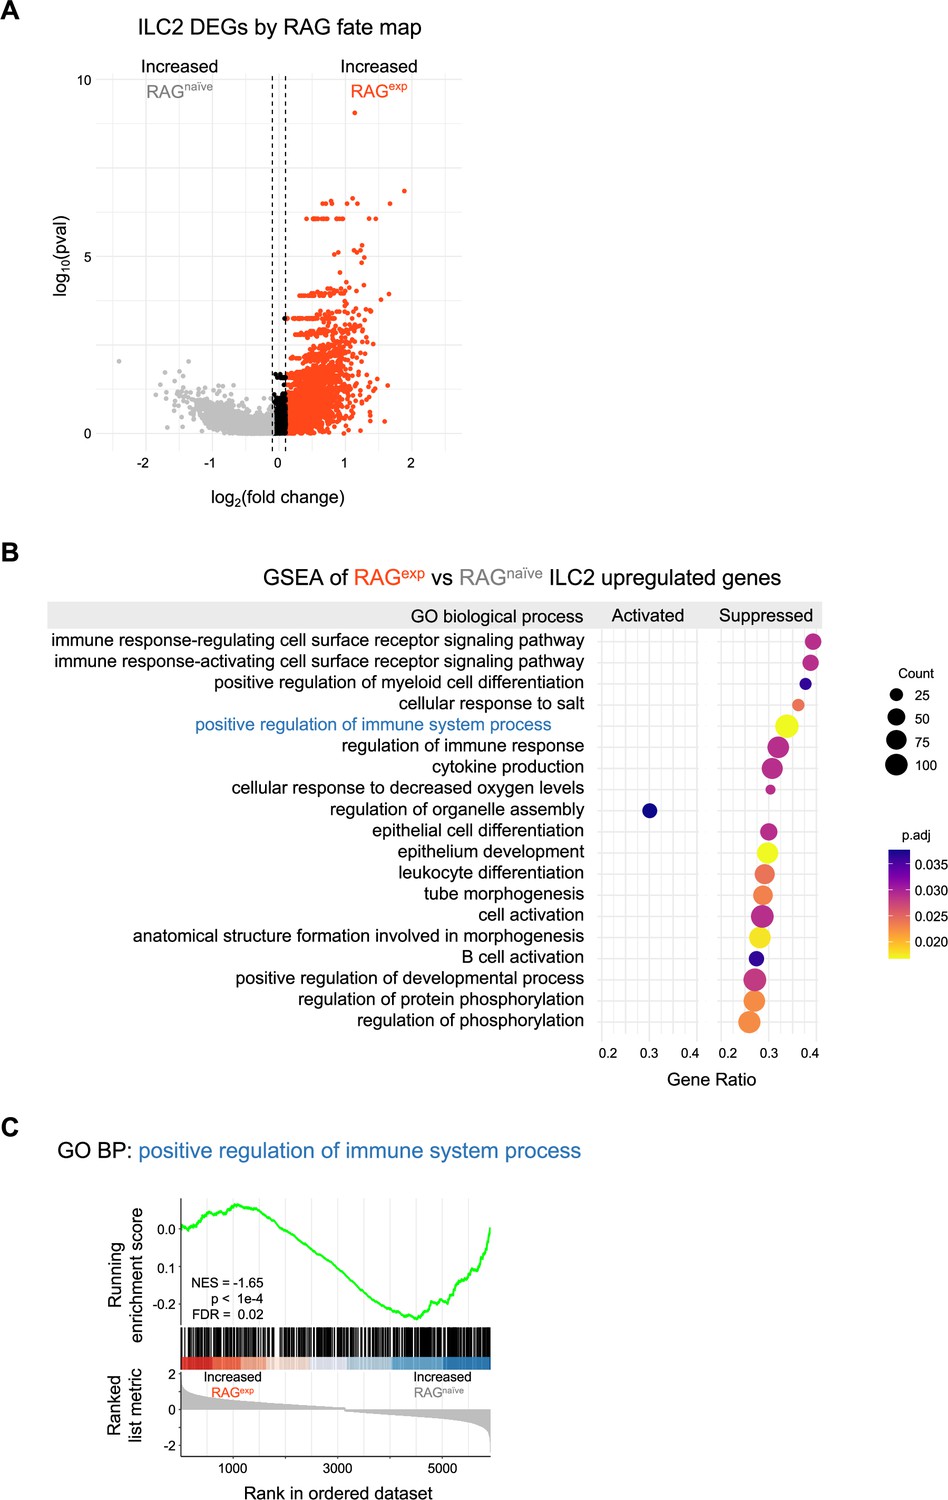
Gene set enrichment analysis of differentially expressed genes in group 2 innate lymphoid cells (ILC2s).
(A) Volcano plot of differentially expressed genes (DEGs) by recombinase activating gene (RAG) fate map for the ILC2 cluster. A ranked list (Supplementary file 1, Table S5) was constructed for all DEGs with log2(fold change)>0.1 for gene set enrichment analysis (GSEA). (B) Dotplot of GSEA result calculated using ClusterProfiler and the gene ontology (GO) biological process (BP) database (see methods). Full results in Supplementary file 1, Table S6. (C) GSEA plot of the GO BP ‘positive regulation of immune system process’ gene set. RAGnaïve, RAG fate map negative; RAGexp, RAG fate map positive.
Figure 5—figure supplement 2
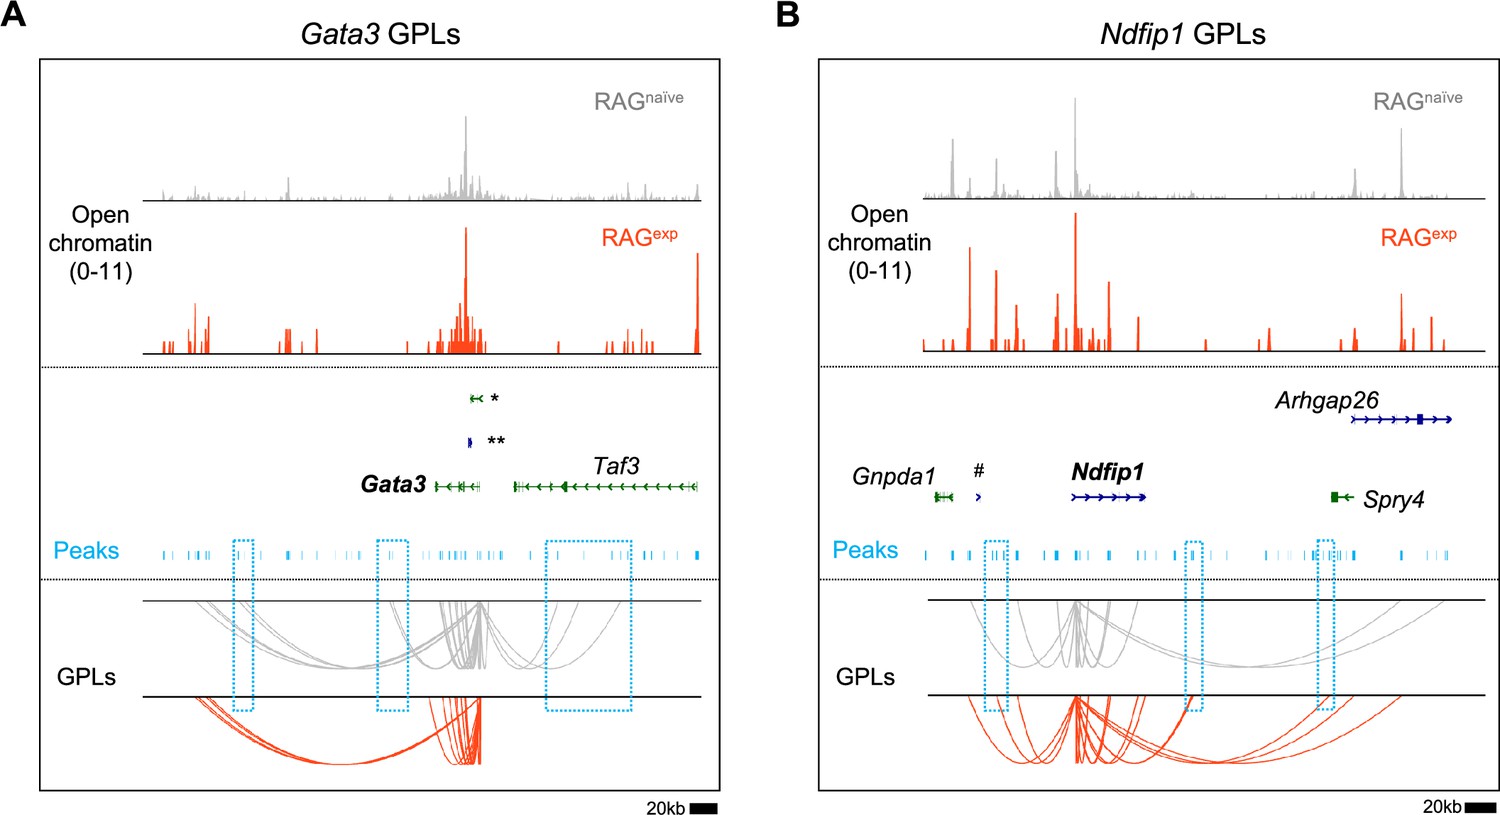
Mapping gene-to-peak links in select group 2 innate lymphoid cell (ILC2) genes.
Gene-to-peak links (GPLs) mapped for the RAGnaïve and RAGexp states as depicted in Figure 5B for (A) GATA binding protein 3 (Gata3) and (B) Nedd4 family interacting protein 1 (Ndfip1). Only GPLs that fit in the coverage window are shown. Select peaks (teal bars) present in one state, but not the other, are highlighted in teal boxes. Full gene names not shown in figure in (A) are *9230102O04Rik and **4930412O13Rik and in (B) #Gm42690.
Figure 5—figure supplement 3
Multiomic transcription factor analysis of group 2 innate lymphoid cells (ILC2s).
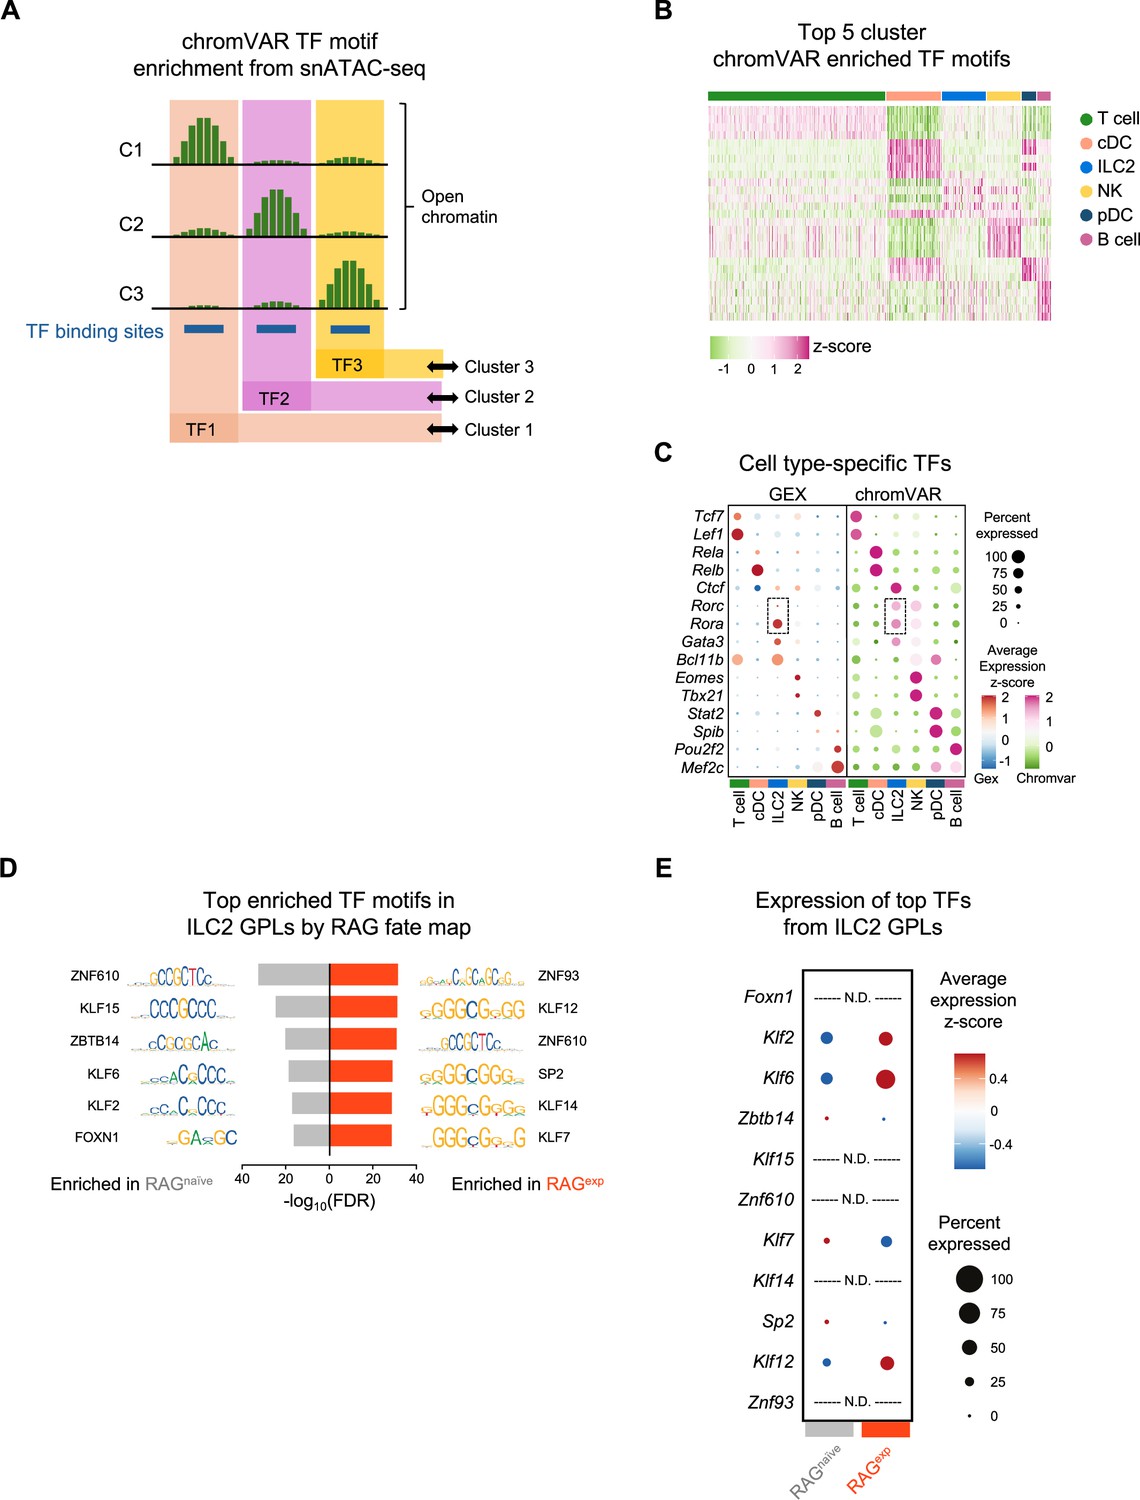
(A) Schematic of assigning transcription factor (TF) motif enrichment to cell clusters using chromVAR. Differentially open chromatin across cell clusters (e.g. C1, C2, C3) for TF binding sites containing TF motifs allows calculation of activity scores and assignment of particular TFs (e.g. TF1, TF2, TF3) as markers of specific cell populations. (B) Heatmap of top five TF motif activity scores for each cluster. (C) Dotplots comparing expression levels of selected TFs in the gene expression (GEX) assay with the chromVAR activity score of the corresponding TF motif. The TFs and corresponding motifs for Rora and Rorg in the ILC2 cluster are highlighted by boxes. An expanded list of cluster TF motif markers identified using chromVAR is in Supplementary file 1, Table S10. (D) Analysis of TF motifs enriched in ILC2 gene-to-peak links (GPLs) unique to RAGnaïve and RAGexp populations determined using the FindMotifs function in Signac. The top six TF motifs for each population are shown and are ranked by the -log10 transformed false discovery rate (FDR - Bonferroni corrected p-values). An expanded list is in Supplementary file 1, Table S11. (E) Dotplot of gene expression for TFs corresponding to the top enriched TF motifs identified in ILC2 GPLs from (D). TF genes that were not detected in the GEX assay are labeled N.D.
Figure 6 with 1 supplement
A history of recombinase activating gene (RAG) expression broadly influences group 2 innate lymphoid cell (ILC2) genes at steady state and in atopic dermatitis (AD)-like inflammation.
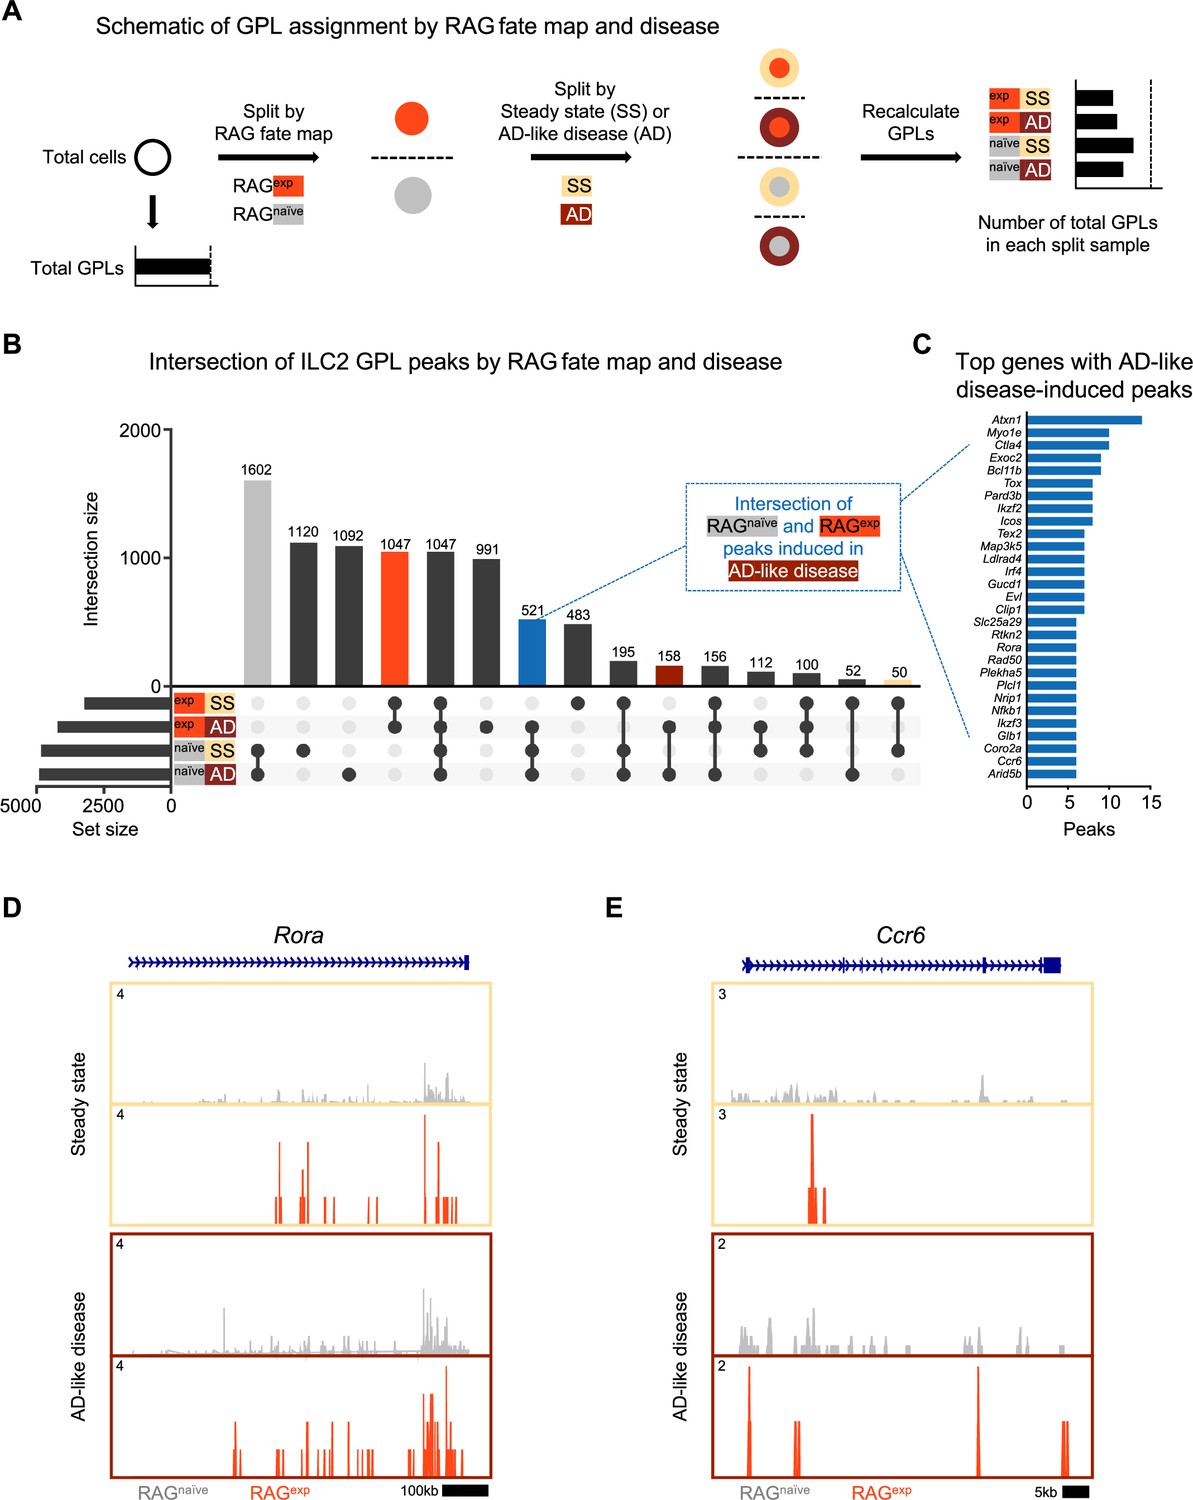
(A) Schematic of the process to determine the contribution of RAG fate map and disease states to gene-to-peak links (GPLs) for subsequent intersection analyses. GPLs were first calculated for all indicated cells, regardless of the disease state or fate map (see methods). Cells were then split, first by RAG fate map (RAGexp and RAGnaïve), and again by disease state (SS - steady state, AD - atopic dermatitis-like inflammation). GPLs were recalculated for each split sample and matched back to the original set of total GPLs. (B) UpSet plot visualizing intersections of peaks identified from ILC2 GPLs for split samples. Each row represents one of the four sets, and each column corresponds to an intersection of one or more sets (see methods). See Supplementary file 1, Table S12 for the full list of GPLs for all genes. Supplementary file 1, Table S13 lists the total and ILC2 peaks used for intersection analyses in each of the four sets. Columns identifying key intersections are color coded by the corresponding RAG fate map or treatment groups. The blue column indicates the intersection of peaks from RAGnaïve cells and peaks induced by AD-like disease in RAGexp cells. (C) Top genes with the most AD-like disease-induced peaks. Peaks from the intersection between RAGnaïve cells and inflamed RAGexp cells were identified in corresponding GPLs, and genes were ranked by the number of linked peaks identified. See Supplementary file 1, Table S14 for the full list of ranked genes and associated GPLs. Open chromatin in the ILC2 cell cluster split by disease (beige box – steady state; maroon box – AD-like disease) and by RAG fate map (RAGnaïve - gray, RAGexp - red) for the genomic loci of (D) Rora and (E) Ccr6.
Figure 6—figure supplement 1
Gene-to-peak link analysis by recombinase activating gene (RAG) fate map and disease for all detected genes.
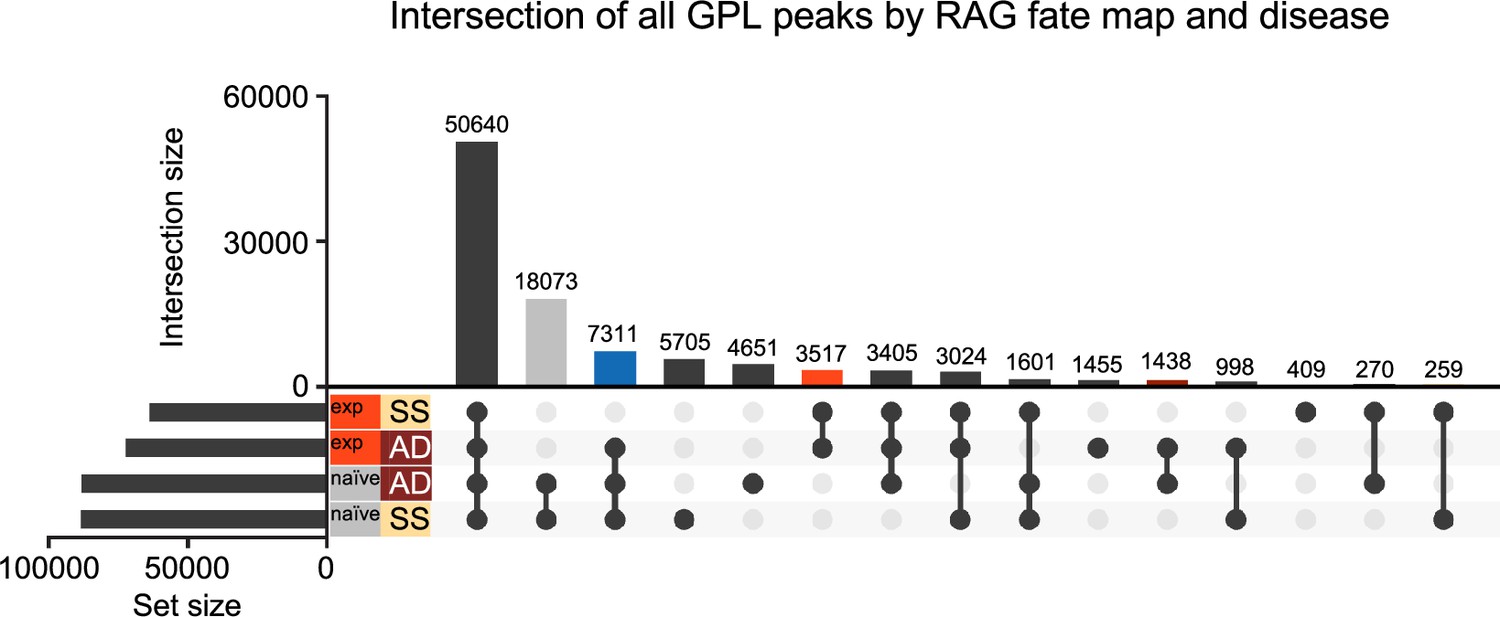
UpSet plot of overlaps in peaks identified from gene-to-peak links (GPLs) of all genes split by both RAG fate map (RAGexp and RAGnaïve) and disease state (SS - steady state, AD - atopic dermatitis-like inflammation). Each row corresponds to one of the four sets, and each column corresponds to an intersection of one or more sets (see methods). See Supplementary file 1, Table S13 for the full list of peaks from GPLs for all genes in each set. Columns identifying key intersections are color coded by the corresponding RAG fate map or disease groups. The blue column indicates the intersection of peaks from RAGnaïve cells and peaks induced by AD-like disease in RAGexp cells.
Figure 7 with 1 supplement
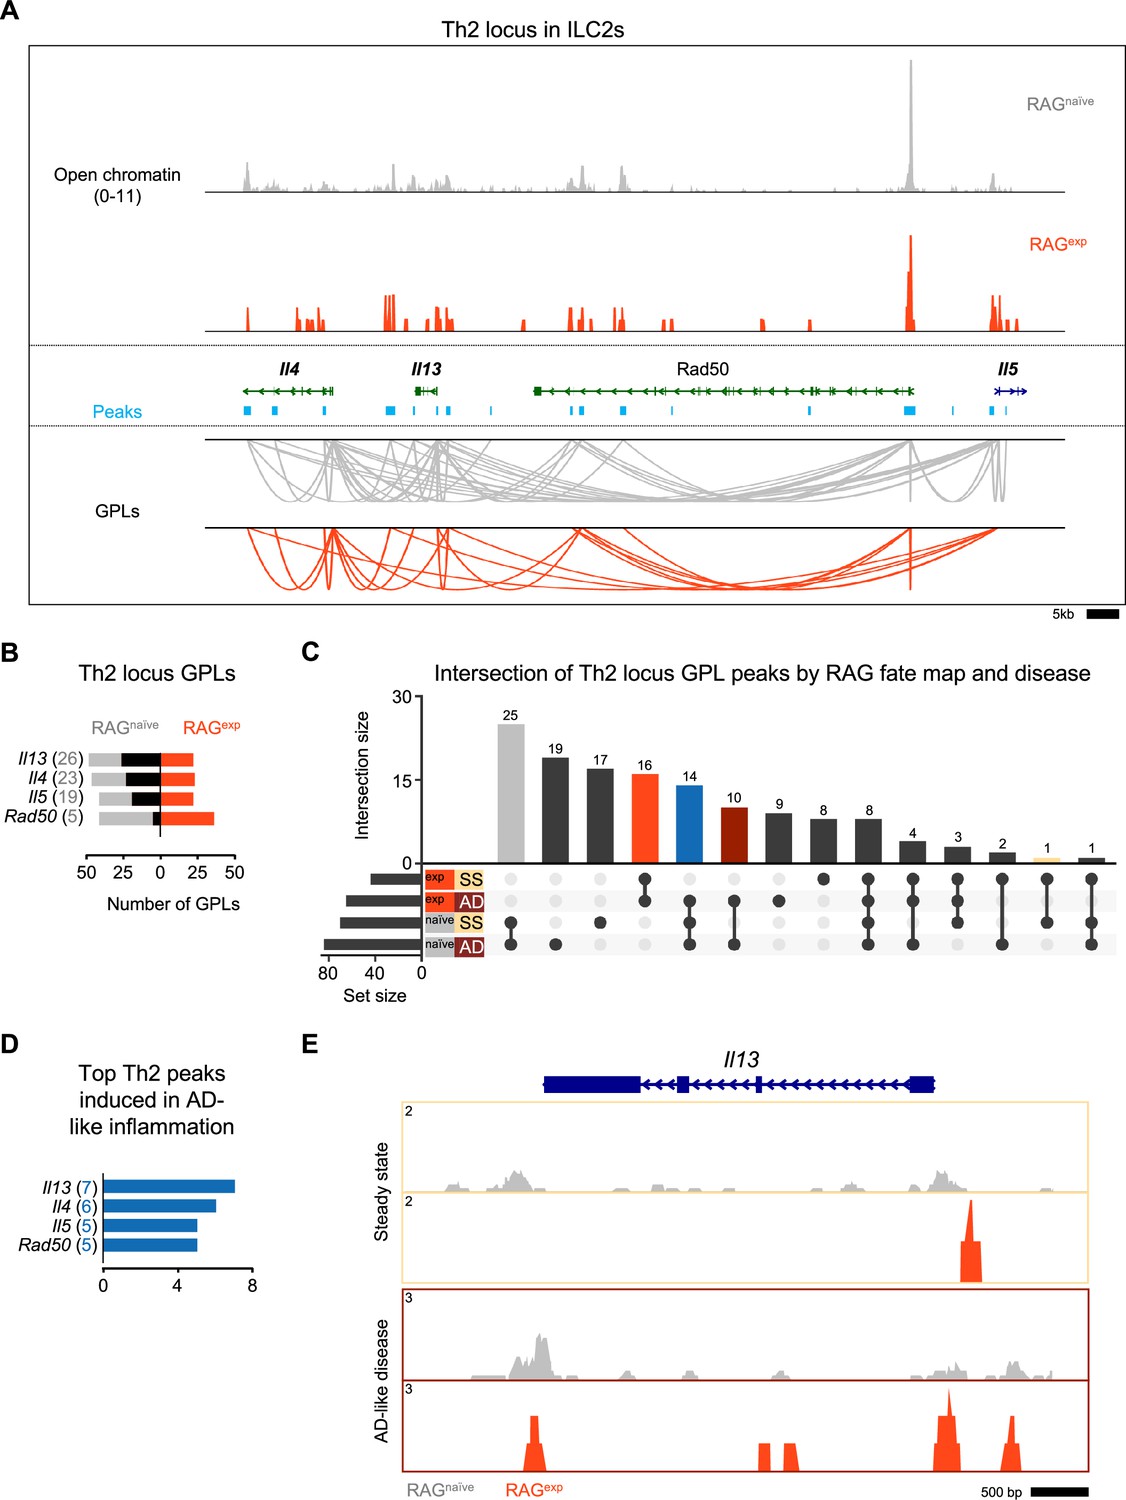
Recombinase activating gene (RAG) suppresses the Th2 locus.
(A) Coverage plot of the Th2 genomic locus. Open chromatin in the group 2 innate lymphoid cell (ILC2) cluster for each Rag1 fate-mapped state is shown on top, and corresponding peaks (teal) and gene-to-peaks links (GPLs) are shown below for the RAGnaïve sample (gray) and the RAGexp sample (tomato red). Only GPLs that fit in the coverage window are shown. (B) All GPLs identified in each fate map state for the Th2 locus genes Il4, Il13, Rad50, and Il5. See Supplementary file 1, Table S15 for the full list of Th2 GPLs. The number of GPLs for each gene is shown on the left in gray for RAGnaïve and on the right in tomato red for RAGexp. The difference is superimposed in black, and genes are sorted from more GPLs identified in RAGnaïve at the top to more links identified in RAGexp at the bottom. (C) UpSet plot of intersections of peaks identified from Th2 locus GPLs (calculated as in Figure 6A and B) separated by both RAG fate map status (RAGexp and RAGnaïve) and disease (SS - steady state, AD - atopic dermatitis-like inflammation). Each row represents one of the four sets of peaks, and each column corresponds to an intersection of one or more sets. See Supplementary file 1, Table S13 for the full list of peaks from GPLs for all genes, including Th2 genes, in each of the four sets. Columns identifying key intersections are color coded by the corresponding RAG fate map or disease groups. The blue column indicates the intersection of peaks from RAGnaïve cells and peaks induced in AD-like disease in RAGexp cells. (D) Th2 genes are sorted by the number of AD-like inflammation-induced peaks. Peaks induced by AD-like disease were identified in corresponding GPLs, and genes were ranked by the frequency of links to induced peaks (representation in identified GPLs). See Supplementary file 1, Table S17 for the full list of ranked Th2 locus genes and associated GPLs. (E) Open chromatin tracks, split by disease (beige box – steady state; maroon box – AD-like disease) and by RAG fate map (RAGnaïve - gray, RAGexp - red) for the Il13 genomic locus.
Figure 7—figure supplement 1

Multiomic transcription factor analysis of the Th2 locus.
(A) Analysis of transcription factor (TF) motifs enriched in the Th2 locus subset of ILC2 gene-to-peak links (GPLs) unique to RAGnaïve and RAGexp cell populations determined using the FindMotifs function in Signac. The top six TF motifs for each population are shown and are ranked by the -log10 transformed false discovery rate (FDR - Bonferroni corrected p values). No TFs met the -log10(FDR) minimum cutoff value of 1.5 in the RAGexp cell population. The full list of enriched motifs is in Supplementary file 1, Table S16. (B) Dotplot of gene expression for TFs corresponding to the top enriched TF motifs identified in Th2 locus GPLs from (A). TF genes that were not detected in the gene expression (GEX) assay are labeled N.D.
Author response image 1

GSEA plot of GOBP epithelial proliferation pathway in RAG-experienced vs RAG-naïve ILC2s.
Author response image 2
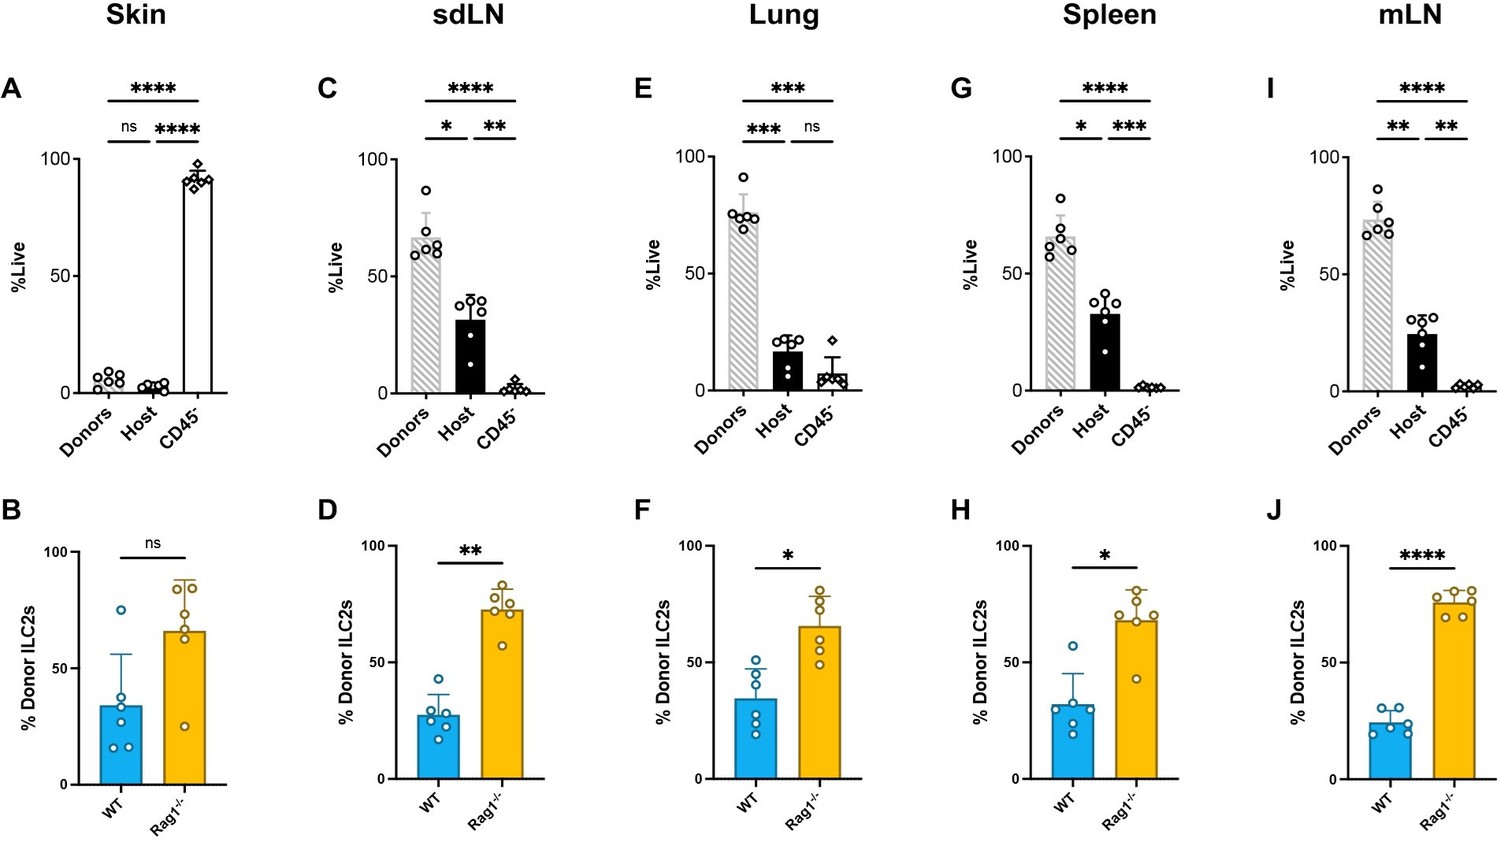
Comparison of immune reconstitution in and ILC2 donor proportions in different tissues from BM chimeras.
Equal quantities of bone marrow cells from Rag1-/- (CD45.2,CD90.2) and WT (CD45.2, CD90.1) C57BL/6J donor mice were used to reconstitute the immune systems of irradiated recipient WT (CD45.1) C57BL/6J mice. The proportion of live cells that are donor-derived (CD45.2), host-derived (CD45.1), or parenchymal (CD45-) [above] and proportion of ILC2s that are from Rag1-/- (CD90.2) or WT (CD90.1) donors [below] for (A,B) skin (C,D) sdLN (E,F) lung (G,H) spleen and (I,J) mLN.
Author response image 3
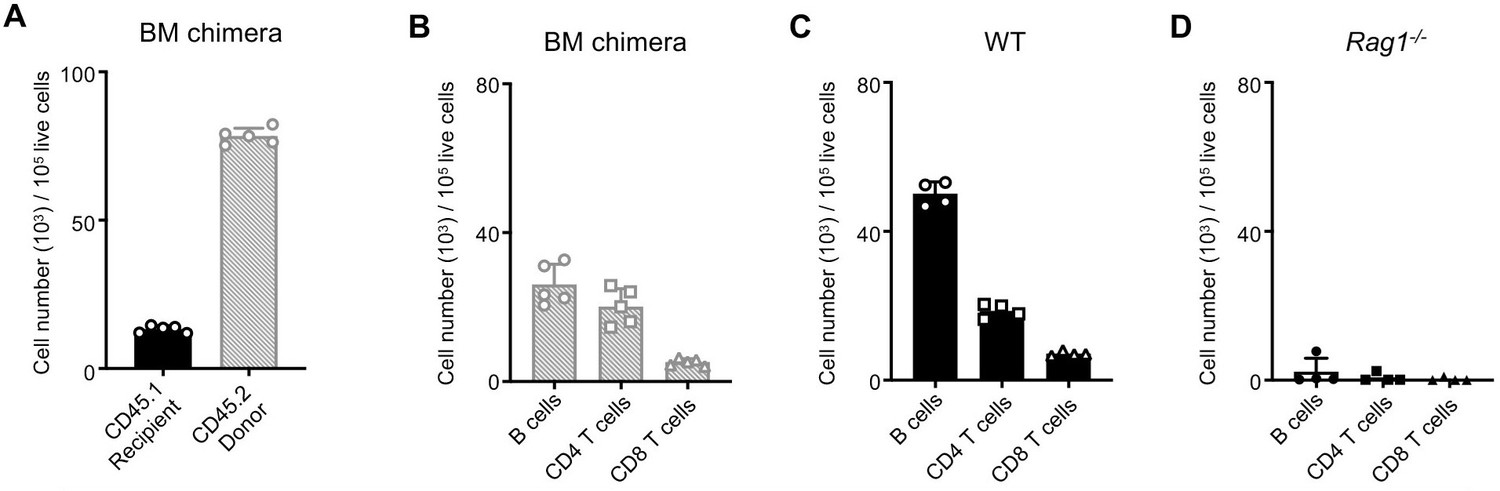
Comparison of immune reconstitution in BM chimeras to controls.
Equal quantities of bone marrow cells from Rag1-/- (CD45.2) and WT (CD45.2) C57BL/6J donor mice were used to reconstitute the immune systems of irradiated recipient WT (CD45.1) C57BL/6J mice. (A) Number of WT recipient CD45.1+ immune cells in the spleens of recipient mice compared to number of donor CD45.2+ cells (WT and Rag1-/-) normalized to 100,000 live cells. Comparison of numbers of B cells, CD4+ T cells, and CD8+ T cells in spleens of (B) BM chimera mice, (C) control WT mice and (D) control Rag1-/- mice.
Tables
Appendix 1—key resources table
| Reagent type (species) or resource | Designation | Source or reference | Identifiers | Additional information |
|---|---|---|---|---|
| Antibody | anti-mouse CD11b | eBioscience | Cat#: 45-0112-82; RRID:AB_953558 | FC (1:300) |
| Antibody | anti-mouse CD11c | eBioscience | Cat#: 45-0114-82; RRID:AB_925727 | FC (1:300) |
| Antibody | anti-mouse CD19 | eBioscience | Cat#: 45-0193-82; RRID:AB_1106999 | FC (1:300) |
| Antibody | anti-mouse CD3e | eBioscience | Cat#: 45-0031-82; RRID:AB_1107000 | FC (1:300) |
| Antibody | anti-mouse CD5 | eBioscience | Cat#: 45-0051-82; RRID:AB_914334 | FC (1:300) |
| Antibody | anti-mouse NK1.1 | eBioscience | Cat#: 45-5941-82; RRID:AB_914361 | FC (1:300) |
| Antibody | anti-mouse FcεR1α | eBioscience | Cat#: 11-5898-82; RRID:AB_465308 | FC (1:300) |
| Antibody | anti-mouse IL-13 | eBioscience | Cat#: 48-7136-42; RRID:AB_2784729 | FC (1:300) |
| Antibody | anti-mouse CD45.1 | BioLegend | Cat#: 110706; RRID:AB_313495 | FC (1:300) |
| Antibody | anti-mouse CD45.2 | BioLegend | Cat#: 109808; RRID:AB_313445 | FC (1:300) |
| Antibody | anti-mouse ICOS | BioLegend | Cat#: 313506; RRID:AB_416330 | FC (1:300) |
| Antibody | anti-mouse CD62L | BioLegend | Cat#: 104428; RRID:AB_830799 | FC (1:300) |
| Antibody | anti-mouse CD69 | BioLegend | Cat#: 104530; RRID:AB_2563062 | FC (1:300) |
| Antibody | anti-mouse KLRG1 | BioLegend | Cat#: 138424; RRID:AB_2564051 | FC (1:300) |
| Antibody | anti-mouse IL-5 | BioLegend | Cat#: 504306; RRID:AB_315330 | FC (1:300) |
| Antibody | anti-mouse IL-13 | BioLegend | Cat#: 503826; RRID:AB_2650897 | FC (1:300) |
| Antibody | anti-mouse IL-17A | BioLegend | Cat#: 506927; RRID:AB_11126144 | FC (1:300) |
| Antibody | anti-mouse IFNγ | BioLegend | Cat#: 505806; RRID:AB_315400 | FC (1:300) |
| Antibody | anti-mouse CD90.2 | BioLegend | Cat#: 105328; RRID:AB_10613293 | FC (1:300) |
| Antibody | anti-mouse IL-33Rα | BioLegend | Cat#: 145308; RRID:AB_2565569 | FC (1:150) |
| Antibody | anti-mouse IL-33Rα | BioLegend | Cat#: 145327; RRID:AB_2565569 | FC (1:150) |
| Antibody | anti-mouse CD8a | BioLegend | Cat#: 100762; RRID:AB_2564027 | FC (1:300) |
| Antibody | anti-mouse CD25 | BioLegend | Cat#: 102016; RRID:AB_312865 | FC (1:300) |
| Antibody | anti-mouse CD45.2 | BioLegend | Cat#: 109806; RRID:AB_313443 | FC (1:300) |
| Antibody | anti-mouse CD90.2 | BioLegend | Cat#: 109830; RRID:AB_1186098 | FC (1:300) |
| Antibody | anti-mouse CD4 | BioLegend | Cat#: 100449; RRID:AB_2564587 | FC (1:300) |
| Antibody | anti-mouse Gata3 | BioLegend | Cat#: 653814; RRID:AB_2563221 | FC (1:300) |
| Antibody | anti-mouse CD25 | BioLegend | Cat#: 102036; RRID:AB_2563059 | FC (1:300) |
| Antibody | anti-mouse CD90.1 | BioLegend | Cat#: 202537; RRID:AB_2562644 | FC (1:300) |
| Antibody | anti-mouse CD3e | BioLegend | Cat#: 155608; RRID:AB_2750434 | FC (1:300) |
| Antibody | anti-mouse CD3e | BioLegend | Cat#: 100339; RRID:AB_11150783 | FC (1:300) |
| Antibody | anti-mouse CD28 | BioLegend | Cat#: 102115; RRID:AB_11150408 | FC (1:300) |
| Antibody | anti-mouse CD3 | BioLegend | Cat#: 100243; RRID:AB_2563946 | FC (1:300) |
| Antibody | anti-mouse CD19 | BioLegend | Cat#: 115503; RRID:AB_313638 | FC (1:300) |
| Antibody | anti-mouse CD11b | BioLegend | Cat#: 101203; RRID:AB_312786 | FC (1:300) |
| Antibody | anti-mouse IL-4 | BioLegend | Cat#: 504109; RRID:AB_493320 | FC (1:300) |
| Antibody | anti-mouse CD117 (c-Kit) | BioLegend | Cat#: 105838; RRID:AB_2616739 | FC (1:300) |
| Antibody | anti-mouse CD49b | Invitrogen | Cat#: 17-5971-82; RRID:AB_469485 | FC (1:300) |
| Antibody | anti-mouse CD45R/B220 | BioLegend | Cat#: 103275; RRID:AB_2860602 | FC (1:300) |
| Antibody | anti-mouse I-A/I-E (MHCII) | BioLegend | Cat#: 107622; RRID:AB_493727 | FC (1:300) |
| Antibody | anti-mouse Ly-6A/E (Sca-1) | BioLegend | Cat#: 122512; RRID:AB_756197 | FC (1:300) |
| Antibody | anti-mouse F4/80 | BioLegend | Cat#: 123112; RRID:AB_893482 | FC (1:300) |
| Antibody | anti-mouse SiglecF | BD Biosciences | Cat#: 562757; RRID:AB_2687994 | FC (1:300) |
| Antibody | anti-mouse TCR γ/δ | eBioscience | Cat#: 48-5711-82; RRID:AB_2574071 | FC (1:300) |
| Antibody | anti-mouse Ly-6G | eBioscience | Cat#: 62-9668-82; RRID:AB_2762763 | FC (1:300) |
| Antibody | anti-mouse CD16/CD32 | Bio X Cell | Cat#: BE0307; RRID:AB_1107647 | FC (1:300) |
| Antibody | streptavidin | BioLegend | Cat#: 405204 | FC (1:300) |
| Antibody | streptavidin | BioLegend | Cat#: 405207 | FC (1:300) |
| Chemical compound, drug | Phorbol 12-myristate 13-acetate (PMA) | Sigma | P1585 | |
| Chemical compound, drug | Ionomycin | Sigma | I0634 | |
| Chemical compound, drug | Monensin | Biolegend | 420701 | |
| Chemical compound, drug | Brefeldin A Solution | Biolegend | 420601 | |
| Chemical compound, drug | Calcipotriol (MC903) | Tocris Biosciences | 2700 | |
| Chemical compound, drug | DMSO | Invitrogen | D12345 | |
| Chemical compound, drug | Nuclei Buffer (20 X) | 10 x Genomics | 2000153/2000207 | |
| Chemical compound, drug | Digitonin | ThermoFisher | BN2006 | |
| Chemical compound, drug | Nonidet P40 Substitute | Sigma | 74385 | |
| Chemical compound, drug | Protector RNase inhibitor | Sigma | 3335402001 | |
| Chemical compound, drug | Tween 20 | Bio-Rad | 1662404 | |
| Other | ZombieNIR | Biolegend | 423106 | Viability stain (1:500) |
| Other | ZombieUV | Biolegend | 423107 | Viability stain (1:500) |
| Strain, strain background (Mus musculus, C57BL/6) | B6 WT | Jackson Laboratory | C57BL/6J; Cat# 000664 | |
| Strain, strain background (M. musculus, C57BL/6) | Rag1-/- | Jackson Laboratory | B6.129S7-Rag1tm1Mom/J; Cat# 002216 | |
| Strain, strain background (M. musculus, C57BL/6) | Rag2-/- | Jackson Laboratory | B6.Cg-Rag2tm1.1Cgn/J; Cat# 002014 | |
| Strain, strain background (M. musculus, C57BL/6) | B6 CD45.1 | Jackson Laboratory | B6.SJL-Ptprca Pepcb/BoyJ; Cat# 008450 | |
| Strain, strain background (M. musculus, C57BL/6) | B6 CD90.1 | Jackson Laboratory | B6.PL-Thy1a/CyJ; Cat# 000406 | |
| Strain, strain background (M. musculus, C57BL/6) | Rag1-Cre x Rosa26-tdRFP fate-map mice | Joseph Sun (Weill Cornell Medical College) | Rag1-Cre - MGI:3584018 Rosa26-tdRFP - MGI:3696099 | Published references Karo et al., 2014; Welner et al., 2009 |
| Software, algorithm | BD FACSDiva (v8.0) | BD Life Sciences | RRID:SCR_001456 | https://www.bdbiosciences.com/en-us/products/software/instrument-software/bd-facsdiva-software |
| Software, algorithm | FlowJo (v10.8) | BD Life Sciences | RRID:SCR_008520 | https://www.flowjo.com/ |
| Software, algorithm | SpectroFlo (v3.0) | CYTEK | RRID:SCR_025494 | https://cytekbio.com/pages/spectro-flo |
| Software, algorithm | Prism 9 | GraphPad Software | RRID:SCR_002798 | https://www.graphpad.com/scientific-software/prism/ |
| Software, algorithm | R (v4.2.2) | R core | RRID:SCR_001905 | https://www.r-project.org/ |
| Software, algorithm | Seurat (v4.2.0) | Seurat Hao et al., 2021 | RRID:SCR_007322 | https://github.com/satijalab/seurat |
| Software, algorithm | Signac (v1.8.0) | Signac Stuart et al., 2021 | RRID:SCR_021158 | https://github.com/stuart-lab/signac |
| Software, algorithm | chromVAR (v1.18.0) | chromVAR Schep et al., 2017 | RRID:SCR_026570 | https://github.com/GreenleafLab/chromVAR |
| Software, algorithm | JASPAR2022 (v0.99.7) | JASPAR2022 | RRID:SCR_003030 | https://github.com/da-bar/JASPAR2022 |
| Software, algorithm | SoupX (v1.6.1) | SoupX Young and Behjati, 2020 | RRID:SCR_019193 | https://github.com/constantAmateur/SoupX |
| Software, algorithm | clusterProfiler (v4.4.4) | clusterProfiler Wu et al., 2021 | RRID:SCR_016884 | https://github.com/YuLab-SMU/clusterProfiler |
| Software, algorithm | singleCellTK (v2.6.0) | singleCellTK Wang et al., 2022 | RRID:SCR_026813 | https://github.com/compbiomed/singleCellTK |
| Software, algorithm | biomaRt (v2.52.0) | biomaRt Durinck et al., 2009 | RRID:SCR_019214 | https://github.com/grimbough/biomaRt |
| Software, algorithm | EnsDb.Mmusculus.v79 (v2.99.0) | EnsDb.Mmusculus.v79 Rainer, 2017 | RRID:SCR_002344 | https://bioconductor.org/packages/release/data/annotation/html/EnsDb.Mmusculus.v79.html |
| Software, algorithm | BSgenome.Mmusculus. UCSC.mm10 (v1.4.3) | BSgenome.Mmusculus. UCSC.mm10 Team, 2021 | RRID:SCR_024230 | https://bioconductor.org/packages/release/data/annotation/html/BSgenome.Mmusculus.UCSC.mm10.html |
| Software, algorithm | ggplot2 (v3.3.6) | ggplot2 Wickham, 2016 | RRID:SCR_014601 | https://github.com/tidyverse/ggplot2 |
| Software, algorithm | viridis (v0.6.2) | viridis Garnier et al., 2021 | RRID:SCR_016696 | https://github.com/sjmgarnier/viridis |
| Software, algorithm | TFBSTools (v1.34.0) | TFBSTools Tan and Lenhard, 2016 | RRID:SCR_024260 | https://bioconductor.org/packages/release/bioc/html/TFBSTools.html |
| Software, algorithm | motifmatchr (v1.18.0) | motifmatchr Schep, 2022 | RRID:SCR_026739 | https://github.com/GreenleafLab/motifmatchr |
| Software, algorithm | BioVenn/BioVennR | BioVenn Hulsen et al., 2008 | RRID:SCR_026853 | https://www.biovenn.nl/ |
| Software, algorithm | UpSetR | UpSetR Conway et al., 2017 | RRID:SCR_026112 | http://gehlenborglab.org/research/projects/upsetr/ |
| Software, algorithm | Cell Ranger ARC | Cell Ranger ARC Zheng et al., 2017; Satpathy et al., 2019 | RRID:SCR_023897 | https://support.10xgenomics.com/single-cell-multiome-atac-gex/software/overview/welcome |
Additional files
-
MDAR checklist
- https://cdn.elifesciences.org/articles/98287/elife-98287-mdarchecklist1-v1.pdf
-
Supplementary file 1
Sequence file of the tandem dimer red fluorescent protein (tdRFP) transgene present in the Rosa26-LSL-tdRFP reporter mouse in FASTA format.
This sequence was appended to the mm10 mouse reference genome to enable the detection and annotation of tdRFP transcripts in the scRNA-sequencing data. Tables S01-S17. See text for details of table contents.
- https://cdn.elifesciences.org/articles/98287/elife-98287-supp1-v1.zip
Download links
A two-part list of links to download the article, or parts of the article, in various formats.
Downloads (link to download the article as PDF)
Open citations (links to open the citations from this article in various online reference manager services)
Cite this article (links to download the citations from this article in formats compatible with various reference manager tools)
RAG suppresses group 2 innate lymphoid cells
eLife 13:RP98287.
https://doi.org/10.7554/eLife.98287.3


