Targeting the WSB2–NOXA axis in cancer cells for enhanced sensitivity to BCL-2 family protein inhibitors
- State Key Laboratory of Genetics and Development of Complex Phenotypes, Shanghai Stomatological Hospital and School of Stomatology, MOE Engineering Research Center of Gene Technology, Shanghai Engineering Research Center of Industrial Microorganisms, School of Life Sciences, Fudan University, China
- Department of Urology, Fudan University Shanghai Cancer Center, China
- Department of Oncology, Shanghai Medical College, Fudan University, China
- Department of Urology, Inner Mongolia Urological Institute, Inner Mongolia Autonomous Region People's Hospital, China
- Department of Vascular Surgery, Zhongshan Hospital, Fudan University, China
- Department of Clinical Laboratory, Shanghai First Maternity and Infant Hospital, School of Medicine, Tongji University, China
- Shanghai Key Laboratory of Maternal and Fetal Medicine, Shanghai First Maternity and Infant Hospital, China
- Department of Urology, Shanghai Fourth People's Hospital Affiliated to Tongji University School of Medicine, China
Figures
Figure 1 with 1 supplement
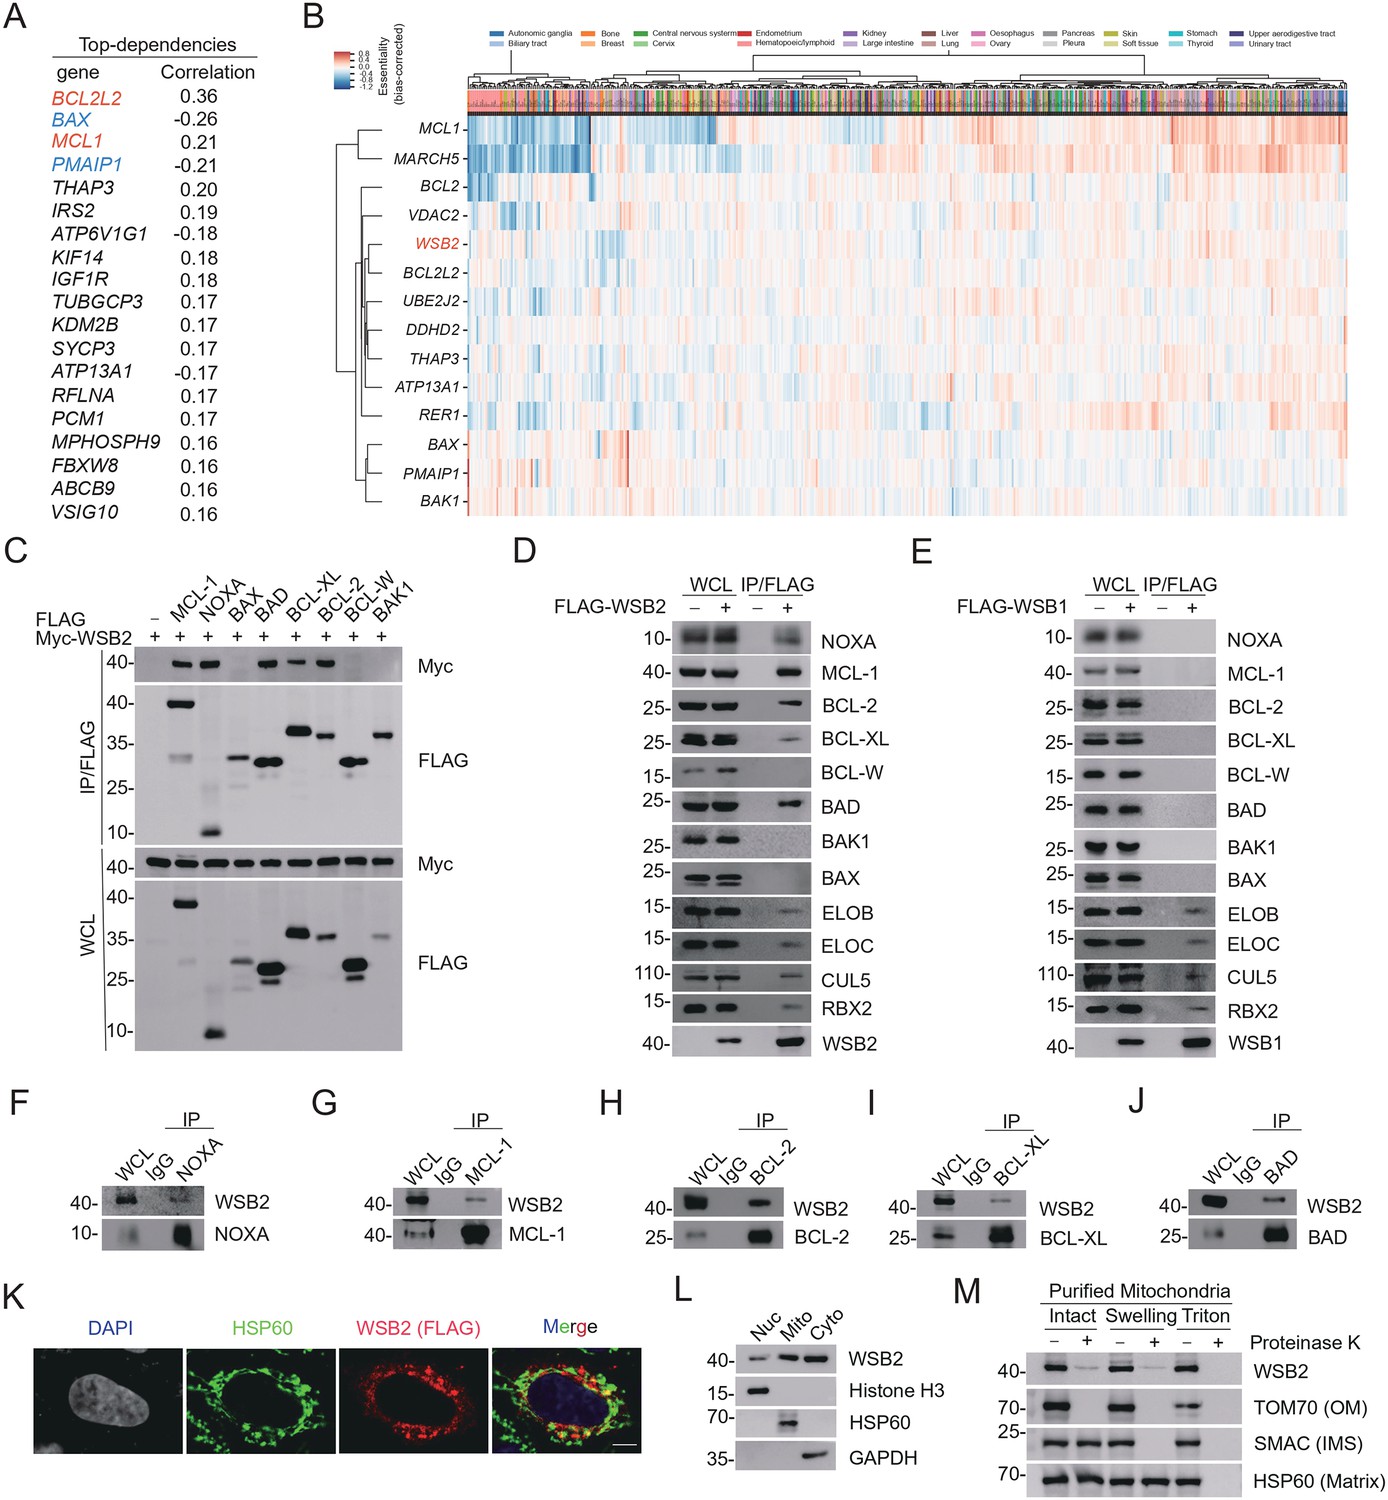
WSB2 interacts with multiple members of BCL-2 family proteins in cells.
(A) The top 20 co-dependent genes of WSB2 in Broad’s 21Q2 DepMap dataset. Red, anti-apoptotic BCL-2 family proteins. Blue, pro-apoptotic BCL-2 family proteins. (B) A co-essential module containing WSB2 and other BCL-2 family proteins using a dataset of CRISPR screens from the Achilles DepMap project (hhttps://mitra.stanford.edu/bassik/michael/cluster_heatmaps/). Cellular component: Bcl-2 family protein complex. Molecular function: BH domain binding. (C–E) Western blot (WB) analyses of the indicated proteins in the WCL and co-immunoprecipitation (Co-IP) samples of anti-FLAG antibody obtained from 293T cells transfected with the indicated plasmids. WB analyses of the indicated proteins in the WCL and Co-IP samples of IgG or anti-NOXA (F), anti-MCL-1 (G), anti-BCL-2 (H), anti-BCL-XL (I), or anti-BAD (J) antibodies obtained from 293T cells. (K) Representative immunofluorescence (IF) images from HeLa cells transfected with FLAG-WSB2, stained with FLAG (WSB2), HSP60, and DAPI. Scale bar, 20 μm. (L) The cytoplasmic (Cyto), mitochondrial (Mito), and nuclear fractions (Nuc) from HeLa cells were prepared as described in the Methods section. Histone H3 (nucleus), GAPDH (cytoplasm), and HSP60 (mitochondria) were used as subcellular fraction markers. WB analyses were performed to detect the indicated proteins in three fractions from HeLa cells. (M) Mitochondria from HeLa cells were purified as intact mitochondria or treated with hypotonic swelling buffer or lysed with Triton X-100 buffer. Different mitochondrial preparations were then digested with or without Proteinase K. WB analyses of the indicated proteins in three fractions were then performed. OM: outer membrane; IMS: intermembrane space.
-
Figure 1—source data 1
Original file for the western blot analysis in Figure 1.
- https://cdn.elifesciences.org/articles/98372/elife-98372-fig1-data1-v1.zip
-
Figure 1—source data 2
Labeled file for the western blot analysis in Figure 1.
- https://cdn.elifesciences.org/articles/98372/elife-98372-fig1-data2-v1.zip
-
Figure 1—source data 3
Original file for the images in Figure 1.
- https://cdn.elifesciences.org/articles/98372/elife-98372-fig1-data3-v1.zip
Figure 1—figure supplement 1

WSB2 is involved in apoptosis-related pathways and shows significant associations with BH3 mimetic compounds.
(A) GO enrichment analysis of biological processes was performed on the top 100 co-dependent genes of WSB2 in the Broad’s 21Q2 DepMap dataset. The biological processes were ranked based on fold enrichment values, with the most significant processes highlighted in red and the less significant processes highlighted in blue, according to log10(FDR) values. In the graph, larger dots represent a higher number of genes involved in a particular process. (B, C) Gene effect scores of query gene and the drug selected. Each dot is a cell line of the selected cancer type(s). Drug sensitivity is represented by log-fold change (PRISM) or IC50 (GDSC), where a more negative value denotes stronger treatment response.
Figure 2 with 2 supplements
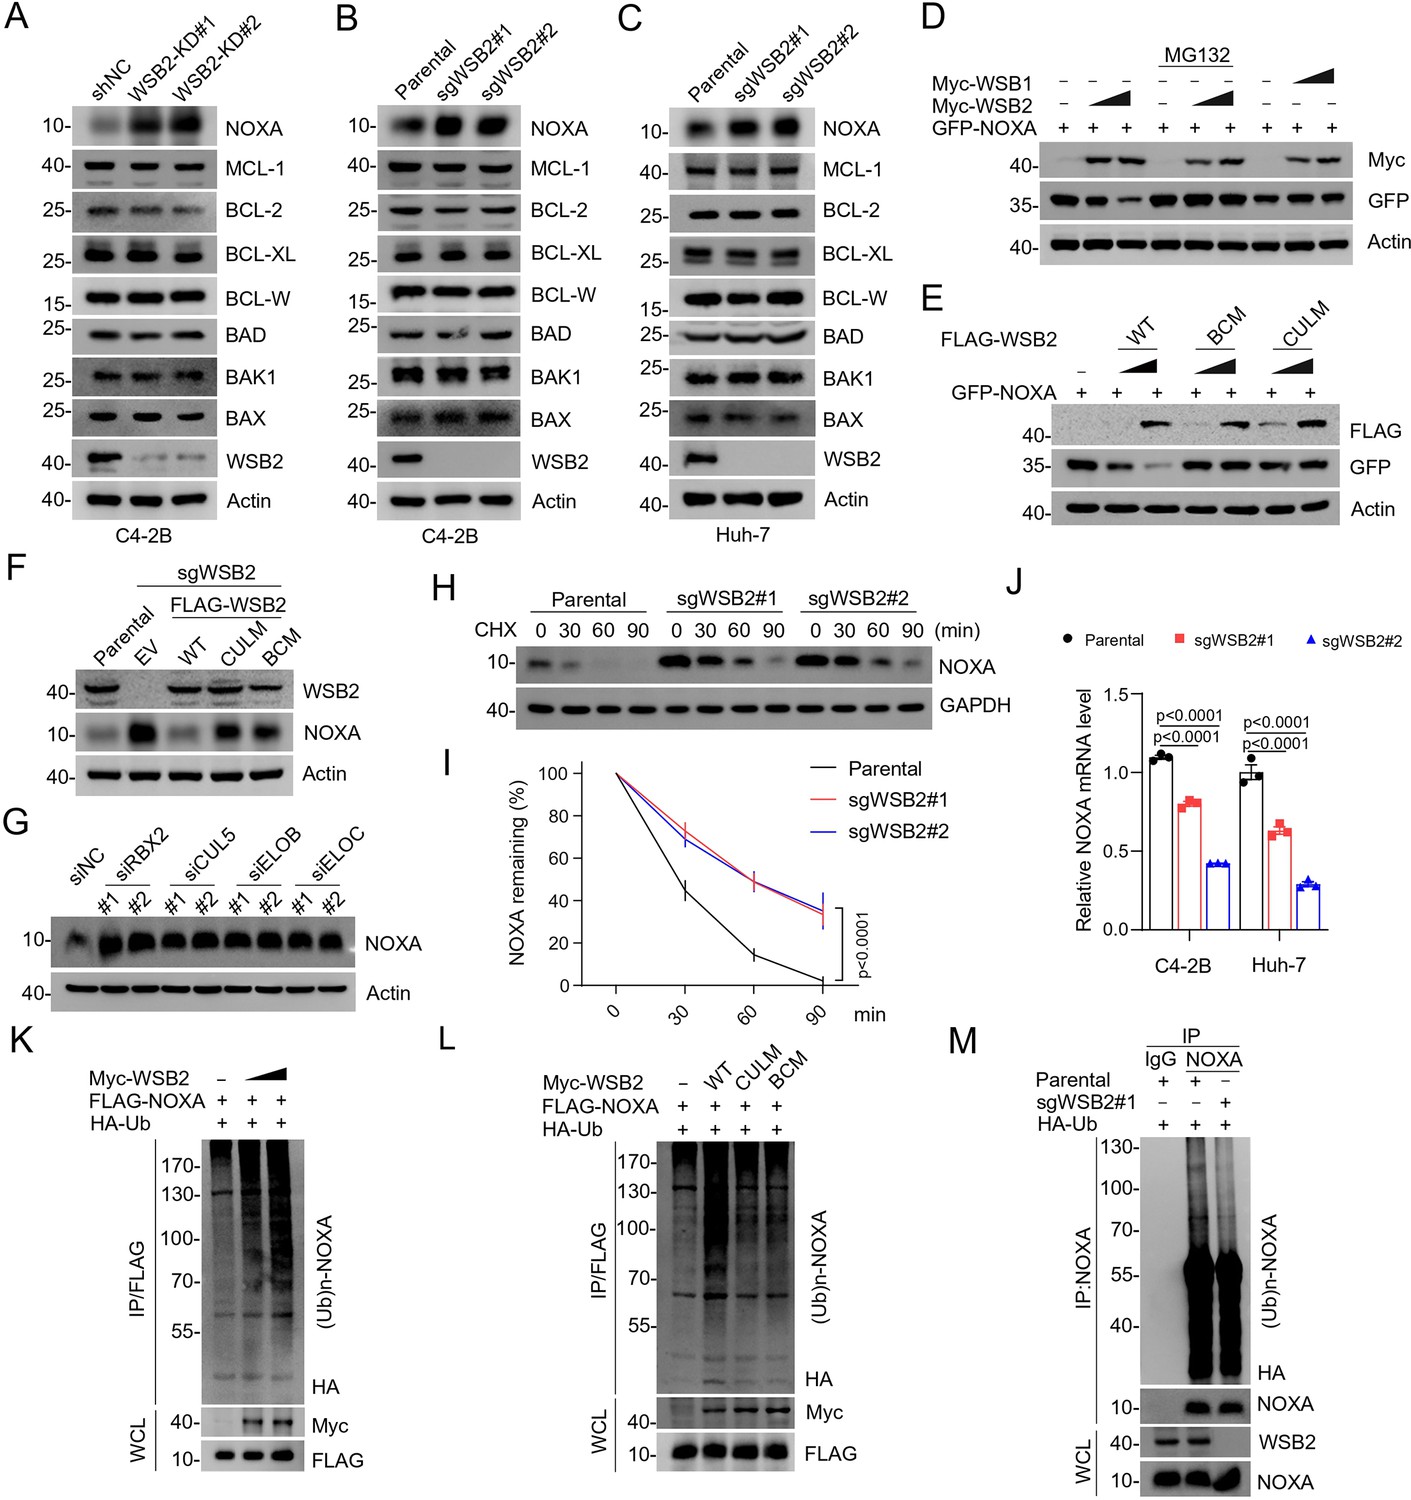
The CRL5WSB2 E3 ubiquitin ligase complex controls NOXA protein turnover.
(A) Western blot (WB) analyses of the indicated proteins in the WCL from C4-2B cells infected with lentivirus expressing WSB2-specific short hairpin RNA (shRNA) or negative control (NC). (B, C) WB analyses of the indicated proteins in the WCL from parental or WSB2 KO C4-2B or Huh-7 cells. (D) WB analyses of the indicated proteins in the WCL from 293T cells transfected with the indicated plasmids for 24 hr and treated with DMSO or MG132 (20 μM) for 8 hr. (E) WB analyses of the indicated proteins in the WCL from 293T cells transfected with the indicated plasmids. (F) WB analyses of the indicated proteins in the WCL from parental or WSB2 KO C4-2B cells stably overexpressing empty vector (EV), WSB2-WT or its mutants. (G) WB analyses of the indicated proteins in the WCL from C4-2B cells transfected with the indicated siRNAs. (H, I) WB analyses of indicated proteins in the WCL of parental and WSB2 KO C4-2B cells treated with cycloheximide (CHX, 50 μg/ml) and harvested at different time points. (I) At each time point, the intensity of NOXA was normalized to the intensity of GAPDH and then to the value at 0 hr. Data are shown as means ± SE (n = 3). (J) RT-qPCR measurement of NOXA mRNA expression in parental or WSB2 KO C4-2B or Huh-7 cells. Data are shown as means ± SE (n = 3). (K, L) WB analyses of the products of in vivo ubiquitination assays performed using WCL from 293T cells transfected with the indicated plasmids and treated with MG132 (20 μM). (M) WB analyses of the products of in vivo ubiquitination assays. Co-immunoprecipitation (Co-IP) using anti-IgG or anti-NOXA antibody in the WCL prepared from parental and WSB2 KO C4-2B cells transfected with HA-Ub for 24 hr and treated with MG132 (20 μM) for 8 hr. p values are calculated by the two-way ANOVA test in (I) and one-way ANOVA test in (J). n.s., non-significant.
-
Figure 2—source data 1
Original file for the western blot analysis in Figure 2.
- https://cdn.elifesciences.org/articles/98372/elife-98372-fig2-data1-v1.zip
-
Figure 2—source data 2
Labeled file for the western blot analysis in Figure 2.
- https://cdn.elifesciences.org/articles/98372/elife-98372-fig2-data2-v1.zip
Figure 2—figure supplement 1

The CRL5WSB2 E3 ubiquitin ligase complex controls NOXA protein turnover.
(A) Western blot (WB) analyses of the indicated proteins in the WCL from 293T cells transfected with the indicated plasmids. (B) The canonical BC box and CUL5 box sequences of WSB2, as well as the amino acid deletions corresponding to each mutant, are indicated. (C) WB analyses of the indicated proteins in the WCL from Huh-7 cells transfected with the indicated siRNAs. (D) WB analyses of the indicated proteins in the WCL and Co-IP samples of IgG or anti-NOXA antibodies obtained from 293T cells. (E) WB analyses of the products of in vivo ubiquitination assays performed using the WCL from 293T cells transfected with the indicated plasmids and treated with MG132 (20 μM).
-
Figure 2—figure supplement 1—source data 1
Original file for the western blot analysis in Figure 2—figure supplement 1.
- https://cdn.elifesciences.org/articles/98372/elife-98372-fig2-figsupp1-data1-v1.zip
-
Figure 2—figure supplement 1—source data 2
Labeled file for the western blot analysis in Figure 2—figure supplement 1.
- https://cdn.elifesciences.org/articles/98372/elife-98372-fig2-figsupp1-data2-v1.zip
Figure 2—figure supplement 2

Validation of WSB2 knockout in two cancer cell lines.
(A) Schematic of CRISPR/Cas9-mediated knockout of WSB2 by sgRNA#1 or sgRNA#2 in C4-2B cells. Sanger sequencing confirming that the WSB2 gene was edited by sgRNA#1 or sgRNA#2 in C4-2B cells. (B) Schematic of CRISPR/Cas9-mediated knockout of WSB2 by sgRNA#1 or sgRNA#2 in Huh-7 cells. Sanger sequencing confirmed that the WSB2 gene was edited by sgRNA#1 or sgRNA#2 in Huh-7 cells.
Figure 3 with 1 supplement
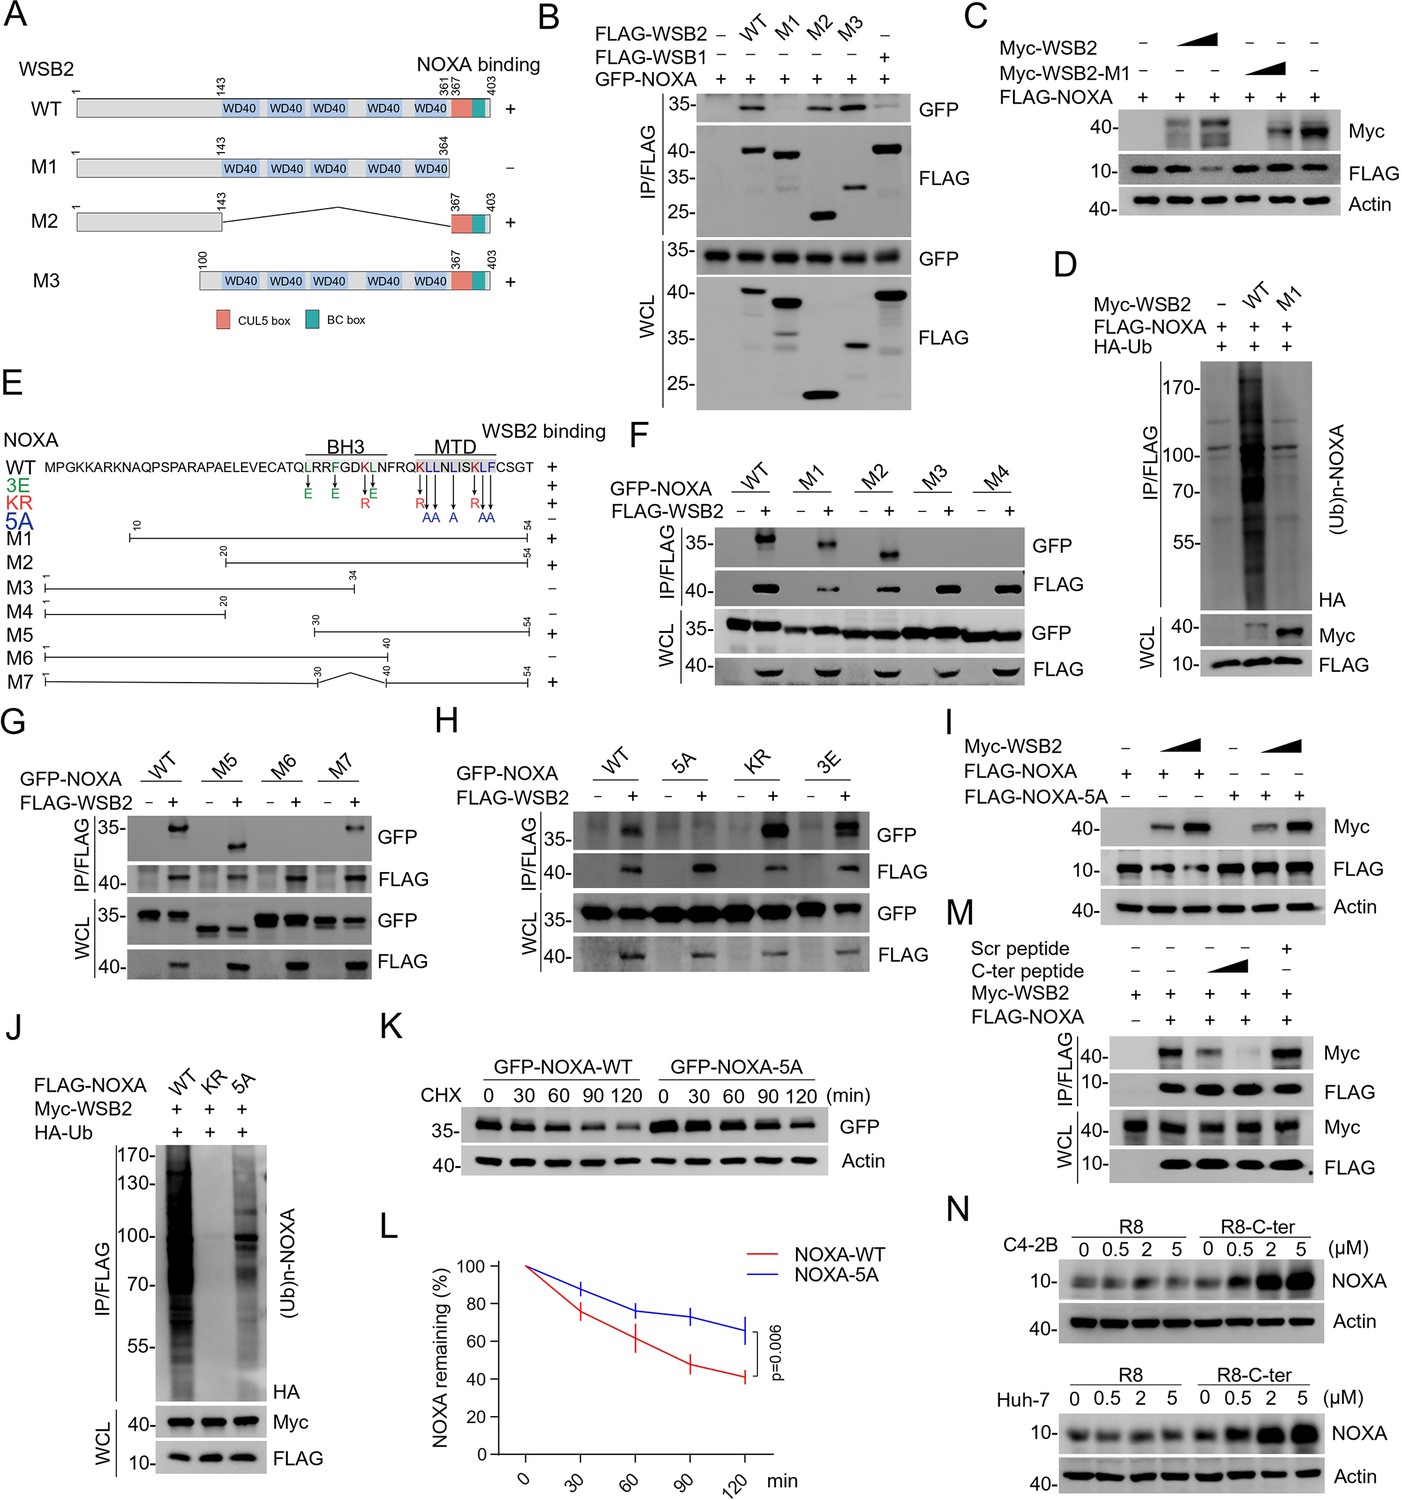
Identification of the mutual-binding regions of WSB2 and NOXA.
(A) Schematic representation of WSB2 deletion mutants. (B) Western blot (WB) analyses of the indicated proteins in the WCL and co-immunoprecipitation (Co-IP) samples of anti-FLAG antibody obtained from 293T cells transfected with the indicated plasmids. (C) WB analyses of the indicated proteins in the WCL from 293T cells transfected with the indicated plasmids. (D) WB analyses of the products of in vivo ubiquitination assays performed using WCL from 293T cells transfected with the indicated plasmids for 24 hr and treated with MG132 (20 μM). (E) Schematic representation of NOXA deletion or point mutants. (F–H) WB analyses of the indicated proteins in the WCL and Co-IP samples of anti-FLAG antibody obtained from 293T cells transfected with indicated plasmids. (I) WB analyses of the indicated proteins in the WCL from 293T cells transfected with the indicated plasmids. (J) WB analyses of the products of in vivo ubiquitination assays performed using WCL from 293T cells transfected with the indicated plasmids and treated with MG132 (20 μM). (K, L) WB analyses of the indicated proteins in the WCL from 293T cells transfected with the indicated plasmids treated with cycloheximide (CHX, 50 μg/ml) and harvested at different time points. (L) At each time point, the intensity of NOXA was normalized to the intensity of GAPDH and then to the value at 0 hr. Data are shown as means ± SE (n = 3). p values are calculated by the two-way ANOVA test. (M) 293T cells were transfected with the indicated plasmids. WSB2–NOXA complex was co-immunoprecipitated by anti-FLAG antibody, and then the bound complex was incubated with the increasing amounts of C-terminal NOXA peptide (200 and 400 μg/ml) or the corresponding scramble peptide for 12 hr. Bound material was subjected to WB analyses. C-ter: C-terminal NOXA peptide. (N) WB analyses of the indicated proteins in the WCL from C4-2B and Huh-7 cells treated with the increasing concentration of C-terminal cell-penetrating peptide of NOXA or the R8 peptide for 12 hr.
-
Figure 3—source data 1
Original file for the western blot analysis in Figure 3.
- https://cdn.elifesciences.org/articles/98372/elife-98372-fig3-data1-v1.zip
-
Figure 3—source data 2
Labeled file for the western blot analysis in Figure 3.
- https://cdn.elifesciences.org/articles/98372/elife-98372-fig3-data2-v1.zip
Figure 3—figure supplement 1

Identification of the mutual-binding regions of WSB2 and NOXA.
(A, B) Western blot (WB) analyses of the indicated proteins in the WCL and co-immunoprecipitation (Co-IP) samples of anti-FLAG antibody obtained from 293T cells transfected with the indicated plasmids. (C) WB analyses of the products of in vivo ubiquitination assays performed using WCL from 293T cells transfected with the indicated plasmids and treated with MG132 (20 μM). (D) WB analyses of the indicated proteins in the WCL and Co-IP samples of IgG or anti-NOXA antibodies obtained from 293T cells treated with the C-terminal cell-penetrating peptide of NOXA or the R8 peptide for 12 hr. (E, F) WB analyses of indicated proteins in the WCL of parental and WSB2 KO C4-2B cells treated with the C-terminal cell-penetrating peptide of NOXA or the R8 peptide for 12 hr, and then treated with cycloheximide (CHX, 50 μg/ml) and harvested at different time points. (F) At each time point, the intensity of NOXA was normalized to the intensity of GAPDH and then to the value at 0 hr. Data are shown as means ± SE (n = 3). p values are calculated by the two-way ANOVA test.
-
Figure 3—figure supplement 1—source data 1
Original file for the western blot analysis in Figure 3—figure supplement 1.
- https://cdn.elifesciences.org/articles/98372/elife-98372-fig3-figsupp1-data1-v1.zip
-
Figure 3—figure supplement 1—source data 2
Labeled file for the western blot analysis in Figure 3—figure supplement 1.
- https://cdn.elifesciences.org/articles/98372/elife-98372-fig3-figsupp1-data2-v1.zip
Figure 4 with 1 supplement
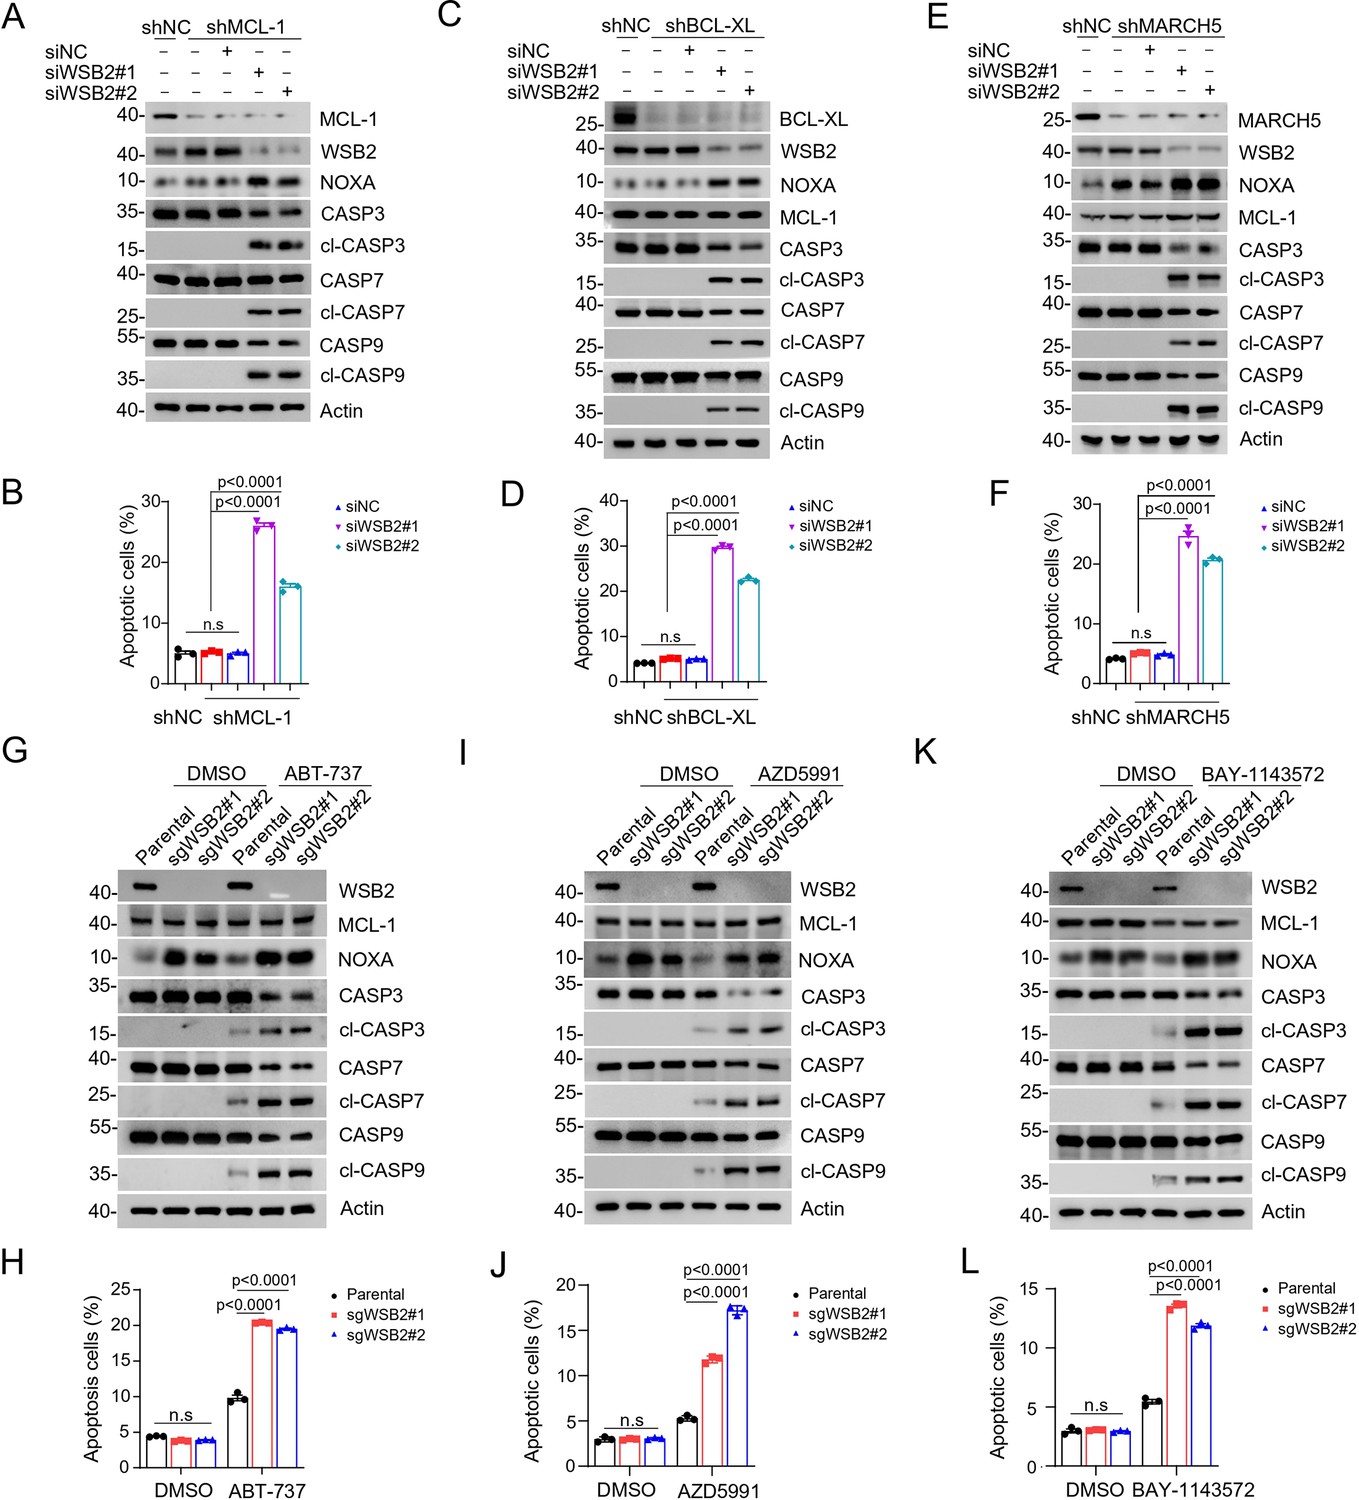
Combined inhibition of anti-apoptotic BCL-2 family members and WSB2 induces synthetic lethality.
(A, B) Western blot (WB) analyses of the indicated proteins in the WCL from C4-2B cells infected with lentivirus expressing MCL-1-specific short hairpin RNA (shRNA) or NC and then transfected with the indicated siRNAs for 36 hr. (B) Annexin-V-FITC/PI assays were used to stain the harvested cells in (A), of which later flow cytometry analysis was performed. Data are shown as means ± SE (n = 3). (C, D) Similar to (A, B), but BCL-XL was knocked down in C4-2B cells. (E, F) Similar to (A, B), but MARCH5 was knocked down in C4-2B cells. (G, H) WB analyses of the indicated proteins in the WCL from parental and WSB2 KO C4-2B cells treated with ABT-737 (20 μM) for 6 hr. (H) Annexin-V-FITC/PI assays were used to stain the harvested cells in (H), of which later flow cytometry analysis was performed. Data are shown as means ± SE (n = 3). (I, J) Similar to (A, B), but AZD5991 was used for treatment in C4-2B cells. (K, L) Similar to (A, B), but BAY-1143572 was used for treatment in C4-2B cells. p values are calculated by the one-way ANOVA test in (B, D, F) and two-way ANOVA test in (H, J, L). n.s., non-significant.
-
Figure 4—source data 1
Original file for the western blot analysis in Figure 4.
- https://cdn.elifesciences.org/articles/98372/elife-98372-fig4-data1-v1.zip
-
Figure 4—source data 2
Labeled file for the western blot analysis in Figure 4.
- https://cdn.elifesciences.org/articles/98372/elife-98372-fig4-data2-v1.zip
Figure 4—figure supplement 1

Combined inhibition of anti-apoptotic BCL-2 family members and WSB2 induces synthetic lethality.
(A, B) Western blot (WB) analyses of the indicated proteins in the WCL from parental and WSB2 KO Huh-7 cells treated with ABT-737 (20 μM). (B) Annexin-V-FITC/PI assays were used to stain the harvested cells in (A), of which later flow cytometry analysis was performed. Data are shown as means ± SE (n = 3). (C, D) Similar to (A, B), but AZD5991 was used for treatment in Huh-7 cells. p values are calculated by the two-way ANOVA test in (B, D). n.s., non-significant.
-
Figure 4—figure supplement 1—source data 1
Original file for the western blot analysis in Figure 4—figure supplement 1.
- https://cdn.elifesciences.org/articles/98372/elife-98372-fig4-figsupp1-data1-v1.zip
-
Figure 4—figure supplement 1—source data 2
Labeled file for the western blot analysis in Figure 4—figure supplement 1.
- https://cdn.elifesciences.org/articles/98372/elife-98372-fig4-figsupp1-data2-v1.zip
Figure 5
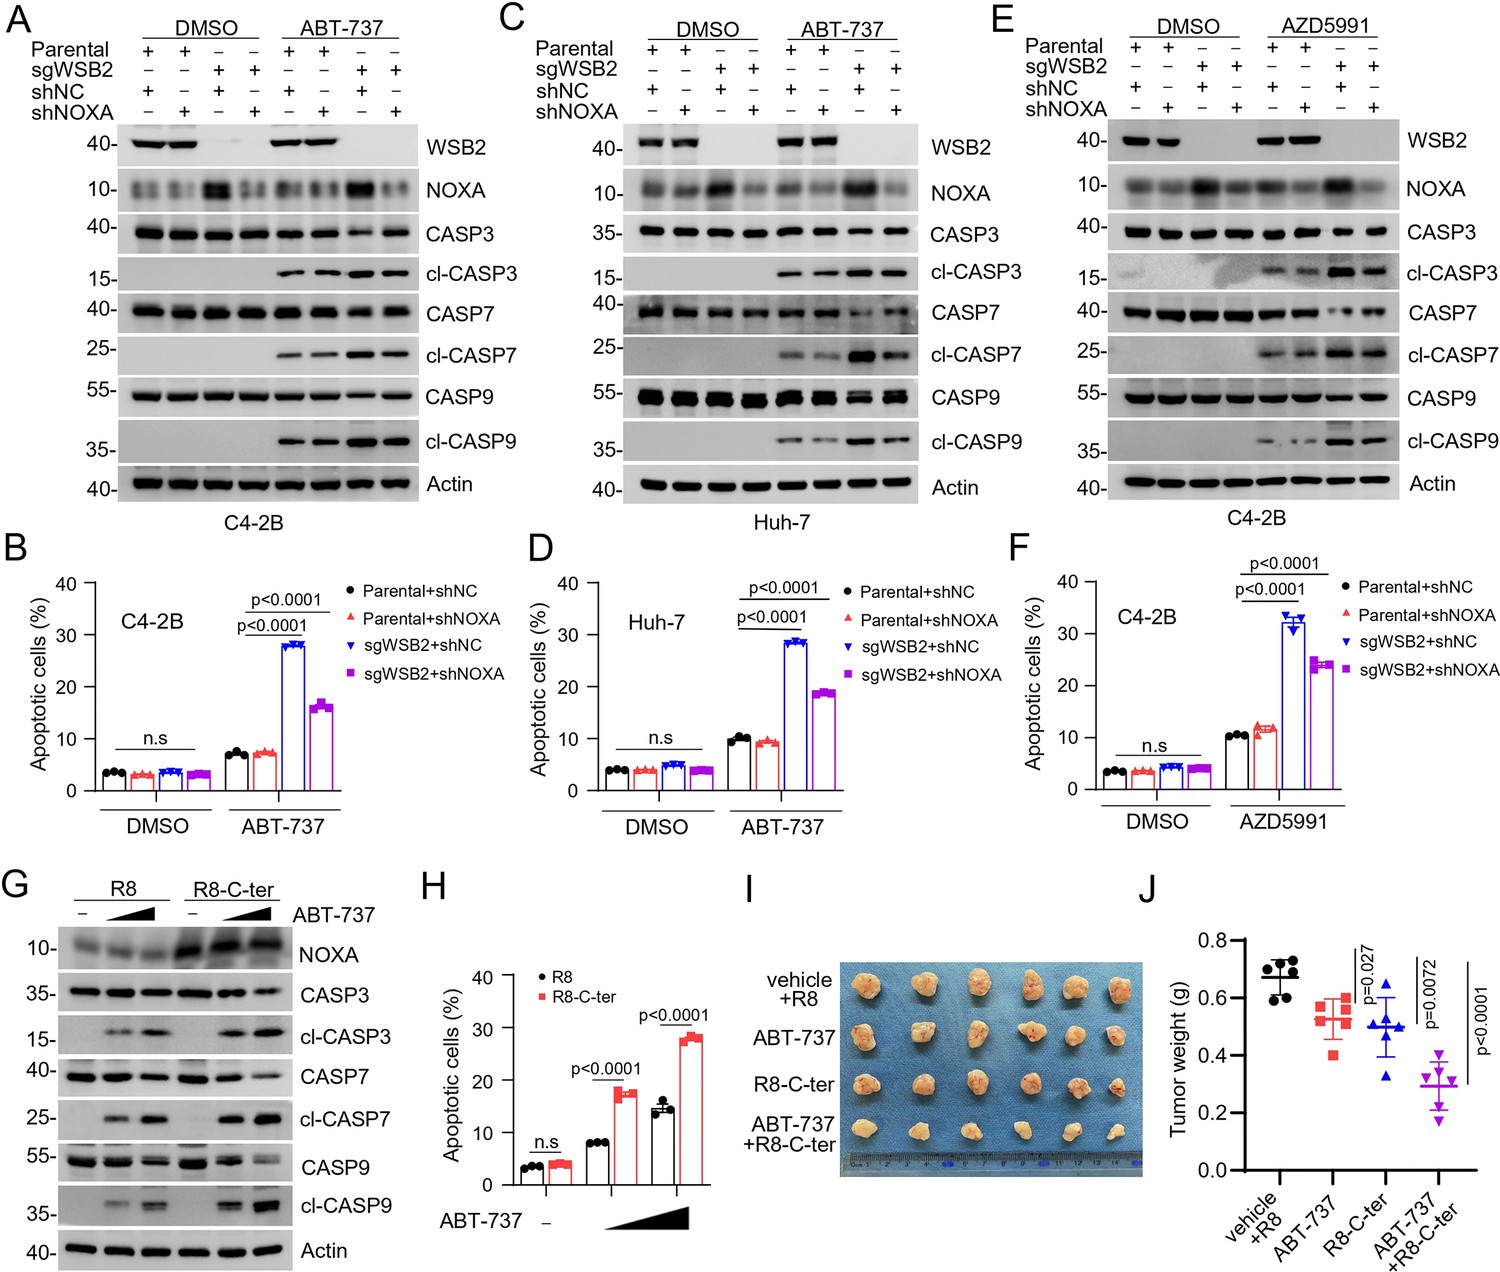
WSB2 primarily exerts its anti-apoptotic function largely via destabilizing NOXA.
(A, B) Western blot (WB) analyses of indicated proteins in the WCL from parental or WSB2 KO C4-2B cells infected with lentivirus expressing NOXA-specific short hairpin RNA (shRNA) or NC, treated with DMSO or ABT-737 (20 μM) for 6 hr. (B) Annexin-V-FITC/PI assays were used to stain the harvested cells, of which later flow cytometry analysis was performed. Data are shown as means ± SE (n = 3). (C, D) Similar to (A, B), but AZD5991 (10 μM) was used for treatment in C4-2B cells. (E, F) Similar to (A, B), but Huh-7 cells were treated. (G, H) WB analyses of the indicated proteins in the WCL from Huh-7 cells treated with the cell-penetrating C-terminal NOXA peptide (5 μM) or the corresponding R8 peptide (5 μM) for 12 hr and then the cells were treated with increasing doses of ABT-737 (10 and 20 μM). Annexin-V-FITC/PI assays were used to stain the harvested cells, of which later flow cytometry analysis was performed. Data are shown as means ± SE (n = 3). (I, J) Huh-7 cells were injected subcutaneously (s.c.) into the right flank of BALB/c mice and treated with ABT-737 (30 mg/kg), R8-C-ter (20 mg/kg), or R8 (20 mg/kg) as control at different day points. 6 mice per experimental group. Tumors in each group at day 20 were harvested and photographed (I) and tumor weight (J) was documented. Data are shown as means ± SD (n = 6). p values are calculated by the two-way ANOVA test in (B, D, F, H). n.s., non-significant.
-
Figure 5—source data 1
Original file for the western blot analysis in Figure 5.
- https://cdn.elifesciences.org/articles/98372/elife-98372-fig5-data1-v1.zip
-
Figure 5—source data 2
Labeled file for the western blot analysis in Figure 5.
- https://cdn.elifesciences.org/articles/98372/elife-98372-fig5-data2-v1.zip
Figure 6 with 2 supplements
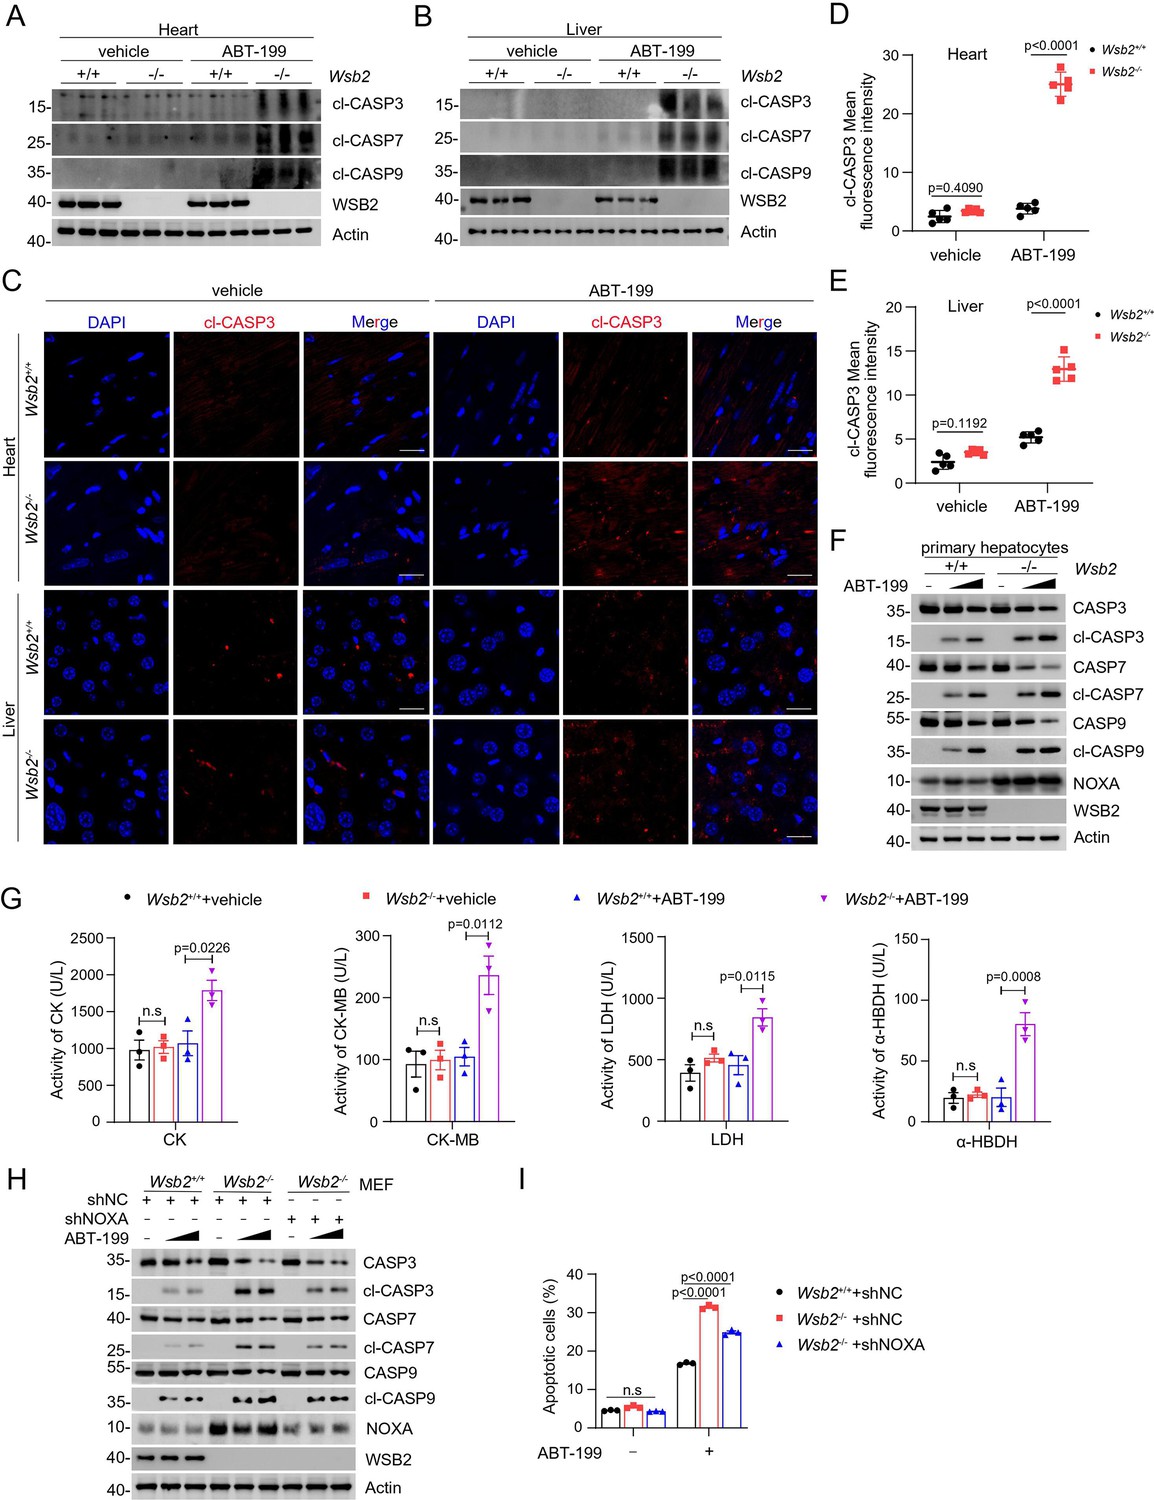
Validation of the anti-apoptotic function of WSB2 using Wsb2 knockout mouse models.
Western blot (WB) analyses of the indicated proteins in the WCL from heart (A) or liver (B) tissues obtained from Wsb2+/+ and Wsb2−/− mice after gavage administration of vehicle or ABT-199 (100 mg/kg/day) for 7 days. (C) Representative immunofluorescence (IF) images from the heart or liver tissues of Wsb2+/+ and Wsb2−/− mice after oral administration of vehicle or ABT-199 (100 mg/kg/day) for 7 days, and stained with cl-CASP3 and DAPI. Scale bar, 20 μm. The mean fluorescence intensity of cl-CASP3 from the heart (D) or liver tissues (E) obtained from Wsb2+/+ and Wsb2−/− mice. Data were shown as means ± SE (n = 5). (F) WB analyses of the indicated proteins in the WCL from the primary hepatocytes of Wsb2+/+ and Wsb2−/− mice treated with ABT-199 (10 and 20 μM) for 6 hr. (G) The levels of myocardial zymogram in serum from Wsb2+/+ and Wsb2−/− mice after gavage administration of vehicle or ABT-199 (100 mg/kg/day) for 7 days. (H) WB analyses of the indicated proteins in the WCL from Wsb2+/+ and Wsb2−/− mouse embryonic fibroblasts (MEFs) infected with lentivirus expressing NOXA-specific short hairpin RNA (shRNA) or NC, treated with DMSO or ABT-199 (10 and 20 μM) for 6 hr. (I) Annexin-V-FITC/PI assays were used to stain the harvested cells, of which later flow cytometry analysis was performed. Data are shown as means ± SE (n = 3). p values are calculated by the one-way ANOVA test in (G) and two-way ANOVA test in (D, E). n.s., non-significant.
-
Figure 6—source data 1
Original file for the western blot analysis in Figure 6.
- https://cdn.elifesciences.org/articles/98372/elife-98372-fig6-data1-v1.zip
-
Figure 6—source data 2
Labeled file for the western blot analysis in Figure 6.
- https://cdn.elifesciences.org/articles/98372/elife-98372-fig6-data2-v1.zip
-
Figure 6—source data 3
Original file for the images in Figure 6.
- https://cdn.elifesciences.org/articles/98372/elife-98372-fig6-data3-v1.zip
Figure 6—figure supplement 1

Generation and validation of Wsb2 KO mouse models.
(A) Strategy to generate Wsb2 KO mice using CRISPR/Cas9 methods. (B) Representative images of male Wsb2−/− and matched Wsb2+/+ mice at 3 months of age. (C) Genotyping analysis of offspring from mating between Wsb2 heterozygous mice at P10. p values are calculated by the chi-squared test. (D) Western blot (WB) analyses of the indicated proteins in WCL from the indicated tissues of Wsb2+/+ and Wsb2−/− mice.
-
Figure 6—figure supplement 1—source data 1
Original file for the western blot analysis in Figure 6—figure supplement 1.
- https://cdn.elifesciences.org/articles/98372/elife-98372-fig6-figsupp1-data1-v1.zip
-
Figure 6—figure supplement 1—source data 2
Labeled file for the western blot analysis in Figure 6—figure supplement 1.
- https://cdn.elifesciences.org/articles/98372/elife-98372-fig6-figsupp1-data2-v1.zip
Figure 6—figure supplement 2

WSB2 deficiency enhances the susceptibility of ABT 199-induced apoptosis in the heart and liver tissues of Wsb2−/− mice.
(A) Representative immunofluorescence (IF) images from the heart or liver tissues of Wsb2+/+ and Wsb2−/− mice after oral administration of vehicle or ABT-199 (100 mg/kg/day) for 7 days, and stained with cl-CASP7 and DAPI. Scale bar, 20 μm. The mean fluorescence intensity of cl-CASP7 from the heart (B) or liver tissues (C) obtained from Wsb2+/+ and Wsb2−/− mice. Data were shown as means ± SE (n = 5). (D) Similar to (A), but cl-PARP1 was stained. (E, F) Similar to (B, C), but the mean fluorescence intensity of cl-PARP1 was counted. (G) Similar to (A), but TUNEL was stained. The TUNEL+ cell number in the heart (H) or liver tissues (I) obtained from Wsb2+/+ and Wsb2−/− mice. Data were shown as means ± SE (n = 5). p values are calculated by the two-way ANOVA test in (B, C, E, F, H, I).
-
Figure 6—figure supplement 2—source data 1
Original file for the images in Figure 6—figure supplement 2.
- https://cdn.elifesciences.org/articles/98372/elife-98372-fig6-figsupp2-data1-v1.zip
Figure 7 with 1 supplement
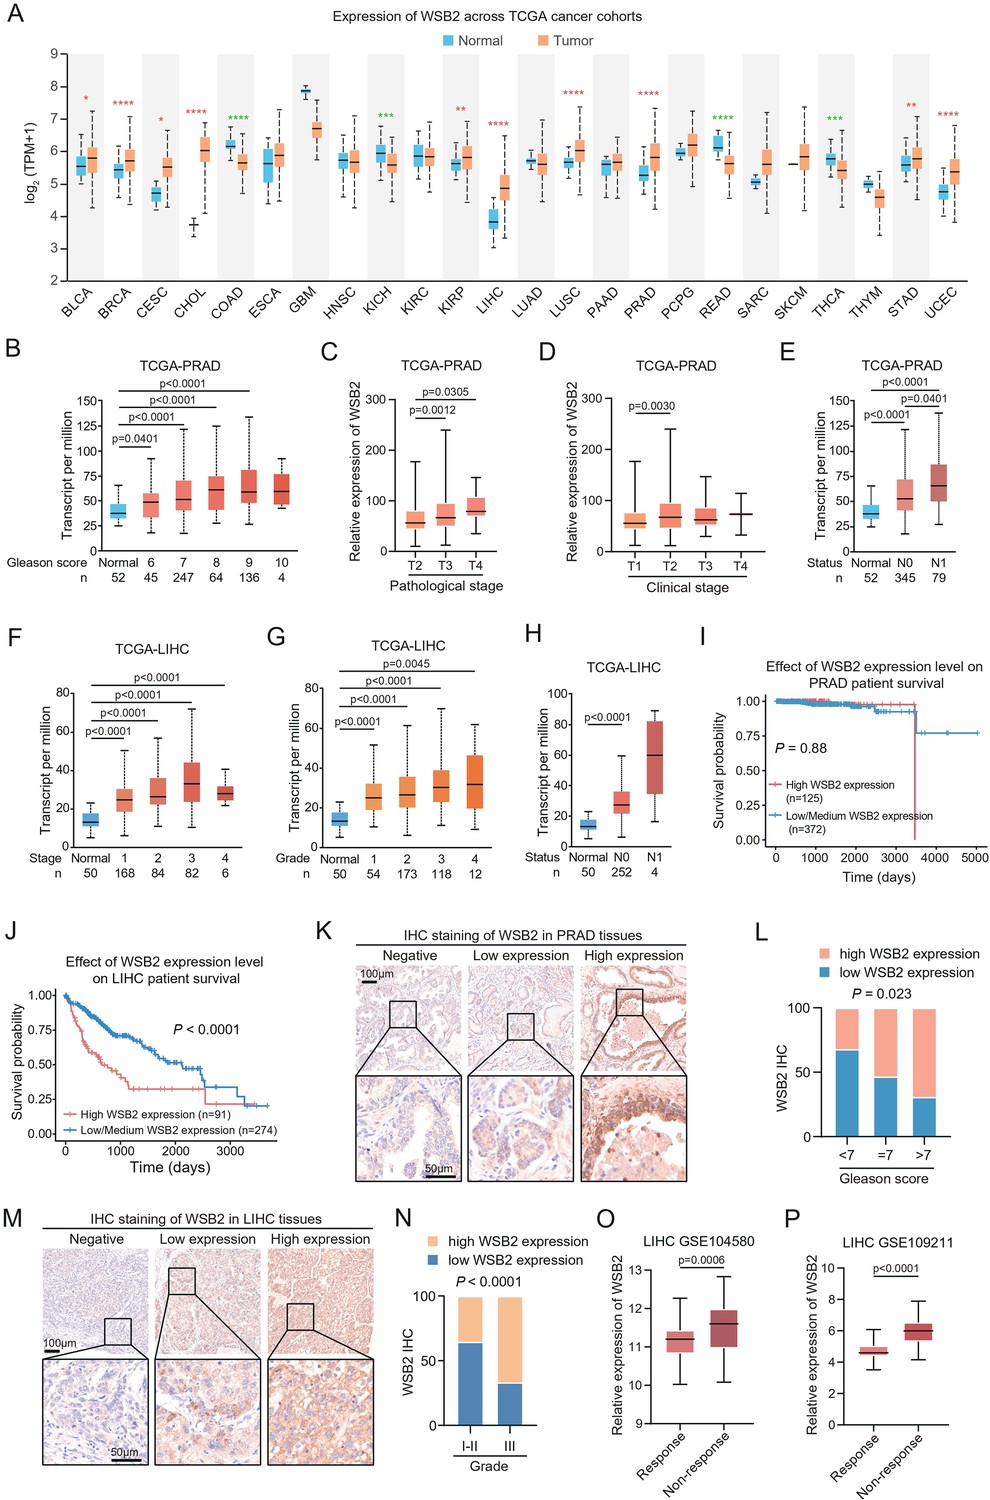
WSB2 expression is upregulated in multiple human cancers.
(A) WSB2 mRNA expression in normal and tumor tissues from the The Cancer Genome Atlas (TCGA) cohort. Relationship between WSB2 mRNA expression and Gleason score (B), pathological T stage (C), clinical T stage (D), and nodal metastasis status (E) in prostate adenocarcinoma (PRAD) patients from the TCGA cohort. Relationship between WSB2 mRNA expression and clinical stage (F), pathological grade (G), and nodal metastasis status (H) in liver hepatocellular carcinoma (LIHC) patients from the TCGA cohort. Kaplan–Meier survival plots of overall survival (OS) according to WSB2 mRNA expression in PRAD (I) and LIHC (J) patients from the TCGA cohorts. (K) Representative immunohistochemistry (IHC) staining results for WSB2 in PRAD TMA, scale bar, 50 μm. (L) Quantification analysis of WSB2 IHC staining in PRAD patients by Gleason score categories. n = 84. (M) Representative IHC staining results for WSB2 in LIHC TMA, scale bar, 50 μm. (N) Quantification analysis of WSB2 IHC staining in LIHC patients by tumor grade categories. n = 29. (O) The WSB2 mRNA levels in 81 sorafenib-response and 66 sorafenib-non-response LIHC patients from GSE104580 dataset. (P) The WSB2 mRNA levels in 42 sorafenib-response and 98 sorafenib-non-response LIHC patients from GSE109211 dataset. p values are calculated by the unpaired t test in (A–H, L, N–P) and log-rank test in (I, J). *p<0.05, **p<0.01, ***p<0.001, ****p<0.0001.
-
Figure 7—source data 1
Original file for the images in Figure 7.
- https://cdn.elifesciences.org/articles/98372/elife-98372-fig7-data1-v1.zip
Figure 7—figure supplement 1

Validation of WSB2 antibody specificity by immunohistochemistry (IHC).
(A) Representative images of WSB2 immunohistochemistry (IHC) staining in Parental and WSB2 KO C4-2B cells. Scale bar, 100 μm.
Figure 8
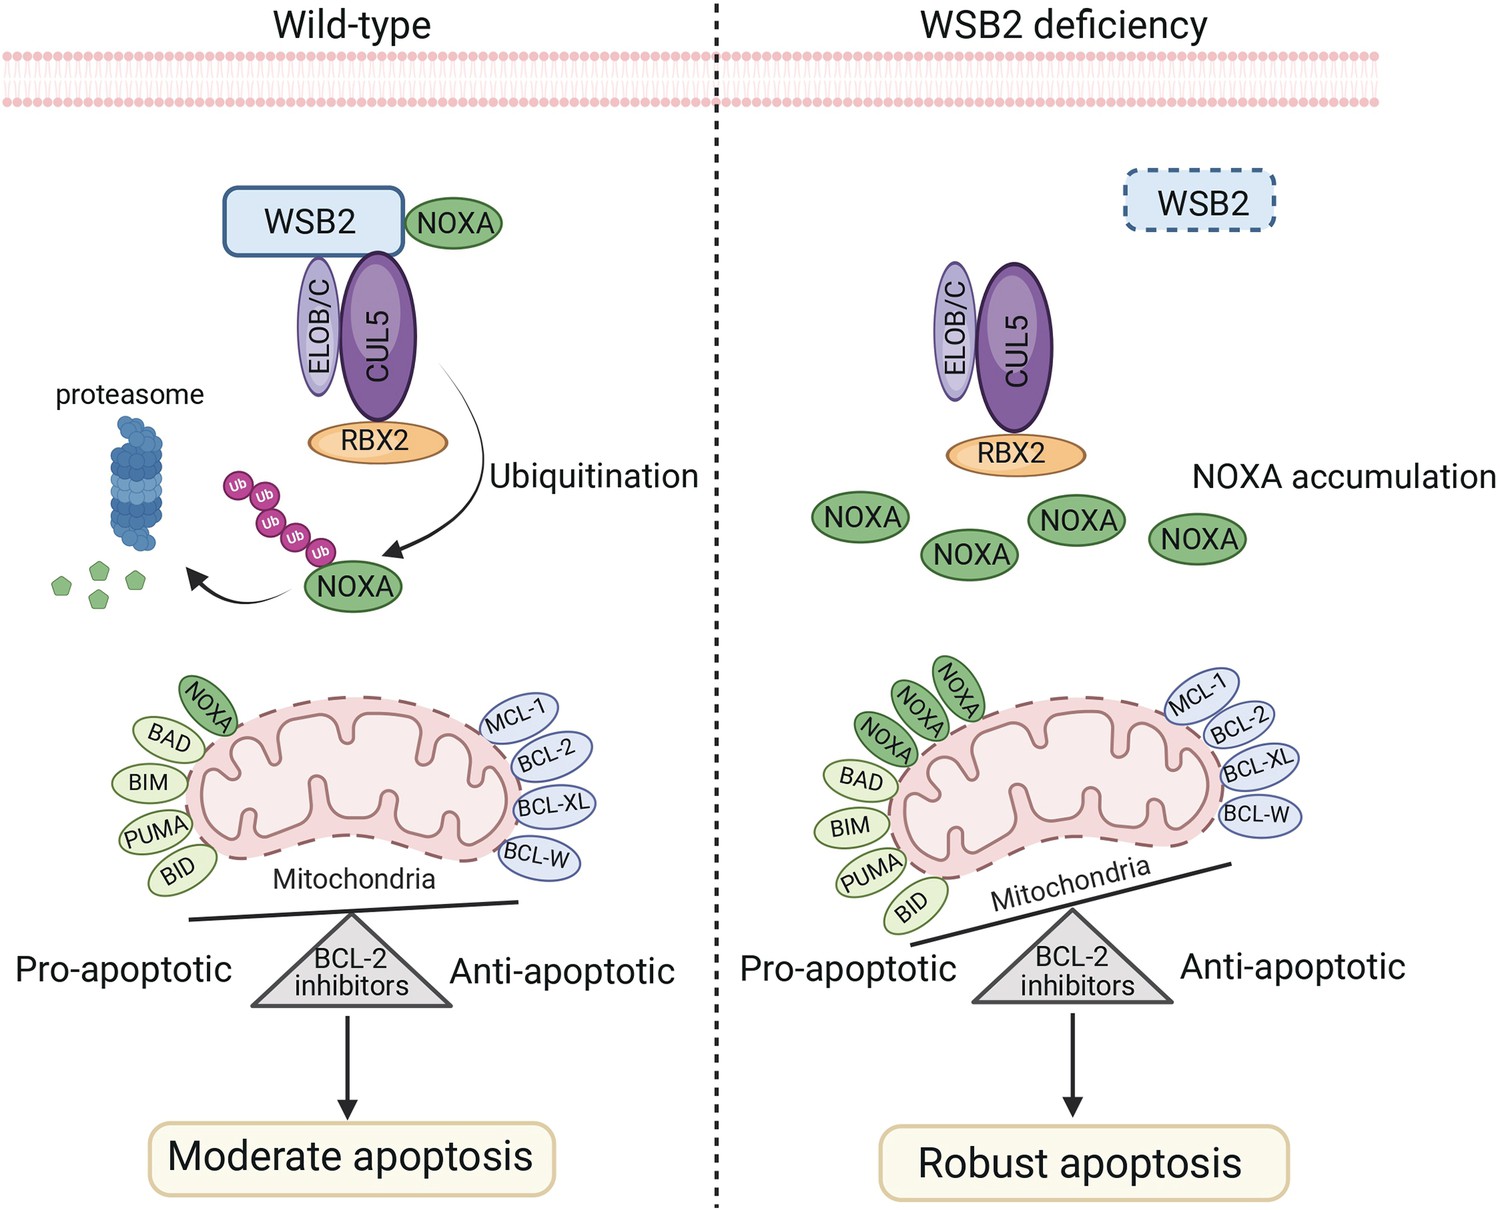
The schematic diagram illustrates that the disruption of the CRL5WSB2 E3 ubiquitin ligase complex results in NOXA stabilization and increased sensitivity to BCL-2 family protein inhibitors.
Created using BioRender.com.
Tables
Appendix 1—key resources table
| Reagent type (species) or resource | Designation | Source or reference | Identifiers | Additional information |
|---|---|---|---|---|
| Antibody | anti-WSB2 (Rabbit polyclonal) | Abclonal | Cat# WG-05341D, RRID:AB_3674706 | IHC(1:200) WB(1:1000) |
| Antibody | anti-CUL5 (Rabbit polyclonal) | Abclonal | Cat# A5369 RRID:AB_2766179 | WB(1:1000) |
| Antibody | anti-RBX2 (Rabbit polyclonal) | Proteintech | Cat# 11905–1-AP RRID:AB_10697836 | WB(1:1000) |
| Antibody | anti-ELOB (Rabbit polyclonal) | Abclonal | Cat# A5362 RRID:AB_2766172 | WB(1:1000) |
| Antibody | anti-ELOC (Rabbit polyclonal) | Abclonal | Cat# A12515 RRID:AB_2759355 | WB(1:1000) |
| Antibody | anti-NOXA (Rabbit monoclonal) | CST | Cat# 14766 S RRID:AB_2798602 | WB(1:1000) |
| Antibody | anti-Noxa (Rabbit monoclonal) | SANTA CRUZ | Cat# sc-56169 RRID:AB_784877 | WB(1:1000) |
| Antibody | anti-BAX (Rabbit monoclonal) | Abclonal | Cat# A19684 RRID:AB_2862733 | WB(1:1000) |
| Antibody | anti-BAK1 (Rabbit monoclonal) | Abclonal | Cat# A10754 RRID:AB_2758197 | WB(1:1000) |
| Antibody | anti-MCL-1 (Rabbit polyclonal) | Proteintech | Cat# 16225–1-AP RRID:AB_2143977 | WB(1:1000) |
| Antibody | anti-BCL-2 (Rabbit monoclonal) | CST | Cat# 4223T RRID:AB_1903909 | WB(1:1000) |
| Antibody | anti-BCL-W (Rabbit polyclonal) | Abclonal | Cat# A13471 RRID:AB_2760333 | WB(1:1000) |
| Antibody | anti-BCL-XL (Rabbit monoclonal) | Abclonal | Cat# A19703 RRID:AB_2862745 | WB(1:1000) |
| Antibody | anti-BAD (Rabbit monoclonal) | Abclonal | Cat# A19595 RRID:AB_2862688 | WB(1:1000) |
| Antibody | anti-MARCH5 (Rabbit polyclonal) | Proteintech | Cat# 12213–1-AP RRID:AB_10638602 | WB(1:1000) |
| Antibody | anti-TOM70 (Rabbit monoclonal) | CST | Cat# 65,619T RRID:AB_3411916 | WB(1:1000) |
| Antibody | anti-SMAC (Rabbit monoclonal) | CST | Cat# 15,108T RRID:AB_2798711 | WB(1:1000) |
| Antibody | anti-HSP60 (Rabbit monoclonal) | CST | Cat# 12,165T RRID:AB_2636980 | WB(1:1000) |
| Antibody | anti-Histone H3 (Rabbit polyclonal) | CST | Cat# 9715 S RRID:AB_331563 | WB(1:1000) |
| Antibody | anti-cleaved PARP1 (Rabbit monoclonal) | CST | Cat# 5625T RRID:AB_10699459 | IF(1:200) |
| Antibody | anti-CASP9 (Rabbit polyclonal) | CST | Cat# 9502 S RRID:AB_2068621 | WB(1:1000) |
| Antibody | anti-CASP7 (Rabbit polyclonal) | CST | Cat# 9492 S RRID:AB_2228313 | WB(1:1000) |
| Antibody | anti-cleaved CASP7 (Rabbit monoclonal) | CST | Cat# 8438 S RRID:AB_11178377 | IF(1:200) |
| Antibody | anti-CASP3 (Rabbit monoclonal) | CST | Cat# 9668 S RRID:AB_2069870 | WB(1:1000) |
| Antibody | anti-cleaved CASP3 (Rabbit monoclonal) | CST | Cat# 9664 S RRID:AB_2070042 | IF(1:200) WB(1:1000) |
| Antibody | anti-GFP (Mouse monoclonal) | Abclonal | Cat# AE012 RRID:AB_2770402 | WB(1:1000) |
| Antibody | anti-FLAG (Mouse polyclonal) | MBL | Cat# PM020 RRID:AB_591224 | WB(1:1000) |
| Antibody | anti-Myc (Mouse monoclonal) | MBL | Cat# M192-3 RRID:AB_11160947 | WB(1:1000) |
| Antibody | anti-HA (Mouse monoclonal) | MBL | Cat# M180-3 RRID:AB_10951811 | WB(1:1000) |
| Antibody | anti-GAPDH (Mouse monoclonal) | Abcam | Cat# ab8245 RRID:AB_2107448 | WB(1:1000) |
| Antibody | anti-β-Actin (Rabbit monoclonal) | Abclonal | Cat# AC026 RRID:AB_2768234 | WB(1:1000) |
| Peptide, recombinant protein | FLAG peptide | ChinaPeptides | Cat# 04010006736 | |
| Peptide, recombinant protein | Penicillin-Streptomycin | Invitrogen | Cat# 15070063 | |
| Commercial assay or kit | KOD-Plus-Mutagenesis Kit | TOYOBO | Cat# SMK-101 | |
| Commercial assay or kit | Annexin V-FITC Apoptosis Detection Kit | Dojindo | Cat# AD10 | |
| Commercial assay or kit | TUNEL staining Kit | Beyotime | Cat# C1086 | |
| Chemical compound, drug | L-Glutamine | Gibco | Cat# 25030149 | |
| Chemical compound, drug | MG132 | Selleckchem | Cat# S2619 | |
| Chemical compound, drug | ABT-737 | MCE | Cat# HY-50907 | |
| Chemical compound, drug | ABT-199 | MCE | Cat# HY-15531 | |
| Chemical compound, drug | BAY-1143572 | Selleck | Cat# S8727 | |
| Chemical compound, drug | AZD5991 | Selleck | Cat# S8643 | |
| Chemical compound, drug | Cycloheximide | Sigma | Cat# 66-81-9 | |
| Chemical compound, drug | Puromycin | Sigma | Cat# P8833 | |
| Chemical compound, drug | Protease Inhibitor Cocktail (EDTA-Free, 100 X in DMSO) | Selleck | Cat# B14001 | |
| Chemical compound, drug | Trizol | Thermo Fisher | Cat# 14496026 | |
| Chemical compound, drug | EZ Trans | Shanghai Life-iLab Biotech | Cat# AC04L092 | |
| Chemical compound, drug | EndoFectinTM-MAX | iGeneBio | Cat# EF013 | |
| Chemical compound, drug | ChamQ SYBR qPCR Master Mix | Vazyme Biotech | Cat# Q311 | |
| Chemical compound, drug | Phanta Max Super-Fidelity DNA Polymerase | Vazyme Biotech | Cat# P505 | |
| Chemical compound, drug | Anti-FLAG M2 | Sigma | Cat# SLCD1942 |
Additional files
-
Supplementary file 1
Top 100 co-dependent genes of WSB2.
- https://cdn.elifesciences.org/articles/98372/elife-98372-supp1-v1.xlsx
-
Supplementary file 2
The GO analysis of the top 500 co-dependent genes of WSB2.
- https://cdn.elifesciences.org/articles/98372/elife-98372-supp2-v1.xlsx
-
Supplementary file 3
The DepLink analysis of top correlated drugs with WSB2.
- https://cdn.elifesciences.org/articles/98372/elife-98372-supp3-v1.xlsx
-
Supplementary file 4
Sequence information.
- https://cdn.elifesciences.org/articles/98372/elife-98372-supp4-v1.xlsx
-
MDAR checklist
- https://cdn.elifesciences.org/articles/98372/elife-98372-mdarchecklist1-v1.pdf
Download links
A two-part list of links to download the article, or parts of the article, in various formats.
Downloads (link to download the article as PDF)
Open citations (links to open the citations from this article in various online reference manager services)
Cite this article (links to download the citations from this article in formats compatible with various reference manager tools)
Targeting the WSB2–NOXA axis in cancer cells for enhanced sensitivity to BCL-2 family protein inhibitors
eLife 13:RP98372.
https://doi.org/10.7554/eLife.98372.3


