T-follicular helper cell profiles differ by malaria antigen and for children compared to adults
- Division of Infectious Diseases and Immunology, Department of Medicine, University of Massachusetts Chan Medical School, United States
- Department of Pathology and Laboratory Medicine, Brown University, United States
- Center for Global Health Research, Kenya Medical Research Institute, Kenya
Figures
Figure 1
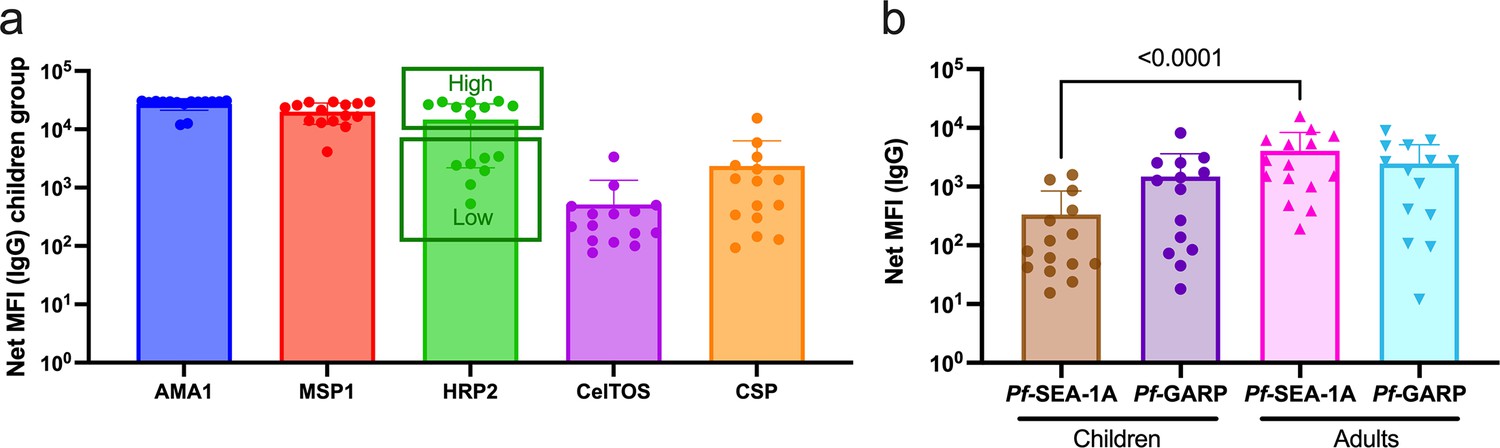
Pf-malaria IgG sero-profiles for children and adults.
(a) IgG antibody levels against AMA1, MSP1, HRP2, CelTos, and CSP for children (n=14). The bar plots indicate the mean with standard deviation (SD). (b) IgG antibody levels against PfSEA-1A and PfGARP comparing children (n=15) and adults (n=15). The bar plots indicate the mean with SD. Net median fluorescence intensity (MFI) values are the antigen-specific MFI values minus the BSA background. Mann-Whitney tests were performed.
Figure 2 with 2 supplements
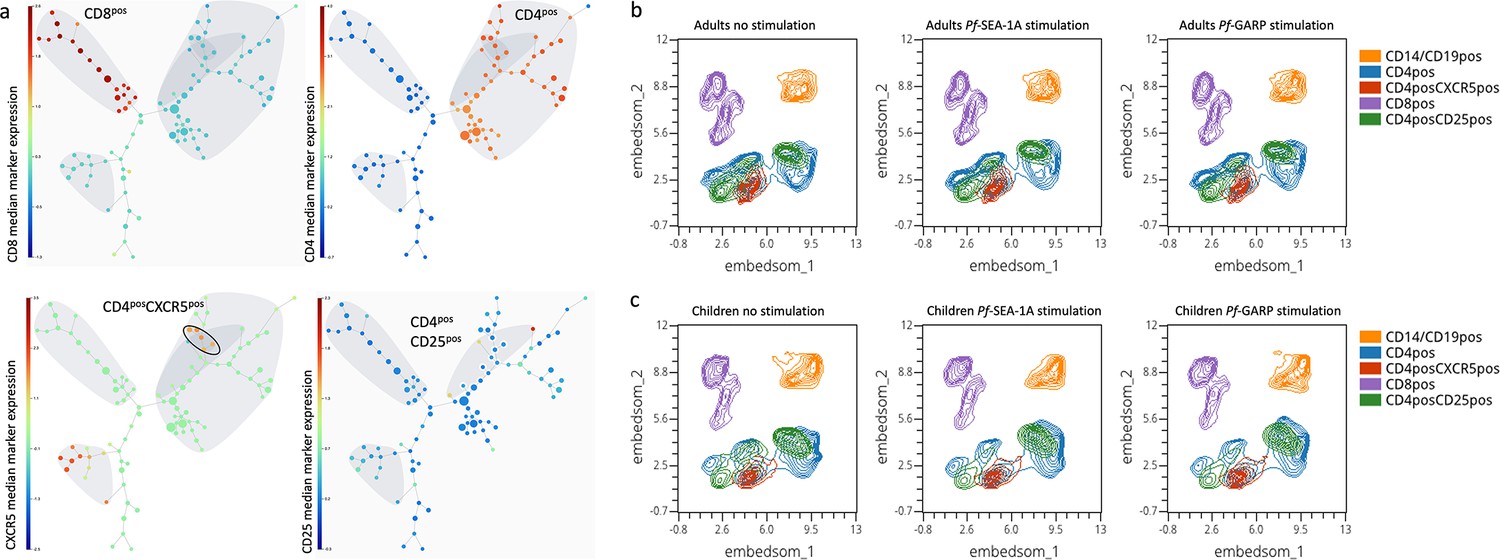
Cluster visualization of immune cell types and their abundance.
(a) A 100-node and 75-meta-cluster FlowSOM tree was generated on live lymphocytes from all our participants (n=29 children and adults), highlighting CD3posCD8pos, CD3posCD4pos, CD4posCXCR5pos, and CD4posCD25pos cells. The five nodes of the CD4posCXCR5posCD25neg population are circled and were used for the downstream analysis. The colored scale was based on the median arcsinh-transformed marker expression. Uniform Manifold Approximation and Projection (UMAP) plots showing five clusters defined as follows: CD14pos and CD19pos (orange), CD4pos (blue), CD4posCXCR5pos (red), CD8pos (purple), and CD4posCD25pos (green) from peripheral blood mononuclear cells (PBMCs) isolated from (b) adults (n=15) and (c) children (n=14) that were unstimulated, stimulated with PfSEA-1A, or stimulated with PfGARP, respectively, from left to right.
Figure 2—figure supplement 1
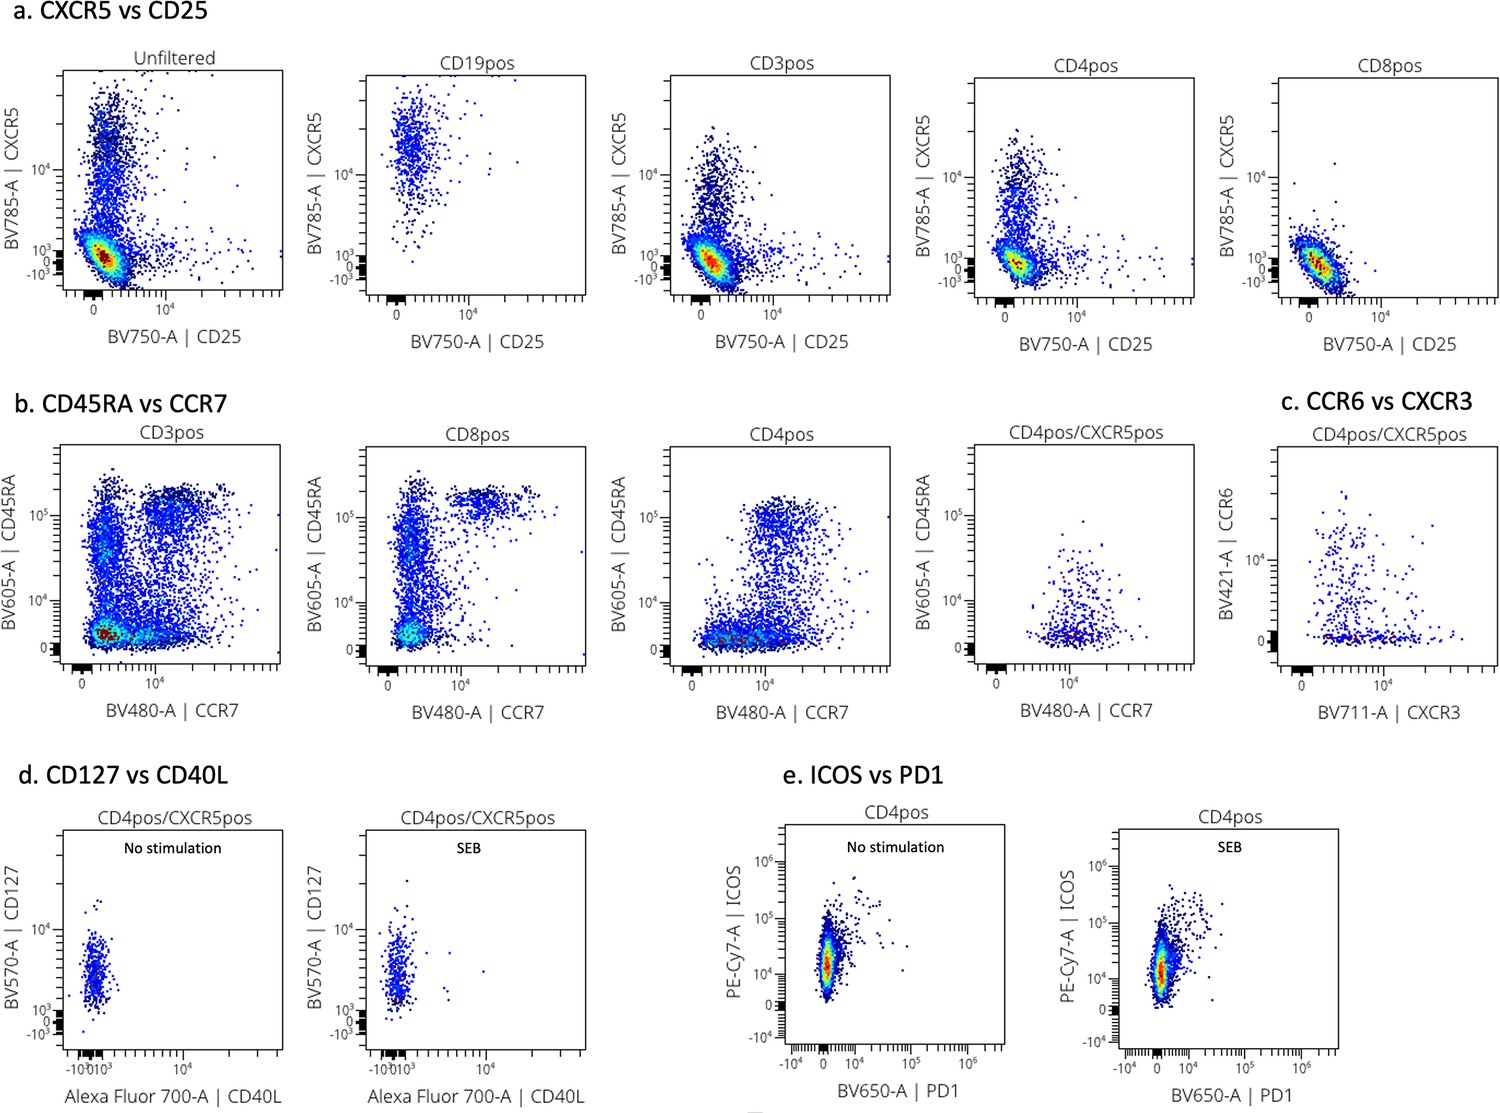
Representative cytoplots of the extracellular flow staining.
Panel (a) shows the CXCR5 vs CD25 cytoplots on unfiltered, CD19pos, CD3pos, CD4pos, and CD8pos cells from left to right. Panel (b) shows CD45RA vs CCR7 cytoplots on CD3pos, CD8pos, CD4pos, and CD4posCXCR5pos cells from left to right. Panel (c) shows CCR6 vs CXCR3 staining on CD4posCXCR5pos cells. Panel (d) shows CD127 vs CD40L expression within CD4posCXCR5pos cells by unstimulated and SEB-stimulated cells. Panel (e) shows ICOS vs PD1 cytoplots after no stimulation or SEB 6 hr stimulation.
Figure 2—figure supplement 2
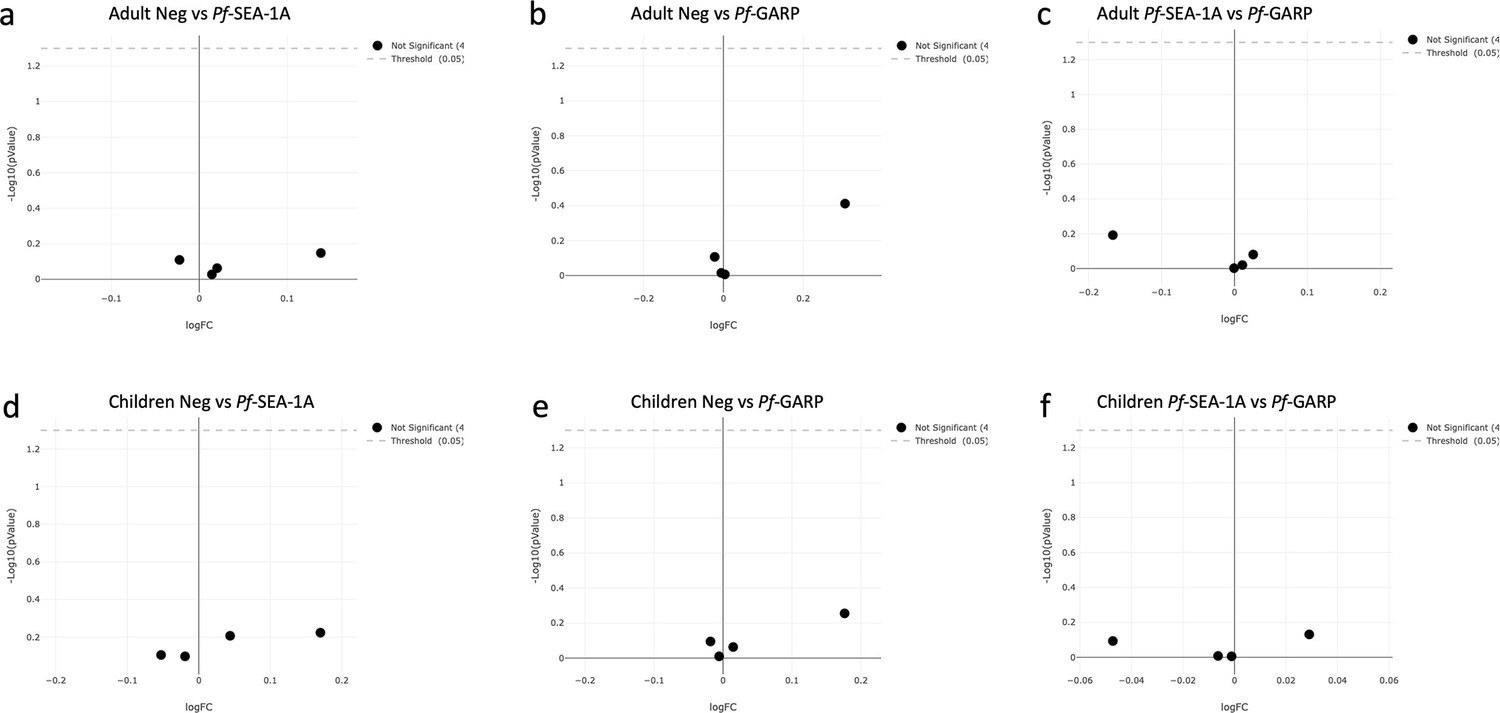
EdgeR analysis of the CD4pos, CD4posCXCR5pos, CD8pos, and CD14/CD19pos populations under different stimulation conditions in adults (n=15) and children (n=14).
Volcano plot from EdgeR analysis comparing CD4pos, CD4posCXCR5pos, CD8pos, and CD14/CD19pos populations from adult peripheral blood mononuclear cells (PBMCs) under the following conditions: (a) unstimulated vs PfSEA-1A, (b) unstimulated vs PfGARP, and (c) PfSEA-1A vs PfGARP. Volcano plot from EdgeR analysis comparing CD4pos, CD4posCXCR5pos, CD8pos, and CD14/CD19pos populations from children PBMCs under the following conditions: (d) unstimulated vs PfSEA-1A, (e) unstimulated vs PfGARP, and (f) PfSEA-1A vs PfGARP. The green dots are statistically significant, whereas the black dots are not; here, no green dots were observed.
Figure 3 with 1 supplement
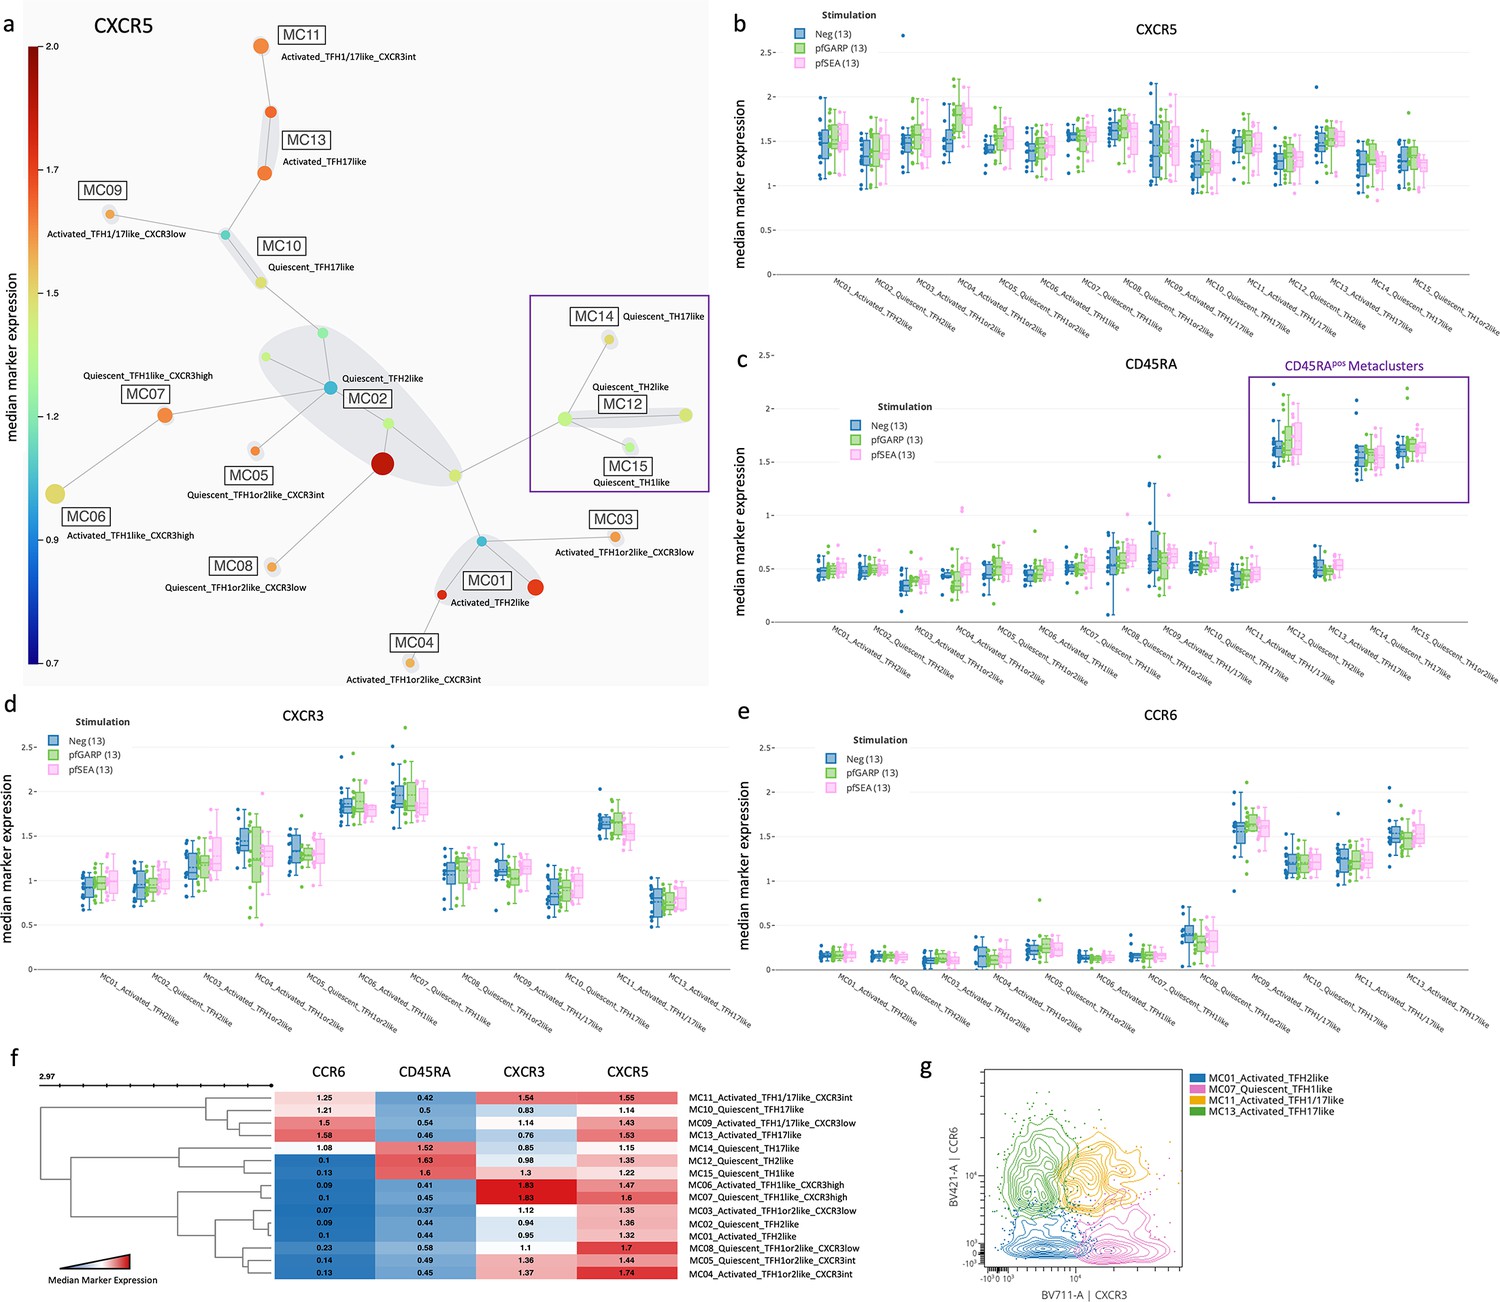
Characterization of TFH subsets by CXCR5, CXCR3, CCR6, and CD45RA expression.
(a) A new 25-node and 15 meta-cluster FlowSOM tree was generated from the five CD4posCXCR5posCD25neg nodes as shown in Figure 2a (CXCR5 expression tree). The colored scale of CXCR5 expression was based on the median arcsinh-transformed with red as the highest and deep blue as the absence of CXCR5 expression. (b) Box plots showing CXCR5 expression across all cTFH-like meta-clusters from children (n=13) with no stimulation (blue) and after in vitro stimulation with PfGARP (green) or PfSEA-1A (pink). Fifty percent of the data points are within the box limits, the solid line indicates the median, the dashed line indicates the mean, and the whiskers indicate the range of the remaining data with outliers being outside that range. Similar box plots are shown for (c) CD45RA, (d) CXCR3, and (e) CCR6 expression across all cTFH-like meta-clusters. (f) Clustered heatmap showing the median arcsinh-transformed expression for CCR6, CD45RA, CXCR3, and CXCR5 across meta-clusters, red showing the highest expression and blue the lowest. (g) Cytoplots of CCR6 vs CXCR3 expression where MC01 is blue, MC07 is pink, MC11 is yellow, and MC13 is green.
Figure 3—figure supplement 1
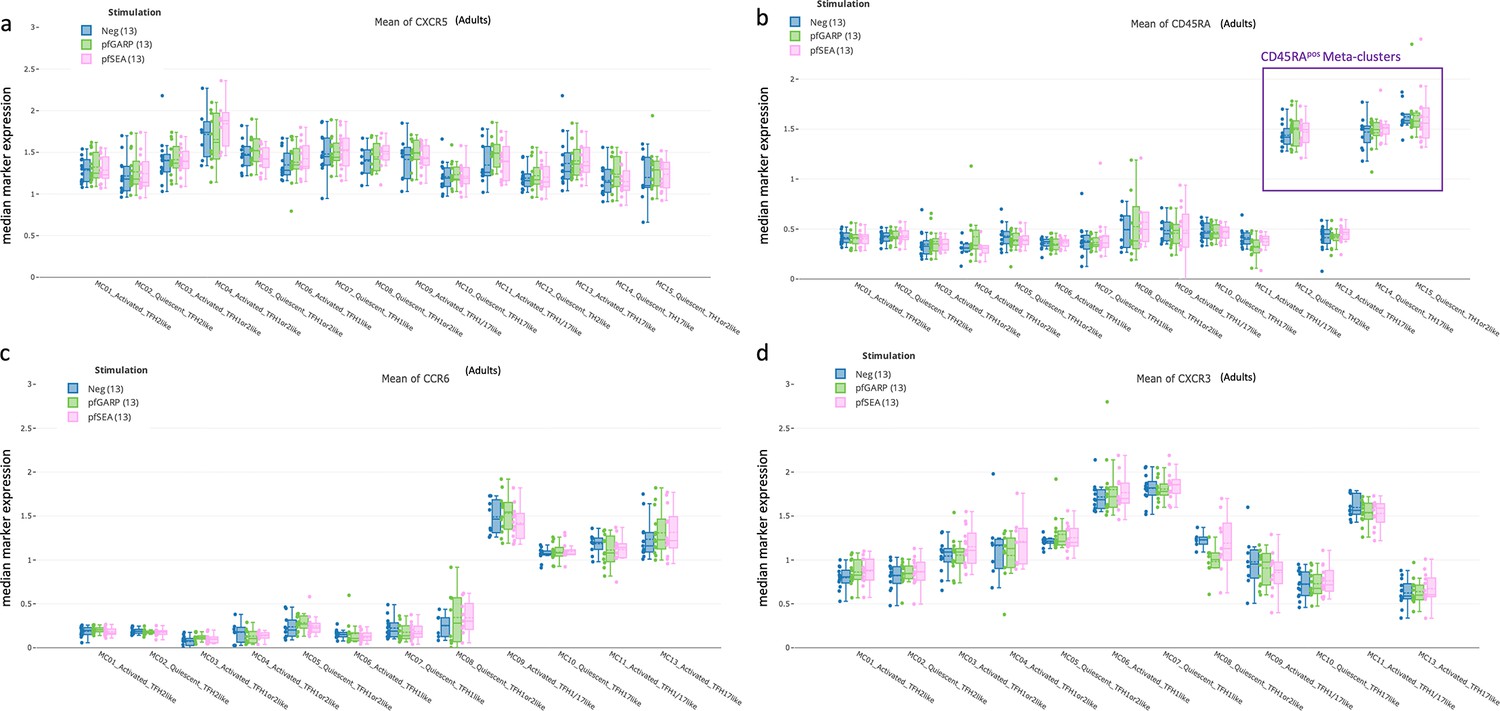
Characterization of TFH subsets using CXCR5, CXCR3, CCR6, and CD45RA expression.
Bar plots showing (a) CXCR5, (b) CD45RA, (c) CCR6, and (d) CXCR3 expression across all cTFH-like meta-clusters from adults (n=13) under no stimulation (blue), PfGARP (green), and PfSEA-1A (pink) stimulations. Fifty percent of the data are within the box limits, the solid line indicates the median, the dashed line the mean, and the whiskers indicate the range of the remaining data with outliers being outside that range.
Figure 4 with 3 supplements

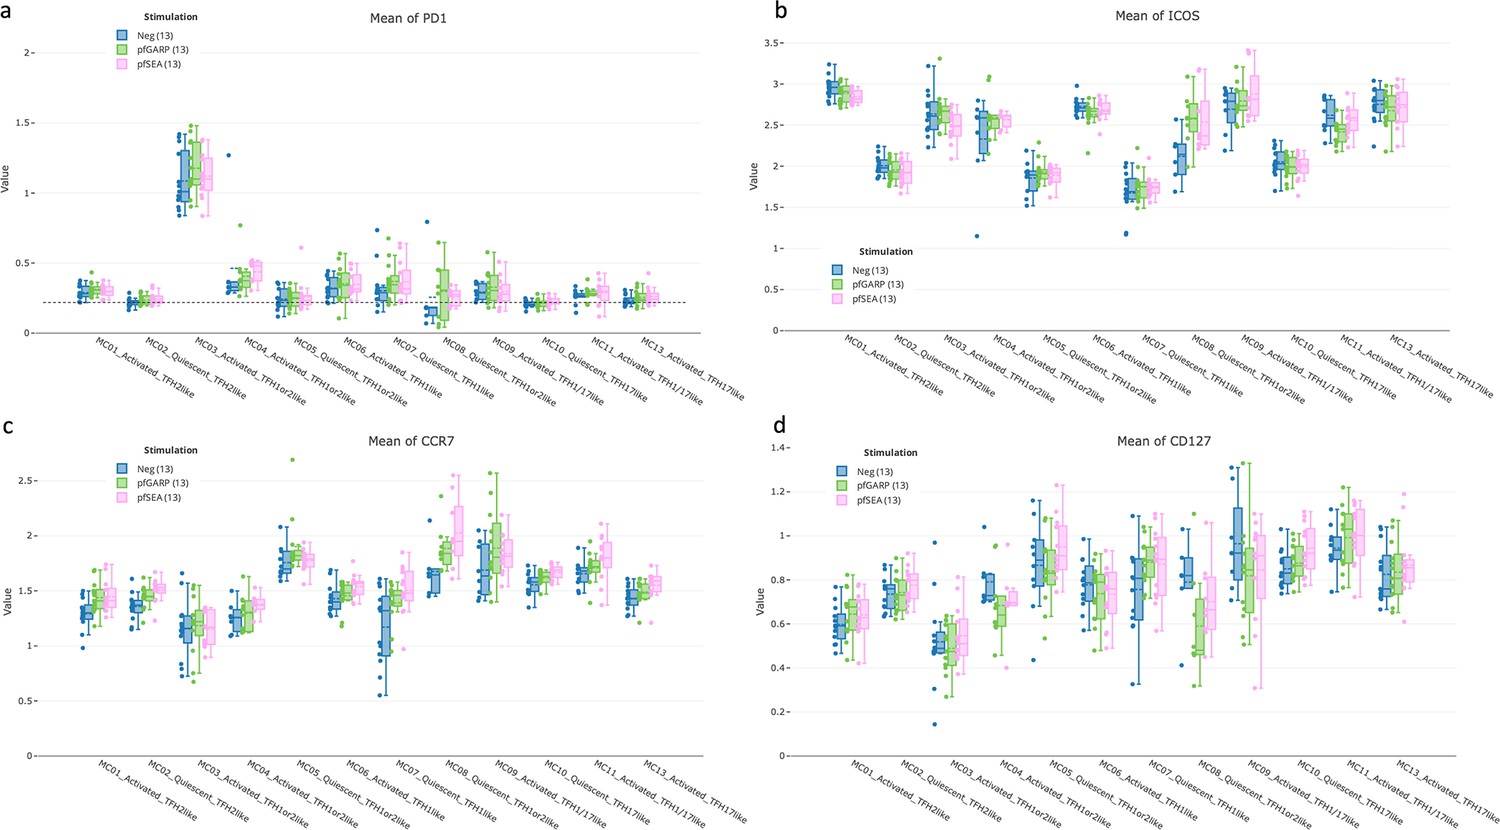
cTFH subset activation state determined by PD1, ICOS, CCR7, and CD127.
Box plots showing (a) PD1, (b) ICOS, (c) CCR7, and (d) CD127 expression across all cTFH-like meta-clusters from children (n=13) with no stimulation (blue), and after in vitro stimulation with PfGARP (green) or PfSEA-1A (pink). Fifty percent of the data points are within the box limits, the solid line indicates the median, the dashed line indicates the mean, and the whiskers indicate the range of the remaining data, with outliers being outside that range.
Figure 4—figure supplement 1
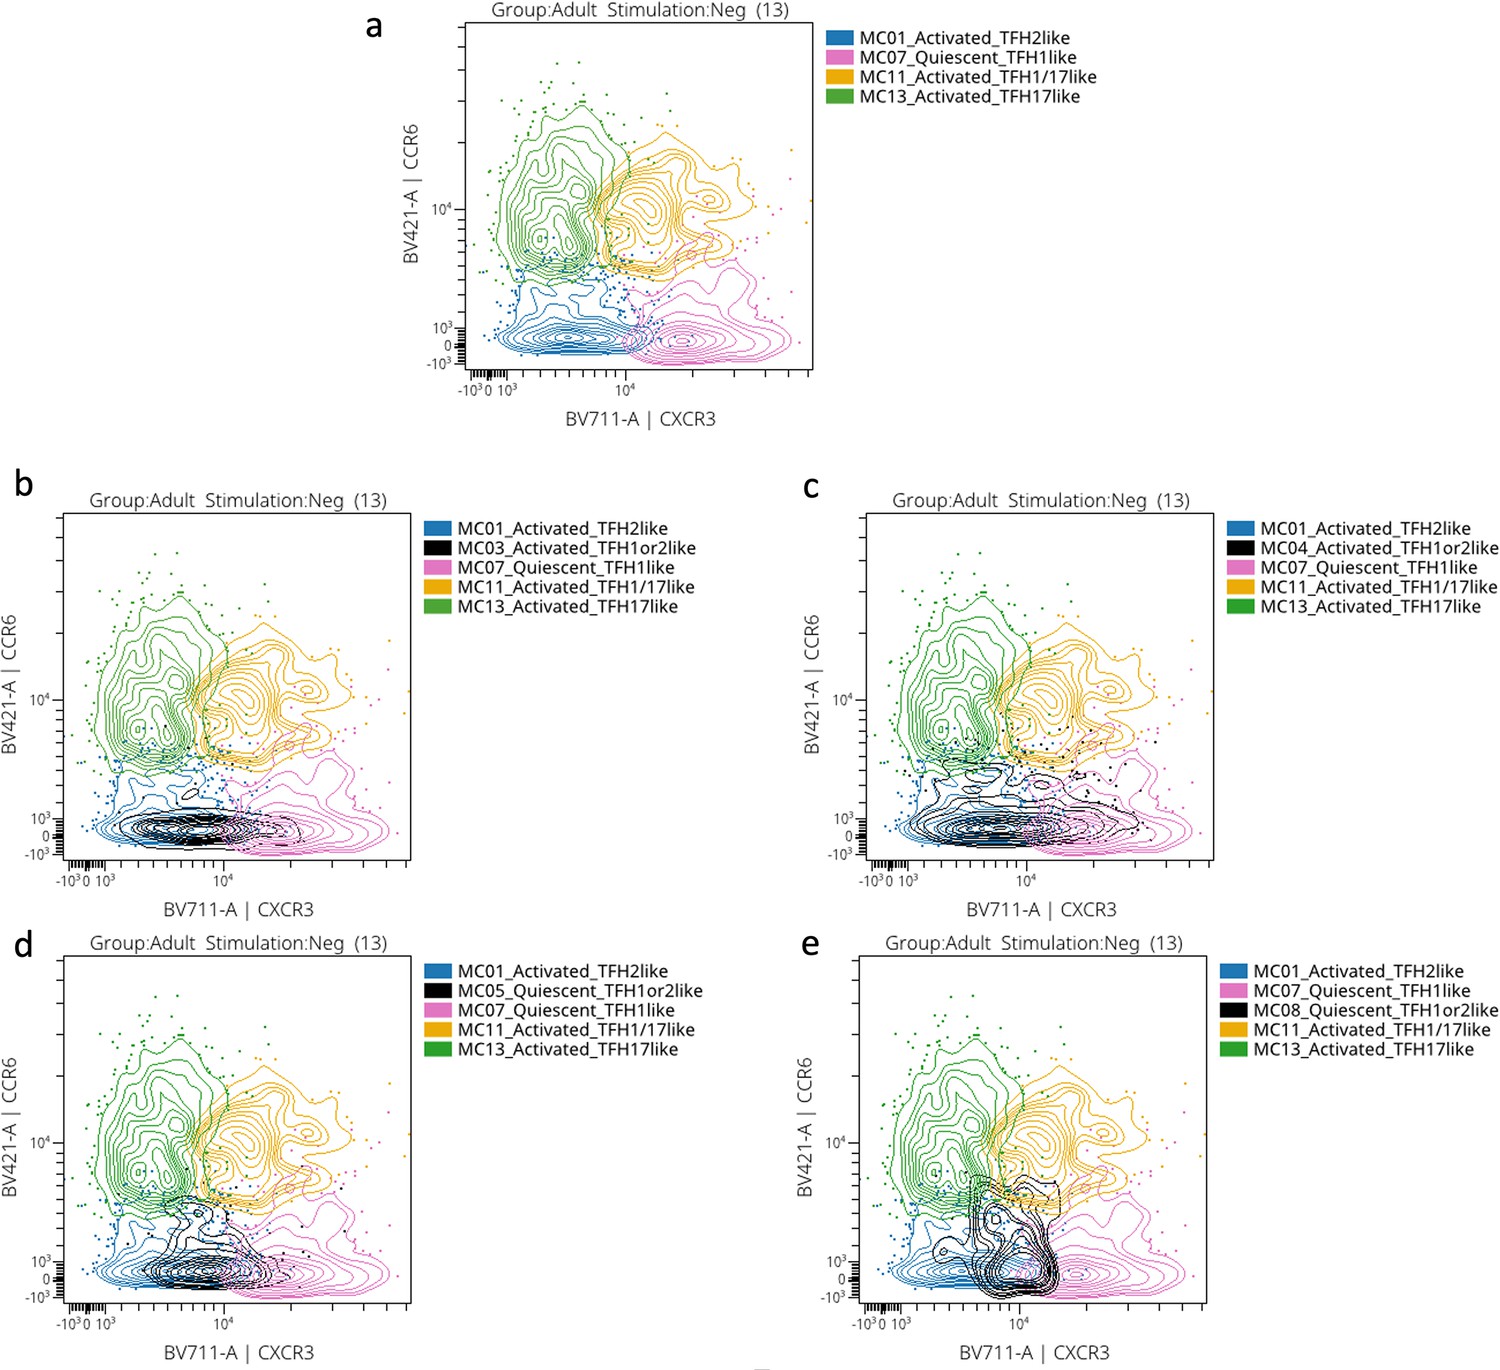
CCR6 vs CXCR3 representative cytoplots.
(a) CCR6 vs CXCR3 expression from activated cTFH2-like MC01 (in blue), quiescent cTFH1-like MC07 (in pink), activated cTFH1/17-like MC11 (in orange), and activated cTFH17-like MC13 (in green). Undetermined meta-clusters were superposed to the sus-mentioned metacluster: activated cTFH1or2-like MC03 (in black) (b); activated cTFH1or2-like MC04 (in black) (c); quiescent cTFH1or2-like MC05 (in black) (d); quiescent cTFH1or2-like MC08 (in black) (e).
Figure 4—figure supplement 2
State of activation of cTFH subsets from adults determined by PD1, ICOS, CCR7, and CD127.
Bar plots showing (a) PD1, (b) ICOS, (c) CCR7, and (d) CD127 expression across all cTFH-like meta-clusters in adults (n=13) under no stimulation (blue), PfGARP (green), and PfSEA-1A (pink) stimulations. Fifty percent of the data are within the box limits, the solid line indicates the median, the dashed line the mean, and the whiskers indicate the range of the remaining data with outliers being outside that range.
Figure 4—figure supplement 3
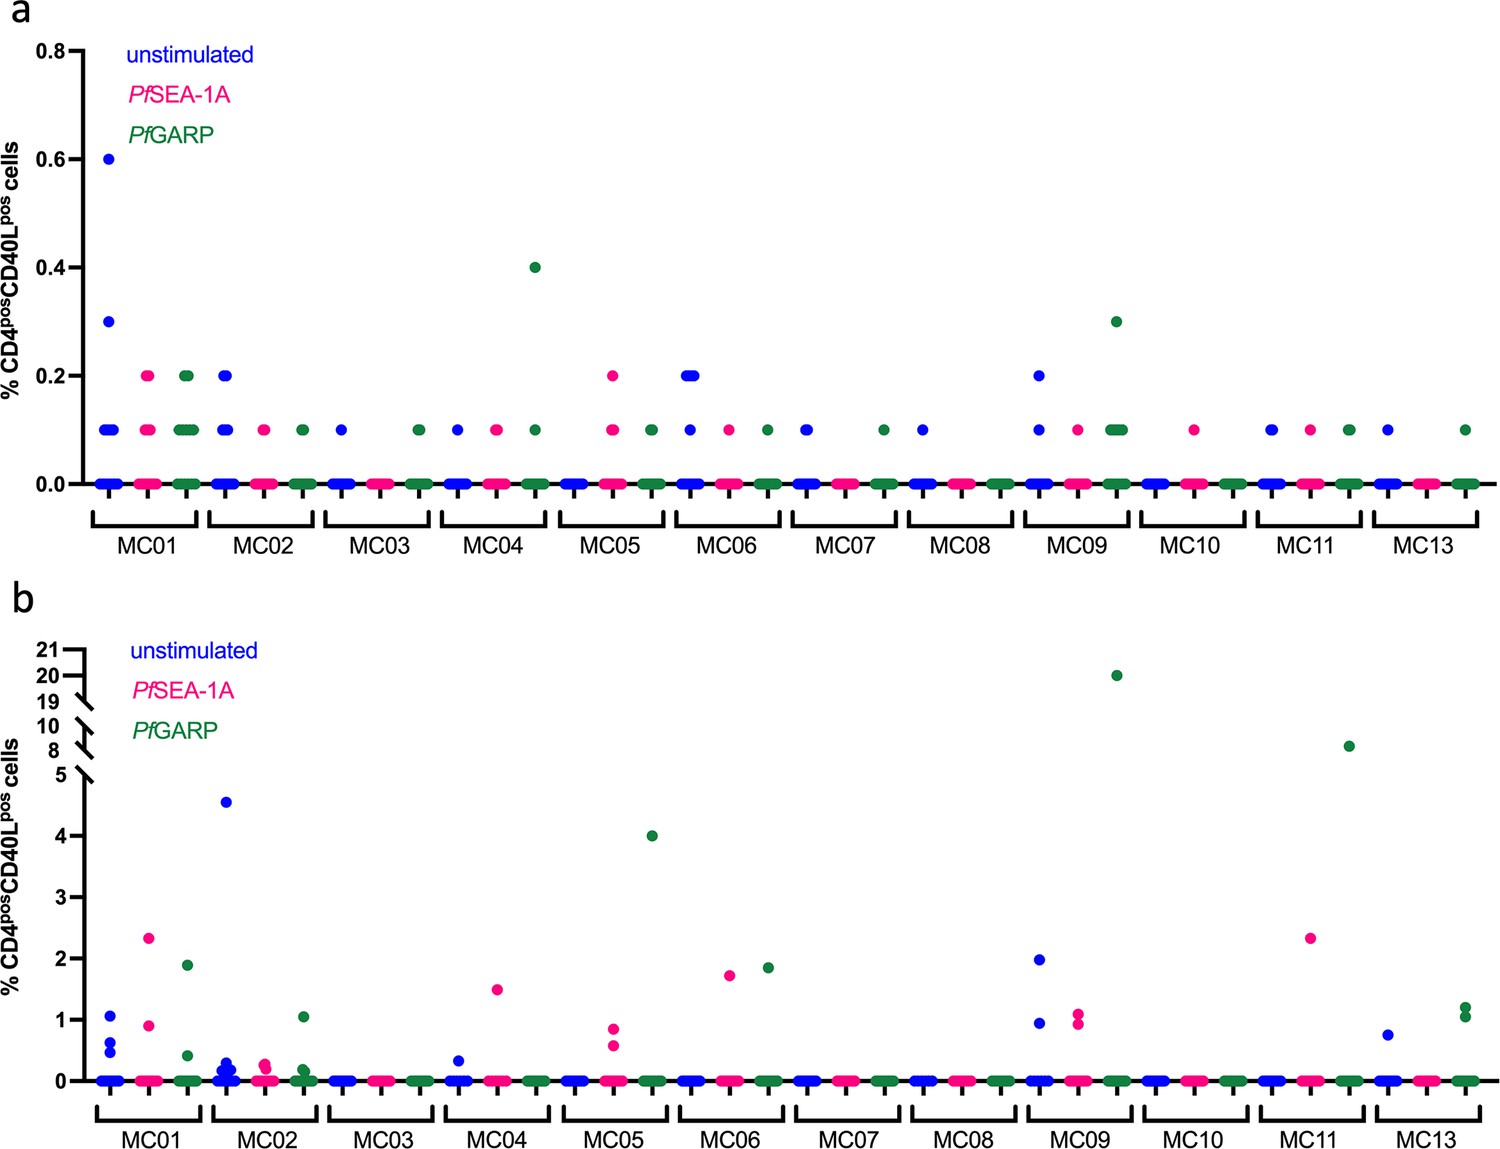
CD40L expression across stimulation and meta-clusters.
Dot plots of CD40L expression after manual gating based on unstimulated condition from children (n=13) (a) and adults (n=13) (b) cTFH meta-clusters.
Figure 5 with 1 supplement
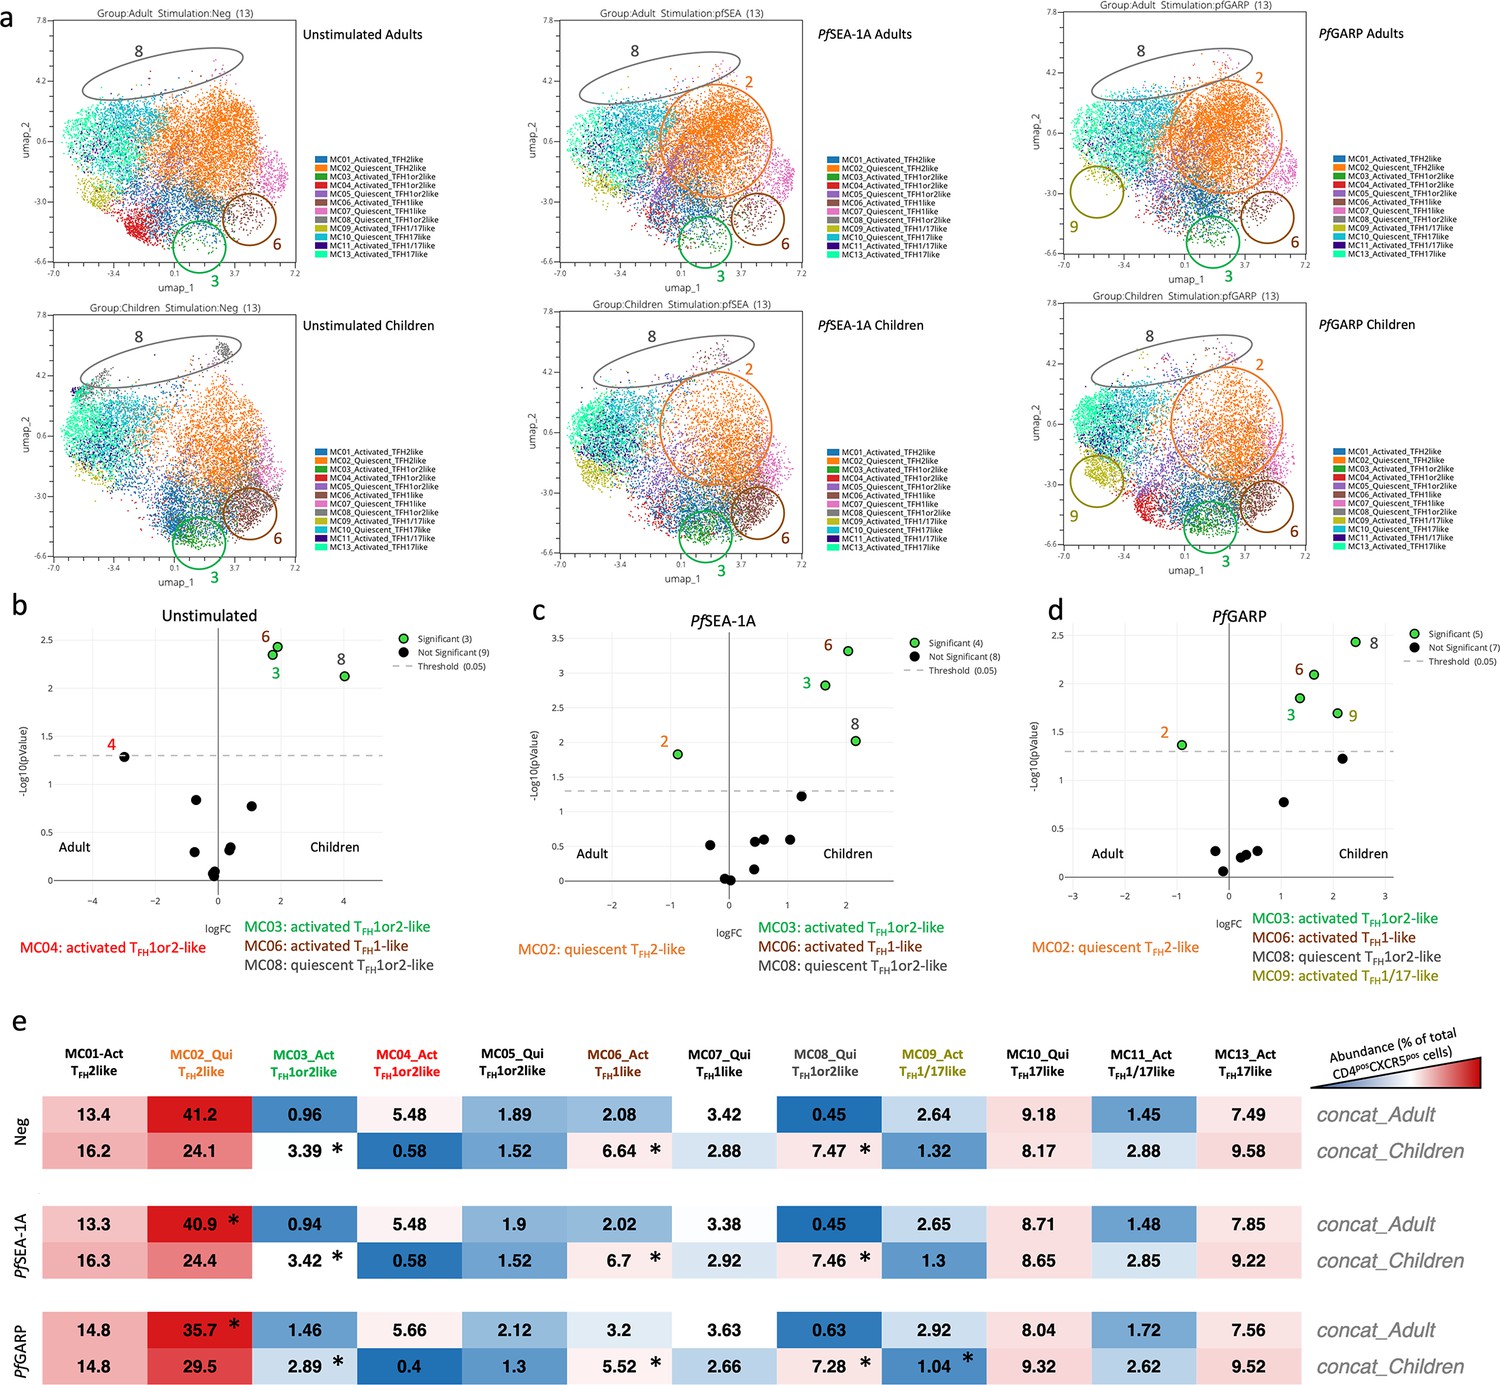
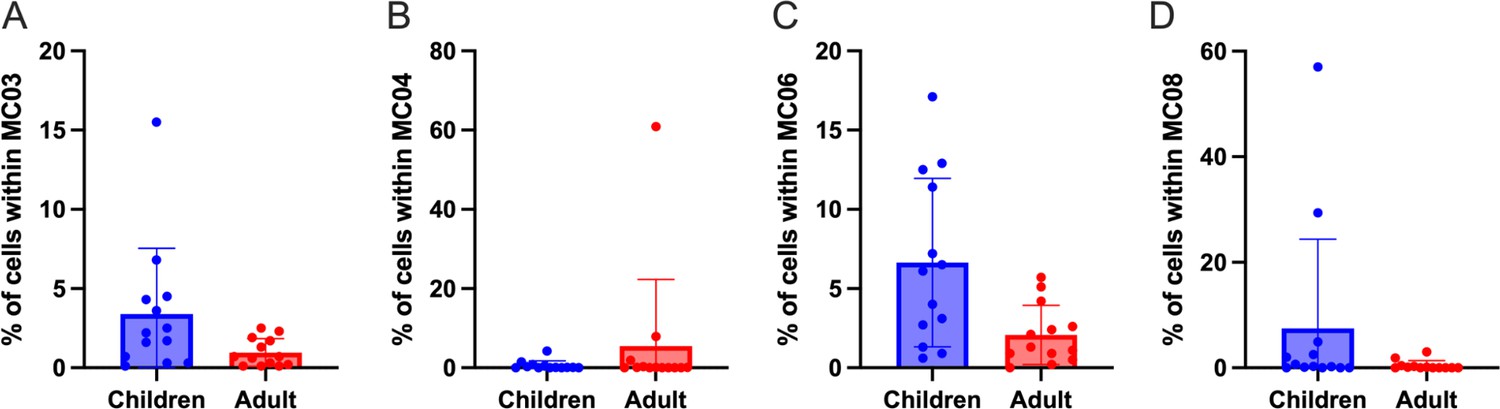
Differences in abundance of antigen-specific cTFH meta-clusters for adults and children.
(a) Uniform Manifold Approximation and Projection (UMAP) plots showing the 12 different cTFH meta-clusters in adults (top three plots, n=13) and in children (bottom three plots, n=13) in the absence of stimulation or after in vitro stimulation with PfSEA-1A or PfGARP, from left to right, respectively. Colored circles highlight the meta-clusters showing differences in their abundance between adults and children for each condition. An EdgeR statistical plot was performed to assess the change in abundance of the 12 meta-clusters between adults and children after (b) no stimulation or stimulation with (c) PfSEA-1A or (d) PfGARP. EdgeR plots indicate which meta-clusters are significantly abundant between two groups by using green color dots. The Y-axis is the -log10(p-value), and the X-axis is the log(FC). Green dots were statistically significant (p<0.05). Numbers next to the dots indicate the meta-cluster. (e) An abundance heatmap indicates the percentage (black numbers) of each meta-cluster within the total number of CD3posCD4posCXCR5posCD25neg cells for adults and children (concatenated from 13 participants in each group) under the different conditions: no stimulation (Neg) or stimulation with PfSEA-1A or PfGARP. The color scale ranges from high expression (red) to low/no expression (blue). The star in the heatmap indicates which meta-cluster is significantly abundant in children or adults based on the EdgeR results.
Figure 5—figure supplement 1
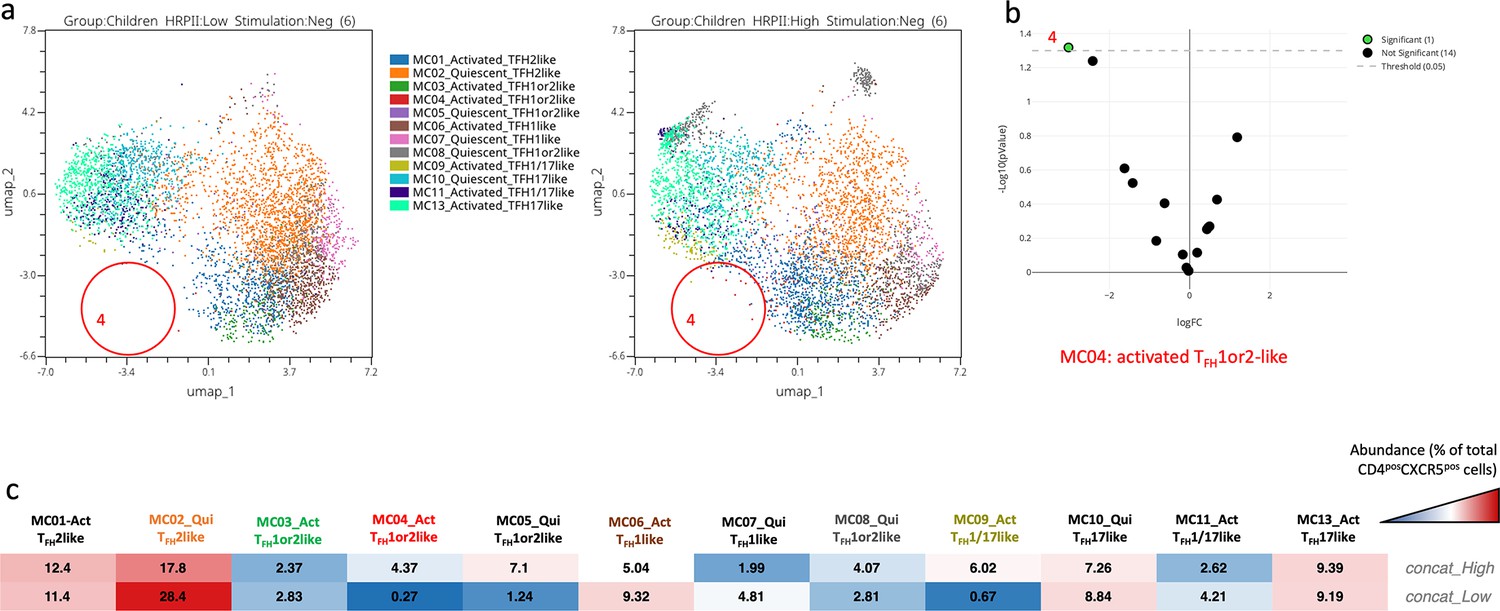
Abundance of the cTFH meta-clusters within children with low or high levels of HRP2 antibodies.
(a) Uniform Manifold Approximation and Projection (UMAP) plot showing the clustering of the 13 different cTFH meta-clusters (MC15) in children with low levels of HRP2 (on the left, n=6) and high levels of HRP2 (on the right, n=6) in the absence of stimulation. Each color represents a meta-cluster. The red circles highlight the meta-cluster showing differences in its abundance between the two groups of children. (b) An EdgeR statistical plot was performed to assess the abundance of the 13 meta-clusters between unstimulated peripheral blood mononuclear cells (PBMCs) from both groups of children; the Y-axis being -log10(p-value) and the X-axis shows the log(FC). The green dot (MC04) is statistically significant, whereas the black dots are not. (c) An abundance heatmap showing the distribution (in %) of each meta-cluster within the two groups of children (both concatenated unstimulated PBMCs from six participants). The color scale ranges from high abundance (red) to low abundance (blue).
Figure 6 with 6 supplements
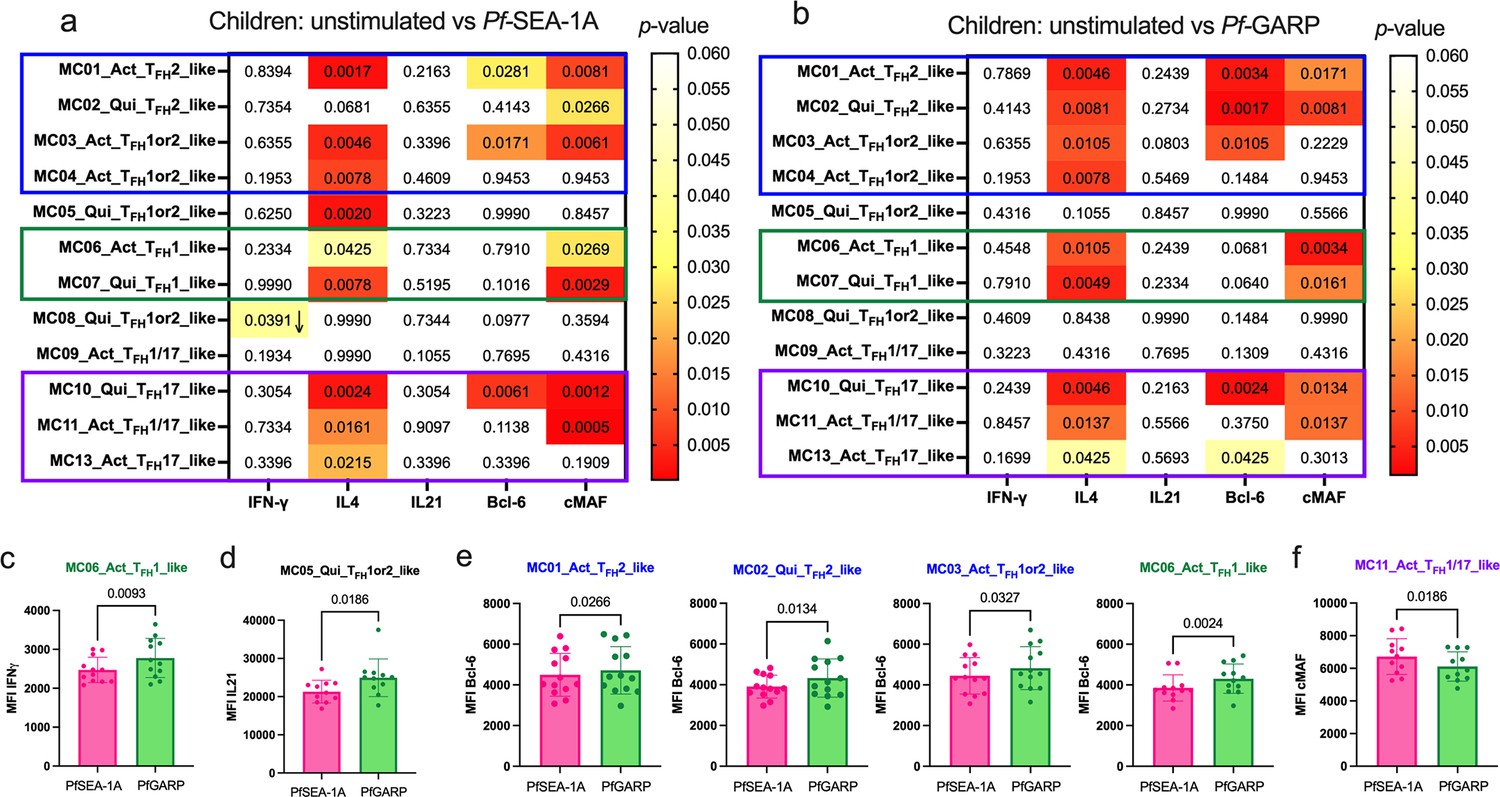
Diverse Pf-malaria antigen-specific expression patterns of cTFH-defining cytokines and transcription factors for children.
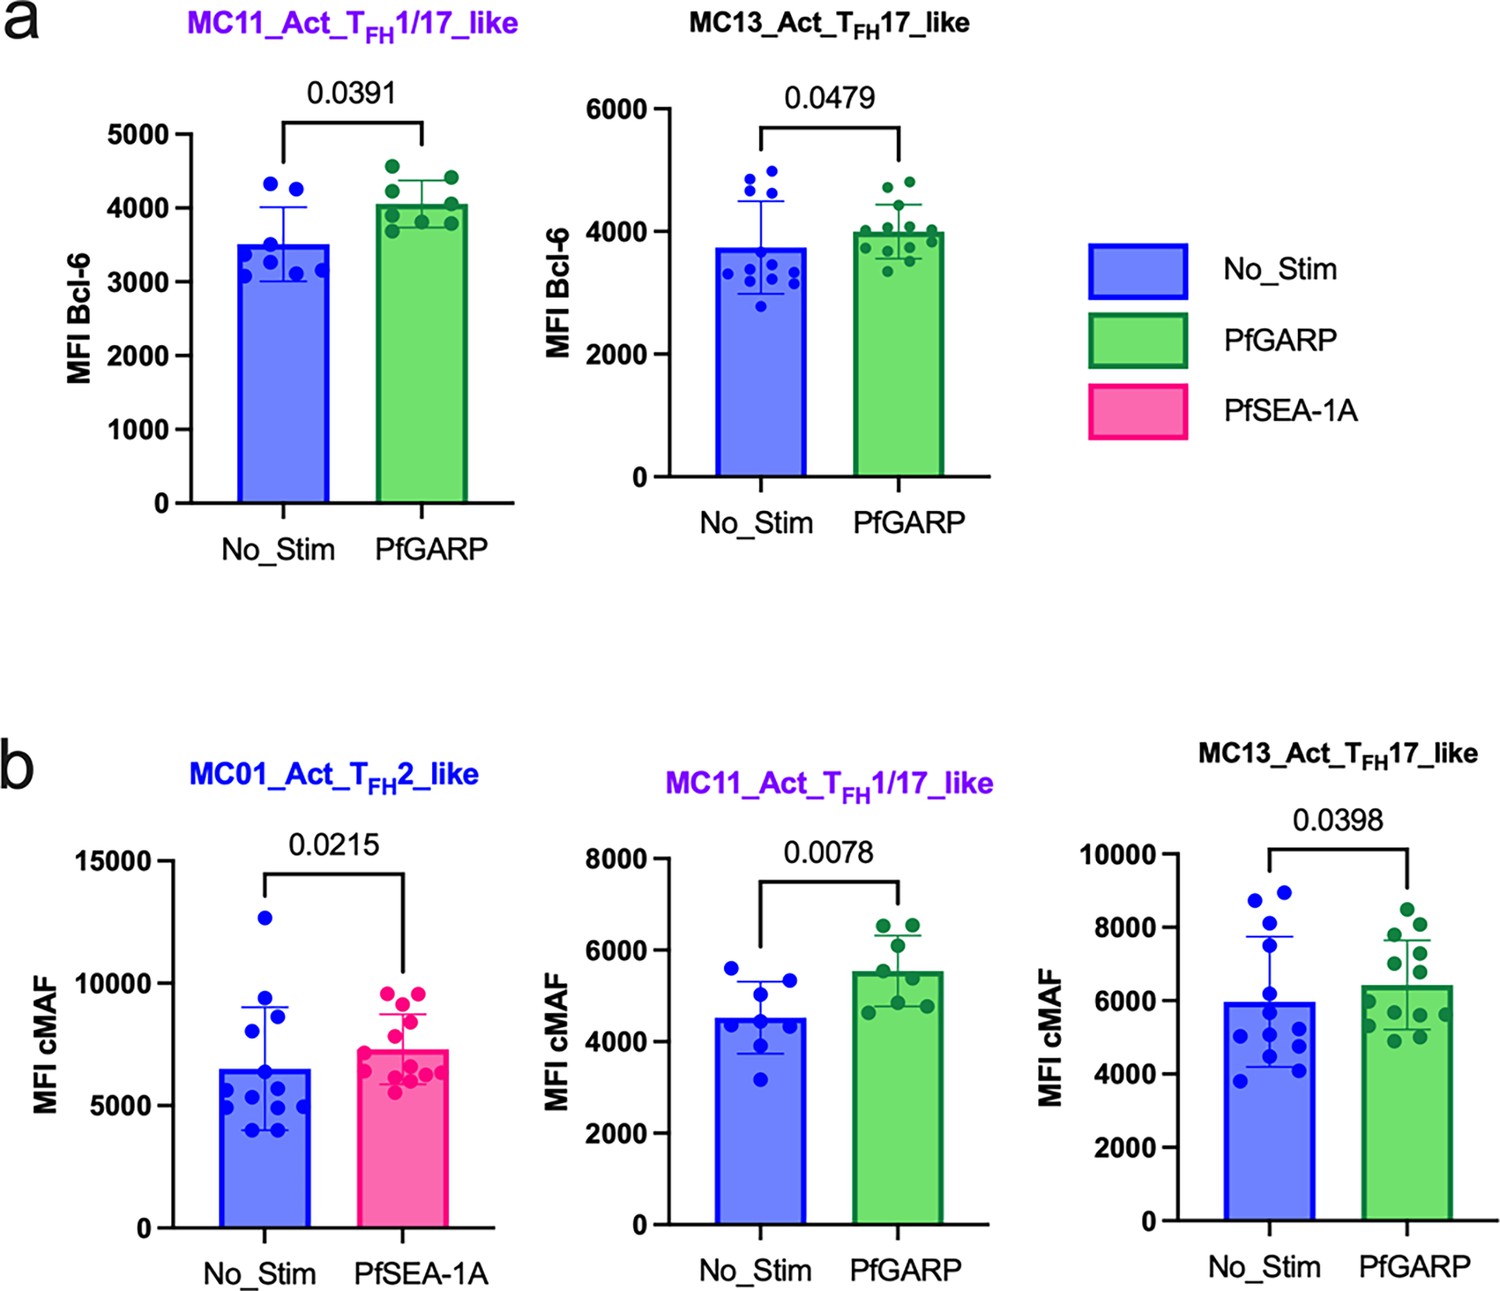
Heatmaps of Wilcoxon paired two-tailed t-test p-values are shown for cTFH meta-clusters comparing (a) PfSEA-1A and (b) Pf-GARP vs unstimulated peripheral blood mononuclear cells (PBMCs) from children (n=13) for each cytokine (IFNγ, IL-4, and IL-21) and transcription factor (Bcl6 and cMAF). The color scale indicates the significance of the p-value: white (nonsignificant, p>0.05), yellow (0.05>p>0.02), orange (0.02>p>0.005), and red (highly significant, p<0.005). The down arrow indicates a decrease of expression from unstimulated to stimulated condition, whereas no arrow indicates an increase of expression from unstimulated to stimulated condition. The cTFH meta-clusters that co-expressed transcription factors were grouped as follows: Group 1 (blue line), Group 2 (green line), and Group 3 (purple line). Bar plots indicating mean with standard deviation (SD) of the median intensity fluorescence (MFI) of (c) IFNγ, (d) Bcl6, and (e) cMAF for the cTFH meta-clusters showing significant statistical differences between PfSEA-1A and PfGARP stimulations. The p-values from Wilcoxon paired two-tailed t-tests are indicated.
Figure 6—figure supplement 1
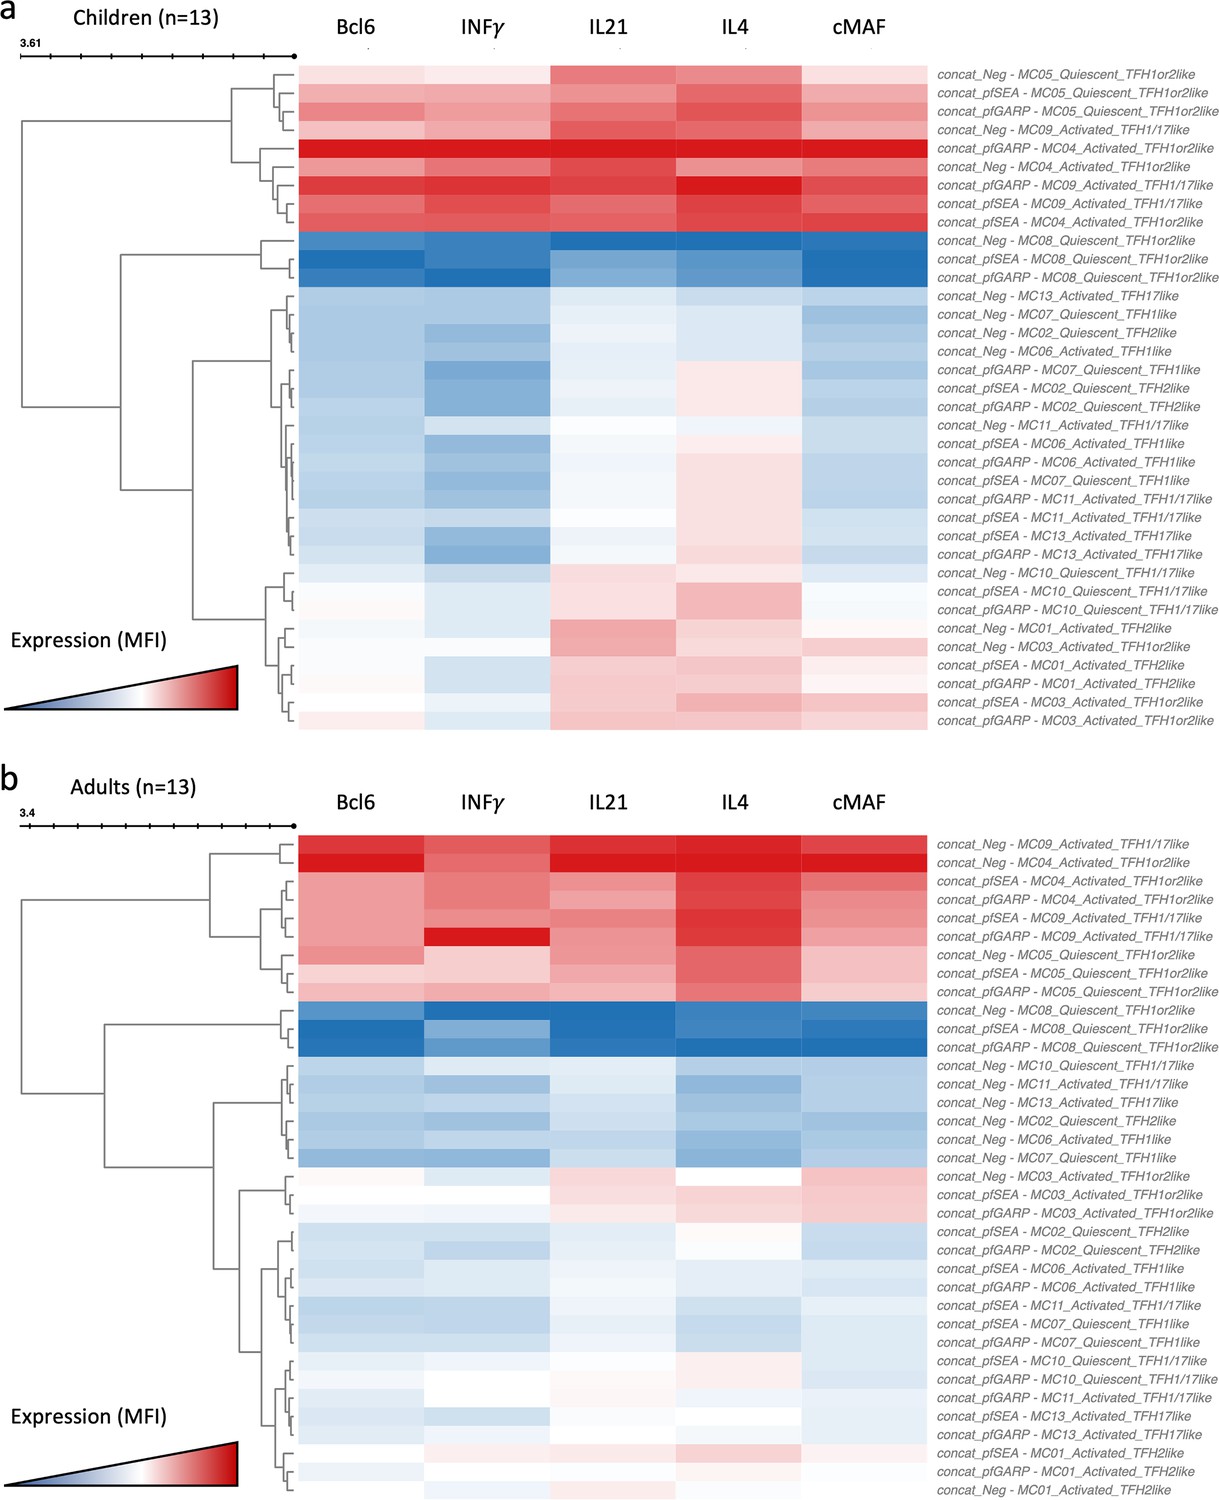
Clustered heatmap of the cytokines and transcription factors expressed from cTFH meta-clusters in adults and children under the different stimulation conditions.
Heatmap of Bcl6, IFNγ, IL21, IL4, and cMAF expression from the 13 cTFH meta-clusters from concatenated data from (a) children (n=13) and (b) adults (n=13), after stimulation by PfSEA-1A or PfGARP, or without any stimulation as indicated in the name of each row. The color scale ranges from high expression (red) to low/no expression (blue).
Figure 6—figure supplement 2
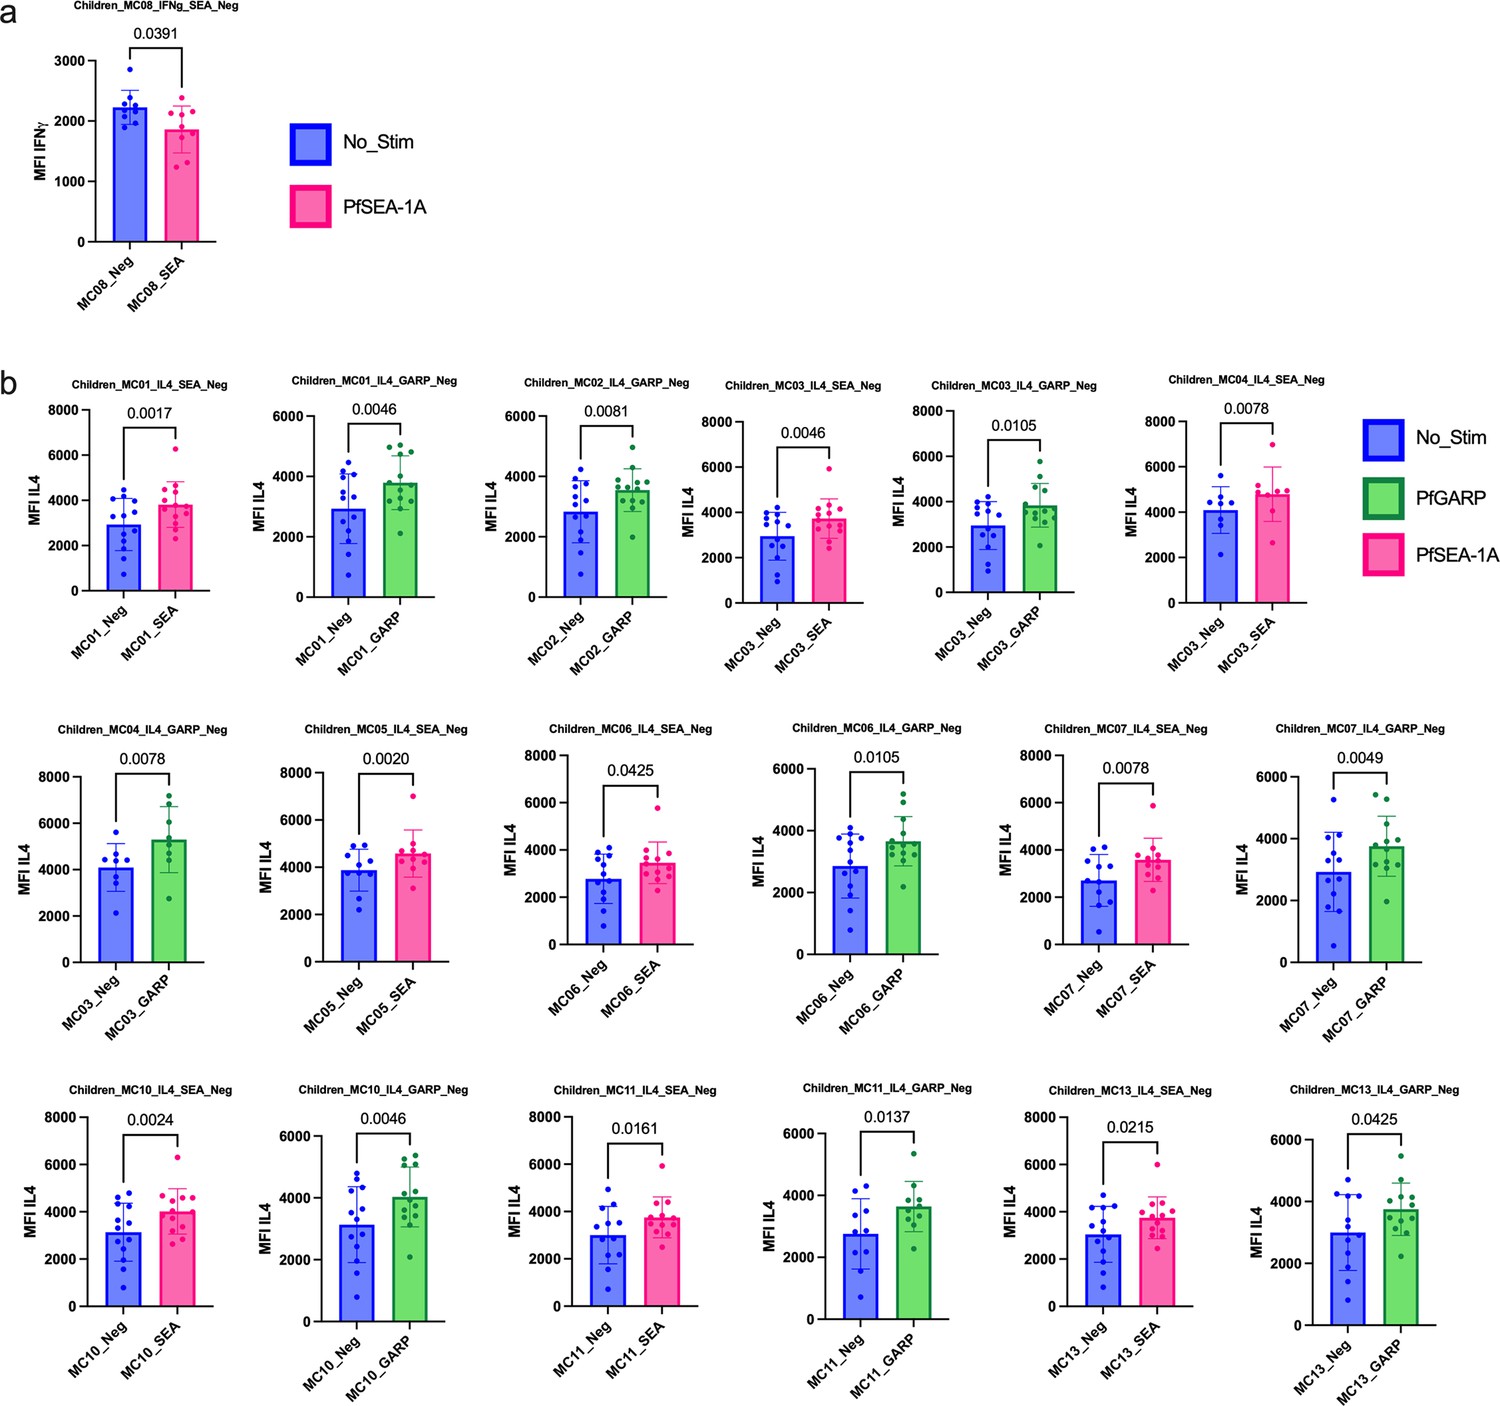
Bar plots of cytokines expressed under the different conditions of stimulation in children (n=13).
Comparison of mean fluorescent intensity (MFI) of (a) IFNγ, (b) IL4 cytokines expression after PfSEA-1A (pink) or PfGARP (green) stimulation or no stimulation control (blue). Bar plots indicate mean with standard deviation (SD). Wilcoxon paired two-tailed t-tests were performed, and p-values are indicated.
Figure 6—figure supplement 3
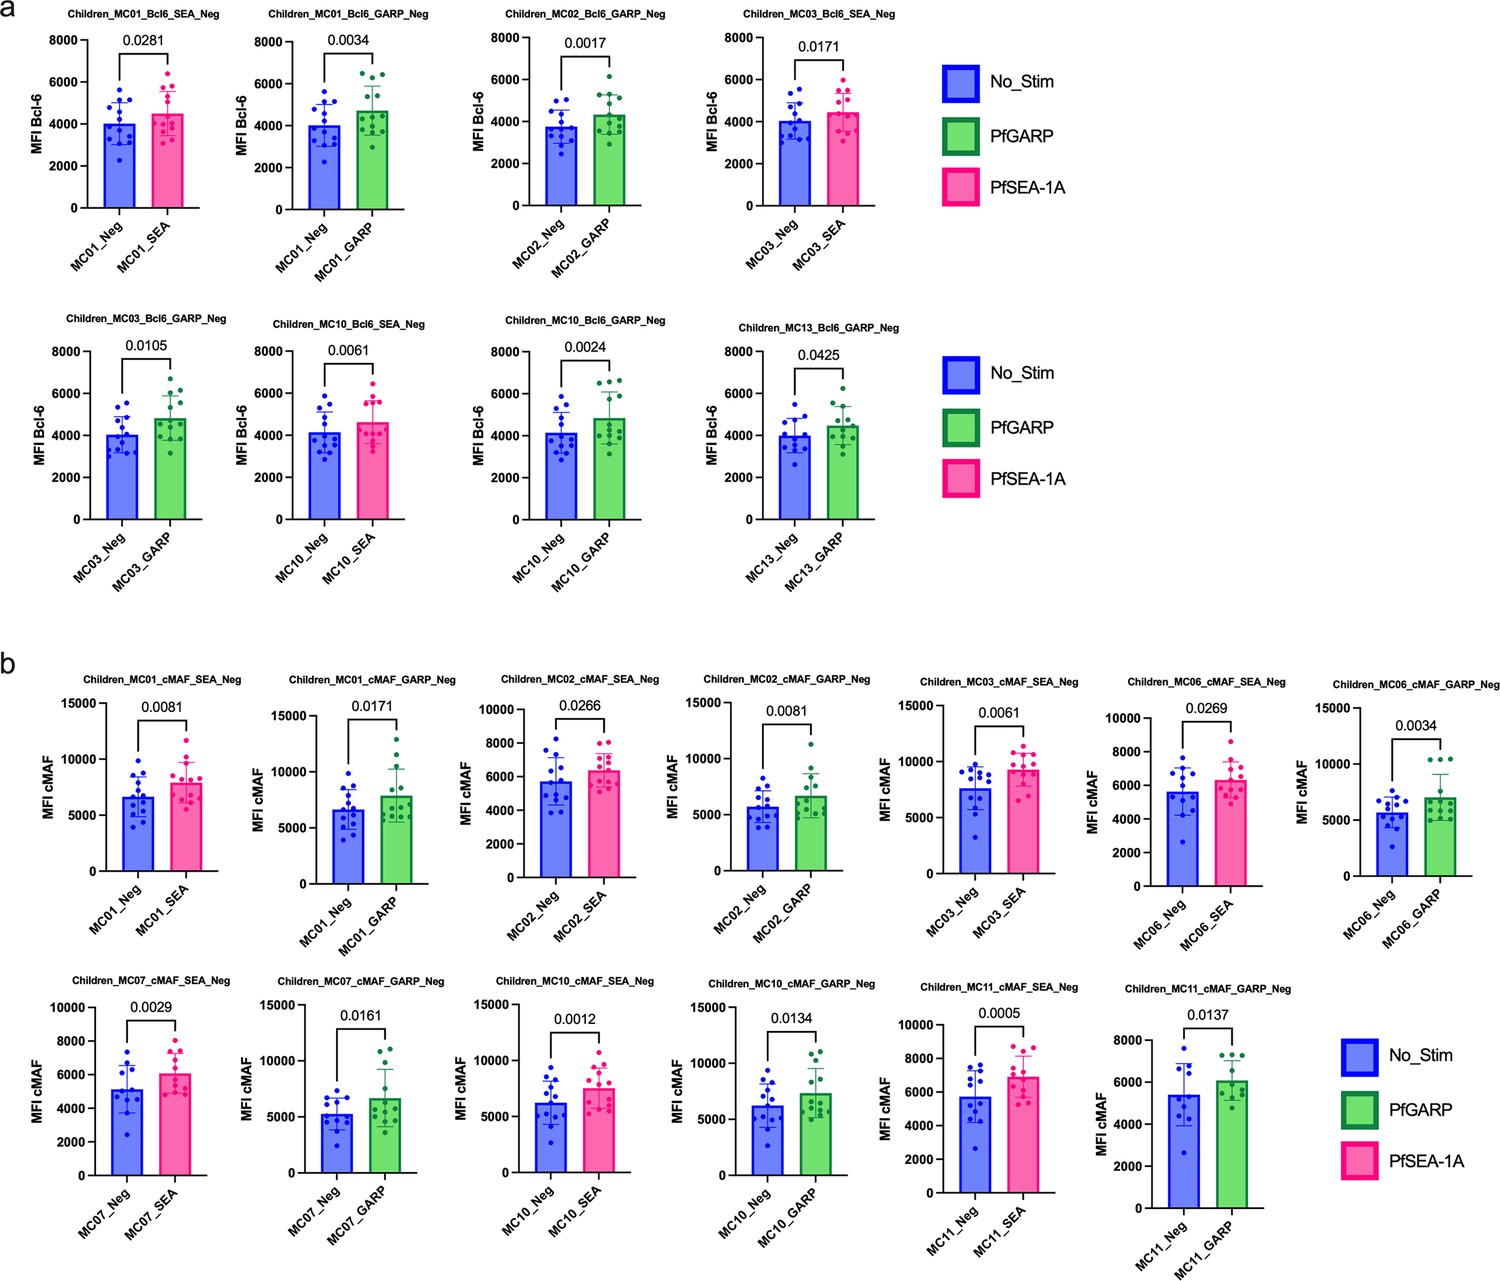
Bar plots of transcription factors expressed under the different conditions of stimulation in children (n=13).
Comparison of mean fluorescent intensity (MFI) of (a) Bcl6 and (b) cMAF expression after PfSEA-1A (pink) or PfGARP (green) stimulation or no stimulation control (blue). Bar plots indicate mean with standard deviation (SD). Wilcoxon paired two-tailed t-tests were performed, and p-values are indicated.
Figure 6—figure supplement 4
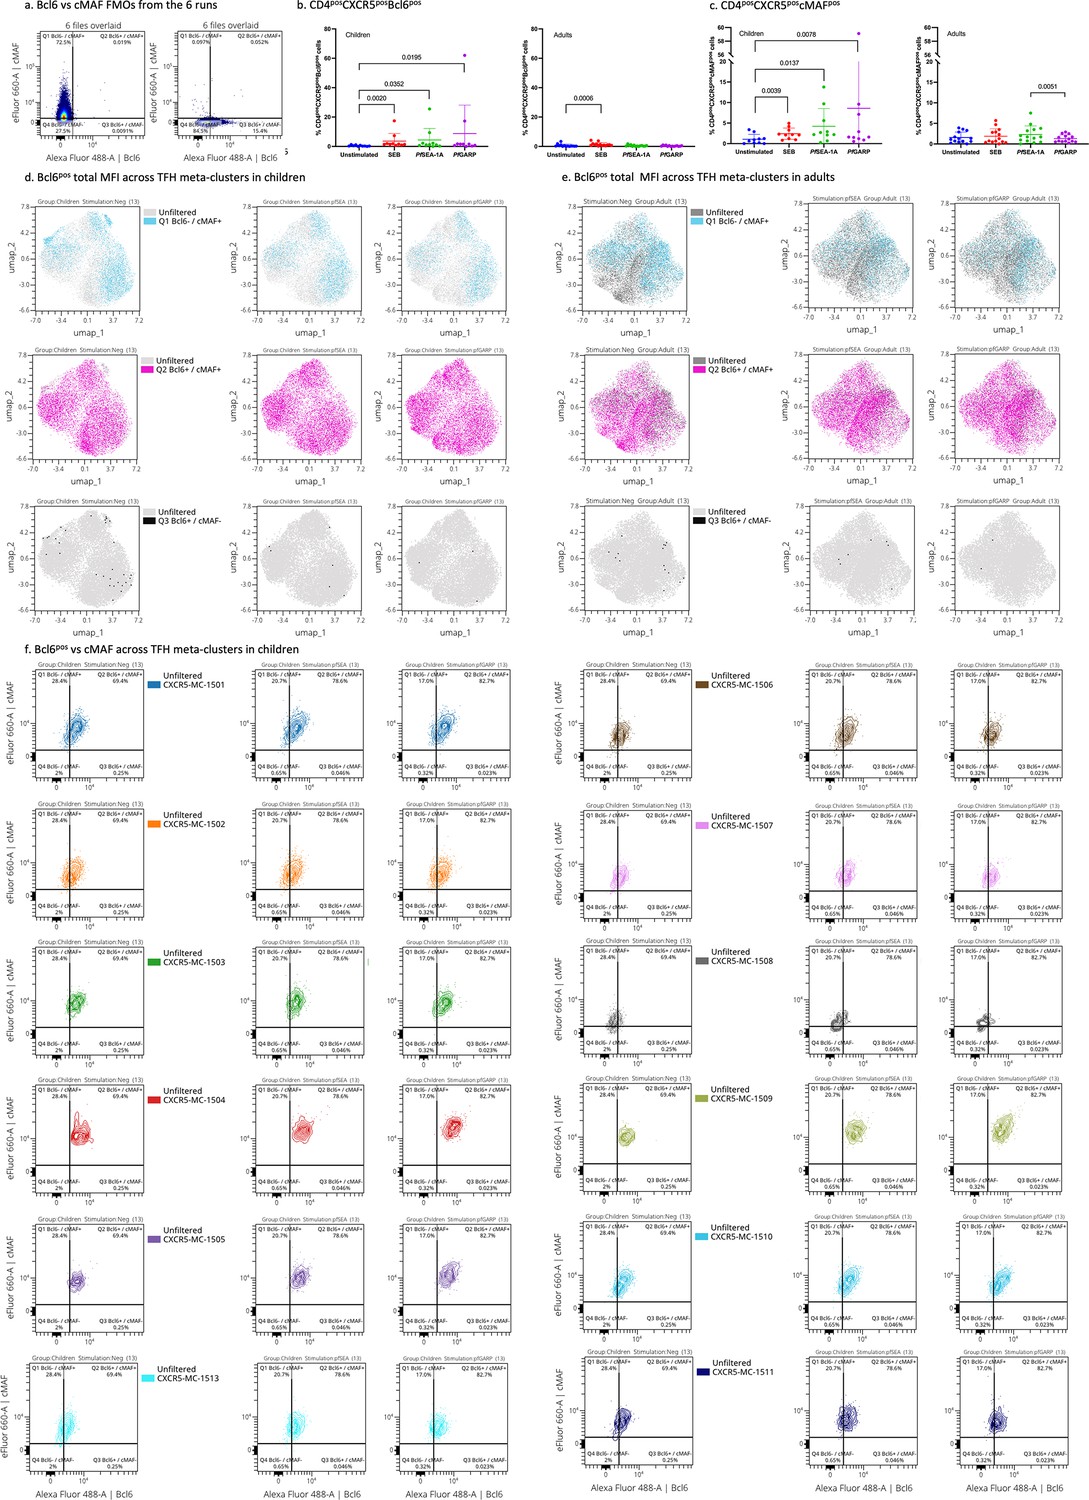
Manually gated transcription factors expression upon stimulation.
(a) Bcl6 vs cMAF cytoplots from the six runs overlaid FMOs. (b) Percentage of CD4posCXCR5posBcl6pos cells across stimulation in children (left) and adults (right). Bar plots indicate mean with standard deviation (SD). Wilcoxon paired two-tailed t-tests were performed, and p-values are indicated. (c) Percentage of CD4posCXCR5poscMAFpos cells across stimulation in children (left) and adults (right). Bar plots indicate mean with SD. Wilcoxon paired two-tailed t-tests were performed, and p-values are indicated. Manually gated positive Bcl6 cells overlaid on the Uniform Manifold Approximation and Projection (UMAP) of the CD4posCXCR5posCD25neg cells across stimulation in children (d) and adults (e). (f) Contour plots with outliers of cMAF vs Bcl6 expression upon stimulation for each meta-cluster.
Figure 6—figure supplement 5
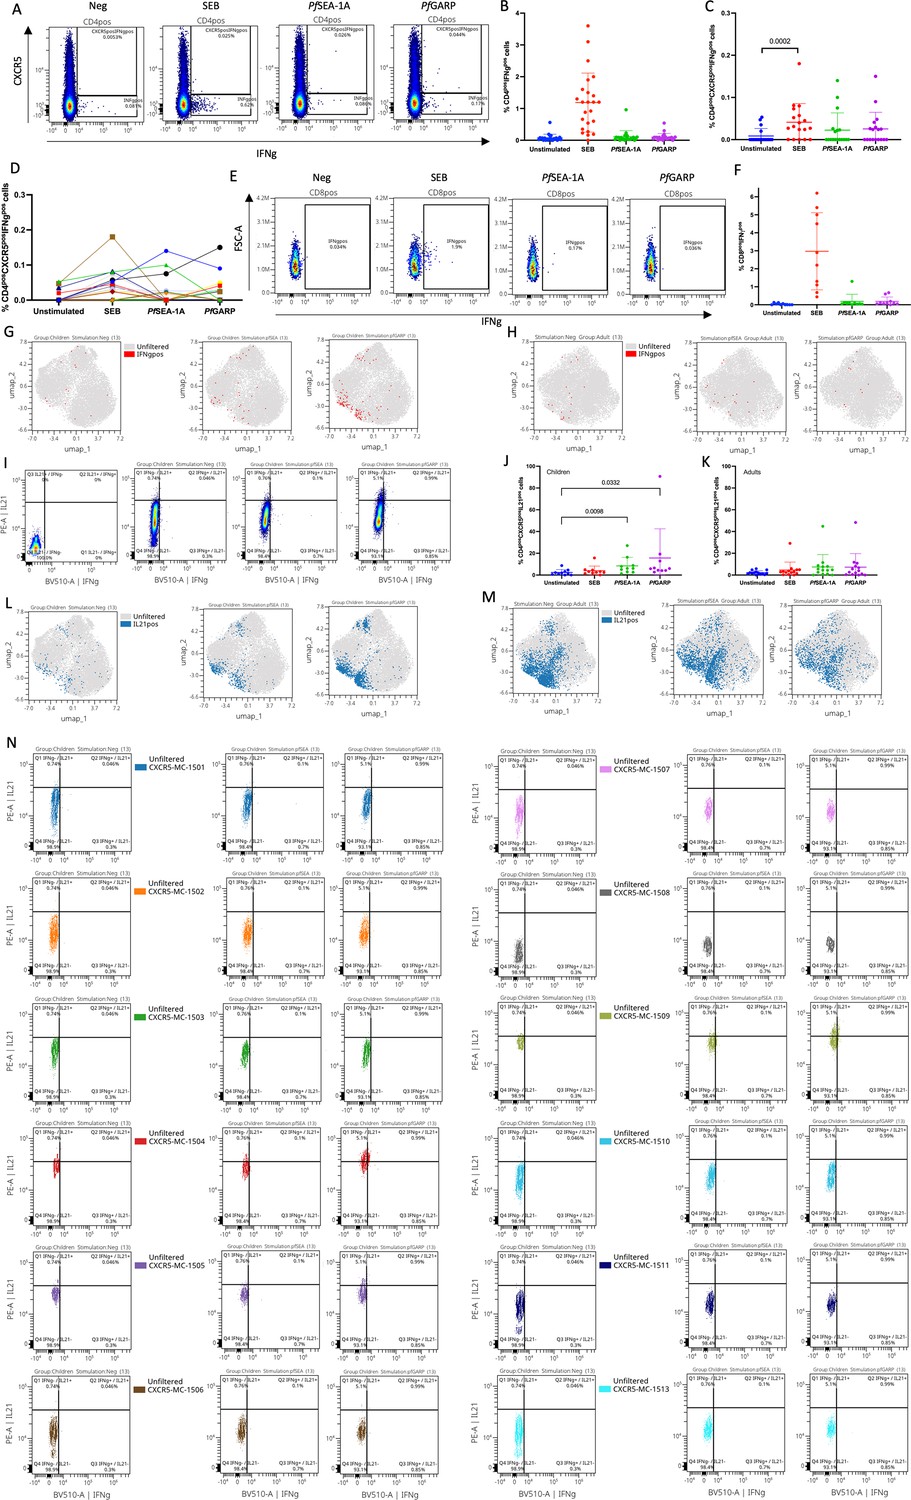
Manually gated IFNγ and IL21 expression upon stimulation.
(A) Cytoplot of IFNγ vs CXCR5 expression from CD4 T cells upon stimulation. (B) Percentage of CD4posIFNγpos cells across stimulation. (C) Percentage of CD4posCXCR5posIFNγpos cells across stimulation. (D) Spaghetti plot of the CD4posCXCR5posIFNγpos cells across stimulation, each color represents a participant. (E) Cytoplots of IFNγ vs FSC-A expression from CD89 T cells upon stimulation. (F) Percentage of CD8posIFNγpos cells across stimulation. Manually gated positive IFNγ cells overlaid on the Uniform Manifold Approximation and Projection (UMAP) of the CD4posCXCR5posCD25neg cells across stimulation in children (G) and adults (H). (I) Cytoplots of IFNγ vs IL21 expression from six overlaid FMOs and CD4posCXCR5pos T cells upon stimulation. (J) Percentage of CD4posIL21pos cells across stimulation in children. (K) Percentage of CD4posIL21pos cells across stimulation in adults. Manually gated positive IL21 cells overlaid on the UMAP of the CD4posCXCR5posCD25neg cells across stimulation in children (L) and adults (M). (N) Contour plots with outliers of IFNγ vs IL21 expression upon stimulation for each meta-cluster. Bar plots indicate mean with standard deviation (SD). Wilcoxon paired two-tailed t-tests were performed, and p-values are indicated.
Figure 6—figure supplement 6
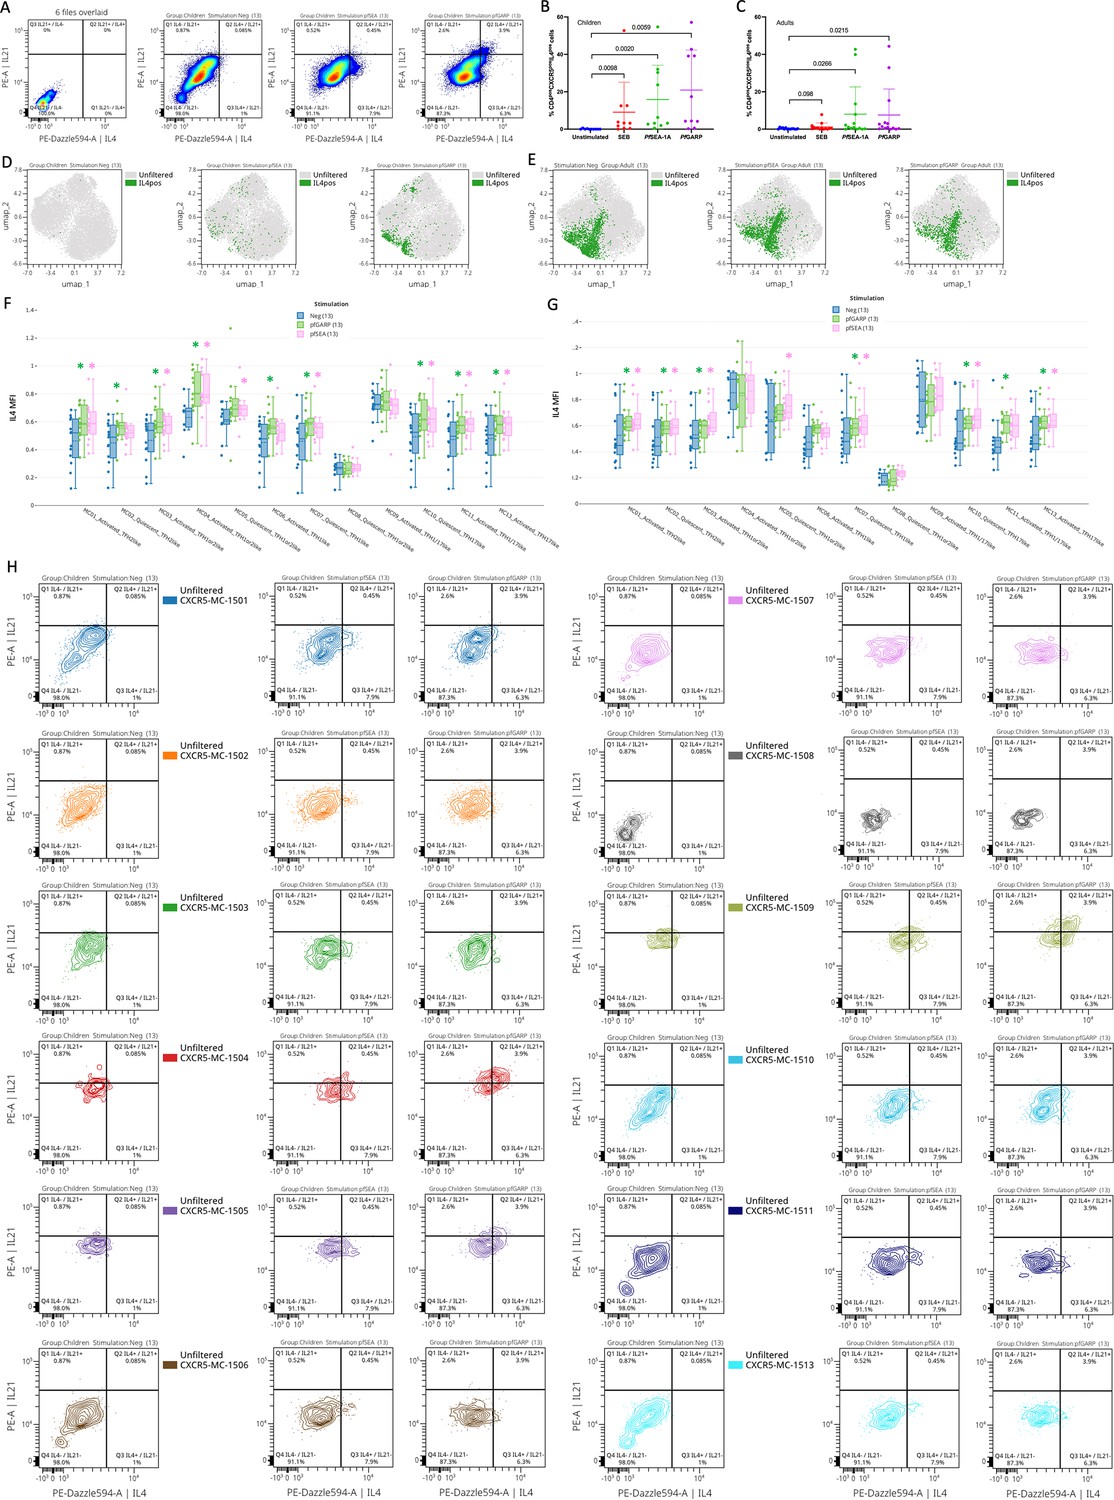
Manually gated IL4 and IL21 expression upon stimulation.
(A) Cytoplot of IL4 vs IL21 expression from six overlaid FMO and CD4posCXCR5pos T cells upon stimulation. Bar plots indicate mean with standard deviation (SD). Wilcoxon paired two-tailed t-tests were performed, and p-values are indicated. Percentage of CD4posCXCR5posIL4pos cells across stimulation in children (B) and adults (C). Manually gated positive IL4 cells overlaid on the Uniform Manifold Approximation and Projection (UMAP) of the CD4posCXCR5posCD25neg cells across stimulation in children (D) and adults (E). IL4 mean fluorescence intensity (MFI) for all meta-clusters represented in bar plots across stimulation in children (F) and adults (G), negative control in blue, PfSEA-1A in pink, and PfGARP in green. Wilcoxon paired two-tailed t-tests were performed, and significant p-values are indicated with * equal p<0.05. (H) Contour plots with outliers of L4 vs IL21 expression upon stimulation for each meta-cluster.
Figure 7 with 2 supplements
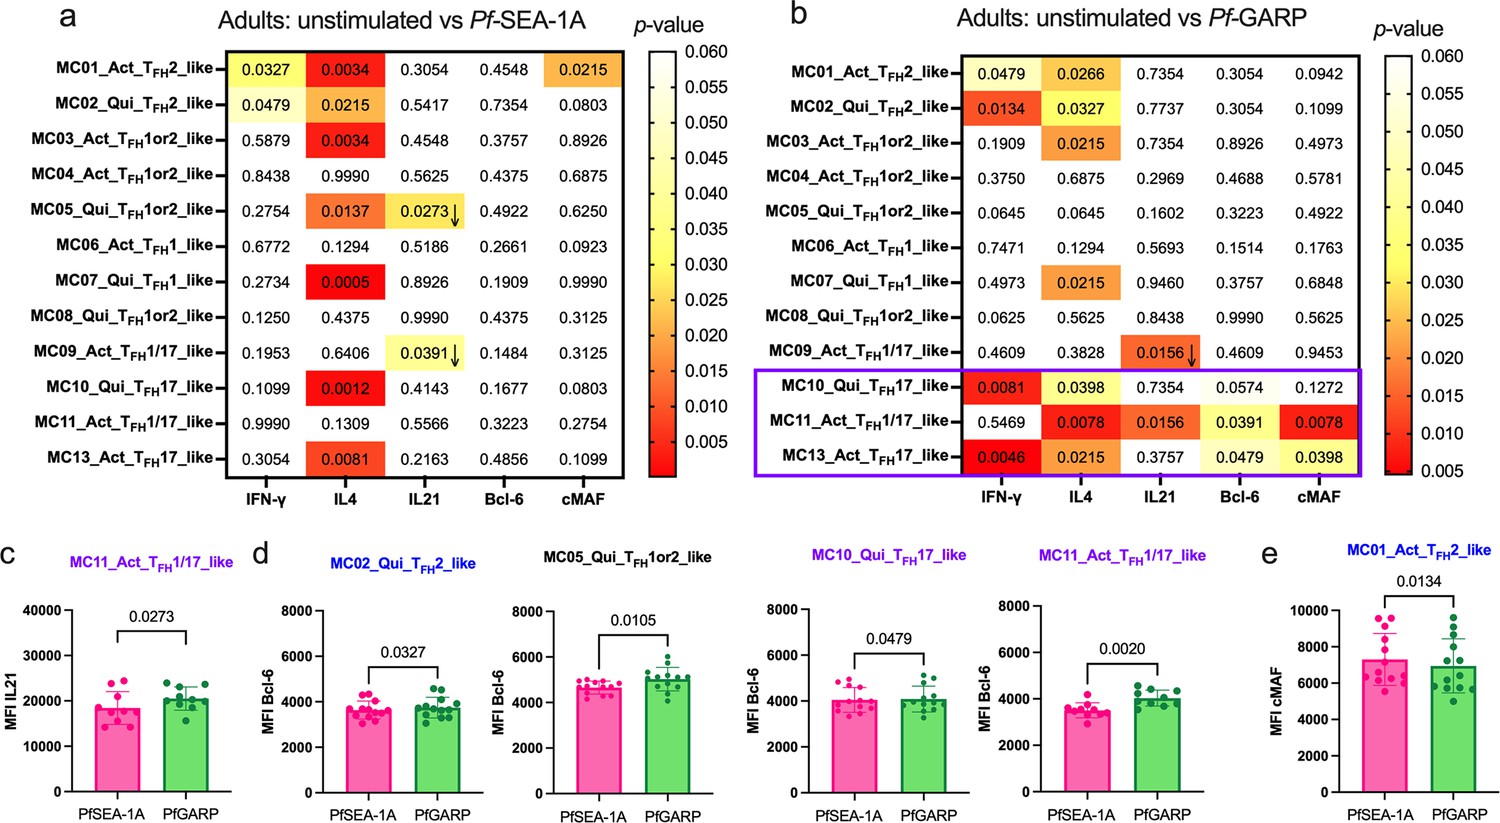
Limited Pf-malaria antigen-specific expression patterns of cTFH defining cytokines and transcription factors for adults.
Heatmaps of Wilcoxon paired two-tailed t-test p-values are shown for cTFH meta-clusters comparing (a) PfSEA-1A or (b) Pf-GARP vs unstimulated peripheral blood mononuclear cells (PBMCs) from adults (n=13) for each cytokine (IFNγ, IL-4, and IL-21) and transcription factors (Bcl6 and cMAF). The color scale indicates the significance of the p-value: white (nonsignificant, p>0.05), yellow (0.05>p>0.02), orange (0.02>p>0.005), and red (highly significant, p<0.005). The down arrow indicates a decrease of expression from unstimulated to stimulated condition, whereas no arrow indicates an increase of expression from unstimulated to stimulated condition. The only cTFH meta-clusters that expressed transcription factors were in Group 3 (purple box). Bar plots indicate the mean with standard deviation (SD) of the median fluorescence intensity (MFI) of (c) Bcl6 and (d) cMAF for the cTFH meta-clusters showing significant statistical differences between PfSEA-1A and PfGARP stimulations. The p-values from Wilcoxon paired two-tailed t-tests are indicated.
Figure 7—figure supplement 1
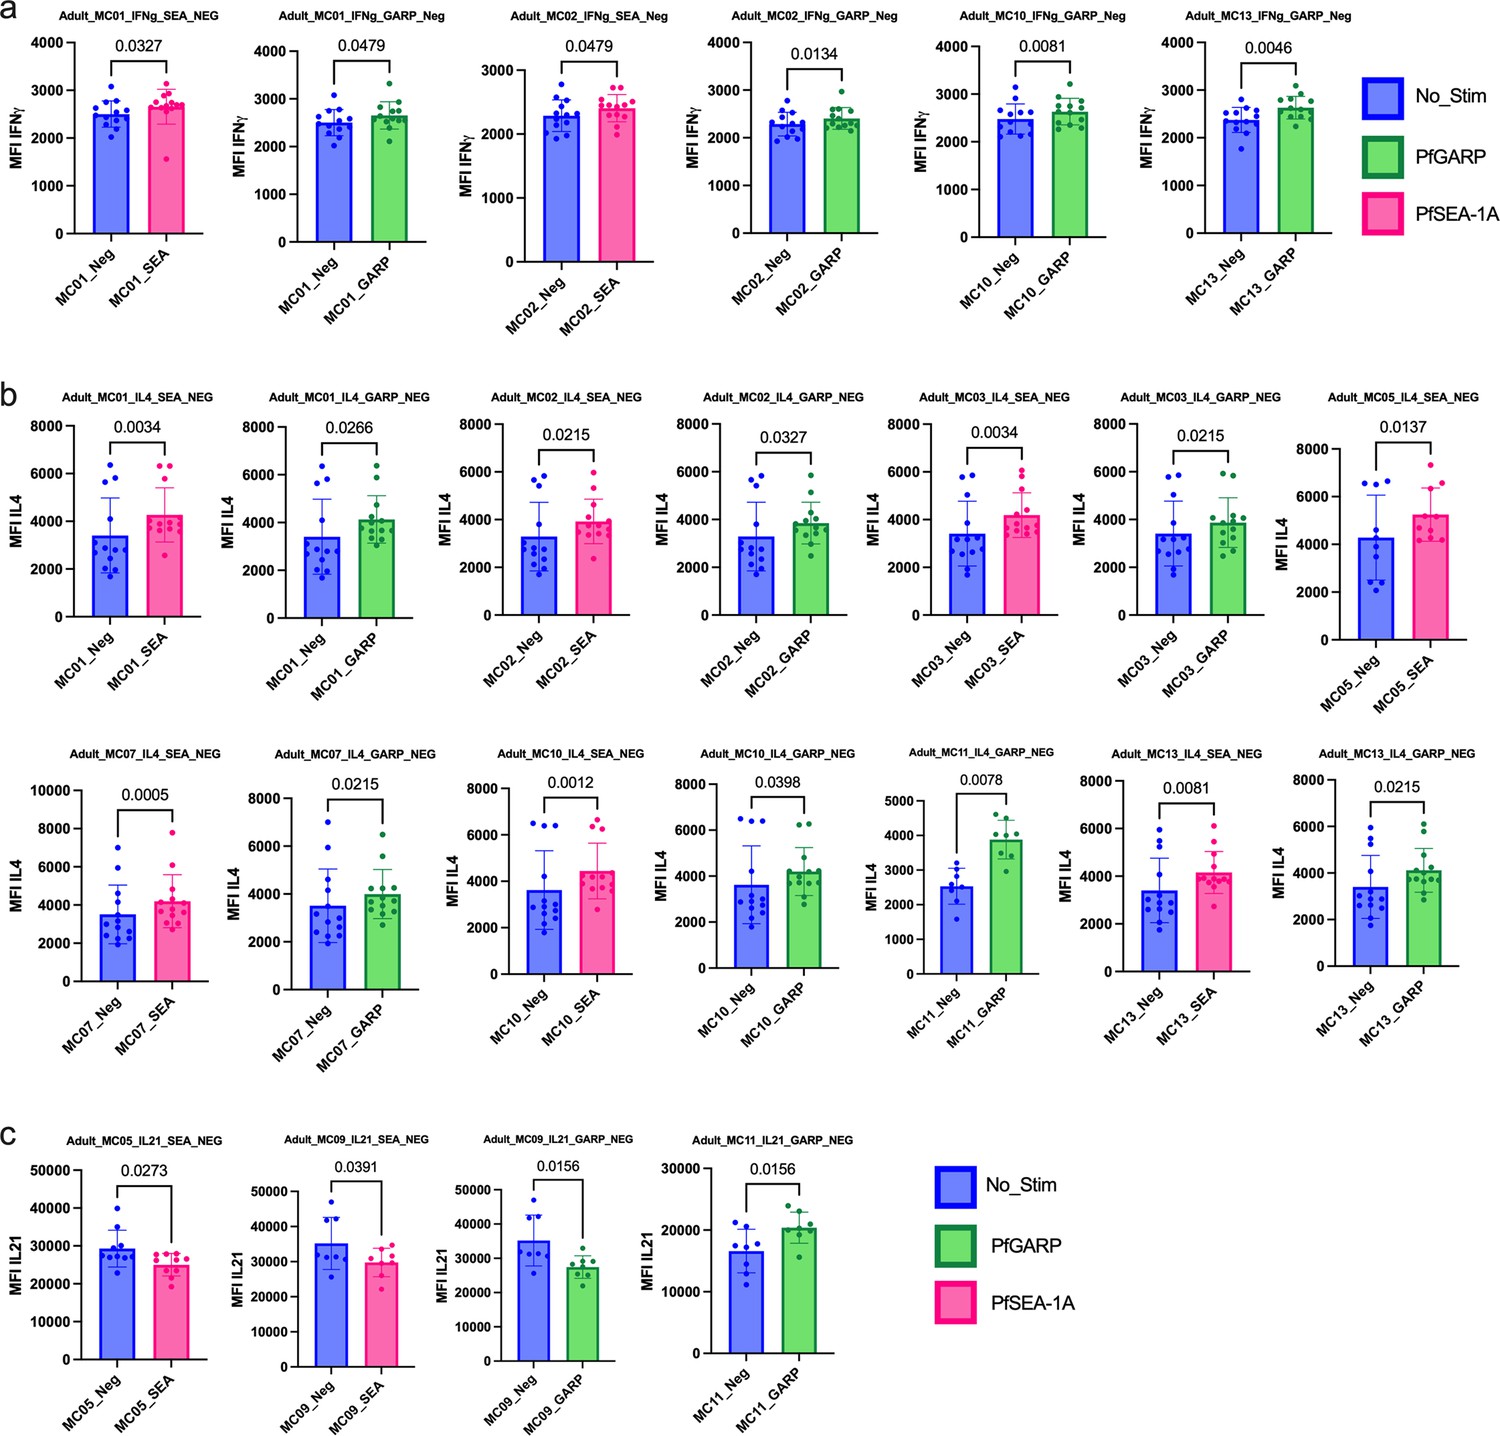
Bar plots of cytokines expressed under the different conditions of stimulation in adults (n=13).
Comparison of mean fluorescent intensity (MFI) of (a) IFNγ, (b) IL4, and (c) IL21 and cytokines expression after PfSEA-1A (pink) or PfGARP (green) stimulation or no stimulation control (blue). Bar plots indicate mean with standard deviation (SD). Wilcoxon paired two-tailed t-tests were performed, and p-values are indicated.
Figure 7—figure supplement 2
Bar plots of transcription factors expressed under the different conditions of stimulation in adults (n=13).
Comparison of mean fluorescent intensity (MFI) of (a) Bcl6 and (b) cMAF expression after PfSEA-1A (pink) or PfGARP (green) stimulation or no stimulation control (blue). Bar plots indicate mean with standard deviation (SD). Wilcoxon paired two-tailed t-tests were performed, and p-values are indicated.
Figure 8
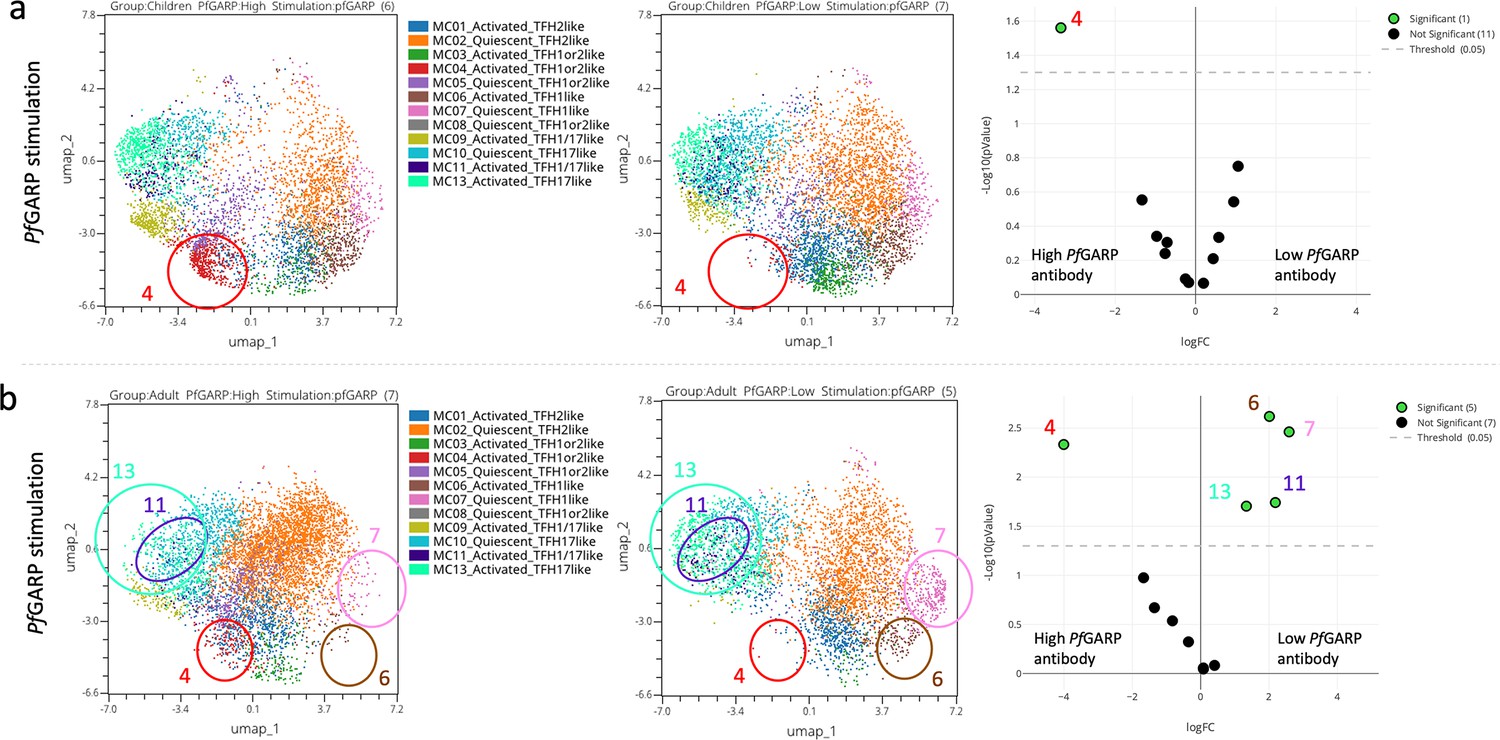
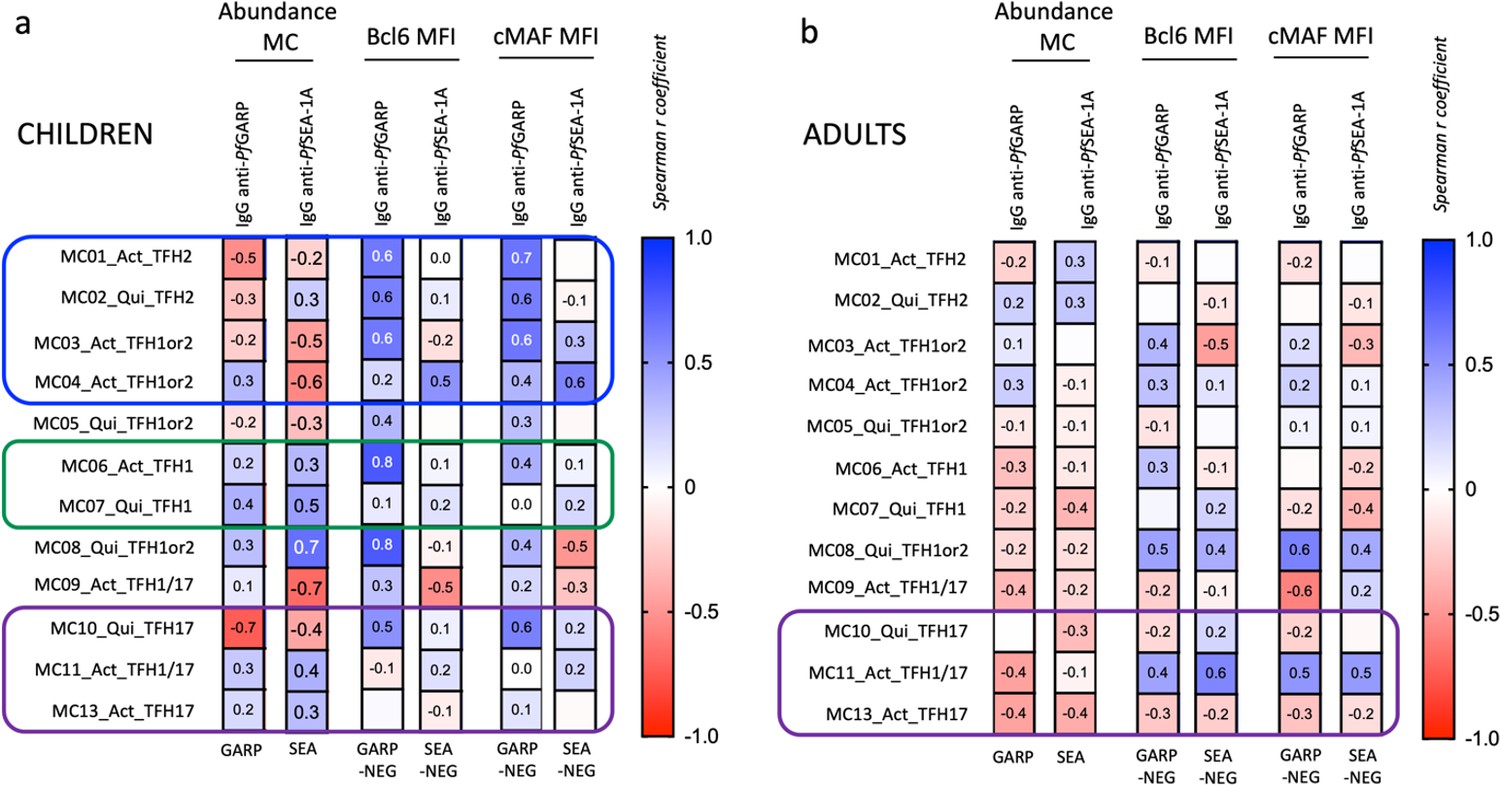
Abundance of cTFH meta-clusters stratified by anti-PfGARP IgG antibody levels.
Uniform Manifold Approximation and Projection (UMAP) and EdgeR analyses of (a) children (n=13) and (b) adults (n=13), where significant differences (p<0.05) in the abundance of the cTFH meta-clusters are circled on high vs low PfGARP antibody level (left to right) in the UMAP plot and green dots on the volcano plot (far right).
Figure 9
Summary.
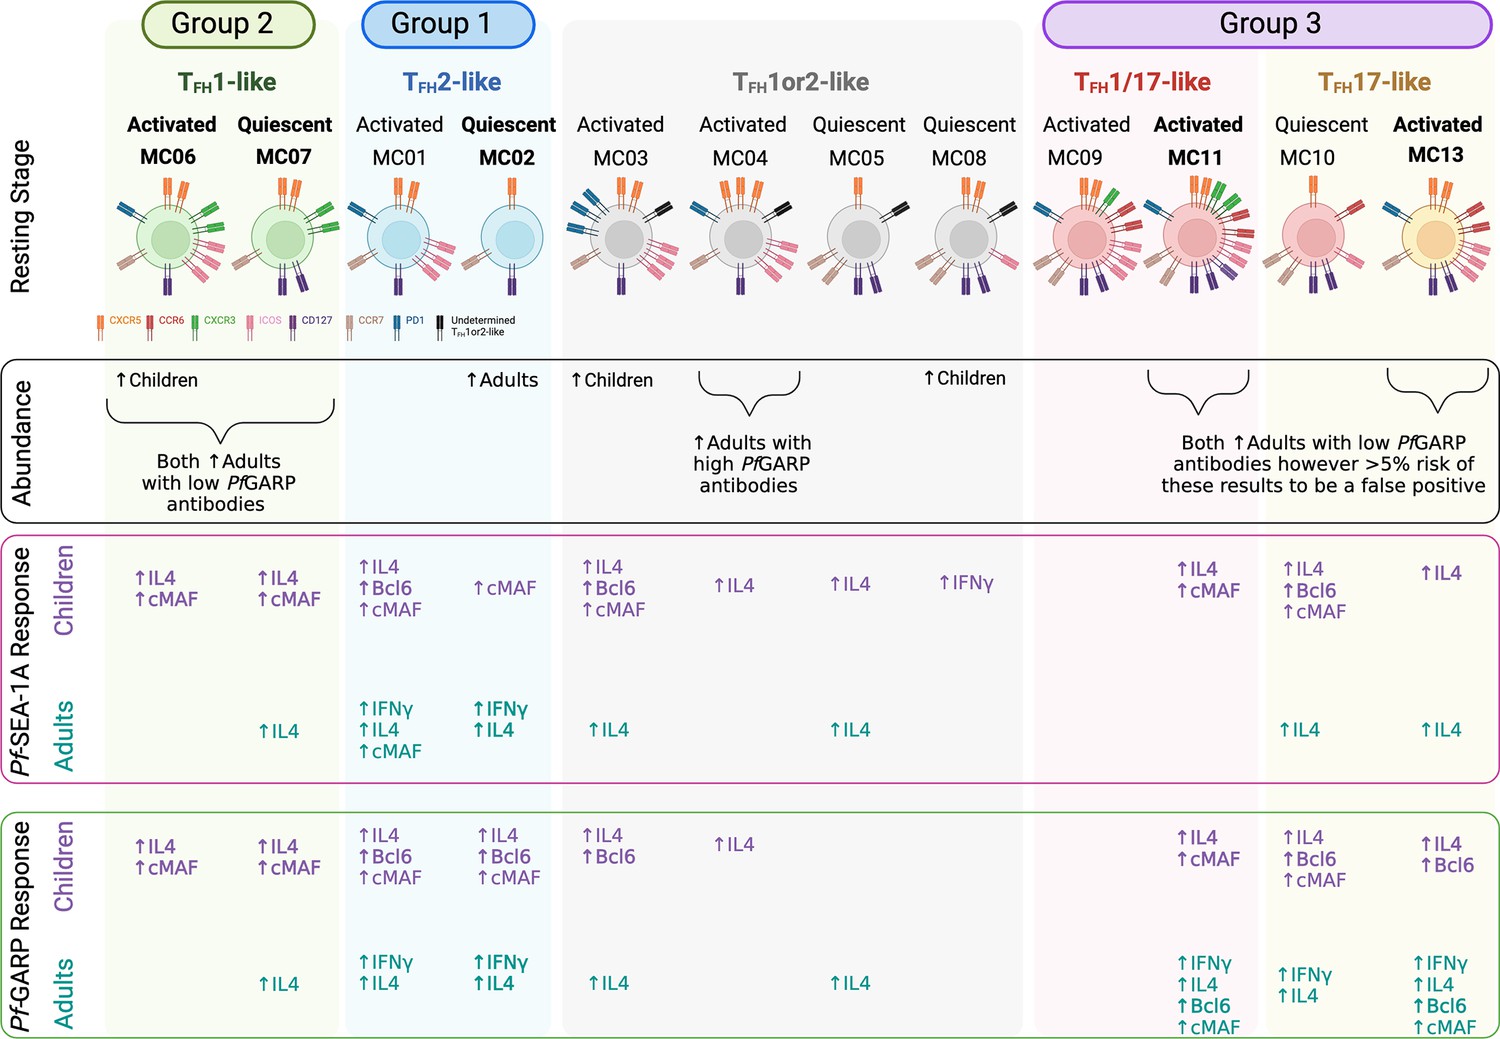
Illustration of combined findings showing remarkable differences in cTFH subset abundance and Pf-malaria antigen-specific cytokine and transcription factor responses between children and adults residing in a malaria-holoendemic region of Kenya. Figure created with BioRender.
Author response image 1

Author response image 2

Author response image 3
Author response image 4
Tables
Key resources table
| Reagent type (species) or resource | Designation | Source or reference | Identifiers | Additional information |
|---|---|---|---|---|
| Biological sample Homo sapiens | PBMCs, Plasma, cell pellet | From our studied cohort | N/A | Used 1 million PBMCs per condition |
| Antibody | Co-stimulatory antibodies CD28/CD49d | BD | Cat# 347690 | Fast Immune 5 µl per test |
| Antibody | CCR6BV421, Mouse, clone 561 | BioLegend | Cat#343610, RRID:AB_2561356 | 1 µl per million PBMCs |
| Antibody | CD14-Pacific Blue, Mouse, clone HCD14 | BioLegend | Cat#325616, RRID:AB_830689 | 1 µl per million PBMCs |
| Antibody | CD19-Pacific Blue, Mouse, clone HIB19 | BioLegend | Cat#302232, RRID:AB_2073118 | 1 µl per million PBMCs |
| Antibody | CCR7-BV480, Rat, Clone 3D12 | BD | Cat#566099, RRID:AB_2739502 | 4 µl per million PBMCs |
| Antibody | IFNγ-BV510, Mouse, Clone 4SB3 | BioLegend | Cat#502544, RRID:AB_2563883 | 1 µl per million PBMCs |
| Antibody | CD127-BV570, Mouse, Clone A019D5 | BioLegend | Cat#351307, RRID:AB_10900064 | 1 µl per million PBMCs |
| Antibody | CD45RABV605, Mouse, Clone HI100 | BioLegend | Cat#304134, RRID:AB_2563814 | 0.2 µl per million PBMCs |
| Antibody | PD1-BV650, Mouse, Clone MIH4 | BD | Cat#564324, RRID:AB_2738746 | 4 µl per million PBMCs |
| Antibody | CXCR3-BV711, Mouse, Clone G025H7 | BioLegend | Cat#353732, RRID:AB_2563533 | 4 µl per million PBMCs |
| Antibody | CD25-BV750, Mouse, Clone M-A251 | BD | Cat#747158, RRID:AB_2871896 | 2 µl per million PBMCs |
| Antibody | CXCR5-BV785, Mouse, Clone J252D4 | BioLegend | Cat#356936, RRID:AB_2629528 | 2 µl per million PBMCs |
| Antibody | Bcl6-AF488, Mouse | BD | Cat#561524, RRID:AB_10716202 | 5 µl per million PBMCs |
| Antibody | CD3-Spark Blue 550, Mouse, clone SK7 | BioLegend | Cat#344852, RRID:AB_2819985 | 0.2 µl per million PBMCs |
| Antibody | CD8-PerCP-Cy5.5, Mouse, clone SK1 | BioLegend | Cat#344710, RRID:AB_2044010 | 0.02 µl per million PBMCs |
| Antibody | IL-21-PE, Mouse, clone 3A3-N2 | BioLegend | Cat#513004, RRID:AB_2249025 | 10 µl per million PBMCs |
| Antibody | IL-4-PE-Dazzle, Rat, clone MP4-25D2 | BioLegend | Cat#500832, RRID:AB_2564036 | 4 µl per million PBMCs |
| Antibody | CD4-PE-Cy5, Mouse, clone RPA-T4 | BioLegend | Cat#300510, RRID:AB_314078 | 0.04 µl per million PBMCs |
| Antibody | ICOS-PE-Cy7, Armenian Hamster, clone C398.4A | BioLegend | Cat#313520, RRID:AB_10643411 | 1 µl per million PBMCs |
| Antibody | cMAF-eFluor 660, Mouse, clone sym0F1 | Thermo Fisher | Cat#50985582, RRID:AB_2574388 | 2 µl per million PBMCs |
| Antibody | CD40L-AF700, Mouse, clone 24–31 | BioLegend | Cat#310846, RRID:AB_2750053 | 2 µl per million PBMCs |
| Antibody | Biotinylated anti-human IgG | BD | Cat#555785 | Diluted 1:1000 |
| Peptide, recombinant protein | Plasmodium falciparum malaria antigens | Kurtis’ lab Brown University | Pf-GARP and Pf-SEA-1A | 5 µg/ml (PfSEA-1A) 10 µg/ml (PfGARP) |
| Peptide, recombinant protein | Plasmodium falciparum malaria antigens | Walter Reed Army Institute of Research | AMA1, MSP1, CelTos, HRPII | 100 µg of each |
| Commercial assay or kit | Transcription factor buffer set Fix/Perm | BD | Cat#562574 | Followed manufacturer’s instructions |
| Chemical compound, drug | Bovine Serum Albumin | Sigma | Cat#A3294 | Solution of 1 mg/ml |
| Chemical compound, drug | Staphylococcal enterotoxin B | EMD Millipore | Cat# 324798 | Used at 1 µg/ml final |
| Chemical compound, drug | GolgiPLUG Brefaldin A | BD | Cat# 555029 | Used at 0.1 µg/ml |
| Chemical compound, drug | GolgiSTOP Monensin | BD | Cat# 554724 | Used at 0.7 µg/ml |
| Chemical compound, drug | Streptavidin-PE Detection | BD | Cat#554061 | Diluted 1:1000 |
| Software, algorithm | SpectroFlow | Cytek | N/A | |
| Software, algorithm | OMIQ platform | OMIQ | N/A | |
| Software, algorithm | GraphPad Prism | GraphPad | N/A | version 7.0 |
| Other | Zombie NIR | BioLegend | Cat# 423106 | Live/Dead staining 1:1000 |
| Other | Ultra-Compensation beads Plus | Thermo Fisher eBiosciences | Cat#01333342 | 1 drop per compensation control |
Additional files
Download links
A two-part list of links to download the article, or parts of the article, in various formats.
Downloads (link to download the article as PDF)
Open citations (links to open the citations from this article in various online reference manager services)
Cite this article (links to download the citations from this article in formats compatible with various reference manager tools)
T-follicular helper cell profiles differ by malaria antigen and for children compared to adults
eLife 13:RP98462.
https://doi.org/10.7554/eLife.98462.3


