Ezrin defines TSC complex activation at endosomal compartments through EGFR–AKT signaling
- Department of Biology, University of Naples Federico II, Italy
- Telethon Institute of Genetics and Medicine, Italy
- U.O.C. Genetica Medica, IRCCS Istituto Giannina Gaslini, Italy
- Clinical Medicine and Surgery, University of Naples Federico II, Italy
- Laboratory of Molecular Biology, IRCCS Istituto Giannina Gaslini, Italy
Figures
Figure 1 with 1 supplement
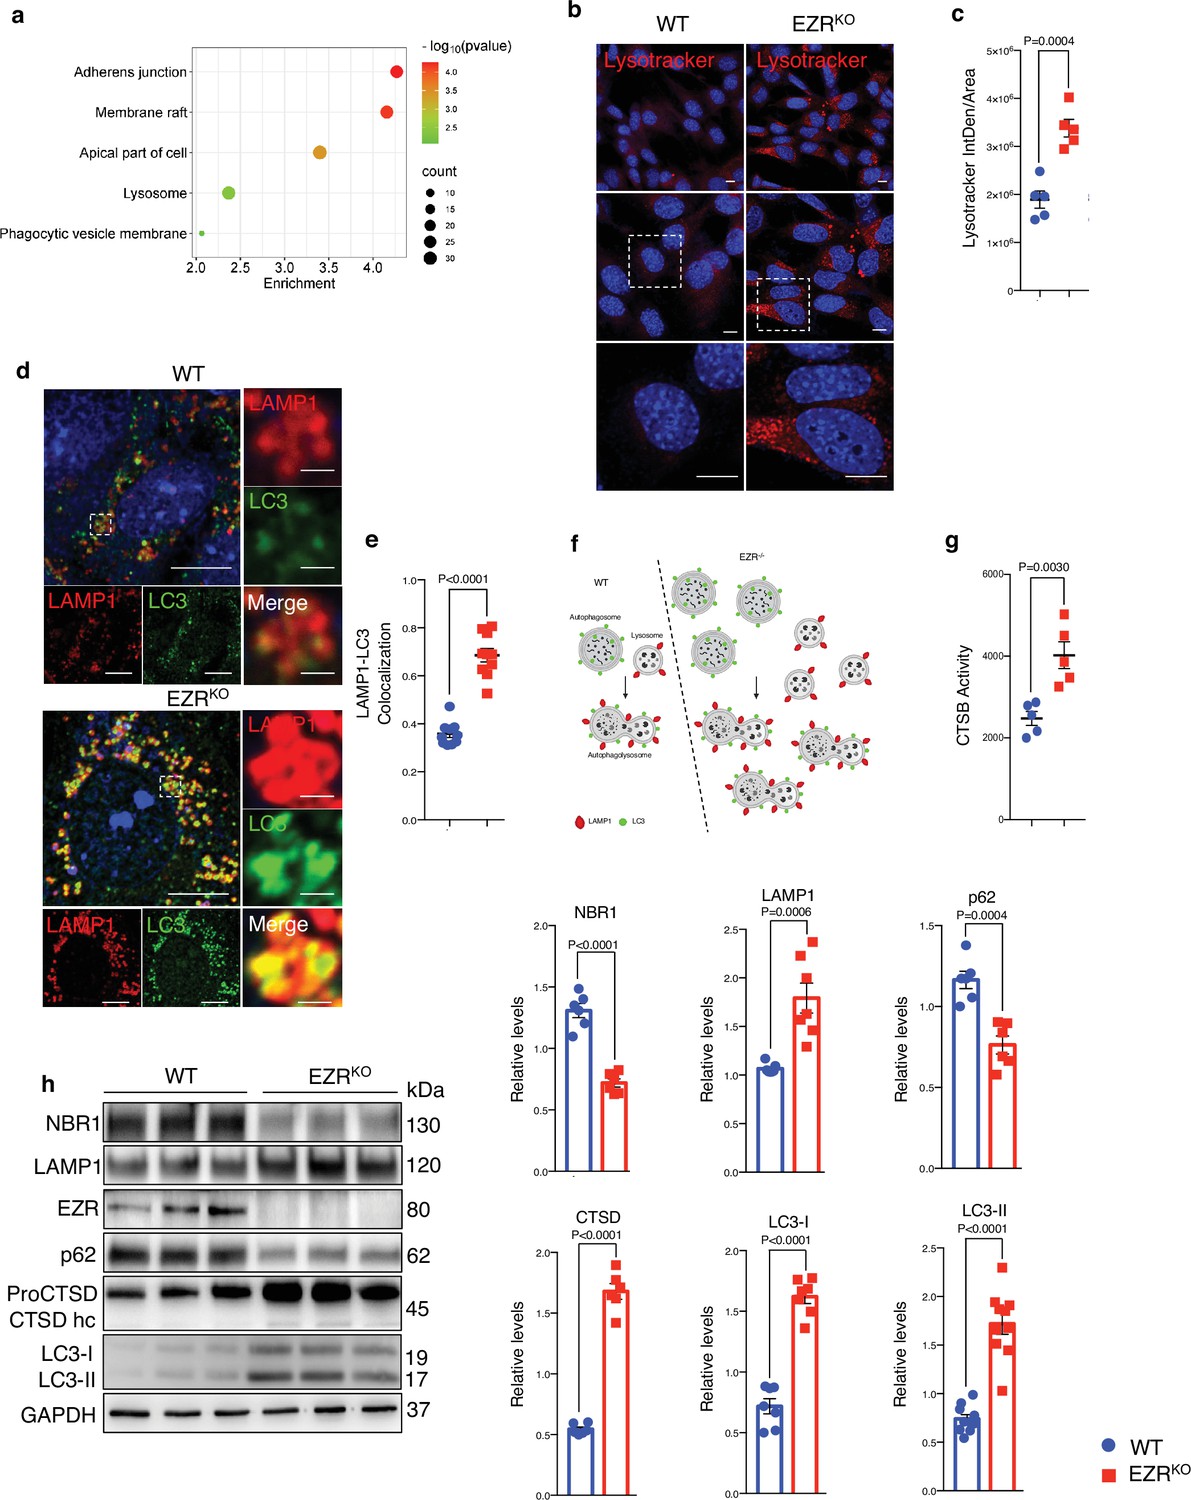
Deletion of Ezrin increases the lysosomal pathway.
(a) Gene Ontology (GO) of 530 genes differentially expressed at mRNA and protein levels (EZRKO versus WT). Bubble plot representing some of the most enriched GO terms regarding cellular components. Color and x axis represent minus logarithms of p-value. The size represents the numbers of genes enriched in a GO term. (b) WT and EZRKO mouse embryonic fibroblast (MEF) cells were cultured in 6-cm cell plates for 24 hr, then fixed and immunostained with lysotracker and DAPI. Scale bar: 10 µm. (c) Data represent mean of lysotracker-positive cells ± SEM (n = 3 experiments at least). Statistical test: unpaired t-test. (d) MEF cells WT and EzrKO were cultured in 6-well plates for 24 hr, then fixed and immunostained with LAMP1 and LC3 antibodies and DAPI. Scale bar: 10 µm (magnification 1 µm). (e) Data represent mean of LAMP1–LC3 co-localization spots ± SEM (n = 3 experiments at least). Statistical test: unpaired t-test. (f) Model showing autophagic flux induction in EZR−/− cells. This panel was created using BioRender.com. (g) MEF EzrKO showed CTSB enzymatic activity increase compared to control cells. (h) MEF cells WT and EzrKO were lysed and immunoblotted with NBR1, LAMP1, EZR, P62, and LC3 antibodies or GAPDH antibodies as a loading control. The graphs show the mean NBR1, LAMP1, EZR, P62, and LC3 levels relative to GAPDH ± SEM (n = 3 experiments at least). Statistical test: unpaired t-test for NBR1, P62, and LC3-I; Welch’s t-test for CTSD and LC3-II; Mann–Whitney test for LAMP1.
-
Figure 1—source data 1
Raw uncropped and unedited blots relating to Figure 1.
- https://cdn.elifesciences.org/articles/98523/elife-98523-fig1-data1-v1.zip
-
Figure 1—source data 2
Uncropped blots with the relevant bands labeled relating to Figure 1.
- https://cdn.elifesciences.org/articles/98523/elife-98523-fig1-data2-v1.pdf
Figure 1—figure supplement 1

Ezrin knockout cells show lysosomal enhancement.
(a) VENN diagram showing the comparison of transcriptomics (GSE195983) and proteomics (PRIDE ID: PXD045157) performed in EZRKO mouse embryonic fibroblast (MEF) cells. 572 genes are commonly regulated: 317 and 213 genes are induced and inhibited in both datasets, respectively; the remaining 42 are regulated in opposite manner. Heatmap on 22 lysosomal genes (out of 317) induced in the transcriptome (b) and in the proteome (c, d). Schematic representation of Ezrin gene and the corresponding protein. The position of the mutation in exon 2 and the relative changes in the coding sequence is highlighted. (e) WT and EZR−/− HeLa cells were cultured in 6-cm cell plates for 24 hr, then fixed and immunostained with lysotracker and DAPI. Scale bar: 10 µm. (f) Data represent mean of lysotracker-positive cells ± SEM (n = 3 experiments at least). Statistical test: unpaired t-test. (g) HeLa WT and EZR−/− cells were lysed and immunoblotted with NBR1, LAMP1, EZR, p62, and LC3 antibodies or GAPDH antibody as a loading control. Data represent the mean relative NBR1, LAMP1, p62, and LC3 levels relative to GAPDH ± SEM (n = 3 experiments at least). Statistical test: unpaired t-test for NBR1, p62, LC3-I, and LC3-II; Mann–Whitney test for LAMP1. (h) HeLa EZR−/− showed CTSB enzymatic activity increase compared to control cells. Statistical test: unpaired t-test. (i) HeLa WT and EZR−/− cells were cultured in normal medium (stv−, baf−). Starved HBSS medium (stv+), or starved medium supplemented with bafilomycin (baf+) or without bafilomycin (baf−), were lysed and immunoblotted with LC3 antibodies or GAPDH antibody as a loading control. Data represent the mean relative LC3 levels relative to GAPDH ± SEM (n = 3 experiments at least). Statistical test: unpaired t-test for all the comparisons against WT; Mann–Whitney test for all the comparisons against EZR−/−. (j) Immunofluorescence labeling images of TFEB-GFP (green) in WT and EZR−/− HeLa cells. Scale bar: 50 µm.
-
Figure 1—figure supplement 1—source data 1
Raw uncropped and unedited blots relating to Figure 1—figure supplement 1.
- https://cdn.elifesciences.org/articles/98523/elife-98523-fig1-figsupp1-data1-v1.zip
-
Figure 1—figure supplement 1—source data 2
Uncropped blots with the relevant bands labeled relating to Figure 1—figure supplement 1.
- https://cdn.elifesciences.org/articles/98523/elife-98523-fig1-figsupp1-data2-v1.pdf
Figure 2 with 1 supplement
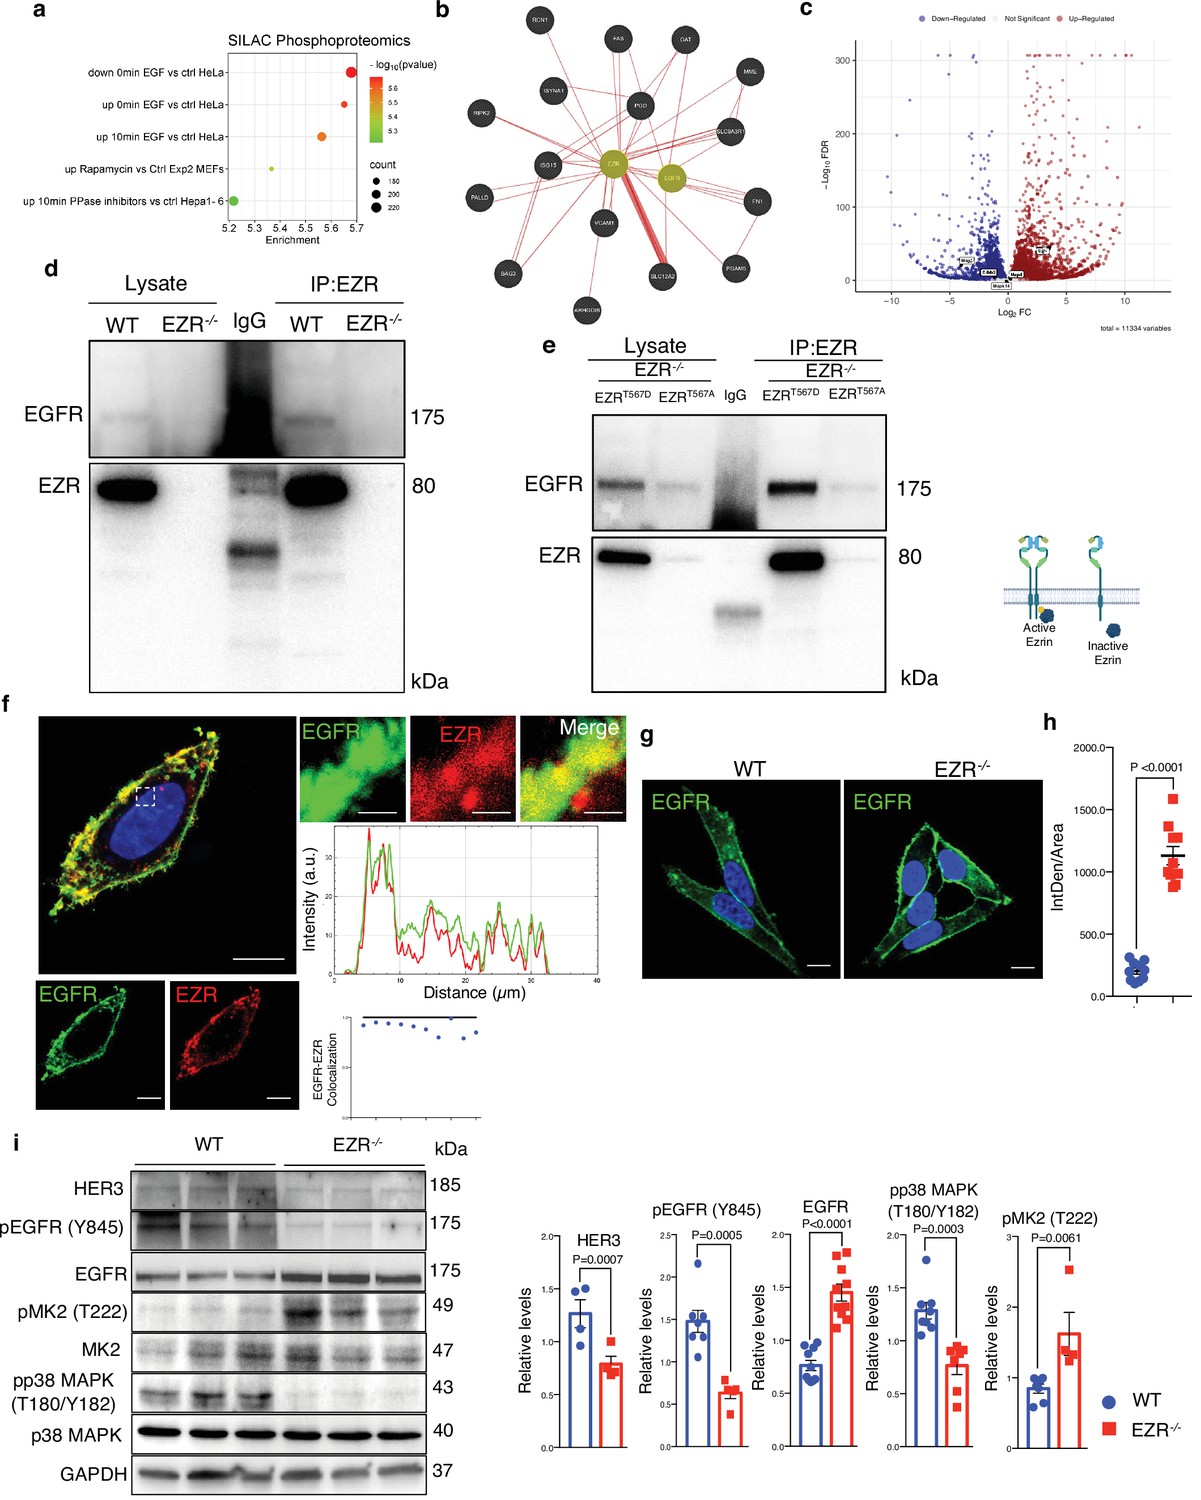
Ezrin binds EGFR and regulates its activation.
(a) Bubble plot representing the enrichment analysis of 530 differentially expressed genes (DEGs) performed in SILAC Phosphoproteomics data. Color and x axis represent minus logarithms of p-value. The size represents numbers of genes enriched in the indicated data. (b) Physical interactions, obtained by GeneMANIA, highlight Ezrin and EGFR binding. (c) Volcano plot of DEGs, with upregulated EGFR and downregulated MAP2 and ERBB2 (no threshold on Log2FC and 0.05 threshold on −Log10FDR). Legend: red dot, upregulated gene; blue dot, downregulated gene; gray dot, not significant gene. (d, e) Co-IP data for Ezrin–EGFR interaction. For the co-IP analyses, was used Ezrin antibody, conjugated with beads, and immunoblotted with EGFR antibody for WT and EZR−/− (d) and HeLa EZRT567D and EZRT567A (e) HeLa cells, respectively. Schematic representation of HeLa EZRT567D and EZRT567A co-IP (bottom). This shematic was created using BioRender.com. (f) Confocal microscopy images showing EGFR (green) and EZR (red) co-localization on the membrane in HeLa WT cells (left) and magnified views of the regions are provided (right). Scale bar: 10 µm (magnification 1 µm). Representative plots of co-localization profiles on the membrane between EGFR (green) and EZR (red). Data represent mean of EGFR–EZR co-localization spots ± SEM (n = 3 experiments at least); (g) immunofluorescent labeling images of EGFR in HeLa WT and EZR−/− cells, observed by confocal microscopy. Scale bar: 10 µm. (h) Data represent fluorescence intensity ± SEM (n = 3 experiments at least). Statistical test: unpaired t-test; (i) immunoblots and calculated levels (bottom) of HER3, pY845 EGFR, EGFR, pT222 MK2, MK2, pT180/pY182 p38 MAPK, and P38 MAPK in HeLa WT and EZR−/− cells. Data are expressed as mean of pY845EGFR/EGFR, pT222 MK2/MK2, and pT180/pY182 p38 MAPK/P38 MAPK ratio ± SEM (n = 3 experiments at least). GAPDH was used as loading control. Statistical test: unpaired t-test for pY845 EGFR; Mann–Whitney test for HER3, EGFR, pT222 MK2, and pT180/pY182 p38 MAPK.
-
Figure 2—source data 1
Raw uncropped and unedited blots relating to Figure 2.
- https://cdn.elifesciences.org/articles/98523/elife-98523-fig2-data1-v1.zip
-
Figure 2—source data 2
Uncropped blots with the relevant bands labeled relating to Figure 2.
- https://cdn.elifesciences.org/articles/98523/elife-98523-fig2-data2-v1.pdf
Figure 2—figure supplement 1
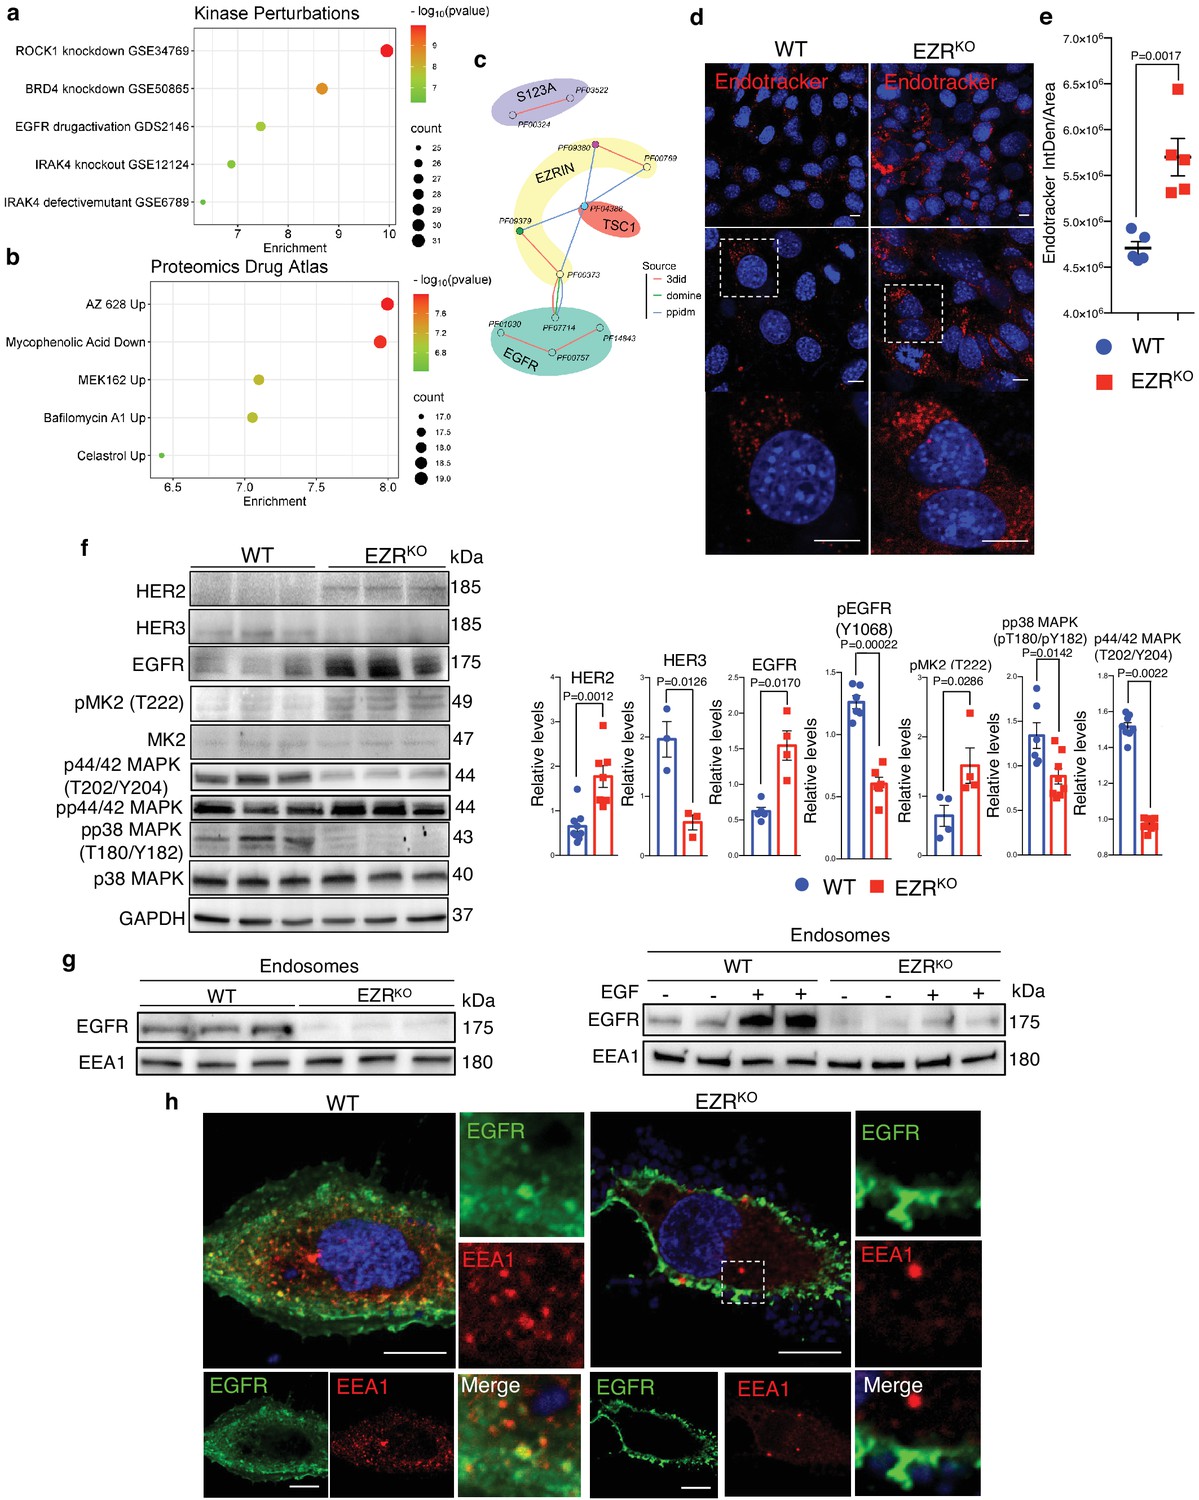
Ezrin genetic and pharmacological depletion causes EGFR signaling alteration.
(a, b) Bubble plots representing the enrichment analysis of 530 differentially expressed genes (DEGs) performed in kinase perturbation from GEO database and from the Proteomics Drug Atlas. Color and x axis represent minus logarithms of p-value. The size represents numbers of genes enriched in the indicated data. (c) Domain interaction network based on multiple resources. Proteins are colored shapes; domains are dots. Domains are connected if they are found in a reliable association within a database/resource, with color coding the database/resource. (d) Mouse embryonic fibroblast (MEF) cells were fixed and immunostained with endotracker (red) and DAPI (blue). Scale bar: 10 µm. (e) Graph shows mean of endotracker-positive cells ± SEM (n = 3 experiments at least). Statistical test: unpaired t-test. (f) Immunoblots and calculated levels (bottom) of HER2, HER3, EGFR, pT222 MK2, MK2, pT202/Y204 P44/42 MAPK, P44/42 MAPK, pT180/pY182 p38 MAPK, and P38 MAPK in MEF WT and EZRKO cells. Data are expressed as mean of HER2, HER3, EGFR, pT222 MK2/MK2, pT202/Y204 P44/42 MAPK/P44/42 MAPK, and pT180/pY182 p38 MAPK/ p38 MAPK ratio ± SEM (n = 3 experiments at least). GAPDH was used as loading control. Statistical test: unpaired t-test for HER3 and pT180/pY182 p38 MAPK; unpaired t-test with Welch’s correction for EGFR; Mann–Whitney test for HER2 and pT222 MK2. (g) Representative immunoblots of EGFR in endosomes proteins in MEF WT and EZRKO. EEA1 are used as endosomes extraction control. (h) Immunofluorescence images of EGFR (green) and EEA1 (red) in MEF WT and EZRKO observed by confocal microscopy. Scale bar: 10 µm (magnification 1 µm).
-
Figure 2—figure supplement 1—source data 1
Raw uncropped and unedited blots relating to Figure 2—figure supplement 1.
- https://cdn.elifesciences.org/articles/98523/elife-98523-fig2-figsupp1-data1-v1.zip
-
Figure 2—figure supplement 1—source data 2
Uncropped blots with the relevant bands labeled relating to Figure 2—figure supplement 1.
- https://cdn.elifesciences.org/articles/98523/elife-98523-fig2-figsupp1-data2-v1.pdf
Figure 3
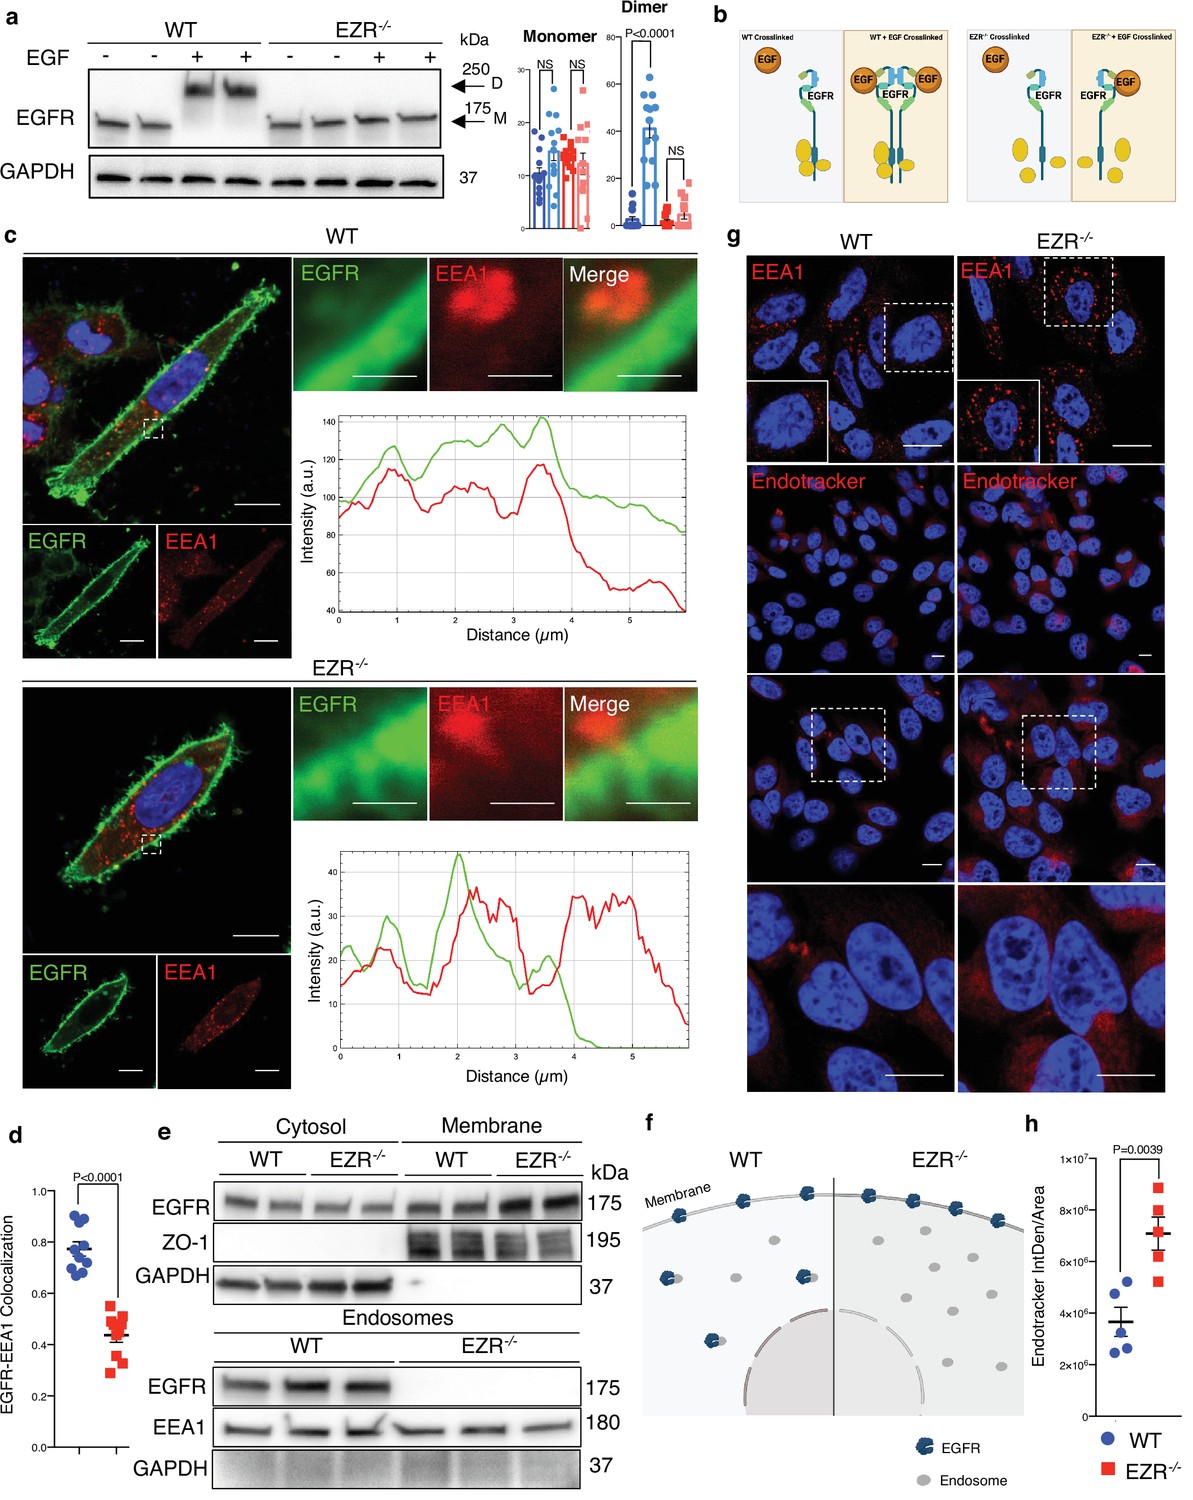
Ezrin controls EGFR localization.
(a) Western blot analysis of chemical crosslinked EGFR in HeLa WT and EZR−/− with (+) and without (−) EGF stimulation. Arrowheads indicate detected signals of dimeric and monomeric form of EGFR. (b) Model showing the crosslinking effect of EGFR dimer formation in HeLa WT and EZR−/−. This panel was created using BioRender.com. (c) Immunofluorescence images of EGFR (green) and EEA1 (red) in HeLa WT (top) and EZR−/− (bottom) observed by confocal microscopy. Scale bar: 10 µm (magnification 1 µm). Representative plots of co-localization profiles of EGFR in early endosome. HeLa EZR−/− cells do not show EGFR and EEA1 co-localization compared to control cells. (d) Data represent mean of EGFR–EEA1 co-localization spots ± SEM (n = 3 experiments at least). Statistical test: unpaired t-test. (e) Representative immunoblots of EGFR in membrane (top) and endosomes (bottom) proteins in HeLa WT and EZR−/−. ZO-1 and EEA1 are used as membrane and endosomes extraction control, respectively. GAPDH is used as loading control. (f) Schematic translocation of EGFR in the endosomes in HeLa WT compared to HeLa EZR−/−. This panel was created using BioRender.com. (g) HeLa cells were fixed and immunostained with endotracker and EEA1 (red) and DAPI (blue). Scale bar: 10 µm (magnification 1 µm). (h) Graph shows mean of endotracker-positive cells ± SEM (n = 3 experiments at least). Statistical test: unpaired t-test.
-
Figure 3—source data 1
Raw uncropped and unedited blots relating to Figure 3.
- https://cdn.elifesciences.org/articles/98523/elife-98523-fig3-data1-v1.zip
-
Figure 3—source data 2
Uncropped blots with the relevant bands labeled relating to Figure 3.
- https://cdn.elifesciences.org/articles/98523/elife-98523-fig3-data2-v1.pdf
Figure 4
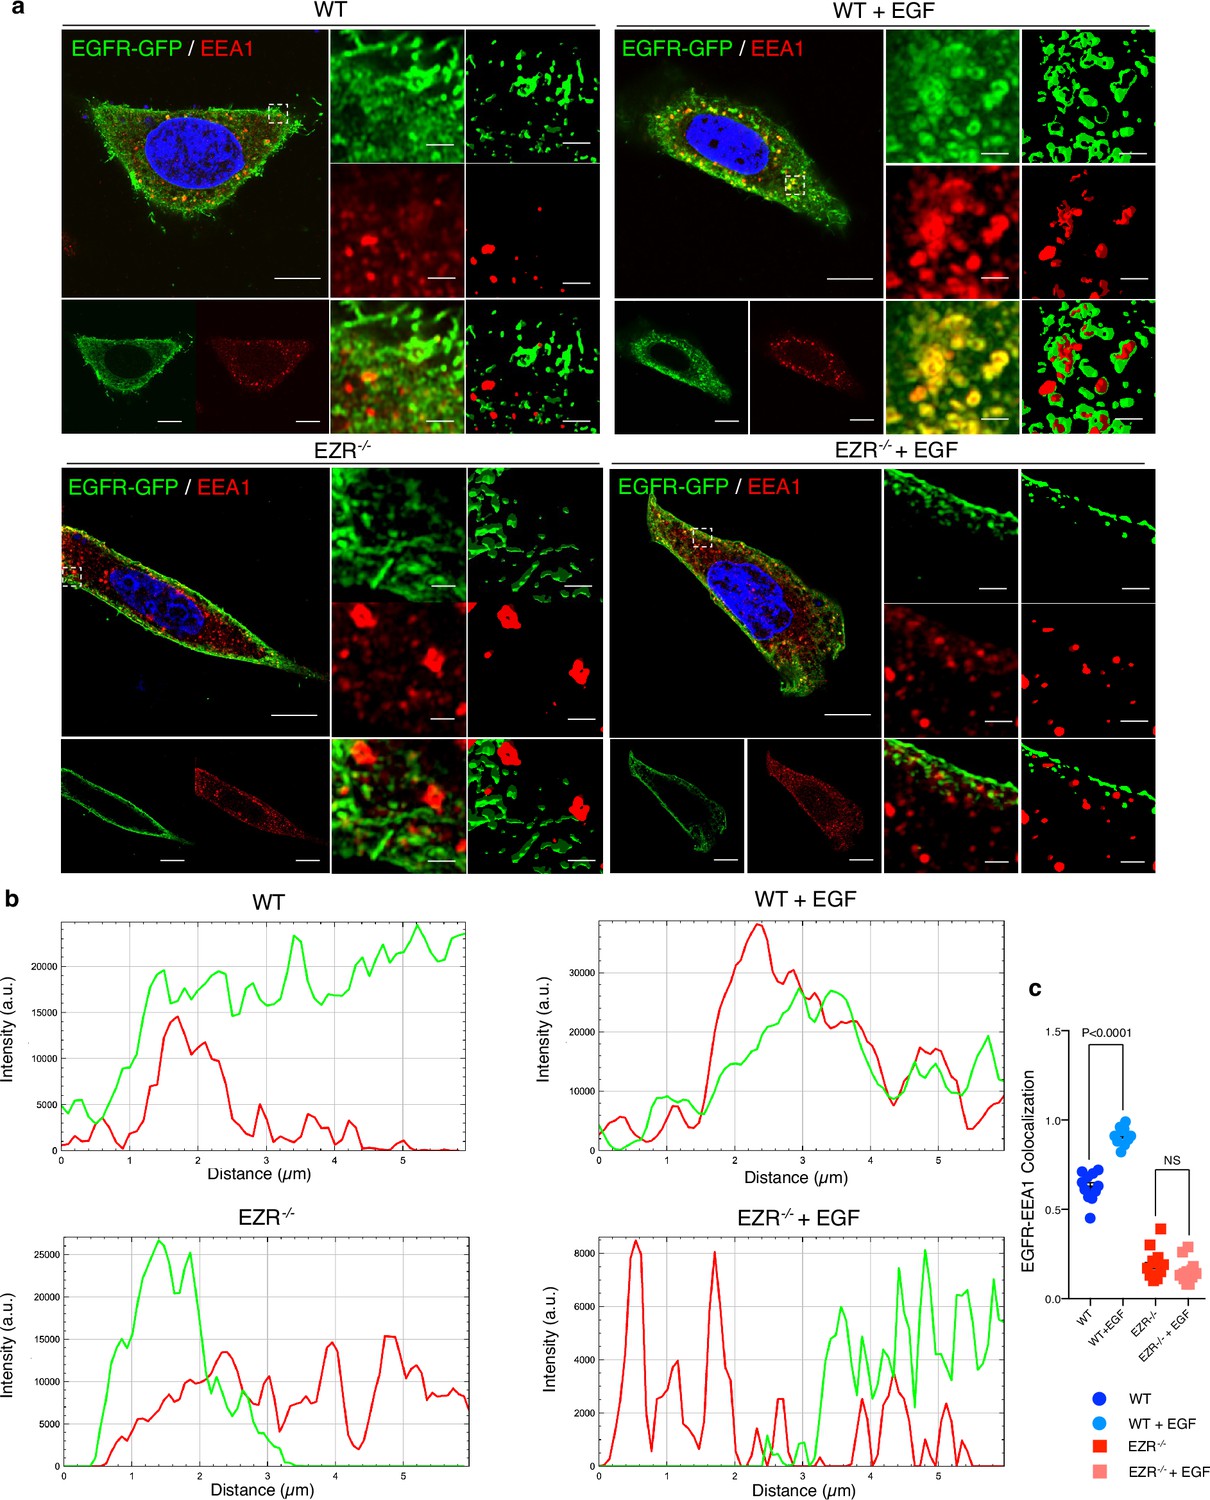
EGFR migrates on the endosomes depending on Ezrin.
(a) Immunofluorescence labeling images of EGFR-GFP (green), EEA1 (red), and DAPI (blue) after 3 hr of EGF stimulation (right) in HeLa WT (top) and EZR−/− (bottom). Magnified views of the regions in the boxes are provided in both Airyscan high-resolution microscopy and 3D-confocal microscopy. (b) EGFR and EEA1 co-localization is expressed as a representative plot in HeLa WT (top) and EZR−/− (bottom). Scale bar: 10 µm (magnification 1 µm). (c) Data represent mean of EGFR–EEA1 co-localization spots ± SEM (n = 3 experiments at least). Statistical test: one-way ANOVA.
Figure 5 with 5 supplements
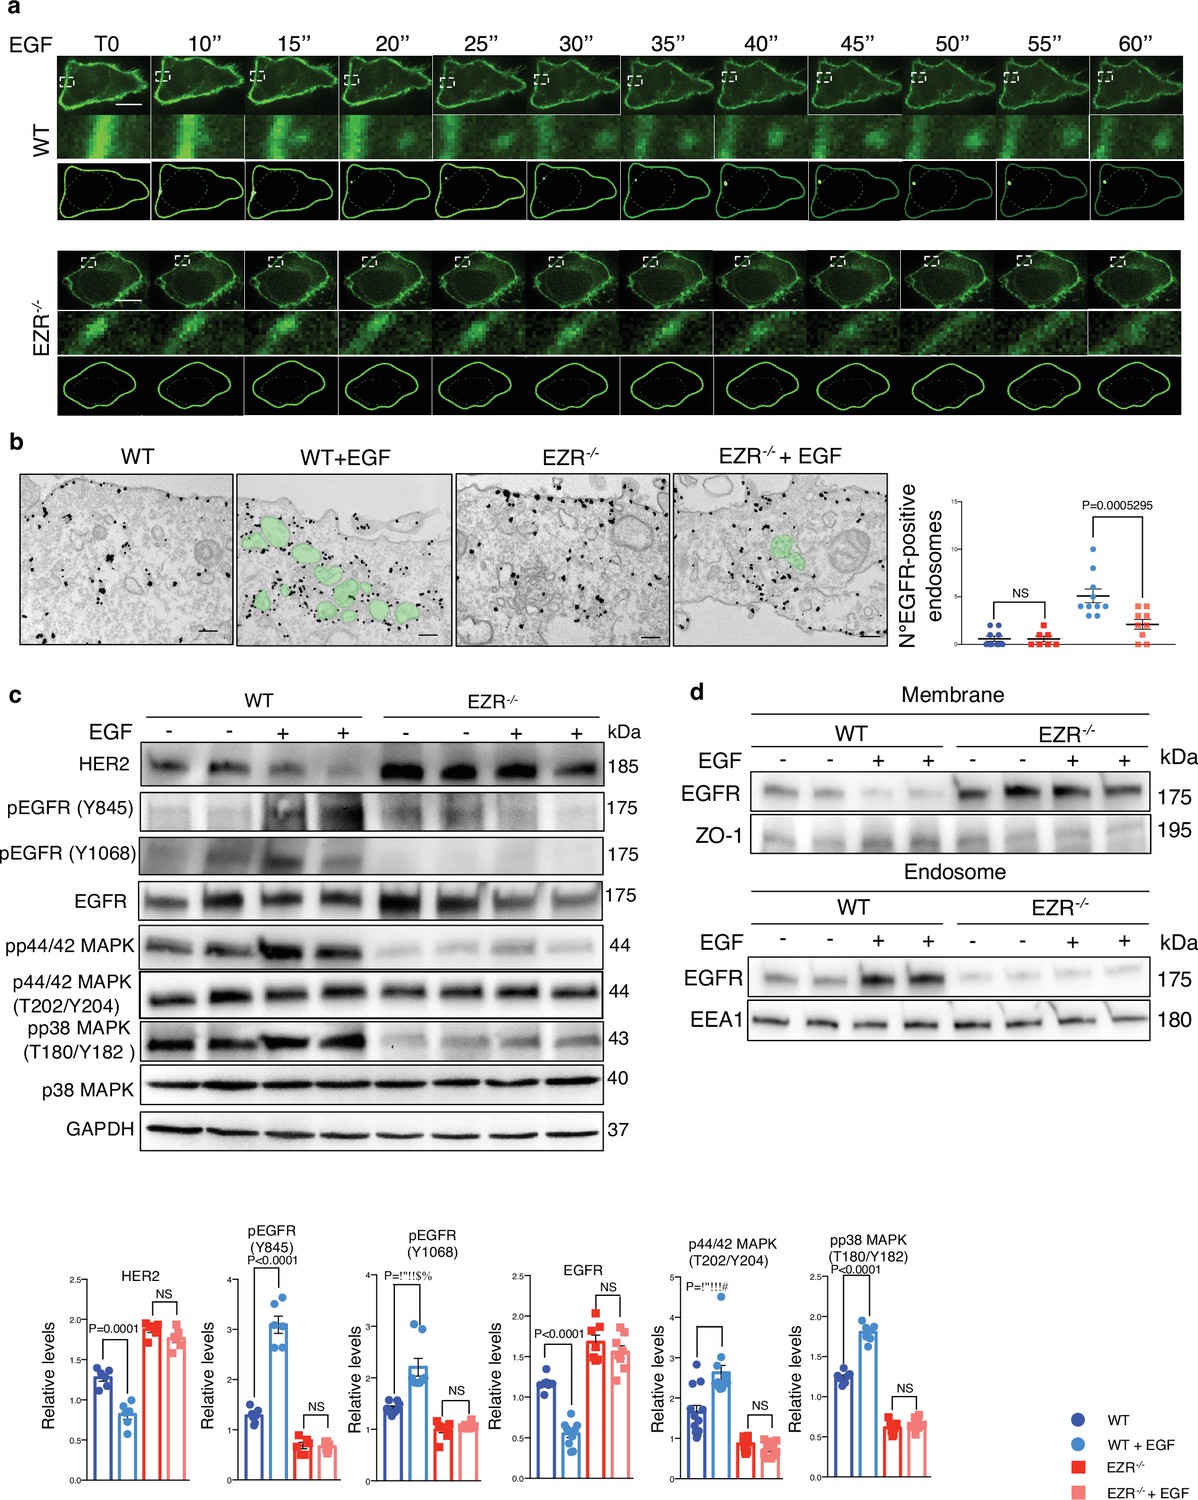
EGF stimulation does not affect EGFR in absence of Ezrin.
(a) Live cell imaging and model for EGFR (green) translocation from the membrane to the endosomes in HeLa WT (top) and EZR−/− (bottom) cells without EGF stimulation (T0) and with a progressive EGF stimulation (from T10’’ to T60’’). White boxes are magnifications that depict EGFR protein migration. Scale bar: 1 µm. Please refer to Figure 5—video 1. (b) IEM (anti-GFP immunolabeling) of cycloheximide-treated HeLa WT, WT + EGF, EZR−/−, and EZR−/− + EGF cells expressing EGFR-GFP. Endosomes containing EGFR is shown in green. Scale bar: 200 nm. Quantitative analysis (right) of EGFR-positive endosomes expressed as mean ± SEM. Statistical test: generalized linear model with likelihood ratio (Poisson regression). (c) Immunoblots and calculated levels (bottom) of HER2, pY845 EGFR, pY1068 EGFR, EGFR, pT202/Y204 p42/44 MAPK, pT180/pY182 p38 MAPK, and P38 MAPK in HeLa WT and EZR−/− cells with (+) and without (−) EGF stimulation. Data are expressed as mean of pY845EGFR/EGFR and pT180/pY182 p38 MAPK/P38 MAPK ratio ± SEM (n = 3 experiments at least). GAPDH was used as loading control. Statistical test: unpaired t-test for HER2 WT, HER2 EZR−/−, pY845 EGFR EZR−/−, pY1068 EGFR WT, pY1068 EGFR EZR−/−, EGFR WT, EGFR EZR−/−, pT202/Y204 p44/42 MAPK WT, pT202/Y204 p44/42 MAPK EZR−/−, pT180/pY182 p38 MAPK WT, and pT180/pY182 p38 MAPK EZR−/−; unpaired t-test with Welch’s correction for pY845 EGFR WT. (d) Representative immunoblots of EGFR in membrane (top) and endosomes (bottom) proteins in HeLa WT and EZR−/− with (+) and without (−) EGF stimulation. ZO-1 and EEA1 are used as membrane and endosomes extraction control, respectively. GAPDH is used as loading control.
-
Figure 5—source data 1
Raw uncropped and unedited blots relating to Figure 5.
- https://cdn.elifesciences.org/articles/98523/elife-98523-fig5-data1-v1.zip
-
Figure 5—source data 2
Uncropped blots with the relevant bands labeled relating to Figure 5.
- https://cdn.elifesciences.org/articles/98523/elife-98523-fig5-data2-v1.pdf
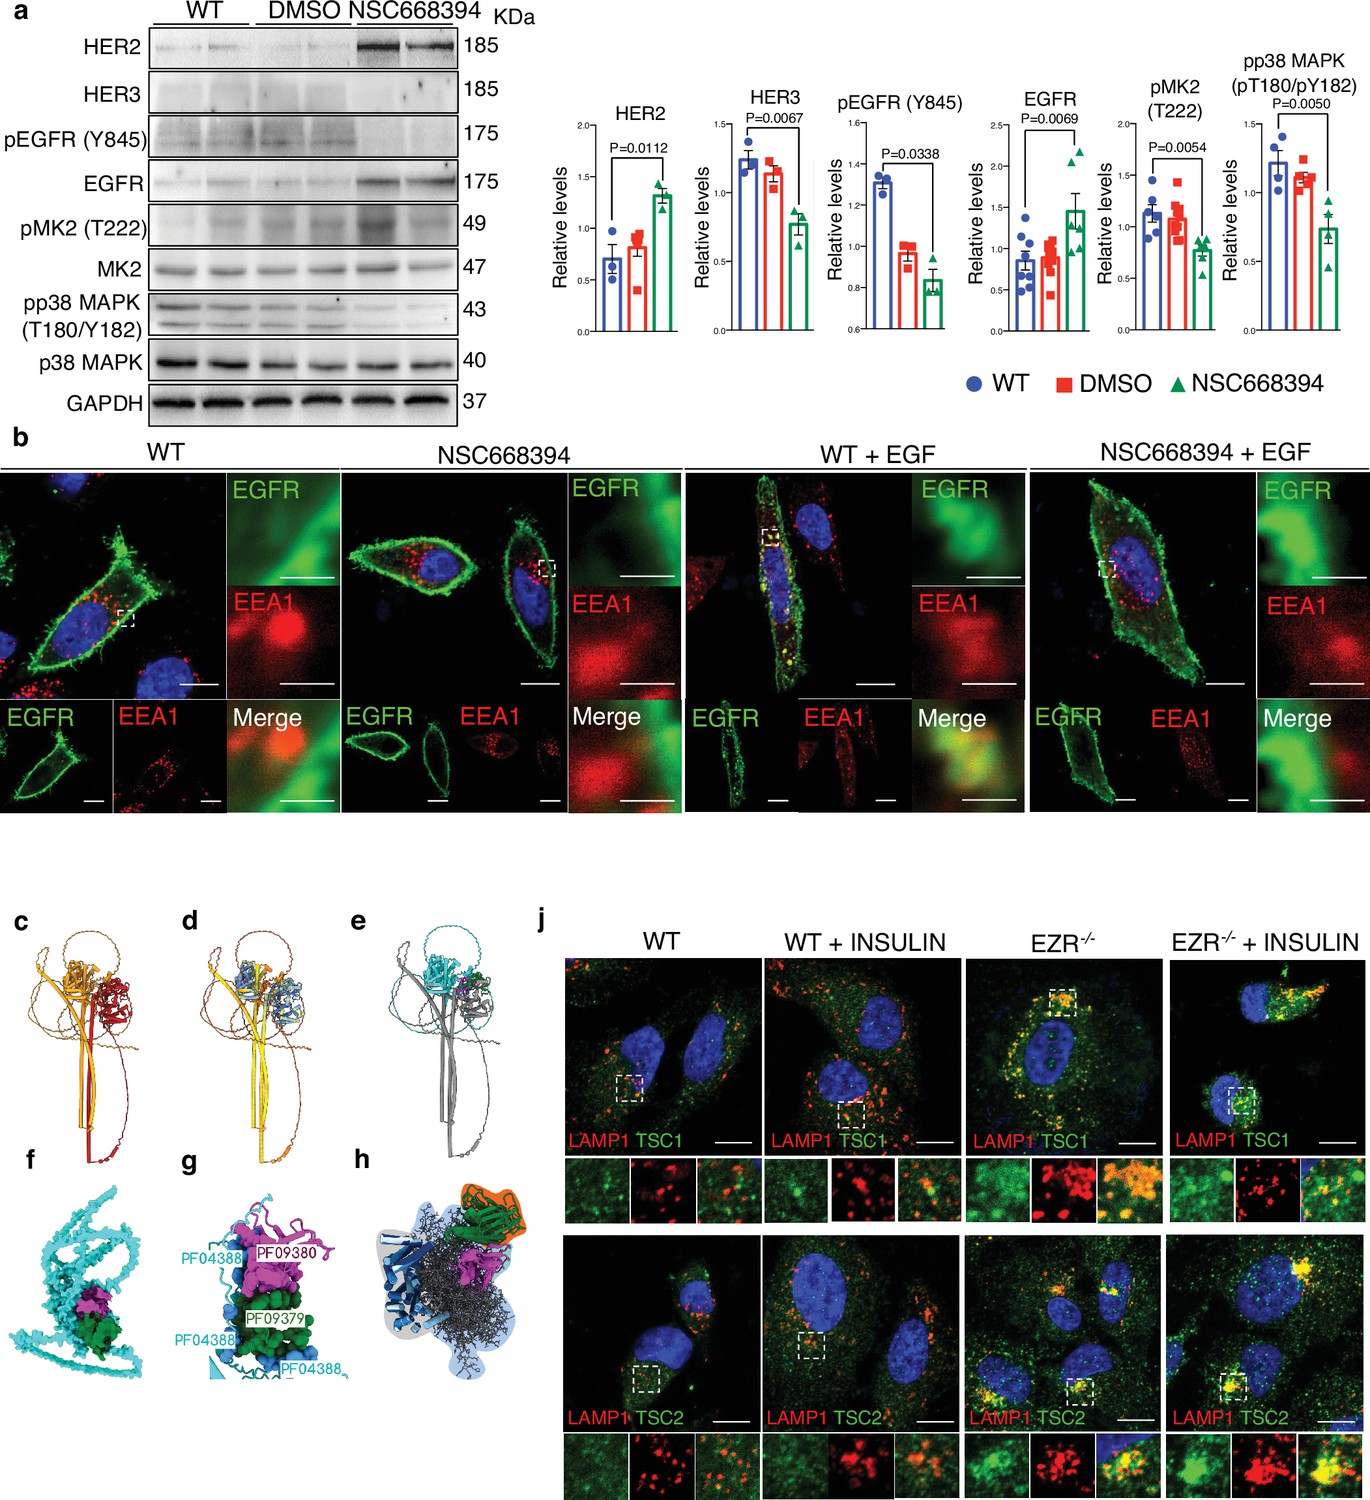
Figure 5—figure supplement 1
EZRIN interacts with TSC1.
(a) Immunoblots and calculated levels (bottom) of HER2, HER3, pY845 EGFR, EGFR, pT222 MK2, MK2, pT180/pY182 p38 MAPK, and P38 MAPK in HeLa WT and NSC668394-treated cells. Data are expressed as mean of HER2, HER3, pY845 EGFR, EGFR, pT222 MK2, and pT180/pY182 p38 MAPK ratio ± SEM (n = 3 experiments at least). GAPDH was used as loading control. Data are expressed as mean of HER2, HER3, pY845EGFR/EGFR, EGFR, pT222 MK2/MK2, and pT180/pY182 p38 MAPK/P38 MAPK ratio ± SEM (n = 3 experiments at least). Statistical test: one-way ANOVA with Tukey’s post hoc test for HER2, EGFR, pT222 MK2, and pT180/pY182 p38 MAPK; Kruskal–Wallis test with Dunn’s post hoc for pY845 EGFR. (b) Immunofluorescence labeling images of EGFR-GFP (green), EEA1 (red), and DAPI (blue) after 3 hr of EGF stimulation (bottom) in HeLa WT (left) and NSC668394-treated cells (right). Scale bar: 10 µm (magnification 1 µm). (c–e) Alphafold3 fold prediction for the EZRIN (UID:P15311)/HAMARTIN (UID:Q92574) dimer and detail of domain–domain interaction (f–h). The dimer prediction is color-coded by chain (c; EZRIN is firebick, HAMARTIN is orange), by plddt (d; yellow to blue with blue better), and by domain (cyan is hamartin protein domain (PF04388), magenta is FERM C-terminal PH-like domain (PF09380), green is FERM N-terminal domain (PF09379)). (e, f) Closeup of the interface as surface (f) and spheres representation (g). (h) The structural alignment (ChimeraX mmaker) of the five dimer fold models over the hamartin protein domain. The stable portion (gray section) of hamartin is colored in shades of blue, unreliable prediction (azure section) is depicted as gray sticks, FERM N and C term domain are depicted as ribbons and color-coded as per other subfigures. Regardless of the model confidence, EZRIN consistently interacts with a specific region of hamartin through FERM N/C domains. (j) Immunofluorescence labeling images of LAMP1 (red), TSC1 (green), and DAPI (blue) after 30 min of Insulin stimulation (upper panel) and LAMP1 (red), TSC2 (green), and DAPI (blue) after 30 min of Insulin stimulation (lower panel) in HeLa WT and EZR−/− cells, respectively. Scale bar: 10 µm (magnification 1 µm).
-
Figure 5—figure supplement 1—source data 1
Raw uncropped and unedited blots relating to Figure 5—figure supplement 1.
- https://cdn.elifesciences.org/articles/98523/elife-98523-fig5-figsupp1-data1-v1.zip
-
Figure 5—figure supplement 1—source data 2
Uncropped blots with the relevant bands labeled relating to Figure 5—figure supplement 1.
- https://cdn.elifesciences.org/articles/98523/elife-98523-fig5-figsupp1-data2-v1.pdf
Figure 5—video 1
WT HeLa cells expressing EGFR-GFP were imaged by Total Internal Reflection Fluorescence (TIRF) super-resolution microscopy every were imaged every 0.5 s for 5 min after EGF stimulation (related to Figure 5a).
Figure 5—video 2
Magnification from WT HeLa cells expressing EGFR-GFP, imaged by Total Internal Reflection Fluorescence (TIRF) super-resolution microscopy every were imaged every 0.5 s for 5 min after EGF stimulation (related to Figure 5a).
Figure 5—video 3
EZR−/− HeLa cells expressing EGFR-GFP were imaged by Total Internal Reflection Fluorescence (TIRF) super-resolution microscopy every were imaged every 0.5 s for 5 min after EGF stimulation (related to Figure 5a).
Figure 5—video 4
Magnification from EZR−/− HeLa cells expressing EGFR-GFP, imaged by Total Internal Reflection Fluorescence (TIRF) super-resolution microscopy every were imaged every 0.5 s for 5 min after EGF stimulation (related to Figure 5a).
Figure 6 with 2 supplements
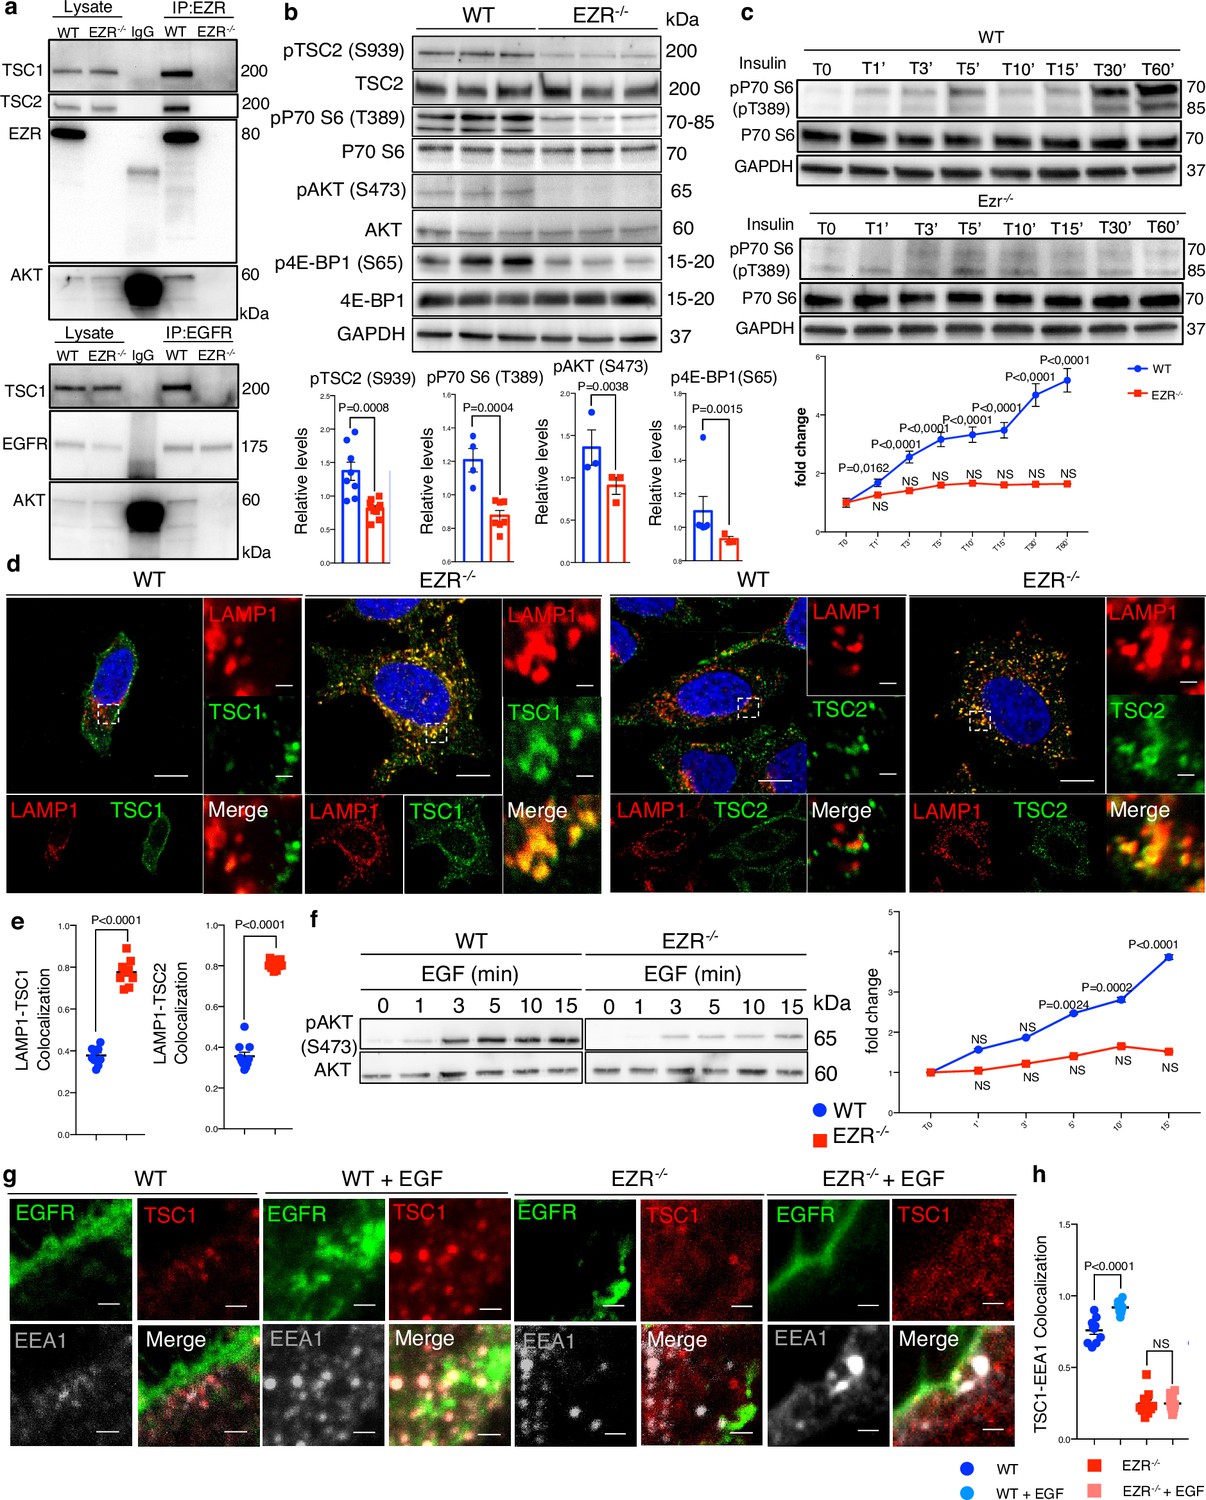
EGFR–Ezrin complex interacts with TSC1.
(a) Co-IP analysis for Ezr–TSC1 (left) and EGFR–TSC1 (right) interaction. For co-IP analyses, Ezrin (left) and EGFR (right) antibodies were used. The proteins immunoprecipitated were blotted for TSC1 and AKT antibodies in HeLa WT and EZR−/−. (b) HeLa WT and EZR−/− cells were lysed and immunoblotted with pS939 TSC2, TSC2, PT389 P70 S6 Kinase, P70 S6 Kinase, pS473 AKT, AKT, pS65 4E-BP1, 4E-BP1, and GAPDH as a loading control. Data represent the mean of pS939 TSC2/TSC2, T389 P70 S6 Kinase/P70 S6 Kinase, pS473 AKT/AKT, and pS65 4E-BP1/4E-BP1 ratio ± SEM (n = 3 experiments at least). Statistical test: unpaired t-test for pT389 P70 S6 Kinase, pS473 AKT; unpaired t-test with Welch’s correction for pS939 TSC2; Mann–Whitney test for pS939 TSC2. (c) pP70 S6 Kinase western blotting with insulin time course in HeLa WT (up) and EZR−/− (bottom) cells. Graph shows the mean of pP70 S6/P70 S6 ratio ± SEM (n = 3 experiments at least). Statistical test: one-way ANOVA for WT and KO curve (pairwise comparisons with reference T0). (d) Representative confocal images of LAMP1 and TSC1 (left) and LAMP1 and TSC2 (right) immunofluorescence in HeLa WT and EZR−/− cells. Magnified insets of TSC1/2 localization are shown. Scale bar: 10 µm (magnification 1 µm). (e) Data represent mean of LAMP1–TSC1 (left) and LAMP1–TSC2 (right) co-localization spots ± SEM (n = 3 experiments at least). Statistical test: unpaired t-test for LAMP1–TSC1; unpaired t-test with Welch’s correction for LAMP1–TSC2. (f) pS473 AKT western blotting with EGF time course in HeLa WT (left) and EZR−/− (right) cells. Graph shows the mean of pS473 AKT/AKT ratio ± SEM (n = 3 experiments at least). Statistical test: one-way ANOVA with Dunnett’s post hoc test for WT curve; Kruskal–Wallis test with Dunn’s post hoc test for KO curve (pairwise comparisons with reference T0). NS: not significant. (g) HeLa WT, WT + EGF, EZR−/− , and EZR−/− + EGF cells were immunostained with EGFR (green), TSC1 (red), and EEA1 (gray). Representative magnifications are shown. Scale bar: 10 µm (magnification 1 µm). (h) Data represent mean of TSC1–EEA1 co-localization spots ± SEM (n = 3 experiments at least). Statistical test: one-way ANOVA.
-
Figure 6—source data 1
Raw uncropped and unedited blots relating to Figure 6.
- https://cdn.elifesciences.org/articles/98523/elife-98523-fig6-data1-v1.zip
-
Figure 6—source data 2
Uncropped blots with the relevant bands labeled relating to Figure 6.
- https://cdn.elifesciences.org/articles/98523/elife-98523-fig6-data2-v1.pdf
Figure 6—figure supplement 1
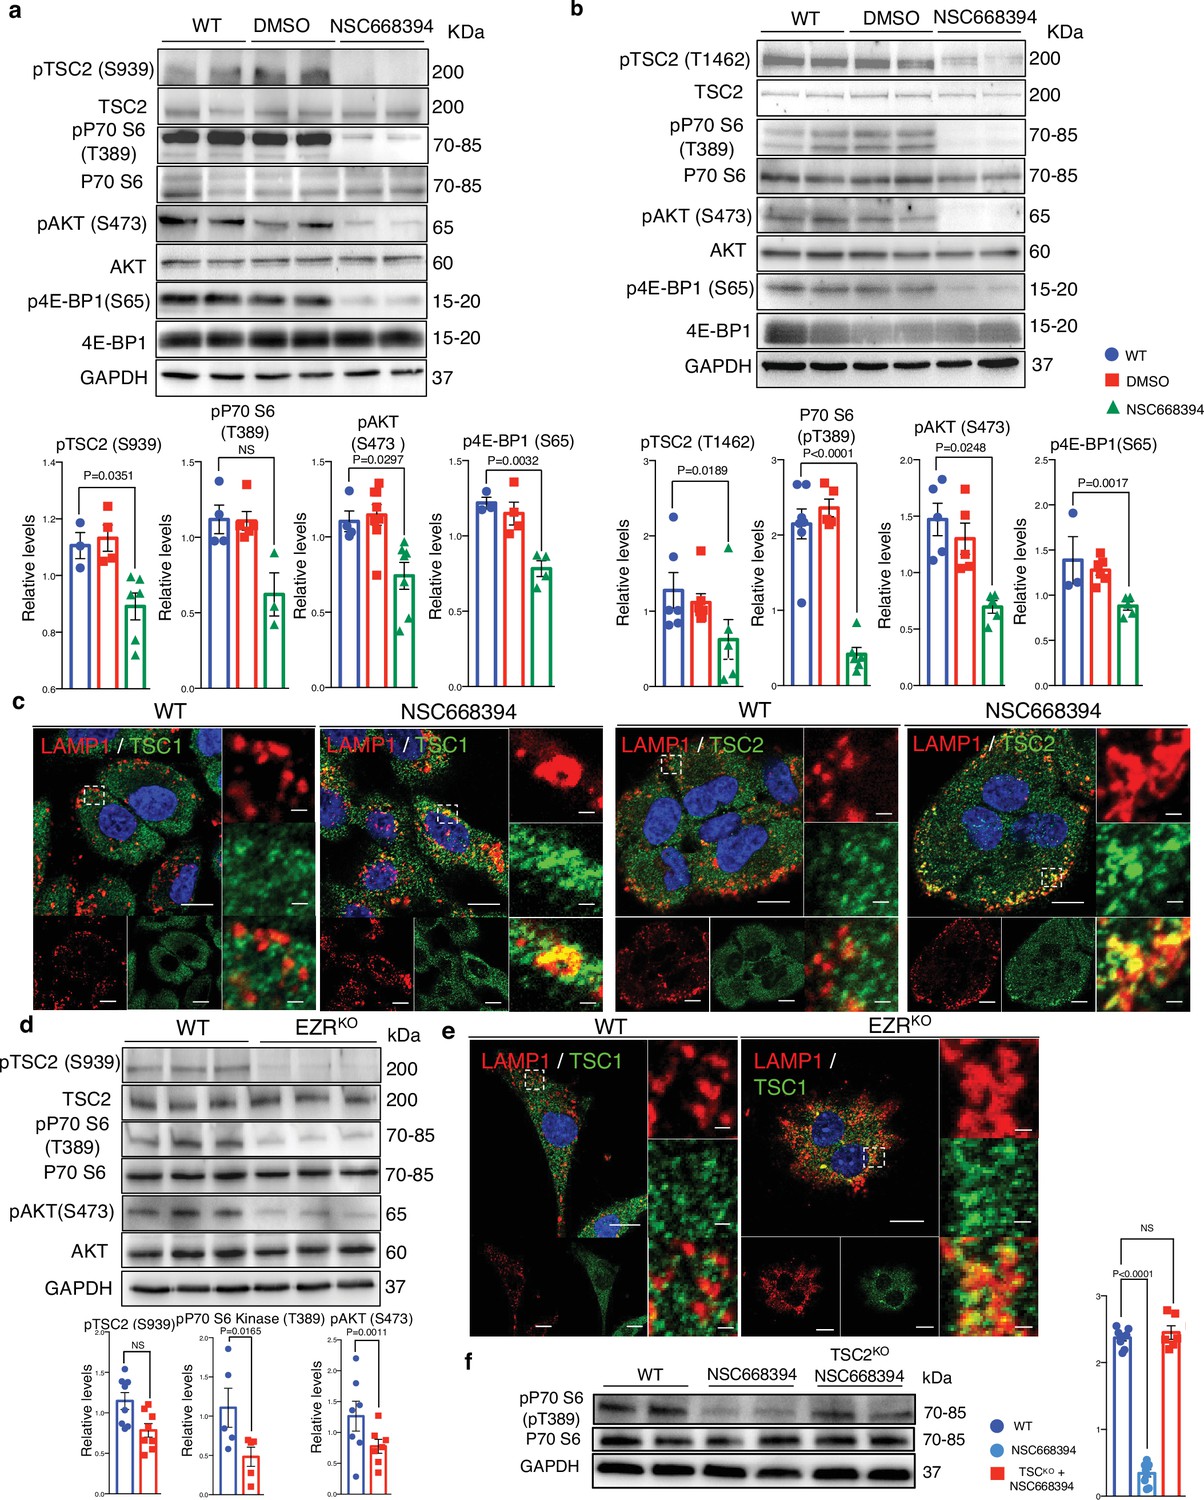
Ezrin inhibition induces mTORC1C1 pathway inhibition.
(a) Immunoblots and calculated levels (bottom) of pS939 TSC2, TSC2, pT389 P70 S6 Kinase, P70 S6 Kinase, pS473 AKT, AKT, pS65 4E-BP1, 4E-BP1 in HeLa WT, DMSO-treated, and NSC668394-treated cells. Data are expressed as mean of pS939 TSC2/TSC2, pT389 P70 S6 Kinase/P70 S6 Kinase, pS473 AKT/ AKT, and pS65 4E-BP1/4E-BP1 ratio ± SEM (n = 3 experiments at least). GAPDH was used as loading control. Statistical test: one-way ANOVA with Tukey’s post hoc test for pS939 TSC2, pS473 AKT, and pS65 4E-BP1; Kruskal–Wallis test with Dunn’s post hoc test for pT389 P70 S6 Kinase. (b) Immunoblots and calculated levels (bottom) of pT1462 TSC2, TSC2, pT389 P70 S6 Kinase, P70 S6 Kinase, pS473 AKT, AKT, pS65 4E-BP1, and 4E-BP1 in HeLa WT, DMSO-treated and NSC668394-treated cells. Data are expressed as mean of pT1462 TSC2/TSC2, pT389 P70 S6 Kinase/P70 S6 Kinase, pS473 AKT/ AKT, and pS65 4E-BP1/4E-BP1 ratio ± SEM (n = 3 experiments at least). GAPDH was used as loading control. Statistical test: one-way ANOVA with Tukey’s post hoc test for pT389 P70 S6 Kinase, pS473 AKT, and pS65 4E-BP1; Kruskal–Wallis test with Dunn’s post hoc test for pT1462 TSC2. (c) Immunofluorescence labeling images of LAMP1 (red), TSC1/TSC2 (green), and DAPI (blue) in mouse embryonic fibroblast (MEF) WT (left) and NSC668394-treated cells. Scale bar: 10 µm (magnification 1 µm). (d) Immunoblots and calculated levels (bottom) of pS939 TSC2, TSC2, pT389 P70 S6 Kinase, P70 S6 Kinase, pS473 AKT, and AKT in MEF WT and EZRKO cells. Data are expressed as mean of pS939 TSC2/TSC2, pT389 P70 S6 Kinase/P70 S6 Kinase, and pS473 AKT/ AKT ratio ± SEM (n = 3 experiments at least). GAPDH was used as loading control. Statistical test: unpaired t-test. (e) Immunofluorescence labeling images of LAMP1 (red), TSC1 (green), and DAPI (blue) in MEF WT and EZRKO cells. Scale bar: 10 µm (magnification 1 µm). (f) Immunoblots and calculated levels (right) of pT389 P70 S6 Kinase in MEF WT, MEF WT with NSC668394 treatment and TSC2KO treated with NSC668394 cells. Data are expressed as mean of pT389 P70 S6 Kinase/P70 S6 Kinase ratio ± SEM (n = 3 experiments at least). GAPDH was used as loading control. Statistical test: one-way ANOVA.
-
Figure 6—figure supplement 1—source data 1
Raw uncropped and unedited blots relating to Figure 6—figure supplement 1.
- https://cdn.elifesciences.org/articles/98523/elife-98523-fig6-figsupp1-data1-v1.zip
-
Figure 6—figure supplement 1—source data 2
Uncropped blots with the relevant bands labeled relating to Figure 6—figure supplement 1.
- https://cdn.elifesciences.org/articles/98523/elife-98523-fig6-figsupp1-data2-v1.pdf
Figure 6—figure supplement 2
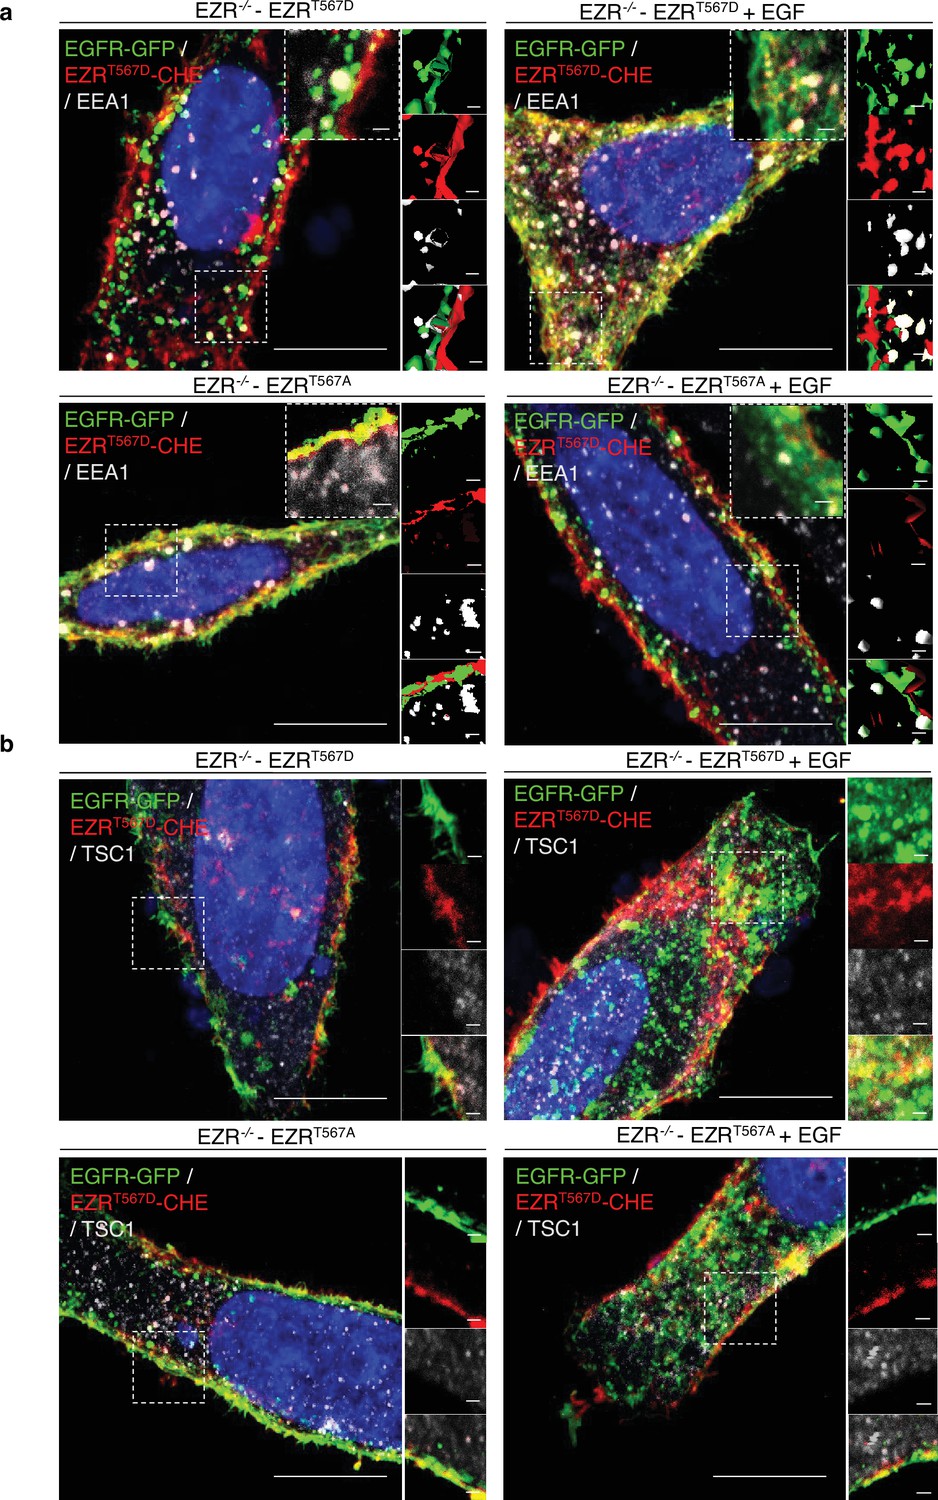
Ezrin overexpression rescue EGFR and TSC1 localization.
(a) Immunofluorescence labeling images of EGFR-GFP (green), EZRT567D-CHE (top), EZRT567A-CHE (bottom), EEA1 (gray), and DAPI (blue) in HeLa EZR−/−. EZRT567D, but not EZRT567A, with EGF stimulation rescued EGFR translocation on the endosomes in EZR−/− cells. Magnified views of EGFR and Ezrin localization are provided in both Airyscan high-resolution microscopy and 3D-confocal microscopy. Scale bar: 10 µm (magnification 1 µm). (b) Representative confocal images of EGFR-GFP (green), EZRT567D-CHE (top), EZRT567A-CHE (bottom), TSC1 (gray), and DAPI (blue) in HeLa EZR−/−. TSC1 localization misplaced from lysosomes to endosomes in HeLa EZR−/− cells, after EZRT567D transfection and upon EGF stimulation. Boxes show magnifications of TSC1 position, displayed both as Airyscan high-resolution microscopy and 3D-confocal microscopy. Scale bar: 10 µm (magnification 1 µm).
Figure 7 with 1 supplement
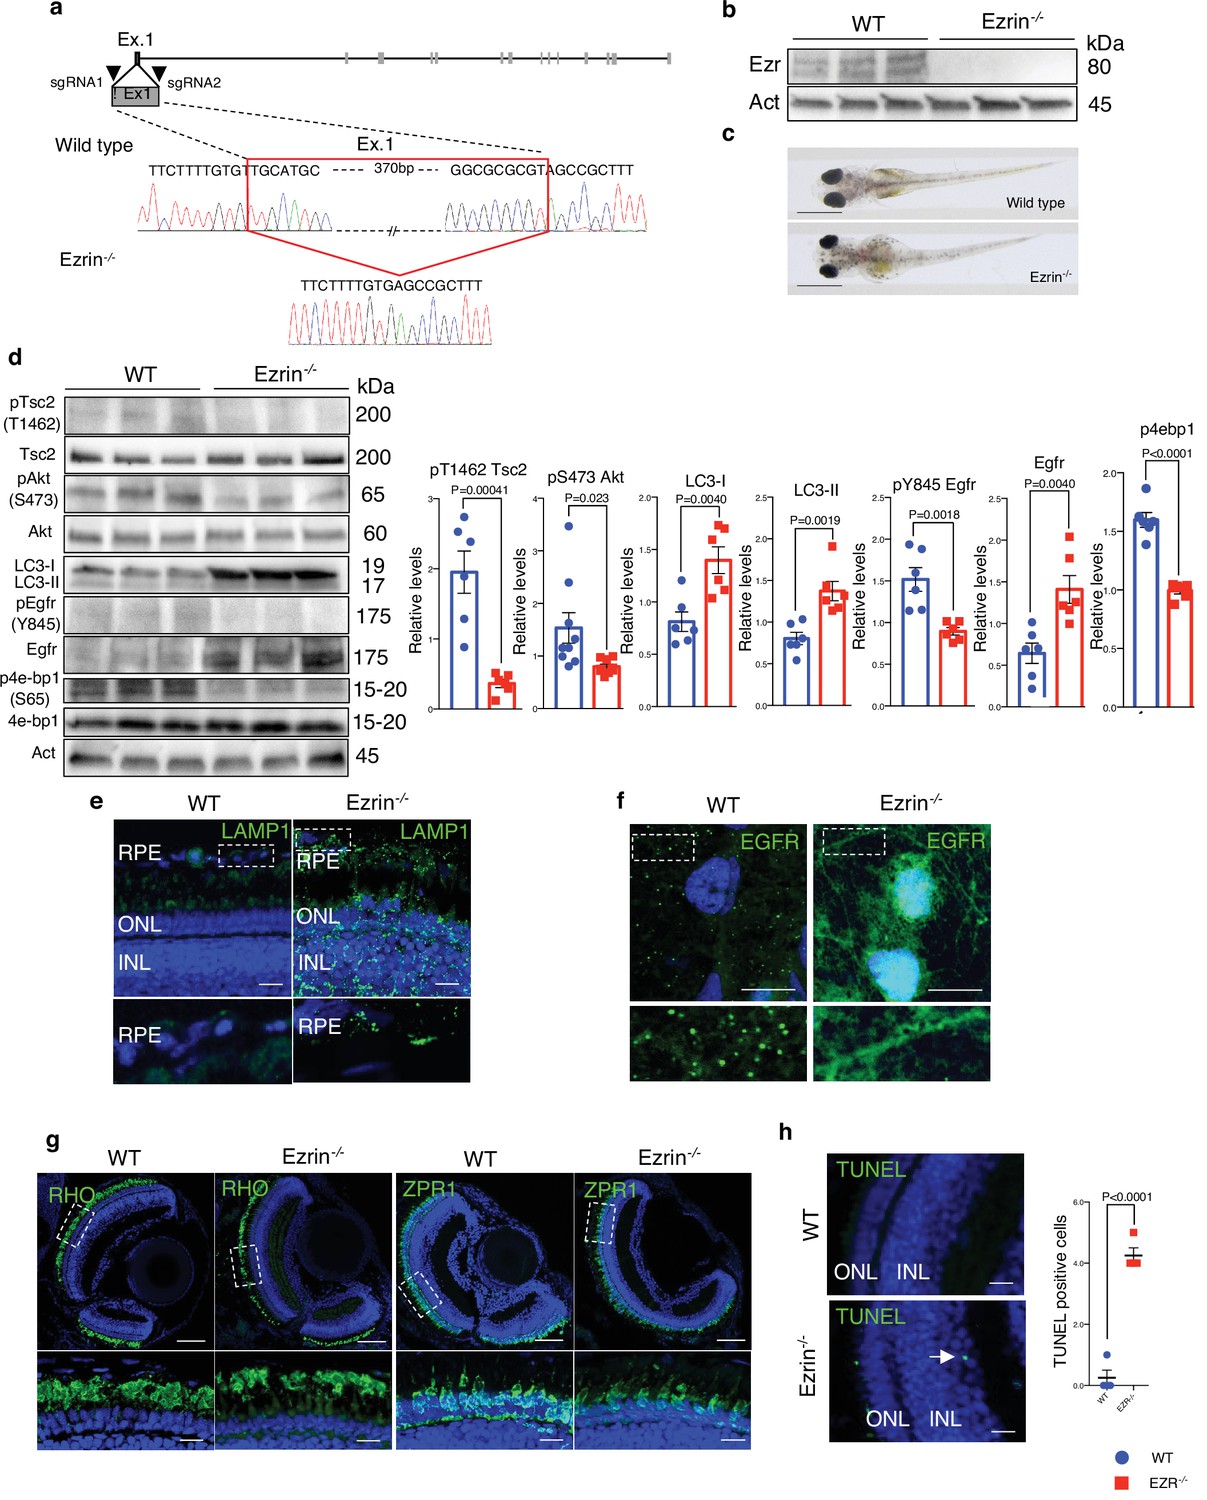
Ezrin depletion induces EGFR-mediated retinal degeneration.
(a) Schematic representation of used CRISPR/Cas9 strategy to generate Ezrin−/− medaka lines. The red box highlighted the deleted nucleotides in the Ezrin exon 1 gene. (b) WT and Ezrin−/− medaka proteins were immunoblotted with Ezrin antibody and Actin as a loading control. (c) Stereo-microscopic representative images of WT and Ezrin−/− medaka at stage 40. Scale bar: 1 mm. (d) Immunoblots and calculated levels (right) of pT1462 TSC2, pS473 Akt, LC3-I, LC3-II, pY845 Egfr and Egfr, pS65 4E-BP1 in WT and Ezrin−/− medaka fish. Data are expressed as mean of pT1462 TSC2/TSC2, pS473 Akt/Akt, pS65 4E-BP1/4EB-P1, and pY845EGFR/EGFR ratio ± SEM (n = 3 experiments at least). Actin was used as loading control. Statistical test: unpaired t-test. (e) Representative confocal images of LAMP1 immunofluorescence in WT and Ezrin−/− medaka fish. Magnified insets of RPE LAMP1 localization are shown. Scale bar: 10 µm. RPE: retinal pigment epithelium; ONL: outer nuclear layer; INL: inner nuclear layer. (f) Medaka WT and Ezrin−/− fish were immunostained with EGFR. Scale bar: 10 µm. (g) Immunofluorescence labeling images of RHO (left) and ZPR1 (right) in WT and Ezrin−/− fish. Magnified views of the regions in the boxes are provided at the bottom. Scale bar: 10 µm. (h) Confocal images showing representative TUNEL-positive cells on cryosection from WT and Ezrin−/− medaka lines. Scale bar: 10 µm. Graph shows the mean of number of TUNEL-positive cells for retina ± SEM (n = 3 experiments at least). Statistical test: unpaired t-test.
-
Figure 7—source data 1
Raw uncropped and unedited blots relating to Figure 7.
- https://cdn.elifesciences.org/articles/98523/elife-98523-fig7-data1-v1.zip
-
Figure 7—source data 2
Uncropped blots with the relevant bands labeled relating to Figure 7.
- https://cdn.elifesciences.org/articles/98523/elife-98523-fig7-data2-v1.pdf
Figure 7—figure supplement 1
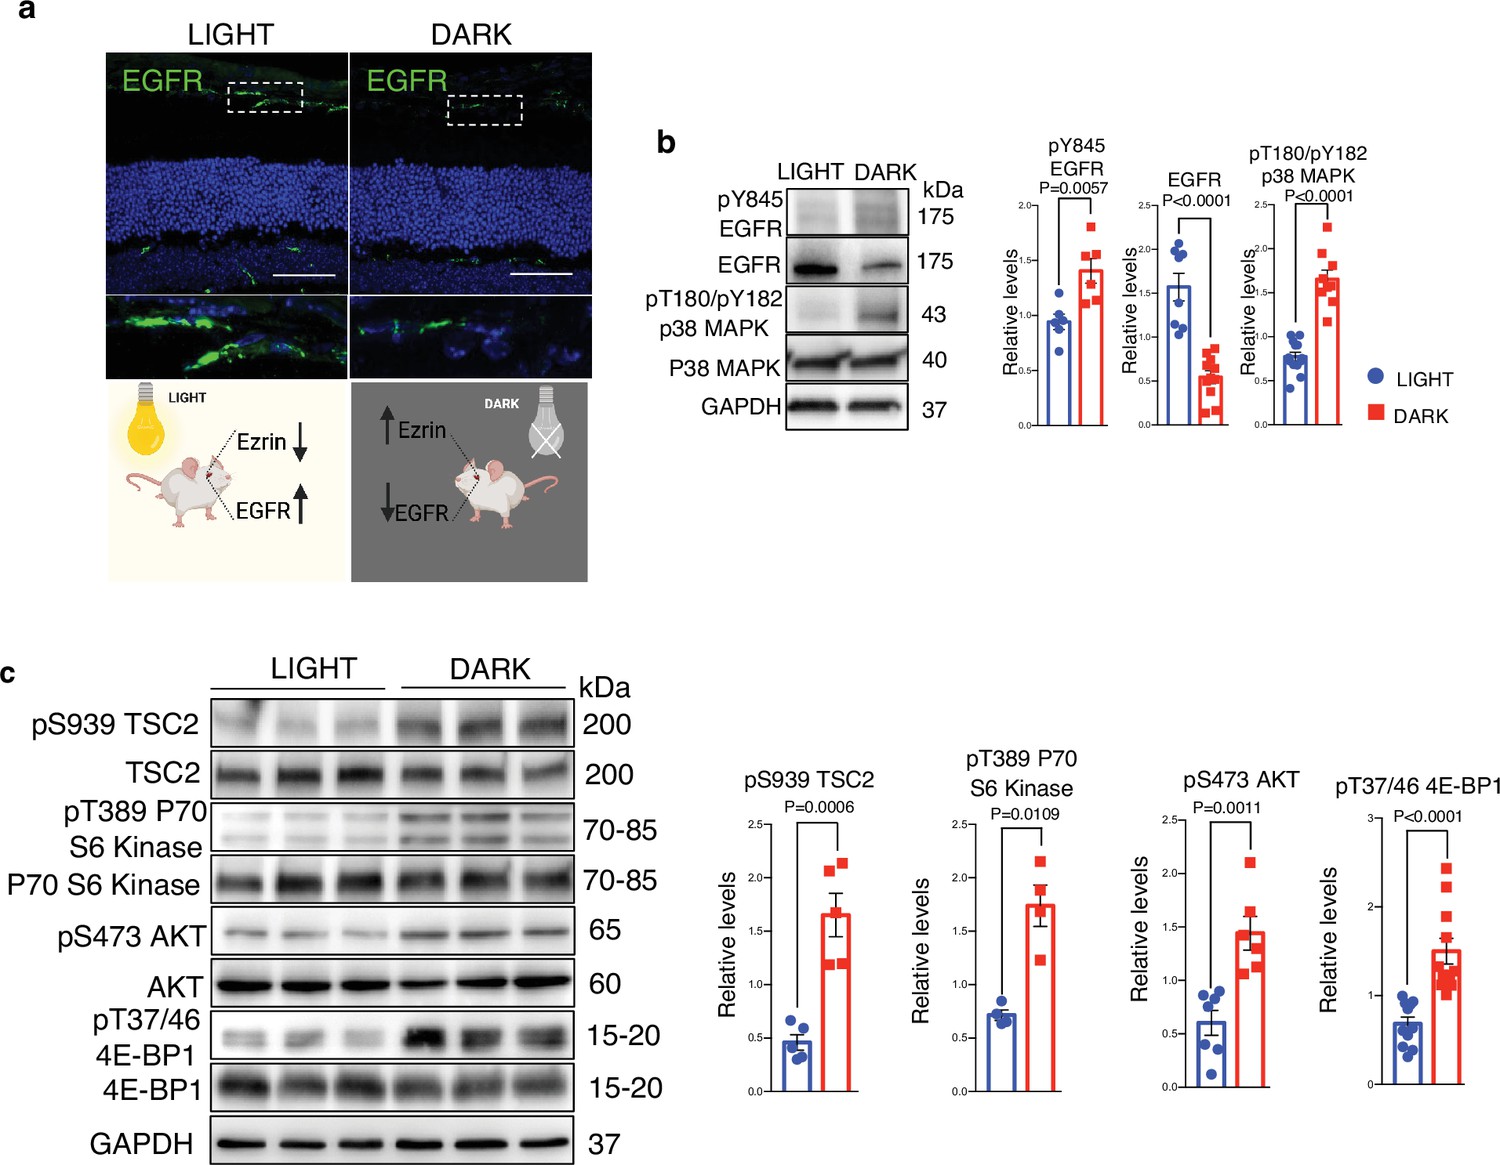
Light/dark transitions regulate EGFR and mTORC11 signaling in mice retinal pigment epithelium (RPE).
(a) WT mice were exposed 3 hr in light on (left) and dark (right) condition and after 3 hr the retina was analyzed by EGFR immunofluorescence. Representative images are shown. Scale bar: 50 µm. Schematic summary of EGFR and Ezrin trend in mice retina. This schematic was created using BioRender.com. (b) WT mice RPE were analyzed by western blot for EGFR pathway in light and dark conditions. Data are expressed as mean of pY845 EGFR/EGFR and pT180/pY182 p38 MAPK/P38 MAPK ratio ± SEM (n = 3 experiments at least). GAPDH was used as loading control. Statistical test: unpaired t-test for EGFR, pY845 EGFR, and pT180/pY182 p38 MAPK. (c) Immunoblots and calculated levels (right) of pS939 TSC2, TSC2, pT389 P70 S6 Kinase, P70 S6 Kinase, pS473 AKT, AKT, pT37/46 4E-BP1, and 4E-BP1 in light and dark-exposed WT mice. Data are expressed as mean of pS939 TSC2/TSC2, pT389 P70 S6 Kinase/P70 S6 Kinase, pS473 AKT/ AKT, and pT37/46 4E-BP1/4E-BP1 ratio ± SEM (n = 3 experiments at least). GAPDH was used as loading control. Statistical test: unpaired t-test for pS939 TSC2, pS473 AKT; unpaired t-test with Welch’s correction for pT389 P70 S6 Kinase; Mann–Whitney test for pT37/46 4E-BP1.
-
Figure 7—figure supplement 1—source data 1
Raw uncropped and unedited blots relating to Figure 7—figure supplement 1.
- https://cdn.elifesciences.org/articles/98523/elife-98523-fig7-figsupp1-data1-v1.zip
-
Figure 7—figure supplement 1—source data 2
Uncropped blots with the relevant bands labeled relating to Figure 7—figure supplement 1.
- https://cdn.elifesciences.org/articles/98523/elife-98523-fig7-figsupp1-data2-v1.pdf
Figure 8
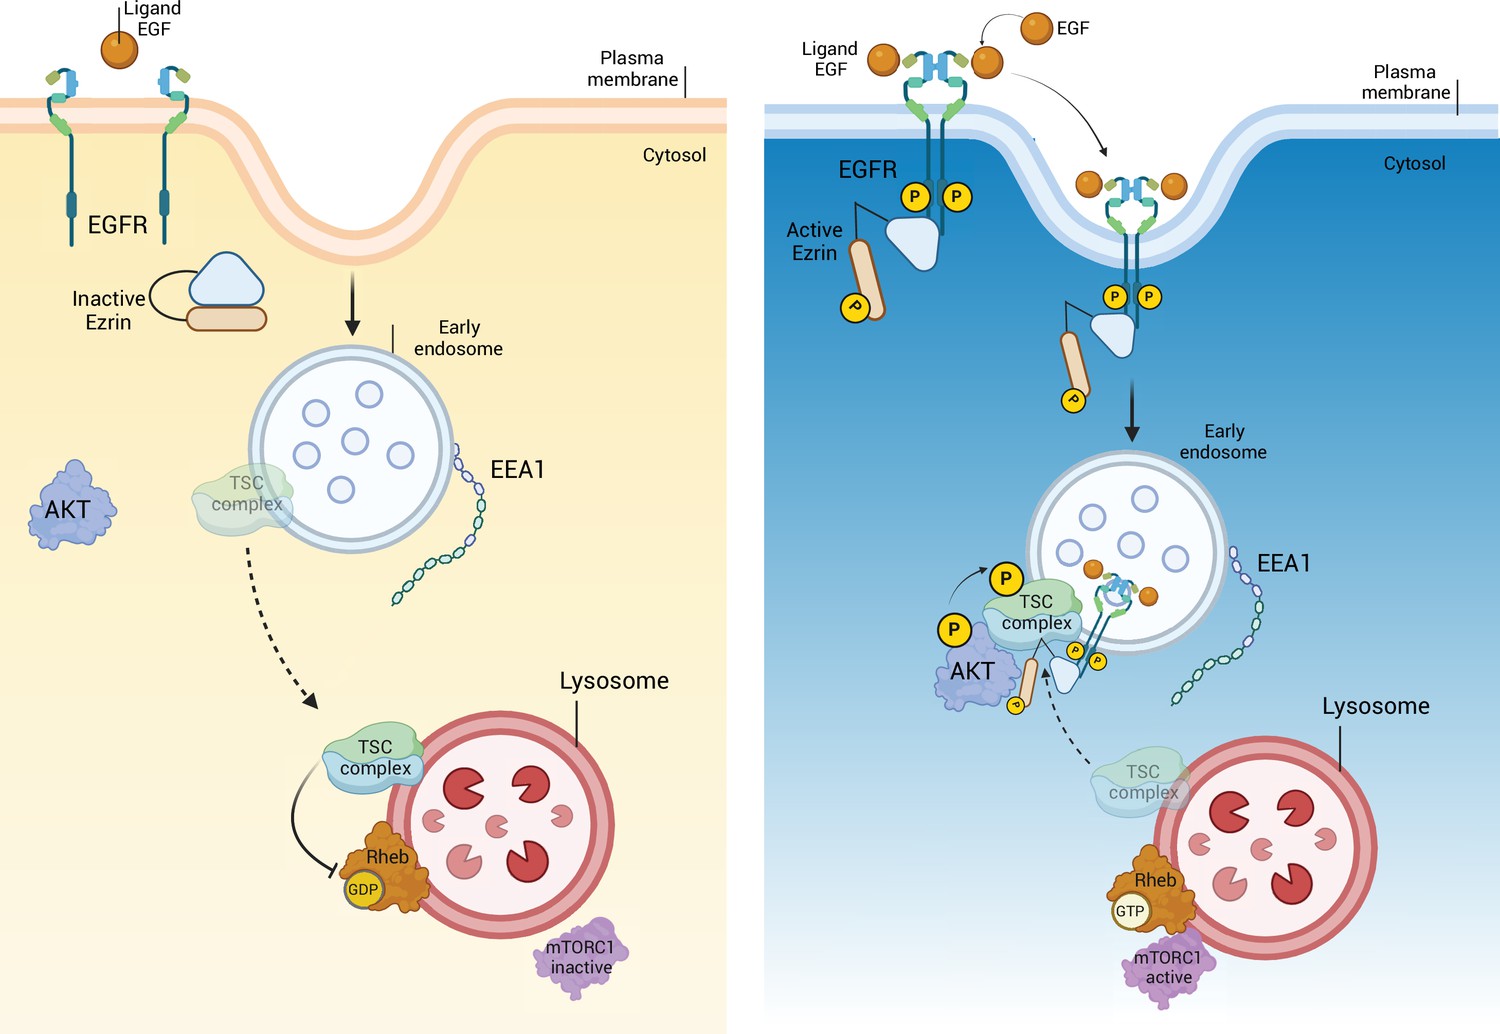
EGFR/Ezrin/TSC complex molecular pathway.
Diurnal inactivation of Ezrin leads to incapacity of EGFR to dimerize. The absence of active EGFR on the endosome causes the migration of TSC complex on the lysosome, where it inhibits mTORC1C1. On the contrary, the nocturnal activation of Ezrin favorites the phosphorylation and dimerization of EGFR, that translocate from the plasma membrane on the early endosome. Ezrin localized with EGFR, on the endosomal membrane, binds TSC complex, preventing mTORC1C1 inactivation on the lysosome. This figure was created using BioRender.com.
Tables
Key resources table
| Reagent type (species) or resource | Designation | Source or reference | Identifiers | Additional information |
|---|---|---|---|---|
| Strain, strain background (Oryzias latipes, male and female) | Oryzias latipes | Iwamatsu, 2004 | ||
| Strain, strain background (Oryzias latipes, male and female) | Oryzias latipes EZR−/− | This paper | See Materials and methods: Ezrin−/− medaka generation by CRISPR/Cas9 system | |
| Cell line (human) | ARPE-19 | ATCC | CRL-2302 | |
| Cell line (human) | HeLa | ATCC | CCL-2 | |
| Cell line (mouse) | MEF | ATCC | SCRC-1008 | |
| Cell line (human) | HeLa EZR−/− | This paper | See Materials and methods: Generation of an EZR−/− HeLa cell line | |
| Transfected construct (human) | EzrinT567D-mCherry | S.Coskoy lab (Institute Curie, Paris) | ||
| Transfected construct (human) | EzrinT567A-mCherry | S.Coskoy lab (Institute Curie, Paris) | ||
| Transfected construct (human) | EGFR-GFP | Addgene | 32751 | |
| Transfected construct (Streptococcus pyogenes M1) | pCS2-nCas9n | Addgene | #4729 | |
| Transfected construct | Lipofectamine 2000 | Invitrogen | 12566014 | |
| Antibody | anti-NBR1 (mouse monoclonal) | Abnova | MO1 | WB (1:1000) |
| Antibody | anti-LAMP1 (rat monoclonal) | Santa Cruz | Sc-19992 | IF (1:400) |
| Antibody | anti-LAMP1 (rabbit monoclonal) | Sigma | L1418 | WB (1:500) |
| Antibody | anti-LAMP1 (mouse monoclonal) | DSHB | H4A3 | IF (1:1000) |
| Antibody | anti-LAMP1 (rabbit polyclonal) | Abcam | ab24170 | IF (1:100) |
| Antibody | anti-Ezrin (mouse monoclonal) | Novex | 357300 | WB (1:1000) |
| Antibody | anti-SQSTM1/P62 (mouse monoclonal) | Abcam | ab56416 | WB (1:1000) |
| Antibody | anti-Cathepsin D (rabbit monoclonal) | Cell Signaling | 2284 | WB (1:1000) |
| Antibody | anti-LC3 (rabbit polyclonal) | Novus | NB100-2220 | WB (1:1000) IF (1:200) |
| Antibody | anti-GAPDH (mouse monoclonal) | Santa Cruz | SC-32233 | WB (1:1000) |
| Antibody | anti-HER2/ErbB2 (rabbit monoclonal) | Cell Signaling | 2165 | WB (1:1000) |
| Antibody | anti-HER3/ErbB3 (rabbit monoclonal) | Cell Signaling | 12708 | WB (1:1000) |
| Antibody | anti-EGF receptor (rabbit monoclonal) | Cell Signaling | 4267 | WB (1:1000) IF (1:50) |
| Antibody | anti-phospho-EGF receptor (Tyr1068) (rabbit monoclonal) | Cell Signaling | 3777 | WB (1:1000) |
| Antibody | anti-phospho-EGF receptor (Tyr845) (rabbit monoclonal) | Cell Signaling | 6963 | WB (1:1000) |
| Antibody | anti-MAPKAPK-2 (rabbit polyclonal) | Cell Signaling | 3042 | WB (1:1000) |
| Antibody | anti-phospho-MAPKAPK-2 (Thr222) (rabbit monoclonal) | Cell Signaling | 3316 | WB (1:1000) |
| Antibody | anti-p38 MAPK (rabbit monoclonal) | Cell Signaling | 8690 | WB (1:1000) |
| Antibody | anti-phospho-p38 MAPK (Thr180/Tyr182) (rabbit monoclonal) | Cell Signaling | 4511 | WB (1:1000) |
| Antibody | anti-ZO1 (rabbit polyclonal) | Abcam | ab216880 | WB (1:1000) |
| Antibody | anti-EEA1 (mouse monoclonal) | BD | 610457 | WB (1:1000) IF (1:100) |
| Antibody | anti-Tuberin/TSC2 (rabbit monoclonal) | Cell Signaling | 4308 | WB (1:1000) IF (1:100) |
| Antibody | anti-phospho-Tuberin/TSC2 (Ser939) (rabbit polyclonal) | Cell Signaling | 3615 | WB (1:1000) |
| Antibody | anti-phospho-Tuberin/TSC2 (Thr1462) (rabbit monoclonal) | Cell Signaling | 3617 | WB (1:1000) |
| Antibody | anti-p70 S6 Kinase (rabbit polyclonal) | Cell Signaling | 9202 | WB (1:1000) |
| Antibody | anti-phospho-p70 S6 Kinase (Thr389) (mouse monoclonal) | Cell Signaling | 9206 | WB (1:1000) |
| Antibody | anti-Akt (rabbit polyclonal) | Cell Signaling | 9272 | WB (1:1000) |
| Antibody | anti-phospho-Akt (Ser473) (rabbit monoclonal) | Cell Signaling | 4060 | WB (1:1000) |
| Antibody | anti-4E-BP1 (rabbit monoclonal) | Cell Signaling | 9644 | WB (1:1000) |
| Antibody | anti-phospho-4E-BP1 (Ser65) (rabbit monoclonal) | Cell Signaling | 9456 | WB (1:1000) |
| Antibody | anti-phospho-4E-BP1 (Thr37/46) (rabbit monoclonal) | Cell Signaling | 2855 | WB (1:1000) |
| Antibody | anti-Hamartin/TSC1 (rabbit monoclonal) | Cell Signaling | 6935 | WB (1:1000) IF (1:1000) |
| Antibody | anti-EGFR (mouse monoclonal) | Santa Cruz | sc-120 | WB (1:500) IF (1:50) |
| Antibody | anti-p-EGFR (mouse monoclonal) | Santa Cruz | sc-57542 | WB (1:500) |
| Antibody | anti-GFP (chicken monoclonal) | Abcam | Ab13970 | IF (1:500) |
| Antibody | anti-rabbit/mouse/chicken- Alexa-488 (GOAT) | Invitrogen | A-11008 rabbit A-1102 mouse A-1109 | IF (1:1000) |
| Antibody | anti-mouse/rat- Alexa-594 (GOAT) | Invitrogen | A-1102 mouse A-11007 rat | IF (1:1000) |
| Sequence-based reagent | gRNA | http://crispor.tefor.net/crispor.py | CAATGTCCGAGTTACCACCA See Materials and methods: Generation of an EZR−/− HeLa cell line | |
| Sequence-based reagent | hEZRNup | This paper | PCR primers | TGCCGTCGCCACACTGAGGA See Materials and methods: Generation of an EZR−/− HeLa cell line |
| Sequence-based reagent | hEZRNlow | This paper | PCR primers | TCCTTTGCTTCCATGCCTGG See Materials and methods: Generation of an EZR−/− HeLa cell line |
| Sequence-based reagent | olEzrin_Forward | This paper | PCR primers | GAACTCCTTCTAGCACCC See Materials and methods: Ezrin−/− medaka generation by CRISPR/Cas9 system |
| Sequence-based reagent | olEzrin_Reverse | This paper | PCR primers | CCGCCTCCCTCCTCAAATC See Materials and methods: Ezrin−/− medaka generation by CRISPR/Cas9 system |
| Sequence-based reagent | gRNA olEzrin Sense | This paper | ACAATGGATGAGCCTATTAG See Materials and methods: Ezrin−/− medaka generation by CRISPR/Cas9 system | |
| Sequence-based reagent | gRNA olEzrin antisense | This paper | AGACTGATGCTGCCTCACTG See Materials and methods: Ezrin−/− medaka generation by CRISPR/Cas9 system | |
| Peptide, recombinant protein | Dynabeads Protein G | Thermo Fisher Scientific | 10004D | Immunopreciptation assay |
| Commercial assay or kit | iST Kit | Preomics | P.O.00027 | Peptides purification |
| Commercial assay or kit | mRNA sequencing library preparation of MEF | miRNeasy Micro Kit | 1071023 | |
| Commercial assay or kit | Cross-linking assay Lomant’s reagent | Thermo Fisher | 22585 | |
| Commercial assay or kit | LysoTracker RED | Invitrogen | L7528 | |
| Commercial assay or kit | CellLight Early Endosomes- RFP | Invitrogen | C10587 | |
| Commercial assay or kit | Cathepsin B | Abcam | AB65300 | |
| Commercial assay or kit | Clarity Western ECL Substrate | Bio-Rad Laboratories | ||
| Chemical compound, drug | Cycloheximide (CHX) | Sigma-Aldrich | C4859 | Cell treatments |
| Chemical compound, drug | Bafilomycin A1 | Sigma-Aldrich | B1793 | Cell treatments |
| Chemical compound, drug | EGF | Peprotech | AF-100-15 | Cell treatments |
| Software, algorithm | MaxQuant | Andromeda search engine | Mass spectrometry, all acquired raw files | |
| Software, algorithm | ImageJ Software | Schneider et al., 2012 | v. 1.54K | Immunofluorescence and western blot quantification |
| Software, algorithm | DAVID Bioinformatic tool | Huang et al., 2009a; Huang et al., 2009b | Functional analysis on transcriptomics and proteomics data | |
| Software, algorithm | iTEM software | Olympus SYS, Germany | Fluorescence imaging | |
| Software, algorithm | GraphPad Prism | Boston, Massachusetts USA. | 10.0.0 | Graphs |
| Commercial assay or kit | DAPI stain | Vector Laboratories | H-1200 | 1:500 |
| Commercial assay or kit | HBSS medium | Thermo Fisher Scientific | 14025092 | |
| Commercial assay or kit | HEPES | Thermo Fisher Scientific | 156330080 |
Table 1
Primer sequences.
| Name | Sequence (5′–3′) | Usage | |
|---|---|---|---|
| EZRIN-gRNA | olEzrin Sense | ACAATGGATGAGCCTATTAG | CRISPR/Cas9-LoxP target site |
| olEzrin Antisense | AGACTGATGCTGCCTCACTG | ||
| Primers | olEzrin_Forward olEzrin_Reverse | GAACTCCTTCTAGCACCC CCGCCTCCCTCCTCAATC | PCR for olEzrin genotype |
Additional files
-
Supplementary file 1
Comparison of the transcriptomics and proteomics analyses.
- https://cdn.elifesciences.org/articles/98523/elife-98523-supp1-v1.xlsx
-
Supplementary file 2
Gene Ontology (GO) and differentially expressed genes (DEGs) on common genes.
- https://cdn.elifesciences.org/articles/98523/elife-98523-supp2-v1.xlsx
-
Supplementary file 3
Cellular Compartment (CC) on common genes.
- https://cdn.elifesciences.org/articles/98523/elife-98523-supp3-v1.xlsx
-
Supplementary file 4
Data from SILAC Phosphoproteomics, Kinase perturbations, and Proteomics drug atlas.
- https://cdn.elifesciences.org/articles/98523/elife-98523-supp4-v1.xlsx
-
Supplementary file 5
Genes derived from GeneMANIA.
- https://cdn.elifesciences.org/articles/98523/elife-98523-supp5-v1.xlsx
-
MDAR checklist
- https://cdn.elifesciences.org/articles/98523/elife-98523-mdarchecklist1-v1.docx
Download links
A two-part list of links to download the article, or parts of the article, in various formats.
Downloads (link to download the article as PDF)
Open citations (links to open the citations from this article in various online reference manager services)
Cite this article (links to download the citations from this article in formats compatible with various reference manager tools)
Ezrin defines TSC complex activation at endosomal compartments through EGFR–AKT signaling
eLife 13:RP98523.
https://doi.org/10.7554/eLife.98523.3


