PDGFRα signaling regulates Srsf3 transcript binding to affect PI3K signaling and endosomal trafficking
- Department of Craniofacial Biology, School of Dental Medicine, University of Colorado Anschutz Medical Campus, United States
- Medical Scientist Training Program, University of Colorado Anschutz Medical Campus, United States
- Department of Biochemistry and Molecular Genetics, School of Medicine, University of Colorado Anschutz Medical Campus, United States
- RNA Bioscience Initiative, University of Colorado Anschutz Medical Campus, United States
- Institute of Human Genetics, Polish Academy of Sciences, Poland
- Department of Otolaryngology – Head and Neck Surgery, University of Colorado Anschutz Medical Campus, United States
- Basic and Translational Sciences, Penn Dental Medicine, University of Pennsylvania, United States
Figures
Figure 1 with 2 supplements

PDGFRα signaling for 1 hr minimally affects gene expression.
(A) Schematic of RNA-seq experimental design. Immortalized mouse embryonic palatal mesenchyme (iMEPM) cells were transduced to stably express a scramble shRNA (scramble) or shRNA targeting the 3’ UTR of Srsf3 (shSrsf3). iMEPM cells expressing either scramble or shSrsf3 were left unstimulated or stimulated with 10 ng/mL PDGF-AA for 1 hr and RNA was isolated for RNA-seq analysis. (B) Western blot (WB) analysis of whole-cell lysates (WCL) from scramble and shSrsf3 cell lines with anti-Srsf3 and anti-Gapdh antibodies. The percentage of Srsf3 expression normalized to Gapdh expression is indicated below. (C) Volcano plots depicting differentially expressed genes in scramble versus shSrsf3 cell lines in the absence (left) or presence (right) of PDGF-AA stimulation. Log2 (fold change) (FC) values represent log2 (shSrsf3 normalized counts/scramble normalized counts). Significant changes in gene-level expression are reported for genes with adjusted p (padj)<0.05 and fold change |FC| ≥ 2. (D) Venn diagram of significant genes from (C). (E) Volcano plots depicting differentially expressed genes in the absence versus presence of PDGF-AA ligand in scramble (left) or shSrsf3 (right) cell lines. Log2 (FC) values represent log2 (+PDGF-AA normalized counts/-PDGF-AA normalized counts). (F) Venn diagram of significant genes from (E).
-
Figure 1—source data 1
Srsf3 western blots.
- https://cdn.elifesciences.org/articles/98531/elife-98531-fig1-data1-v1.zip
-
Figure 1—source data 2
Gapdh western blots.
- https://cdn.elifesciences.org/articles/98531/elife-98531-fig1-data2-v1.zip
-
Figure 1—source data 3
DESeq2 output.
- https://cdn.elifesciences.org/articles/98531/elife-98531-fig1-data3-v1.xlsx
Figure 1—figure supplement 1
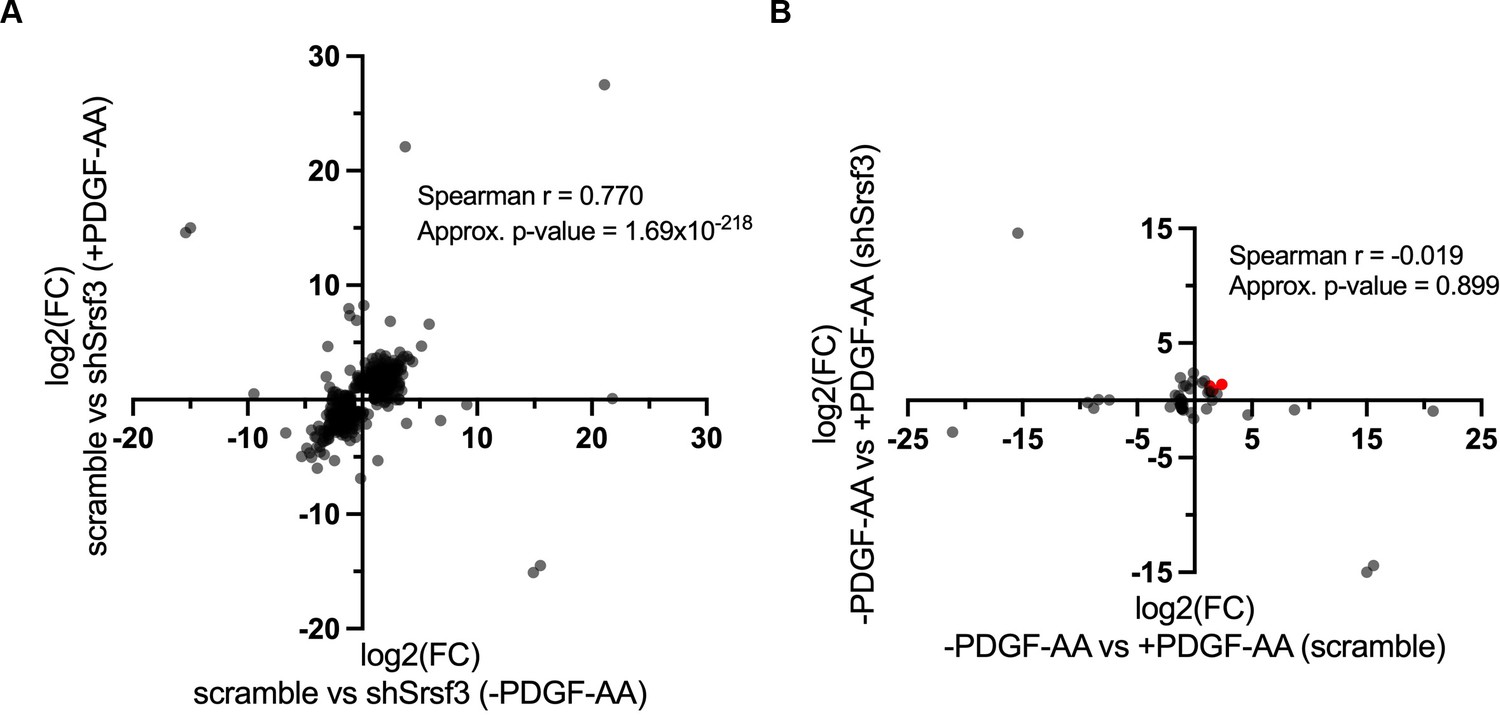
High correlation of Srsf3-dependent differentially expressed genes across ligand treatment conditions.
(A, B) Scatter dot plots depicting Srsf3-dependent (A) and PDGF-AA-dependent (B) differentially expressed genes. Log2 (fold change) (FC) values represent log2 (shSrsf3 normalized counts/scramble normalized counts) (A) or log2 (+PDGF-AA normalized counts/-PDGF-AA normalized counts) (B). Spearman correlation values and approximate p-values are listed. Immediate early genes are represented in red in (B).
Figure 1—figure supplement 2
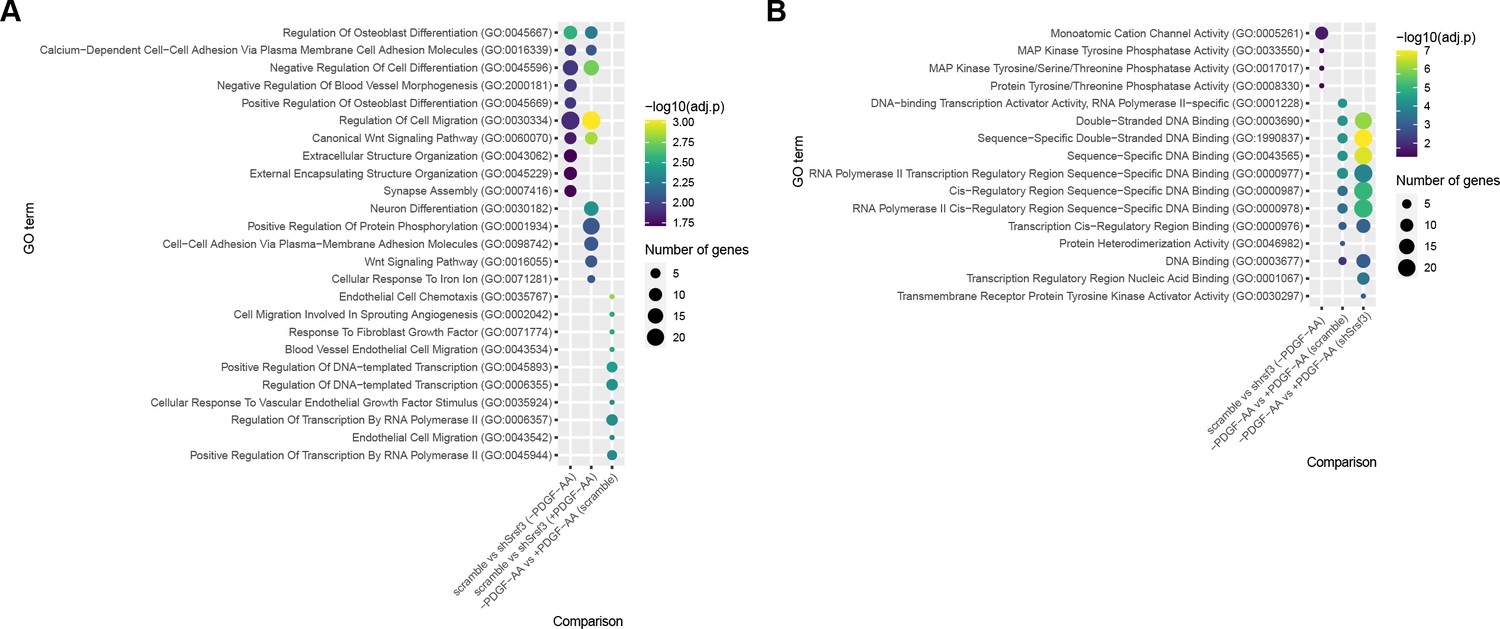
Gene ontology (GO) analysis of differentially expressed genes across treatment comparisons.
(A, B) Bubble plots depicting up to 10 of the most significant GO terms for biological process (A) and molecular function (B) for Srsf3-dependent and PDGF-AA-dependent differentially expressed genes. Colors correspond to -log10 (adjusted p-value); sizes correspond to the number of genes.
Figure 2 with 2 supplements

PDGFRα signaling for 1 hr has a more pronounced effect on alternative RNA splicing.
(A) Volcano plots depicting alternatively spliced transcripts in scramble versus shSrsf3 cell lines in the absence (left) or presence (right) of PDGF-AA stimulation. Difference in percent spliced in (ΔPSI) values represent scramble PSI – shSrsf3 PSI. Significant changes in alternative RNA splicing are reported for events with a false discovery rate (FDR) ≤ 0.05 and a difference in percent spliced in (|ΔPSI|) ≥ 0.05. (B) Venn diagram of significant transcripts from (A), filtered to include events detected in at least 10 reads in either condition. (C) Volcano plots depicting alternatively spliced transcripts in the absence versus presence of PDGF-AA ligand in scramble (left) or shSrsf3 (right) cell lines. Difference in percent spliced in (ΔPSI) values represent -PDGF-AA PSI –+PDGF-AA PSI. (D) Venn diagram of significant transcripts from (C), filtered to include events detected in at least 10 reads in either condition. (E) Bar graphs depicting alternative RNA splicing events in scramble versus shSrsf3 cell lines in the absence or presence of PDGF-AA stimulation (left) or in the absence versus presence of PDGF-AA ligand in scramble or shSrsf3 cell lines (right).
-
Figure 2—source data 1
rMATS output for scramble (-PDGF-AA) versus shSrsf3 (-PDGF-AA) RNA-seq analysis.
- https://cdn.elifesciences.org/articles/98531/elife-98531-fig2-data1-v1.xlsx
-
Figure 2—source data 2
rMATS output for scramble (+PDGF-AA) versus shSrsf3 (+PDGF-AA) RNA-seq analysis.
- https://cdn.elifesciences.org/articles/98531/elife-98531-fig2-data2-v1.xlsx
-
Figure 2—source data 3
rMATS output for -PDGF-AA (scramble) versus +PDGF-AA (scramble) RNA-seq analysis.
- https://cdn.elifesciences.org/articles/98531/elife-98531-fig2-data3-v1.xlsx
-
Figure 2—source data 4
rMATS output for -PDGF-AA (shSrsf3) versus +PDGF-AA (shSrsf3) RNA-seq analysis.
- https://cdn.elifesciences.org/articles/98531/elife-98531-fig2-data4-v1.xlsx
Figure 2—figure supplement 1
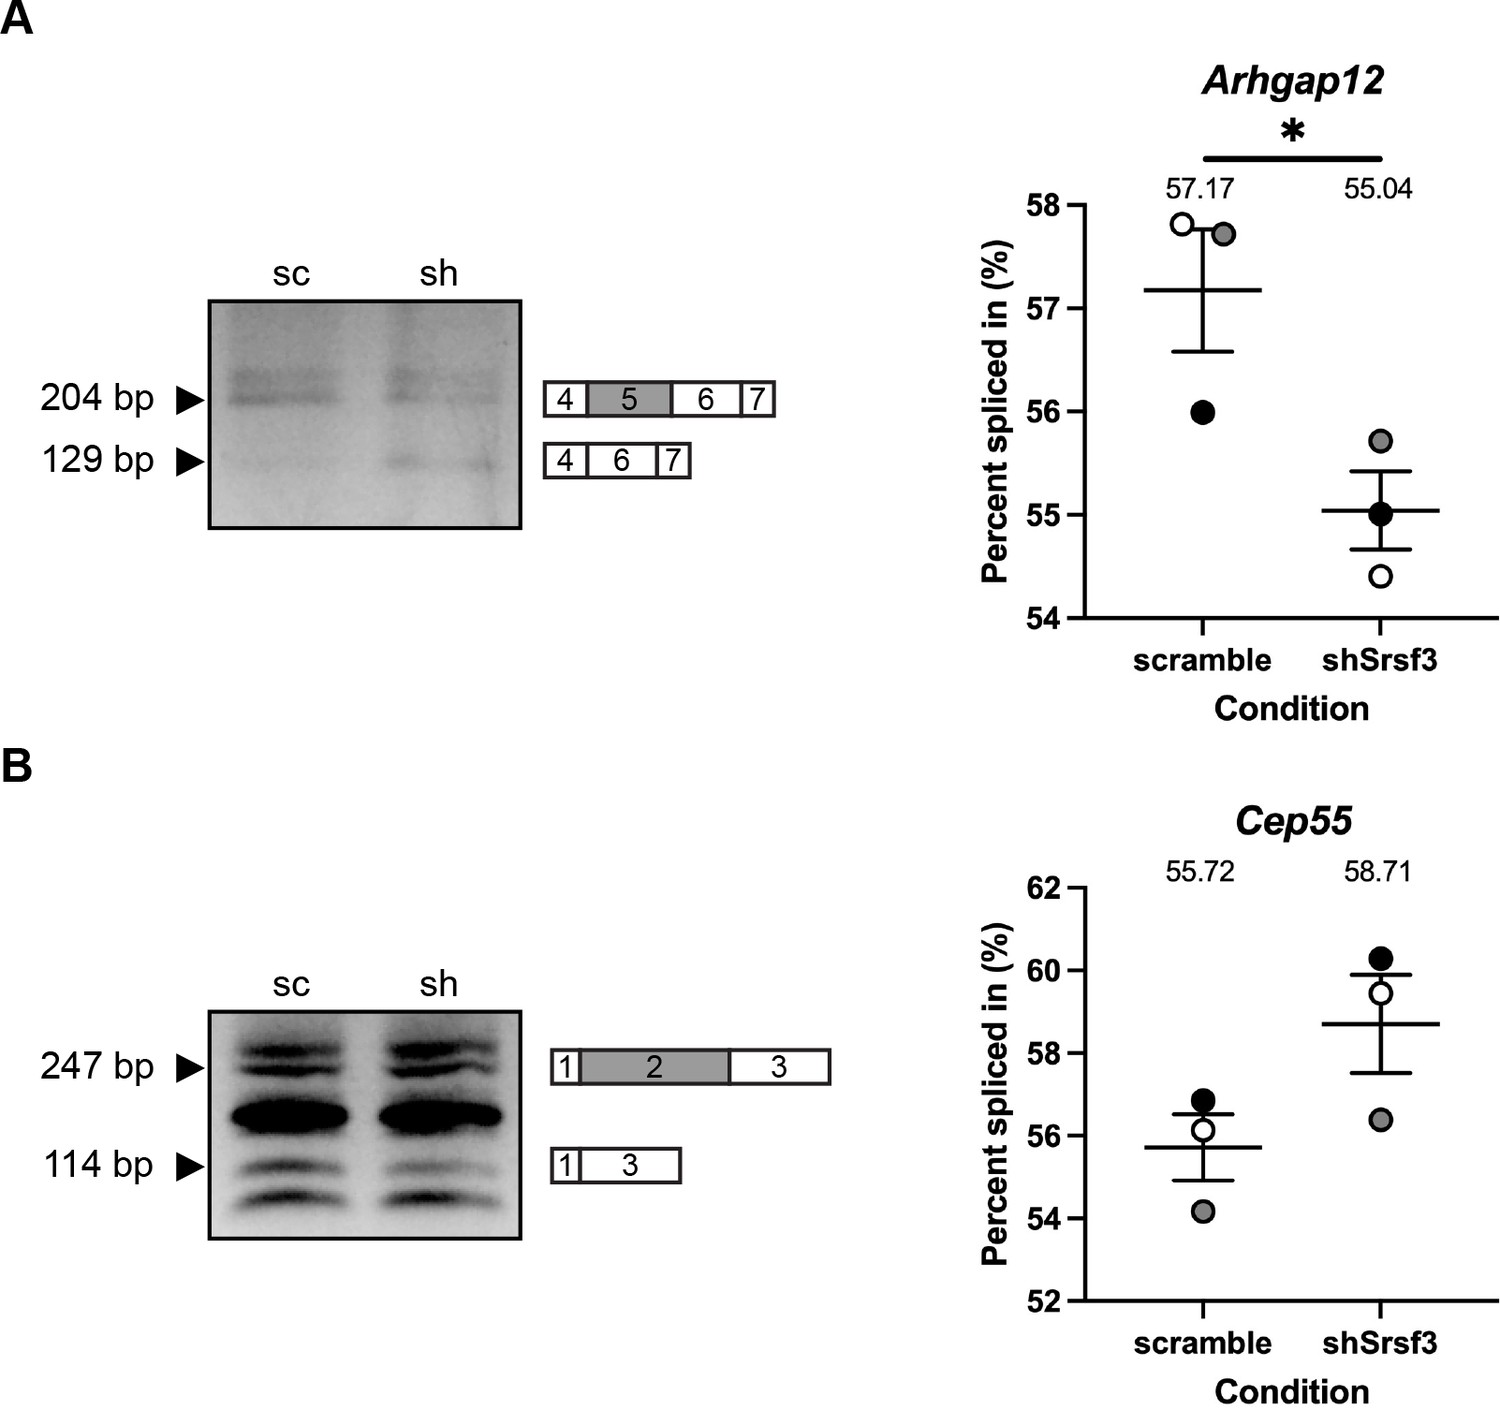
qPCR validation of differential AS between scramble and shSrsf3 samples.
(A, B) Representative qPCR gels (left) with depictions of differentially alternatively spliced exon (gray), and upstream and downstream sequences (white) that were assessed by qPCR in scramble (sc) versus shSrsf3 (sh) samples for Arhgap12 (A) and Cep55 (B). Scatter dot plots (right) depicting the percent spliced in from n = 3 biological replicates as at left. Data are mean ± s.e.m. *p<0.05 (two-tailed, unpaired t-test with Welch’s correction). Shaded circles correspond to independent experiments.
-
Figure 2—figure supplement 1—source data 1
Arhgap12 and Cep55 PCR gels.
- https://cdn.elifesciences.org/articles/98531/elife-98531-fig2-figsupp1-data1-v1.zip
Figure 2—figure supplement 2
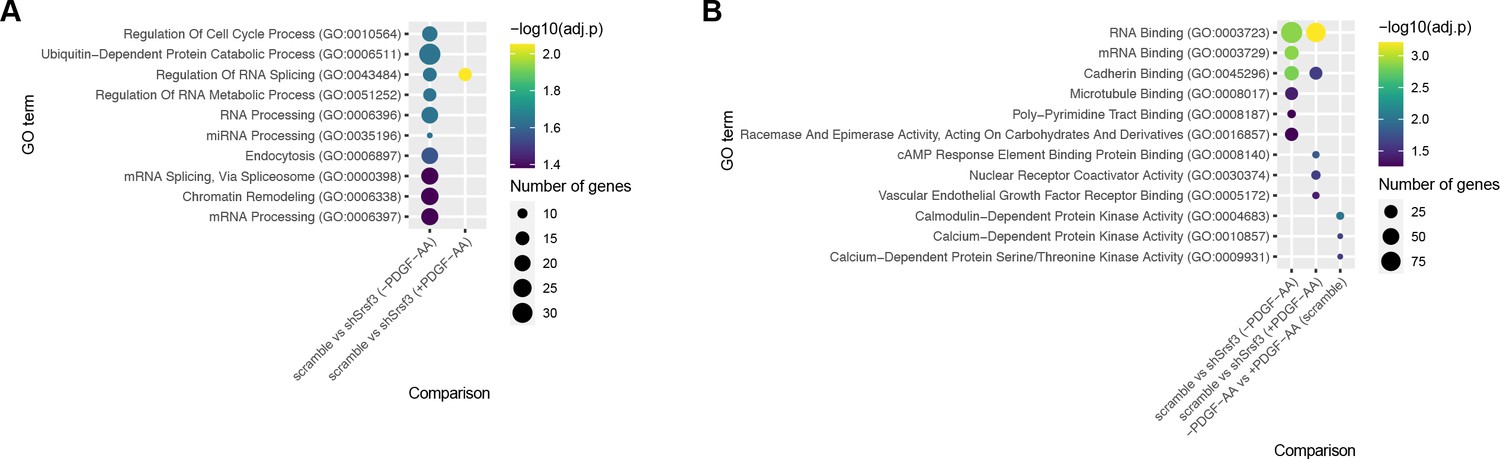
Gene ontology (GO) analysis of alternatively spliced transcripts across treatment comparisons.
(A, B) Bubble plots depicting up to 10 of the most significant GO terms for biological process (A) and molecular function (B) for Srsf3-dependent and PDGF-AA-dependent alternatively spliced transcripts. Colors correspond to -log10 (adjusted p-value); sizes correspond to number of genes.
Figure 3 with 1 supplement

Srsf3 exhibits differential transcript binding upon PDGFRα signaling.
(A) Schematic of enhanced UV-crosslinking and immunoprecipitation (eCLIP) experimental design. Immortalized mouse embryonic palatal mesenchyme (iMEPM) cells were left unstimulated or stimulated with 10 ng/mL PDGF-AA for 1 hr and processed for eCLIP analysis. (B) Immunoprecipitation (IP) of Srsf3 from cells that were UV-crosslinked or not UV-crosslinked with IgG or an anti-Srsf3 antibody followed by western blotting (WB) of input, supernatant (Sup), and IP samples with an anti-Srsf3 antibody. (C) Mapping of eCLIP peaks to various transcript locations in the absence or presence of PDGF-AA stimulation. 5’ UTR, 5’ untranslated region; CDS, coding sequence; 3’ UTR, 3’ untranslated region. (D, E) Mean coverage of eCLIP peaks across various transcript locations (D) and surrounding the 5’ and 3’ splice sites (E) in the absence or presence of PDGF-AA stimulation. (F, G) Top three motifs enriched in eCLIP peaks in the absence (F) or presence (G) of PDGF-AA stimulation with associated p-values (t-test).
-
Figure 3—source data 1
Srsf3 western blots.
- https://cdn.elifesciences.org/articles/98531/elife-98531-fig3-data1-v1.zip
-
Figure 3—source data 2
eCLIP output.
- https://cdn.elifesciences.org/articles/98531/elife-98531-fig3-data2-v1.xlsx
-
Figure 3—source data 3
Raw peak counts of eCLIP peaks across various transcript locations.
- https://cdn.elifesciences.org/articles/98531/elife-98531-fig3-data3-v1.xlsx
Figure 3—figure supplement 1
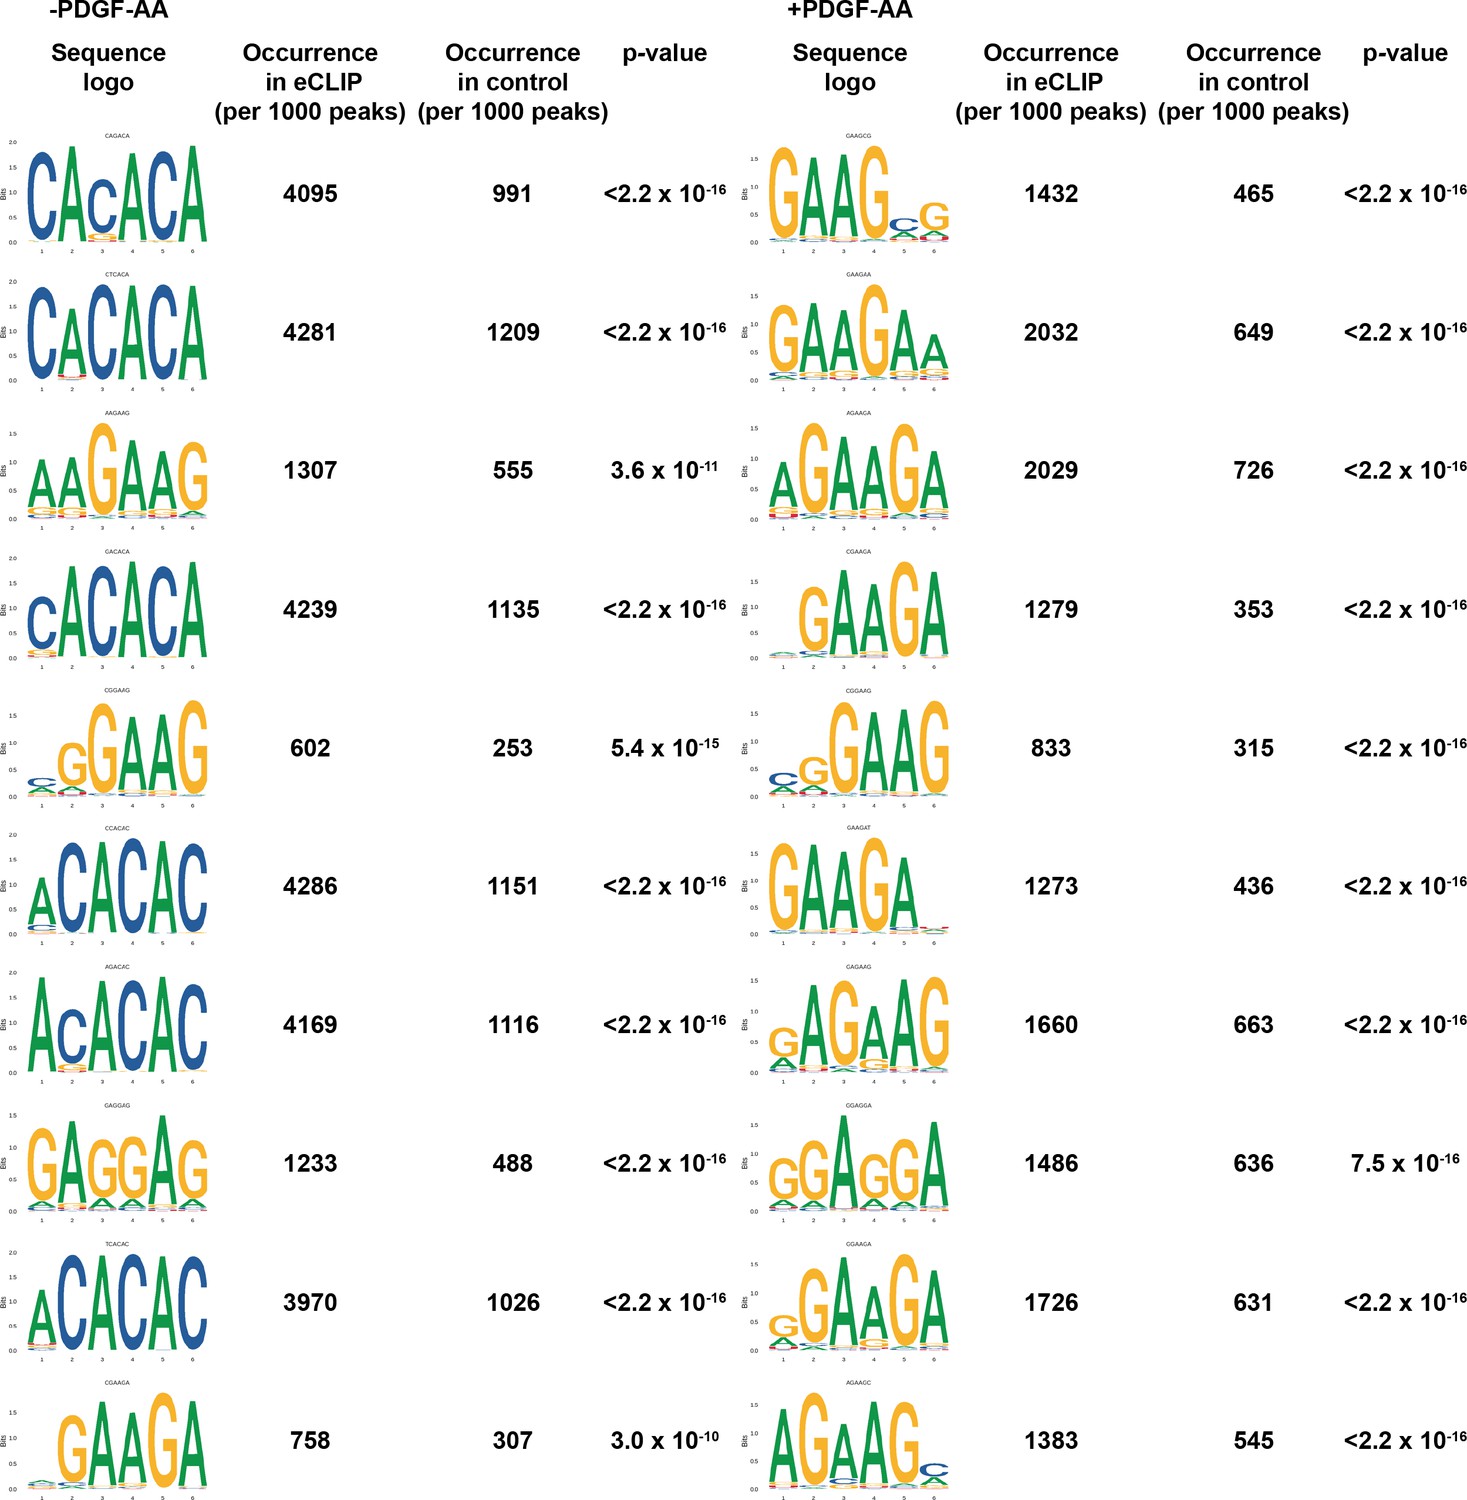
PDGFRα signaling influences Srsf3 binding specificity.
Top 10 motifs enriched in enhanced UV-crosslinking and immunoprecipitation (eCLIP) peaks in the absence (left) or presence (right) of PDGF-AA stimulation with associated p-values (t-test).
Figure 4

Srsf3 and PDGFRα signaling are associated with differential GC content and length of alternatively spliced exons.
(A) Box and whisker plot depicting the percentage of exon GC content in exons that are not differentially alternatively spliced, and exons that are included or skipped when Srsf3 is present from the rMATS analysis. (B) Box and whisker plot depicting the ratio of downstream intron to exon GC content in exons that are not differentially alternatively spliced, and exons that are included or skipped when Srsf3 is present from the rMATS analysis. (C, D) Box and whisker plots depicting the ratio of upstream intron to exon length (C) and downstream intron to exon length (D) in exons that are not differentially alternatively spliced, and exons that are included or skipped when Srsf3 is present from the rMATS analysis. (E) Violin and box and whisker (inset) plots depicting the percentage of exon GC content in exons that are not bound by Srsf3, and exons that are bound in the absence and/or presence of PDGF-AA stimulation from the enhanced UV-crosslinking and immunoprecipitation (eCLIP) analysis. *p<0.05; **p<0.01; ***p<0.001 (Mann–Whitney U-test).
-
Figure 4—source data 1
Matt features.
- https://cdn.elifesciences.org/articles/98531/elife-98531-fig4-data1-v1.xlsx
Figure 5 with 1 supplement

Transcripts bound by Srsf3 that undergo alternative splicing upon PDGFRα signaling encode regulators of PI3K signaling.
(A) Venn diagram of genes with differential expression (DE) or transcripts subject to alternative RNA splicing (AS) across the four treatment comparisons that overlap with transcripts with Srsf3 enhanced UV-crosslinking and immunoprecipitation (eCLIP) peaks in the absence or presence of PDGF-AA stimulation. (B, C) Top 10 (B) and PI3K-related (C) biological process gene ontology (GO) terms for transcripts from the high-confidence, overlapping datasets. p.val, p. (D) Difference in percent spliced in (ΔPSI) values for PI3K/endosome-related transcripts of interest. ΔPSI values represent -PDGF-AA PSI –+PDGF-AA PSI. FDR, false detection rate. (E) Peak visualization for input and eCLIP samples in the absence or presence of PDGF-AA stimulation from Integrative Genomics Viewer (left) with location of motifs from Figure 5—figure supplement 1 indicated below for PI3K/endosome-related transcripts of interest. Predicted alternative splicing outcomes for PI3K/endosome-related transcripts of interest (right). (F) Scatter dot plot depicting the percent spliced in as assessed by qPCR analysis of Wdr81 exon 9 in the scramble cell line following 1 hr of PDGF-AA stimulation quantified from n = 3 biological replicates. Data are mean ± s.e.m. Shaded circles correspond to independent experiments. (G) Western blot (WB) analysis of whole-cell lysates (WCL) from the scramble cell line following 24 hr of PDGF-AA stimulation with anti-Wdr81 and anti-Gapdh antibodies. Bar graph depicting relative ratios of larger/smaller Wdr81 isoforms quantified from n = 3 biological replicates as above. Data are mean ± s.e.m. p=0.052 (two-tailed, ratio paired t-test).
-
Figure 5—source data 1
List of transcripts and genes from Venn diagram in Figure 5A.
- https://cdn.elifesciences.org/articles/98531/elife-98531-fig5-data1-v1.xlsx
-
Figure 5—source data 2
High-confidence, overlapping dataset output correlating eCLIP with scramble (-PDGF-AA) versus shSrsf3 (-PDGF-AA) rMATS RNA-seq analysis.
- https://cdn.elifesciences.org/articles/98531/elife-98531-fig5-data2-v1.xlsx
-
Figure 5—source data 3
High-confidence, overlapping dataset output correlating eCLIP with scramble (+PDGF-AA) versus shSrsf3 (+PDGF-AA) rMATS RNA-seq analysis.
- https://cdn.elifesciences.org/articles/98531/elife-98531-fig5-data3-v1.xlsx
-
Figure 5—source data 4
High-confidence, overlapping dataset output correlating eCLIP with -PDGF-AA (scramble) versus +PDGF-AA (scramble) rMATS RNA-seq analysis.
- https://cdn.elifesciences.org/articles/98531/elife-98531-fig5-data4-v1.xlsx
-
Figure 5—source data 5
High-confidence, overlapping dataset output correlating eCLIP with -PDGF-AA (shSrsf3) versus +PDGF-AA (shSrsf3) rMATS RNA-seq analysis.
- https://cdn.elifesciences.org/articles/98531/elife-98531-fig5-data5-v1.xlsx
-
Figure 5—source data 6
Wdr81 western blots.
- https://cdn.elifesciences.org/articles/98531/elife-98531-fig5-data6-v1.zip
-
Figure 5—source data 7
Gapdh western blots.
- https://cdn.elifesciences.org/articles/98531/elife-98531-fig5-data7-v1.zip
-
Figure 5—source data 8
Relative ratios of larger/smaller Wdr81 isoforms.
- https://cdn.elifesciences.org/articles/98531/elife-98531-fig5-data8-v1.xlsx
Figure 5—figure supplement 1

Srsf3 exhibits differential transcript binding upon PDGFRα signaling in the subset of transcripts from the high-confidence, overlapping datasets.
(A, B) Mean coverage of enhanced UV-crosslinking and immunoprecipitation (eCLIP) peaks within the high-confidence, overlapping datasets across various transcript locations (A) and surrounding the 5’ and 3’ splice sites (B) in the absence or presence of PDGF-AA stimulation. (C, D) Top three motifs enriched in eCLIP peaks within the high-confidence, overlapping datasets in the absence (C) or presence (D) of PDGF-AA stimulation.
Figure 6

Srsf3 regulates early endosome size and phosphorylation of Akt downstream of PDGFRα signaling.
(A, B) Scatter dot plots depicting average size of Rab5 puncta per cell (A) and Pearson’s correlation coefficient of signals from anti-Rab5 and anti-PDGFRα antibodies (B) in scramble and shSrsf3 cell lines in the absence or presence (15–60 min) of PDGF-AA stimulation. Data are mean ± s.e.m. *p<0.05 (two-way ANOVA followed by uncorrected Fisher’s LSD test). Shaded shapes correspond to independent experiments. Summary statistics from biological replicates consisting of independent experiments (large shapes) are superimposed on top of data from all cells; n = 20 technical replicates across each of three biological replicates. (C–H”’) PDGFRα antibody signal (white or magenta) and Rab5 antibody signal (white or green) as assessed by immunofluorescence analysis of scramble and shSrsf3 cells in the absence or presence (15–60 min) of PDGF-AA stimulation. Nuclei were stained with DAPI (blue). White arrows denote regions of colocalization, which are expanded in (C’’’–H’’’). Scale bars: 20 μm (C–H’’), 3 μm (C’’’–H’’’). (I) Western blot (WB) analysis of whole-cell lysates (WCL) from scramble (left) and shSrsf3 (right) cell lines following a time course of PDGF-AA stimulation from 15 min to 4 hr, with anti-phospho-(p)-Akt and anti-Akt antibodies. Line graph depicting quantification of band intensities from n = 4 biological replicates as above. Data are mean ± s.e.m. *p<0.05; **p<0.01 (two-tailed, ratio paired t-test within each cell line and a two-tailed, unpaired t-test with Welch’s correction between each cell line). (J) Model of experimental results in which PI3K/Akt-mediated PDGFRα signaling results in the nuclear translocation of Srsf3 and the subsequent AS of transcripts to decrease levels of proteins that promote PDGFRα trafficking out of early endosomes.
-
Figure 6—source data 1
Phospho-Akt western blots.
- https://cdn.elifesciences.org/articles/98531/elife-98531-fig6-data1-v1.zip
-
Figure 6—source data 2
Akt western blots.
- https://cdn.elifesciences.org/articles/98531/elife-98531-fig6-data2-v1.zip
-
Figure 6—source data 3
Relative induction values of phospho-Akt.
- https://cdn.elifesciences.org/articles/98531/elife-98531-fig6-data3-v1.xlsx
Tables
Appendix 1—key resources table
| Reagent type (species) or resource | Designation | Source or reference | Identifiers | Additional information |
|---|---|---|---|---|
| Cell line (Mus musculus, male) | iMEPM | Fantauzzo and Soriano, 2017 | ||
| Cell line (M. musculus) | Scramble iMEPM | This paper | Cell line maintained in K. Fantauzzo lab | |
| Cell line (M. musculus) | Srsf3 shRNA iMEPM | This paper | Cell line maintained in K. Fantauzzo lab | |
| Antibody | Srsf3 (rabbit polyclonal) | Abcam | Abcam:ab73891 | IP (10 μg/sample), WB (1:1000) |
| Antibody | Gapdh (mouse monoclonal) | Proteintech Group, Inc | Proteintech:60004-1-Ig | WB (1:50,000) |
| Antibody | Wdr81 (rabbit polyclonal) | Proteintech Group, Inc | Proteintech:24874-1-AP | WB (1:1000) |
| Antibody | Phospho-Akt (rabbit polyclonal) | Cell Signaling Technology | Cell Signaling Technology:9271S | WB (1:1000) |
| Antibody | Akt (rabbit polyclonal) | Cell Signaling Technology | Cell Signaling Technology:9272S | WB (1:1000) |
| Antibody | Peroxidase AffiniPure Goat Anti-Mouse IgG (H+L) (goat polyclonal) | Jackson ImmunoResearch Inc | Jackson ImmunoResearch:115-035-003 | WB (1:20,000) |
| Antibody | Peroxidase AffiniPure Goat Anti-Rabbit IgG (H+L) (goat polyclonal) | Jackson ImmunoResearch Inc | Jackson ImmunoResearch:111-035-003 | WB (1:20,000) |
| Antibody | Rab5 (rabbit monoclonal) | Cell Signaling Technology | Cell Signaling Technology:3547S | IF (1:200) |
| Antibody | PDGFRα (mouse polyclonal) | R&D Systems | R&D Systems:AF1062 | IF (1:20) |
| Antibody | Donkey anti-Rabbit IgG (H+L) Highly Cross-Absorbed Secondary Antibody, Alexa Fluor 488 (donkey polyclonal) | Invitrogen | Invitrogen:A21206 | IF (1:1000) |
| Antibody | Donkey anti-Mouse IgG (H+L) Highly Cross-Absorbed Secondary Antibody, Alexa Fluor 546 (donkey polyclonal) | Invitrogen | Invitrogen:A10036 | IF (1:1000) |
| Recombinant DNA reagent | pLV[shRNA]-EGFP:T2A:Puro-U6>Scramble_shRNA | VectorBuilder | Vector Builder:VB010000-0009mxc | CCTAAGGTTAAGTCGCCCTCGCTCGAGCGAGGGCGACTTAACCTTAGG |
| Recombinant DNA reagent | pLV[shRNA]-EGFP:T2A:Puro-U6>mSrsf3[shRNA#1] | VectorBuilder | Vector Builder:VB90060-7699yyh | GAATGATAAAGCGGTGTTTACTCGAGTAAACACCGCTTTATCATTCC |
| Sequence-based reagent | Random primers | Invitrogen | Invitrogen:48190011 | |
| Sequence-based reagent | oligo (dT)12-18 primer | Invitrogen | Invitrogen:18418012 | |
| Sequence-based reagent | Arhgap12_F | This paper | PCR primer | GGAGACATAGCACCATTGTG |
| Sequence-based reagent | Arhgap12_R | This paper | PCR primer | GCACTGCCCAAGAAGACAAC |
| Sequence-based reagent | Cep55_F | This paper | PCR primer | CCTTTCGGCTCCTTTGAACT |
| Sequence-based reagent | Cep55_R | This paper | PCR primer | GCAGTGTCTGACTTGGAGCT |
| Sequence-based reagent | Wdr81_F | This paper | PCR primer | GCTTTGTGGACTGCAGGAAG |
| Sequence-based reagent | Wdr81_R | This paper | PCR primer | GCAGGGAACAGACACCAAT |
| Sequence-based reagent | RiL19 | This paper | Barcoded RNA adapters | /5phos/rArGrArUrCrGrGrArArGrArGrCrGrUrCrGrUrG/3SpC3/ |
| Sequence-based reagent | Rand103Tr3 | This paper | Barcoded DNA adapters | /5Phos/NNNNNNNNNNAGATCGGAAGAGCACACGTCTG/3SpC3/ |
| Peptide, recombinant protein | PDGF-AA | R&D Systems | R&D:1055AA050 | 10 ng/mL |
| Peptide, recombinant protein | Protein A Dynabeads | Invitrogen | Invitrogen:10002D | IP (125 μL/sample) |
| Peptide, recombinant protein | Dynabeads M-280 sheep anti-rabbit IgG | Invitrogen | Invitrogen:11203D | IP (125 μL/sample) |
| Peptide, recombinant protein | SuperScript II RT | Invitrogen | Invitrogen:18064014 | |
| Peptide, recombinant protein | RNase I | Invitrogen | Invitrogen:AM2294 | |
| Peptide, recombinant protein | FastAP | Thermo Fisher Scientific | Thermo Fisher Scientific:EF0654 | |
| Peptide, recombinant protein | T4 PNK | New England Biolabs | New England Biolabs:M0201S | |
| Peptide, recombinant protein | T4 RNA ligase | New England Biolabs | New England Biolabs:M0437M | |
| Peptide, recombinant protein | Proteinase K | New England Biolabs | New England Biolabs:P8107S | |
| Peptide, recombinant protein | SuperScript IV | Invitrogen | Invitrogen:18090010 | |
| Chemical compound, drug | DAPI | Sigma-Aldrich | Sigma-Aldrich:D9542-10MG | 2 μg/mL |
| Commercial assay or kit | MycoAlert Mycoplasma Detection Kit | Lonza Group Ltd | Lonza:LT07-218 | |
| Commercial assay or kit | RNeasy Mini Kit | QIAGEN, Inc | QIAGEN:74104 | |
| Commercial assay or kit | Universal Plus mRNA-Seq kit with NuQuant | Tecan Group Ltd | Tecan Group:0361-A01 | |
| Commercial assay or kit | AMPure XP Reagent | Beckman Coulter | Beckman Coulter:A63880 | |
| Commercial assay or kit | ExoSAP-IT | Applied Biosystems | Applied Biosystems:78200.200.UL | |
| Commercial assay or kit | Dynabeads MyOne Silane | Invitrogen | Invitrogen:37002D | |
| Commercial assay or kit | Q5 PCR mix | New England Biolabs | New England Biolabs:M0492S | |
| Software, algorithm | ImageJ | NIH | RRID:SCR_003070 | |
| Software, algorithm | Prism 10 | GraphPad Software Inc. | RRID:SCR_000306 | |
| Software, algorithm | bcl2fastq | Illumina | RRID:SCR_015058 | |
| Software, algorithm | BBDuk | https://sourceforge.net/projects/bbmap/ | ||
| Software, algorithm | Salmon | Patro et al., 2017 | ||
| Software, algorithm | GENCODE | Frankish et al., 2019 | ||
| Software, algorithm | tximport | Soneson et al., 2015 | ||
| Software, algorithm | DESeq2 | Love et al., 2014 | ||
| Software, algorithm | STAR | Dobin et al., 2013 | ||
| Software, algorithm | rMATS | Shen et al., 2014 | ||
| Software, algorithm | Enrichr | Chen et al., 2013; Kuleshov et al., 2016 | ||
| Software, algorithm | cutadapt | Martin, 2011 | ||
| Software, algorithm | FASTX-Toolkit | http://hannonlab.cshl.edu/fastx_toolkit | ||
| Software, algorithm | seqtk | https://github.com/lh3/seqtk; Li, 2018 | ||
| Software, algorithm | msRepDB | Liao et al., 2022 | ||
| Software, algorithm | omniCLIP | Drewe-Boss et al., 2018 | ||
| Software, algorithm | RCAS | Uyar et al., 2017 | ||
| Software, algorithm | deepTools | Ramírez et al., 2016 | ||
| Software, algorithm | Integrative Genomics Viewer | Robinson et al., 2011 | ||
| Software, algorithm | Matt | Gohr and Irimia, 2019 | ||
| Software, algorithm | rMAPS | Park et al., 2016 | ||
| Software, algorithm | valr | Riemondy et al., 2017 | ||
| Software, algorithm | ZEN Blue | Carl Zeiss Microscopy LLC | RRID:SCR_013672 | |
| Other | Normal donkey serum | Jackson ImmunoResearch Inc | Jackson ImmunoResearch:017-000-121 | |
| Other | VECTASHIELD HardSet Antifade Mounting Medium | Vector Laboratories, Inc | Vector Laboratories:H-1400–10 |
Additional files
Download links
A two-part list of links to download the article, or parts of the article, in various formats.
Downloads (link to download the article as PDF)
Open citations (links to open the citations from this article in various online reference manager services)
Cite this article (links to download the citations from this article in formats compatible with various reference manager tools)
PDGFRα signaling regulates Srsf3 transcript binding to affect PI3K signaling and endosomal trafficking
eLife 13:RP98531.
https://doi.org/10.7554/eLife.98531.3


