Engineering PEG10-assembled endogenous virus-like particles with genetically encoded neoantigen peptides for cancer vaccination
- The United Innovation of Mengchao Hepatobiliary Technology Key Laboratory of Fujian Province, Mengchao Hepatobiliary Hospital of Fujian Medical University, China
- The Liver Center of Fujian Province, Fujian Medical University, China
- Mengchao Med-X Center, Fuzhou University, China
- State Key Laboratory of Drug Research & Center of Pharmaceutics, Shanghai Institute of Materia Medica, Chinese Academy of Sciences, China
Figures
Figure 1 with 1 supplement
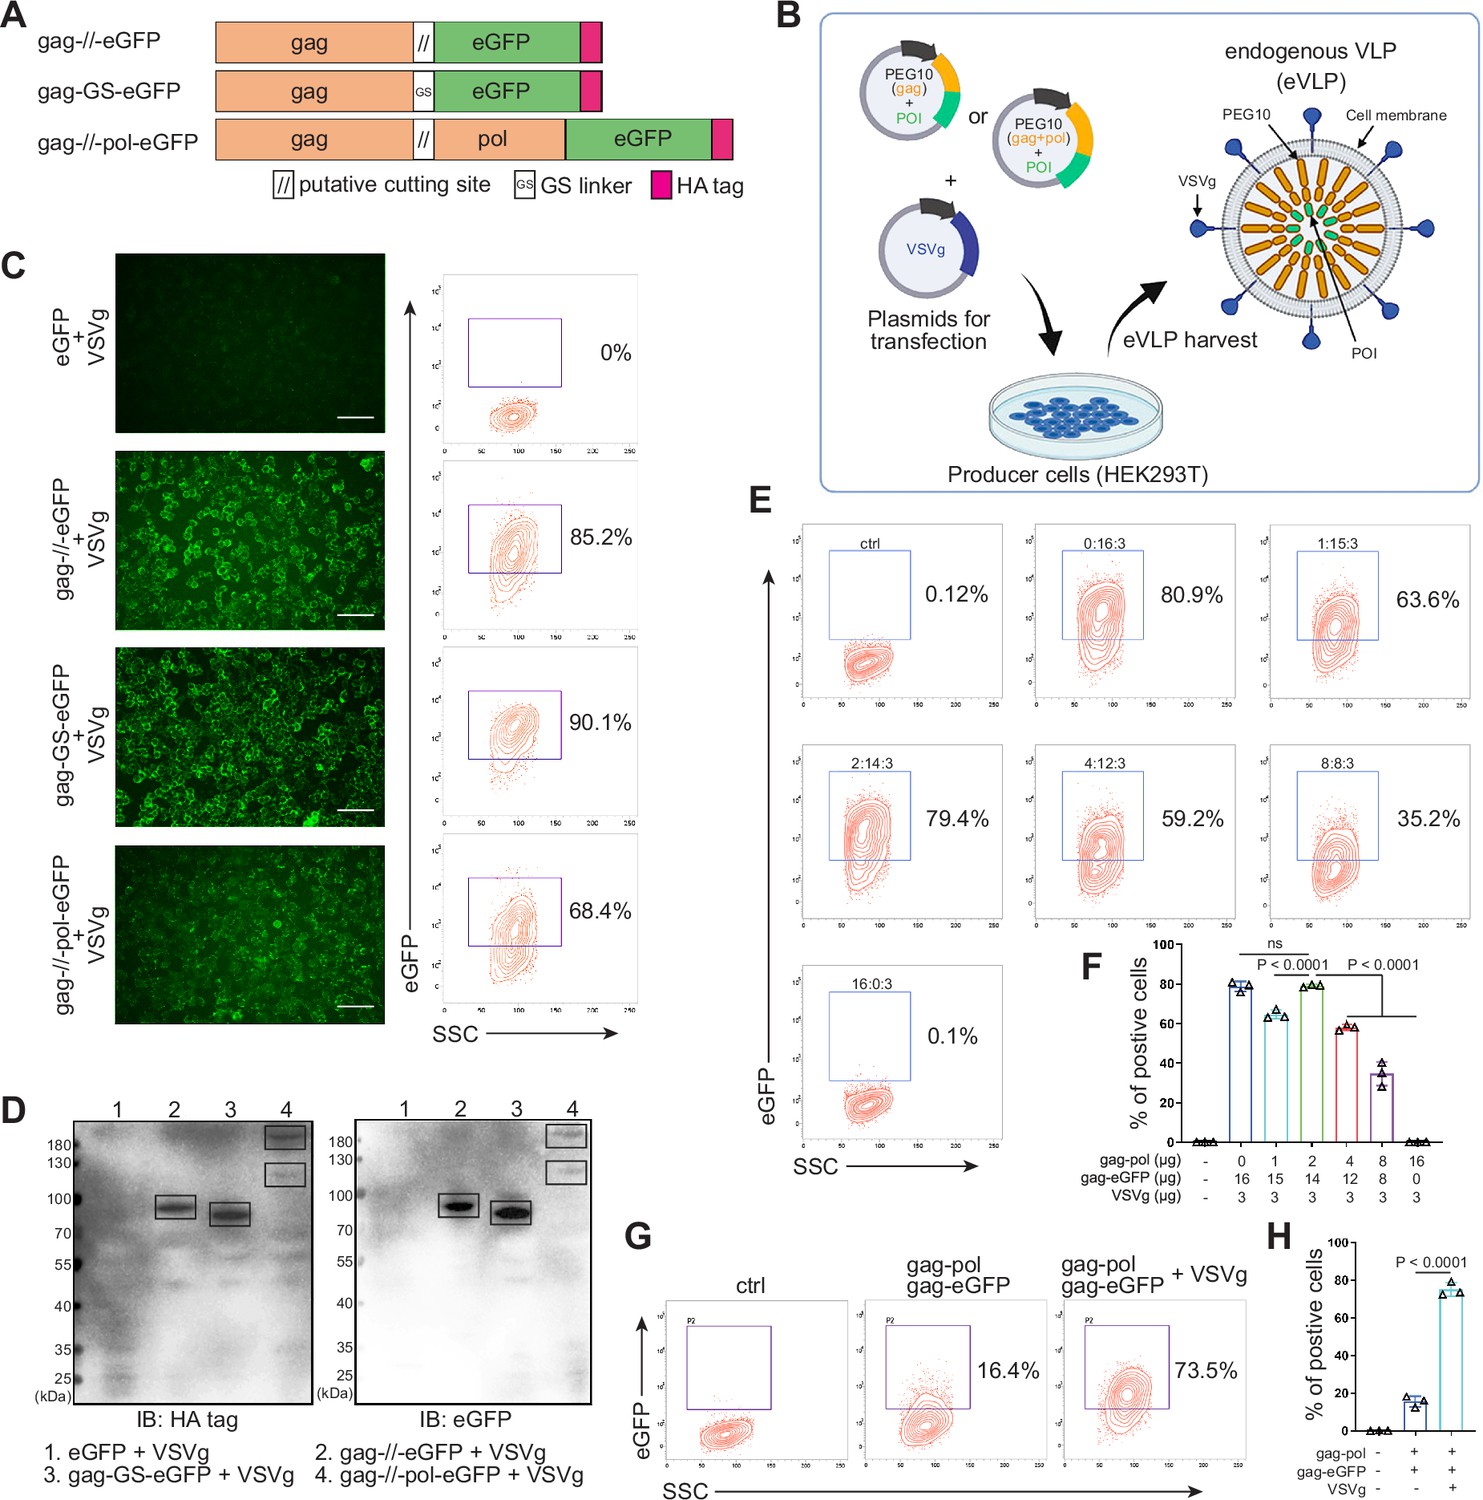
Designing and identifying the endogenous virus-like particle (eVLP) package system.
(A) Schematic representation of PEG10 variants. The putative cutting site from PEG10 and GS linker were used to fuse PEG10 and eGFP together. HA tag was co-expressed in the C-terminal for subsequent identification. (B) The eVLP packaging process was illustrated in the schematic diagram. Plasmids from (A) were co-transfected with VSVg into HEK293T cells. eVLPs were harvested from the cell culture medium by ultracentrifugation. (C) The fluorescent image representing the eVLP transfected HEK293T cells (in blue) after 24 hr, and the positive percentage was analyzed by flow cytometry. Scale bar, 100 μm. (D) The cells from (C) were harvested for HA tag and eGFP detection by western blot. 20 μl from each sample was loaded to the SDS-PAGE. Lane 1: eGFP, Lane 2: gag-//-eGFP, Lane 3: gag-GS-eGFP, Lane 4: gag-//-pol-eGFP (gag domain: ~50 kD; gag-pol domain: ~120 kD; eGFP: 27 kD). (E and F) Comparison of the eVLP transfection efficiency under different packaging strategies by flow cytometry. The plasmid ratio between gag-pol and gag-eGFP was optimized. The total plasmids for transfection in one 10 cm dish were 19 μg. (G and H) Identification of the auxiliary function of VSVg during eVLP transfection. Data are presented as the mean ± SEM.
-
Figure 1—source data 1
Excel file with raw data used to generate Figure 1F and H.
- https://cdn.elifesciences.org/articles/98579/elife-98579-fig1-data1-v2.xlsx
-
Figure 1—source data 2
Uncropped and labeled gels for Figure 1D.
- https://cdn.elifesciences.org/articles/98579/elife-98579-fig1-data2-v2.pdf
-
Figure 1—source data 3
Raw unedited gels for Figure 1D.
- https://cdn.elifesciences.org/articles/98579/elife-98579-fig1-data3-v2.zip
Figure 1—figure supplement 1
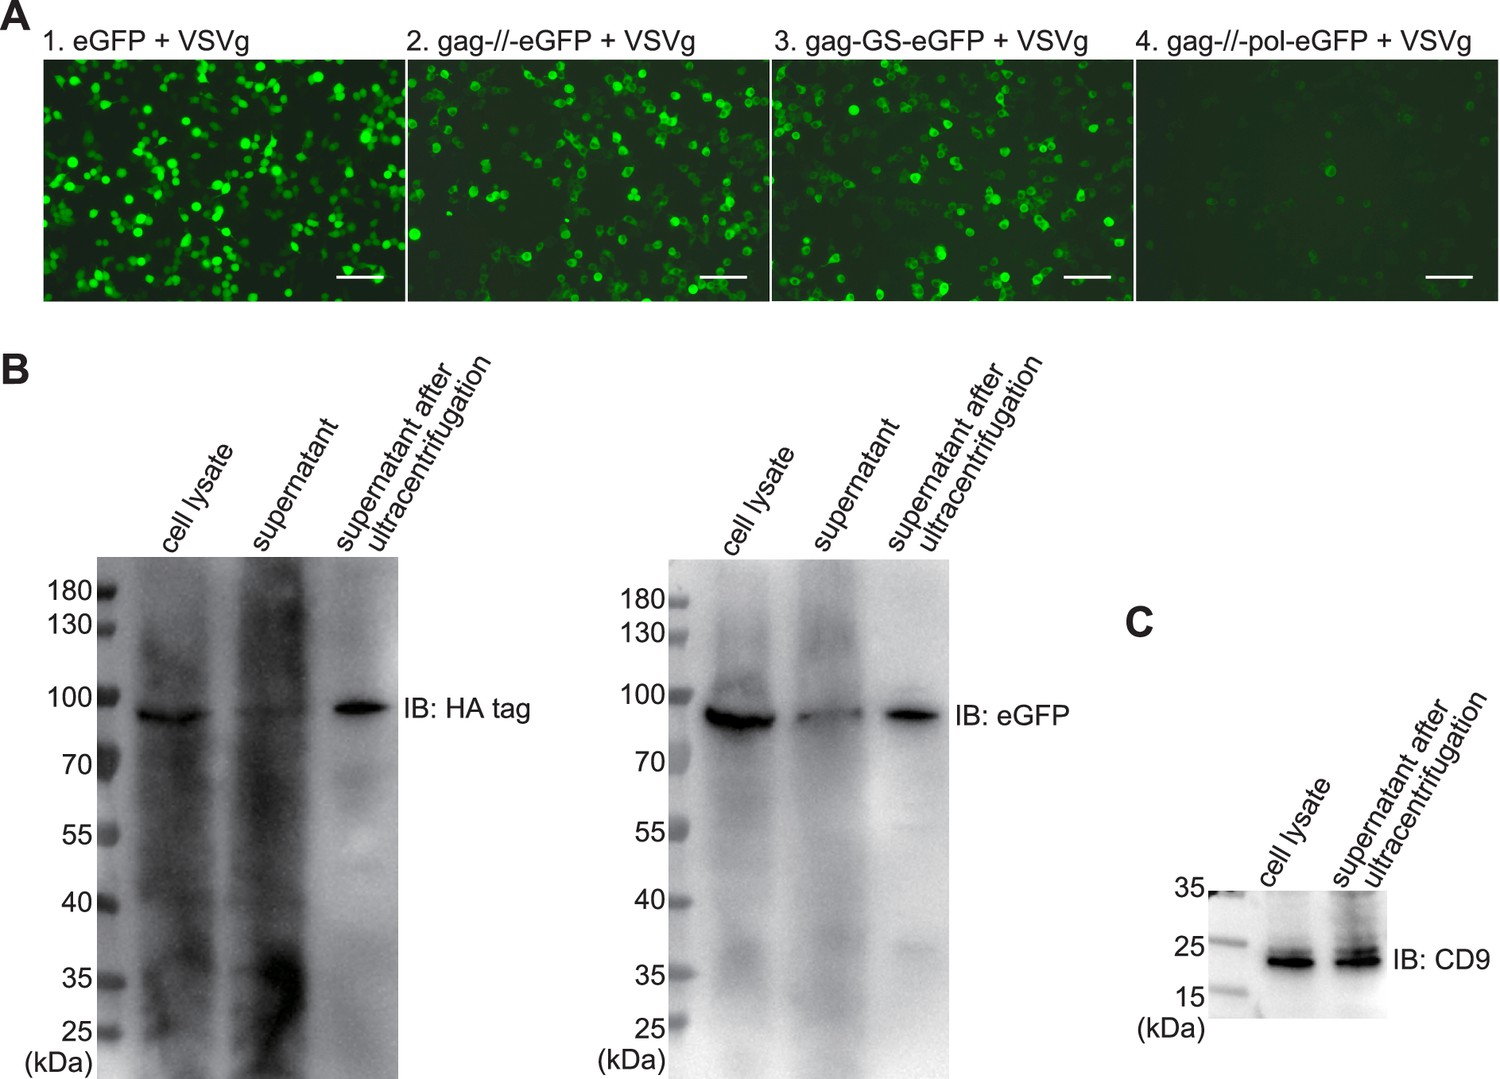
Evaluation of plasmid expression.
(A) The fluorescent images after 24 hr expression by plasmid transfection in HEK293T cells from the Figure 1A. For transfection in one 10 cm dish, (gag plus) eGFP was 16 μg and VSVg was 3 μg. Scale bar, 100 μm. (B) Western blots for gag-//-eGFP expression after 3 days in HEK293T cells from (A). The concentration of eVLP from supernatant after ultracentrifugation was 100-fold higher than that before. (C) Western blot for CD9 (22 kDa).
-
Figure 1—figure supplement 1—source data 1
Uncropped and labeled gels for Figure 1B and C.
- https://cdn.elifesciences.org/articles/98579/elife-98579-fig1-figsupp1-data1-v2.pdf
-
Figure 1—figure supplement 1—source data 2
Raw unedited gels for Figure 1B and C.
- https://cdn.elifesciences.org/articles/98579/elife-98579-fig1-figsupp1-data2-v2.zip
Figure 2 with 2 supplements
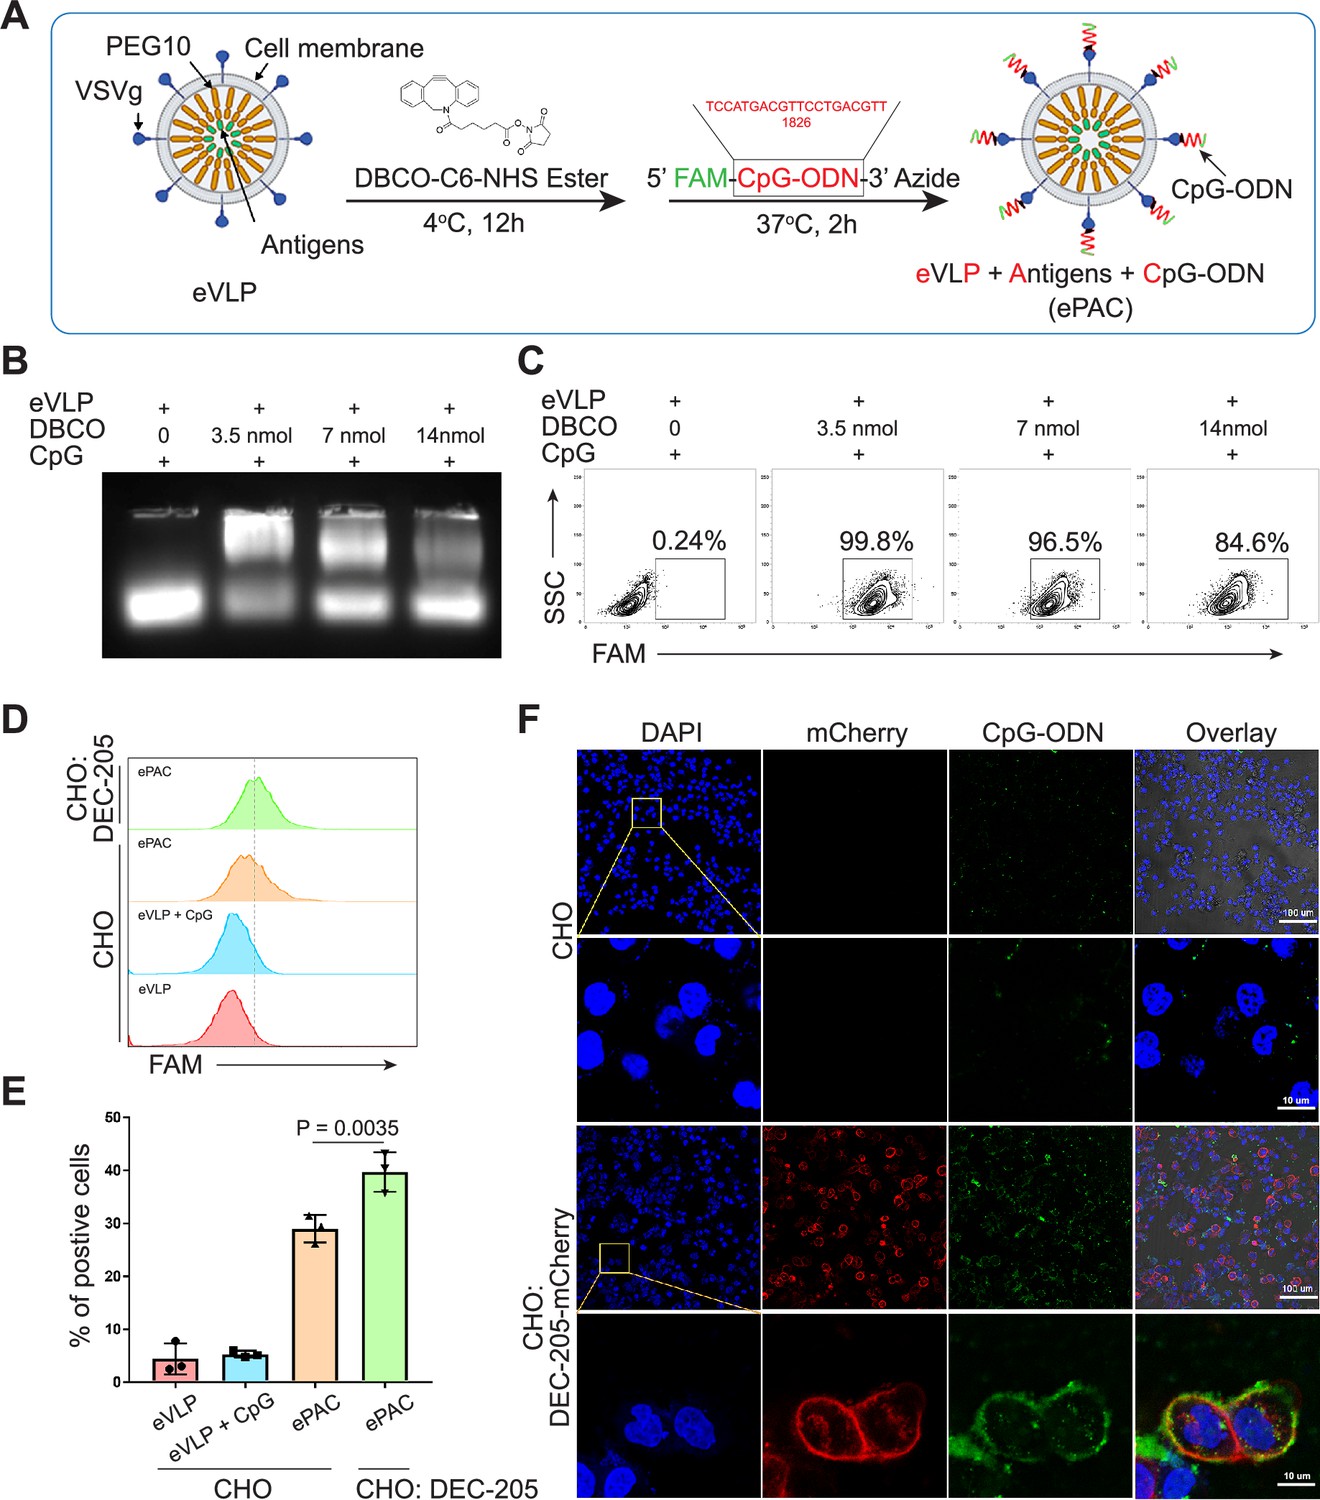
Envelope decoration of neoantigen-loaded endogenous virus-like particle (eVLP).
(A) Schematic of the decoration strategy for eVLP. DBCO-C6-NHS ester was first anchored to eVLP under 4°C for 12 hr. Then, 5’-FAM-CpG-ODN-3’-Azide was added to trigger click reaction for 2 hr at 37°C. The CpG-ODN modified eVLP carrying antigens was named as ePAC. (B) Agarose gel electrophoresis of CpG-ODN modified eVLP with various DBCO-C6-NHS ester concentration. eVLP: 200 μl per reaction, 5’-FAM-CpG-ODN-3’-Azide: 1 nmol per reaction. 20 μl sample was loaded in each lane. (C) The percentage of FAM positive HEK293T cells analyzed by flow cytometry. 50 μl modified eVLP from (B) was used to transfect HEK293T cells in a 24-well plate. (D and E) The bonding affinity between DEC-205 expressed CHO cells and ePAC was analyzed by flow cytometry (n=3 independent replicates; one-way ANOVA). CHO cells were transfected by the plasmid pCDH-DEC-205 to transiently express DEC-205. (F) The confocal microscopy images showing the bonding of DEC-205 and ePAC. CHO cells were transfected by lentivirus to express DEC-205-mCherry. Scale bar, 100 μm. Data are presented as the mean ± SEM. *p<0.05.
-
Figure 2—source data 1
Excel file with raw data used to generate Figure 2E.
- https://cdn.elifesciences.org/articles/98579/elife-98579-fig2-data1-v2.xlsx
-
Figure 2—source data 2
Uncropped and labeled gels for Figure 2B.
- https://cdn.elifesciences.org/articles/98579/elife-98579-fig2-data2-v2.pdf
-
Figure 2—source data 3
Raw unedited gels for Figure 2B.
- https://cdn.elifesciences.org/articles/98579/elife-98579-fig2-data3-v2.tif
Figure 2—figure supplement 1
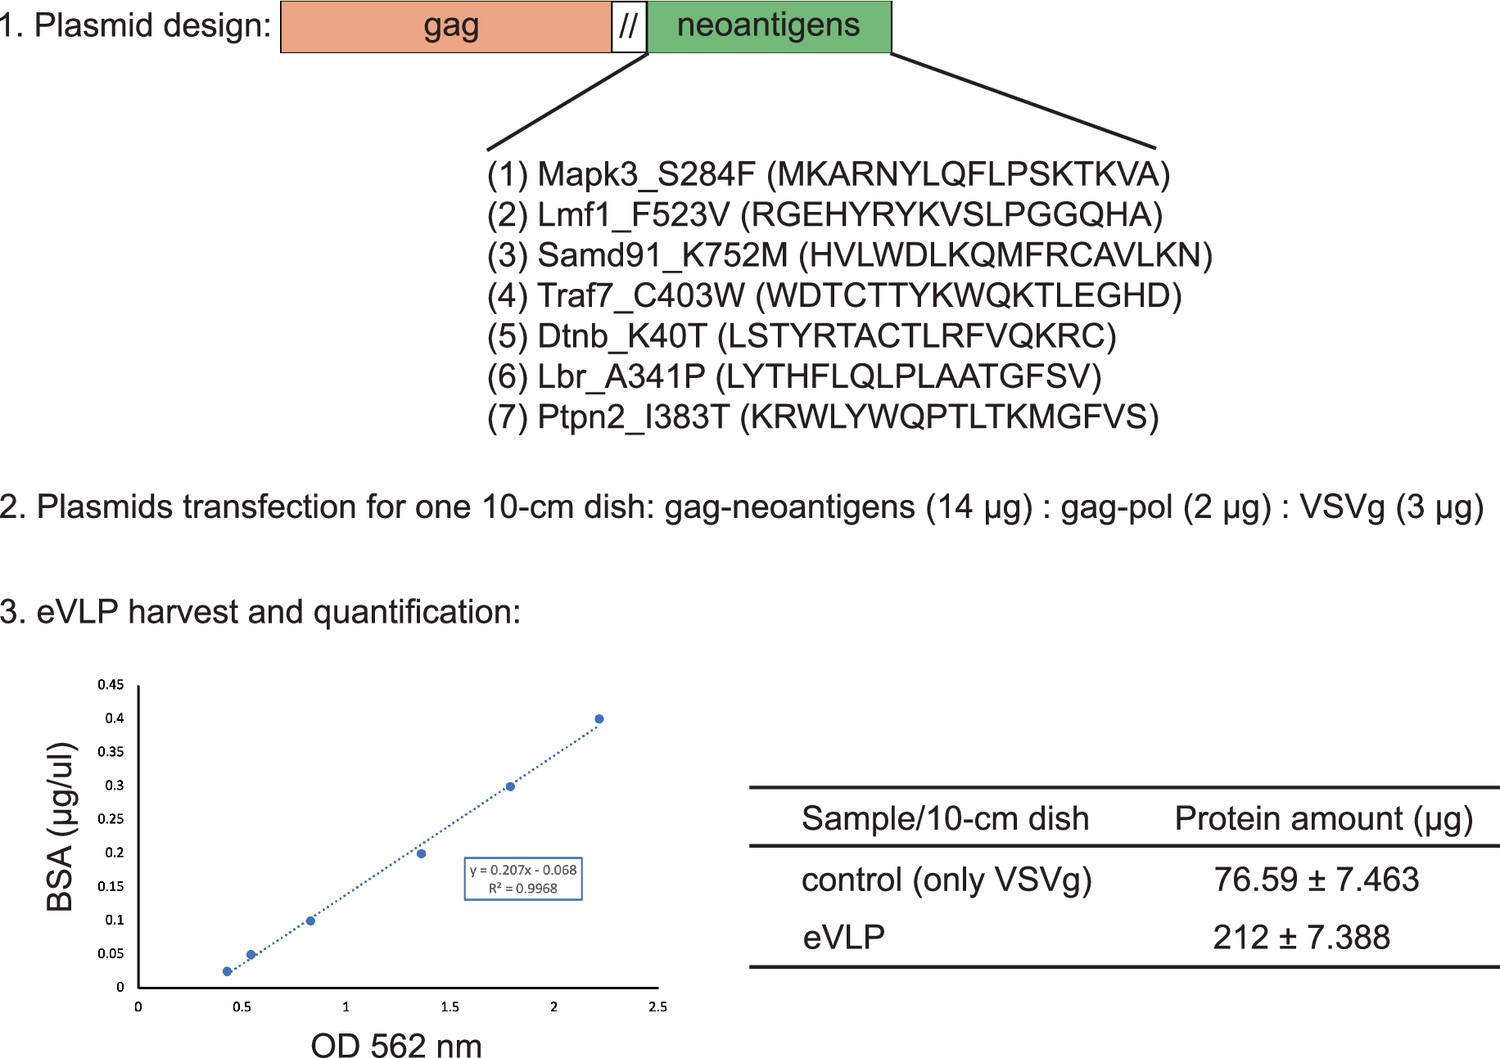
The endogenous virus-like particle (eVLP)-based neoantigen vaccine preparation.
The neoantigens (Mapk3_S284F, Lmf1_F523V, Samd91_K752M, Traf7_C403W, Dtnb_K40T, Lbr_A341P, Ptpn2_I383T from Hepa1-6 cell line) were fused together by GGGS, and then were connected to gag domain C-terminal for eVLP production. Three plasmids including gag-neoantigens, gag-pol, and VSVg were co-transected in HEK293T cells. The supernatant containing eVLP was harvested and concentrated by ultracentrifugation. The total proteins from the concentrated samples were finally determined by BCA.
Figure 2—figure supplement 2
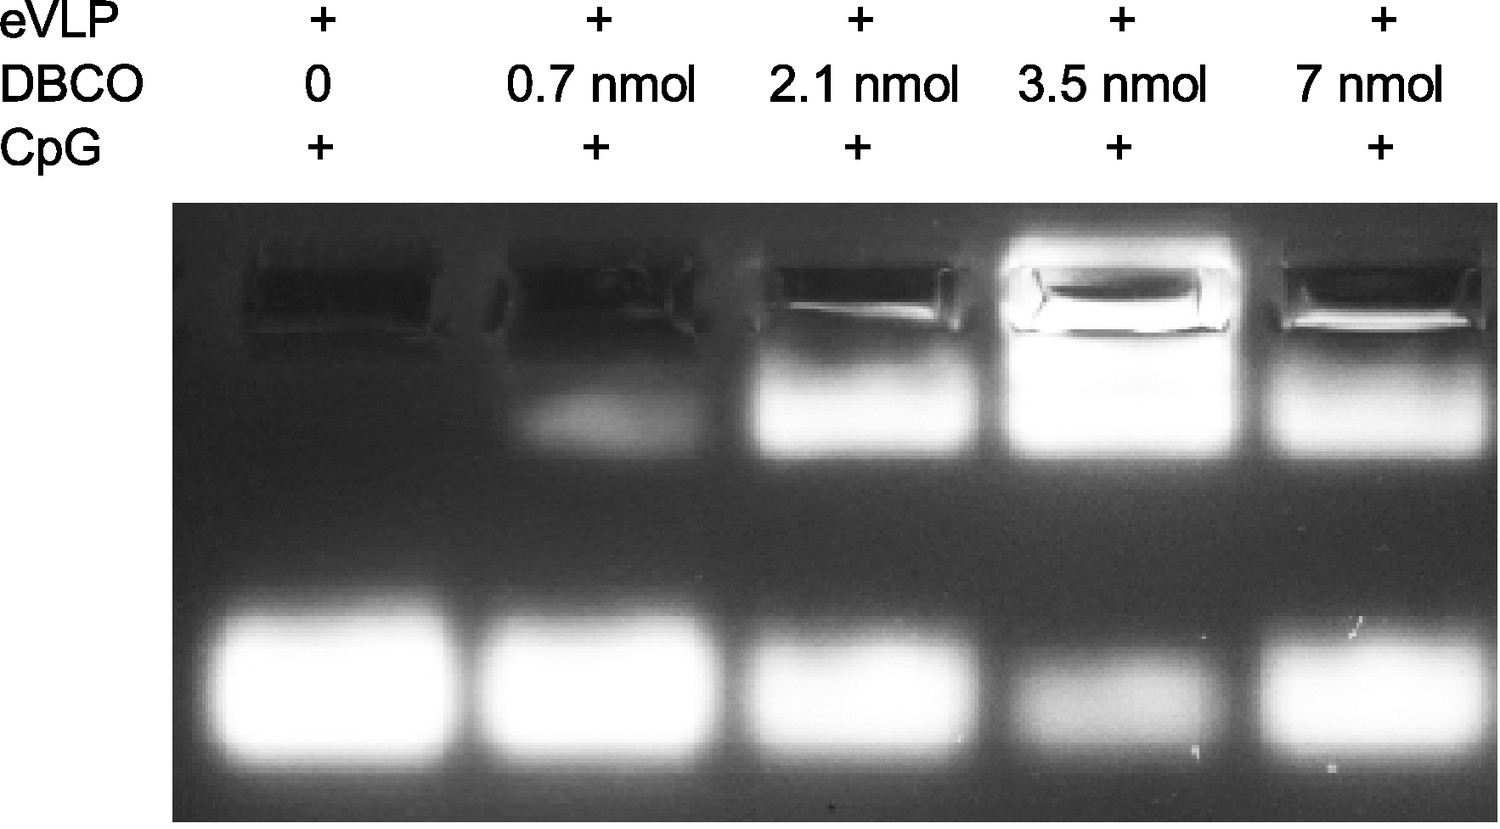
Agarose gel electrophoresis of CpG-ODN modified endogenous virus-like particle (eVLP) with various DBCO-C6-NHS ester concentration.
The concentration of DBCO-C6-NHS ester included 0, 0.7, 2.1, 3.5, and 7 nmol. eVLP: 200 μl per reaction, 5’-FAM-CpG-ODN-3’-Azide: 1 nmol per reaction. 20 μl sample was loaded in each lane.
-
Figure 2—figure supplement 2—source data 1
Uncropped and labeled gels for Figure 2—figure supplement 2.
- https://cdn.elifesciences.org/articles/98579/elife-98579-fig2-figsupp2-data1-v2.pdf
-
Figure 2—figure supplement 2—source data 2
Raw unedited gels for Figure 2—figure supplement 2.
- https://cdn.elifesciences.org/articles/98579/elife-98579-fig2-figsupp2-data2-v2.tif
Figure 3
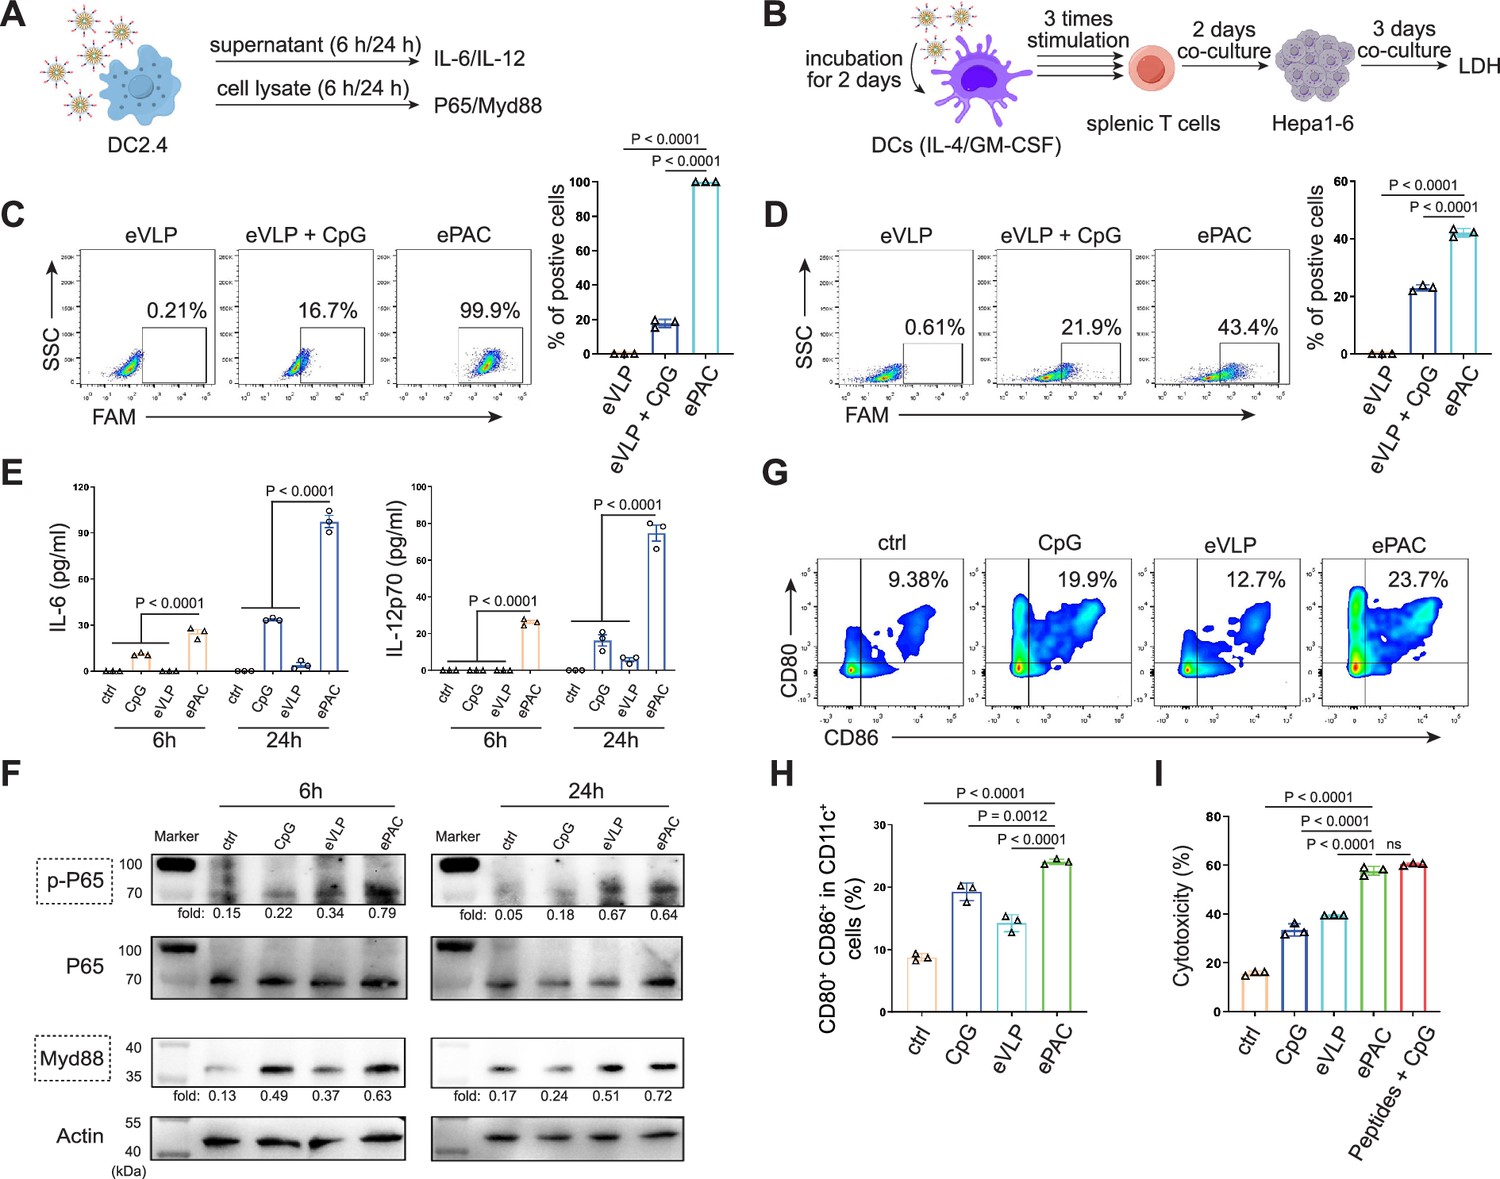
In vitro stimulation of dendritic cells (DCs) by ePAC.
(A) The strategy for DC2.4 cell stimulation and detection. (B) The strategy for mouse-derived bone marrow-derived DC (BMDC)/T cell stimulation and Hepa1-6 co-culture. (C) The percentage and statistical analysis of ePAC transfection efficiency for DC2.4 cells by flow cytometry. (D) The percentage and statistical analysis of ePAC transfection efficiency for BMDCs by flow cytometry. (E) Cytokine secretion by DC2.4 cells at different time point after ePAC stimulation. (F) Western blot analysis of phospho-P65 and Myd88 expression at different time point after ePAC stimulation. P65 and actin were used as loading control to calculate the fold change of p-P65 and Myd88 in different samples, respectively. P65: ~65 kDa, Myd88: ~33 kDa, actin: 43 kDa. (G and H) The percentage and statistical analysis of matured DCs with CD80 and CD86 co-expression detected by flow cytometry (n=3 independent replicates; one-way ANOVA). (I) In vitro cytotoxicity against neoantigen-expressing Hepa1-6 cells determined by LDH assay (n=3 independent replicates; one-way ANOVA). Data are presented as the mean ± SEM. *p<0.05, **p<0.01, ***p<0.001, ****p<0.0001; ns, no significance.
-
Figure 3—source data 1
Excel file with raw data used to generate Figure 3C, D, E, H, and I.
- https://cdn.elifesciences.org/articles/98579/elife-98579-fig3-data1-v2.xlsx
-
Figure 3—source data 2
Uncropped and labeled gels for Figure 3F.
- https://cdn.elifesciences.org/articles/98579/elife-98579-fig3-data2-v2.pdf
-
Figure 3—source data 3
Raw unedited gels for Figure 3F.
- https://cdn.elifesciences.org/articles/98579/elife-98579-fig3-data3-v2.zip
Figure 4
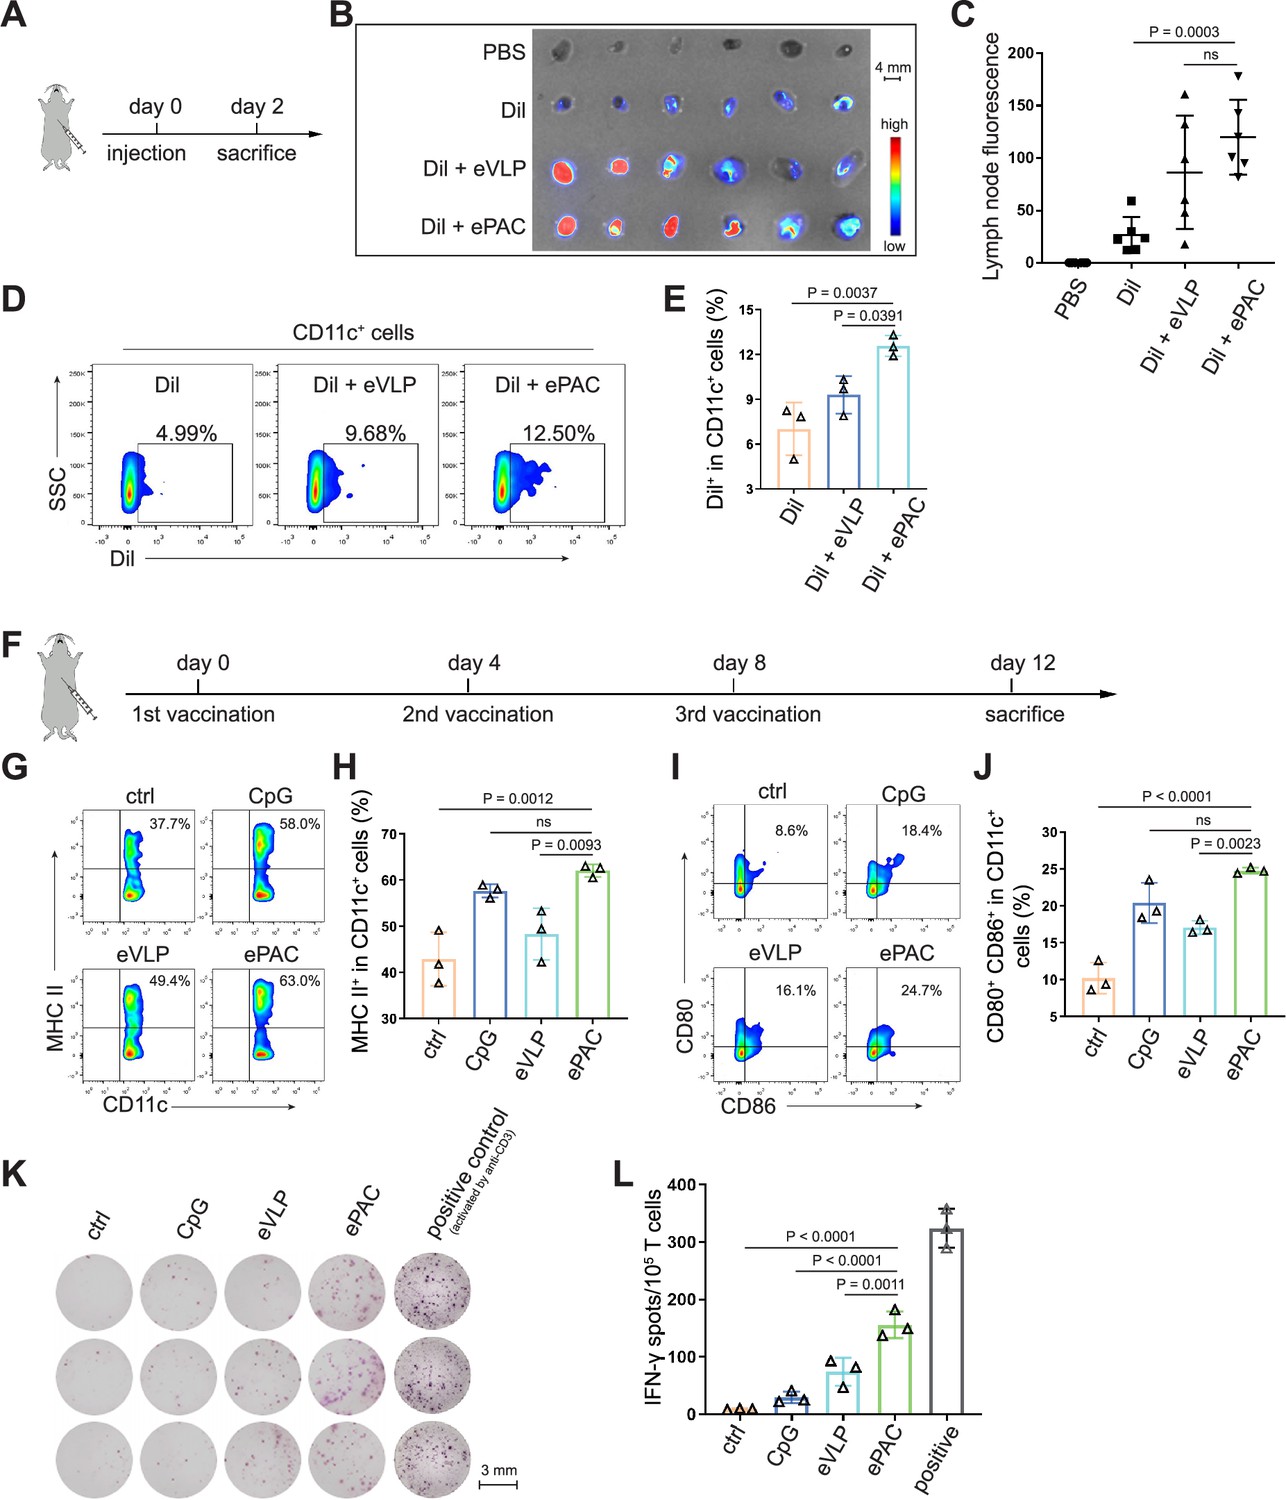
ePAC delivery and immune activation in vivo.
(A and B) Ex vivo fluorescence image of isolated axillary lymph nodes (n=3 mice). Endogenous virus-like particle (eVLP) was incubated with Dil for 6 hr and then injected subcutaneously near the axilla of mice. 24 hr later, the axillary lymph nodes were collected and photographed. Every two lymph nodes came from one mouse. Scale bar, 4 mm. (C) The statistical analysis of lymph node fluorescence intensity from (B) (n=3 mice; one-way ANOVA). (D and E) The percentage and statistical analysis of Dil positive dendritic cell (DC) cells in the lymph nodes detected by flow cytometry (n=3 mice; one-way ANOVA). (F) Schematic diagram of the vaccination protocol for C57BL/6 mice. (G and H) The percentage and statistical analysis of MHC expression level in the lymph nodes detected by flow cytometry (n=3 mice; one-way ANOVA). (I and J) The percentage and statistical analysis of matured DCs with CD80 and CD86 co-expression in the lymph nodes detected by flow cytometry (n=3 mice; one-way ANOVA). (K and L) ELISPOT assay showing neoantigen-specific reactivity of splenic T cells against Hepa1-6-derived neoantigens on day 12 after vaccination (n=3 mice; one-way ANOVA). The mouse anti-CD3 antibody was used to activate splenic T cells in vitro as the positive control for ELISPOT assay. Scale bar, 3 mm. Data are presented as the mean ± SEM. *p<0.05, **p<0.01, ***p<0.001, ****p<0.0001; ns, no significance.
-
Figure 4—source data 1
Excel file with raw data used to generate Figure 4C, E, H, J, and L.
- https://cdn.elifesciences.org/articles/98579/elife-98579-fig4-data1-v2.xlsx
Figure 5
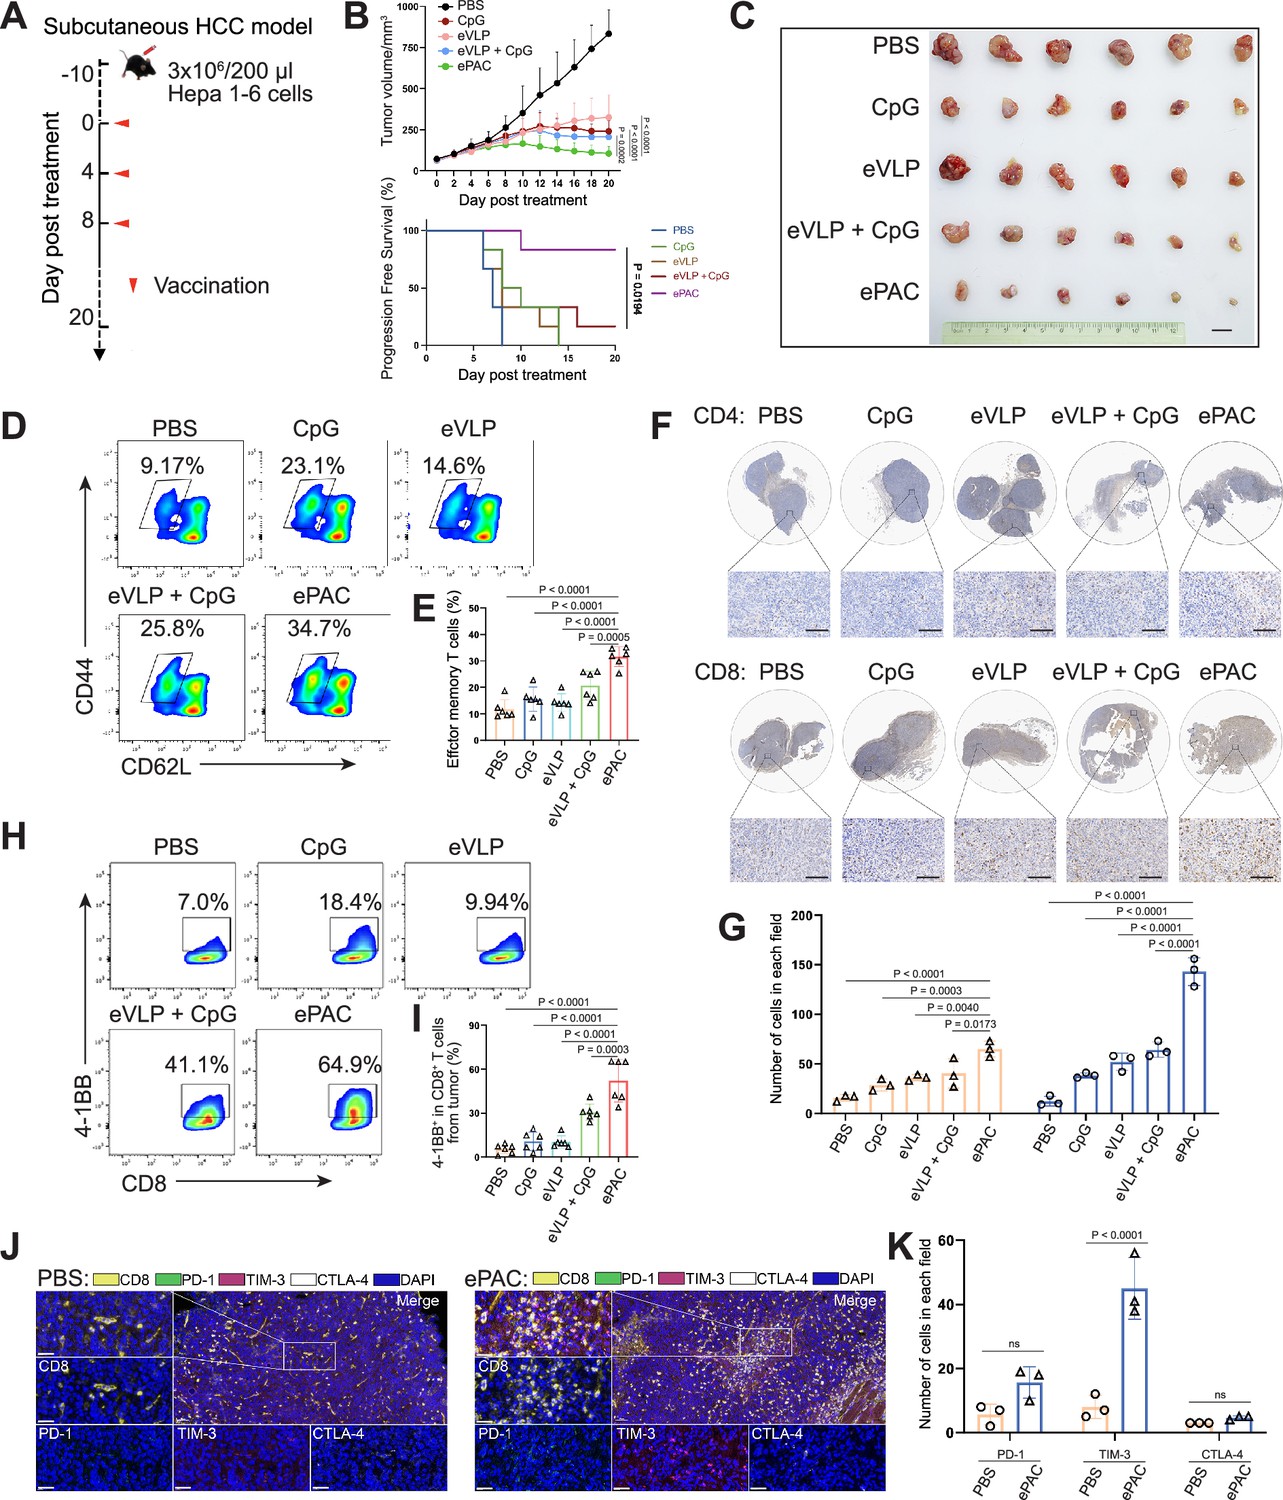
Antitumor effect of ePAC in subcutaneous hepatocellular carcinoma (HCC) model.
(A) Schematic diagram of vaccination-associated therapy in subcutaneous HCC model (n=6 mice). C57BL/6 mice were inoculated with Hepa1-6 cells on day –10 and immunized with the indicated vaccine formulations on day 0, 4, and 8 for a total of three treatments. (B) Growth curves of the tumor volumes in the indicated groups (n=6 mice; two-way ANOVA), and the progression-free survival (PFS) of different treated groups was analyzed by Kaplan-Meier algorithm. The tumor reaching 200 mm3 was defined as progression. (C) Representative images of tumors harvested from tumor-bearing mice on day 20. Scale bar, 1 cm. (D and E) The percentage and statistical analysis of effector memory T cells in splenic CD8+ T cells detected by flow cytometry (n=6 mice; one-way ANOVA). (F and G) Immunohistochemical staining of CD4+ and CD8+ cells (brown) in the tumors collected at the day 20 and the quantitation of CD4+ and CD8+ cells in each field (n=3, two-way ANOVA). Scale bar: 100 μm in the lower panels. (H and I) The percentage and statistical analysis of activated T cells expressing 4-1BB from tumors detected by flow cytometry (n=6 mice; one-way ANOVA). (J and K) Representative images and the expression analysis of CD8, PD-1, TIM-3, and CTLA-4 in tumors by immunofluorescence (n=3; two-way ANOVA). Scale bar: 50 μm. Data are presented as the mean ± SEM. *p<0.05, **p<0.01, ***p<0.001, ****p<0.0001; ns, no significance.
-
Figure 5—source data 1
Excel file with raw data used to generate Figure 5B, E, G, I, and K.
- https://cdn.elifesciences.org/articles/98579/elife-98579-fig5-data1-v2.xlsx
Figure 6
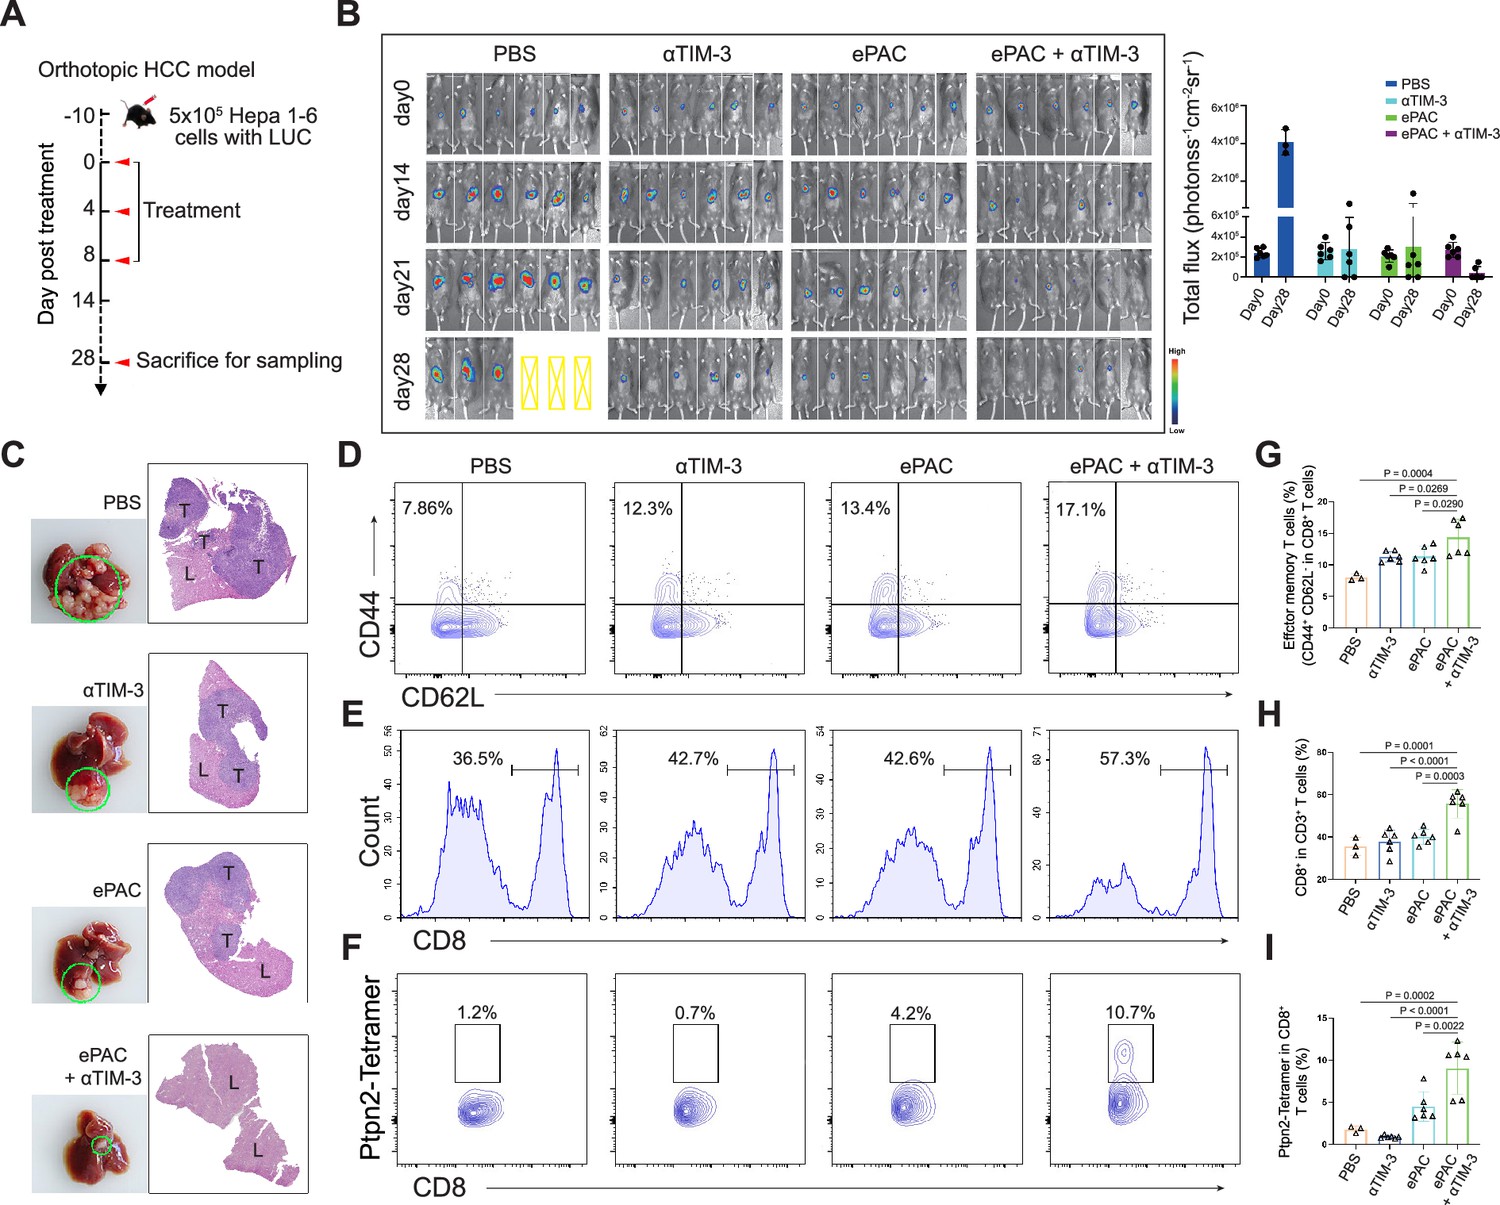
Evaluation ePAC antitumor efficacy in orthotopic hepatocellular carcinoma (HCC) model by αTIM-3 combination.
(A) Schematic diagram of vaccination-associated therapy in orthotopic HCC model (n=6 mice). The mice were sacrificed and sampled for analysis on the day of 28 after initiating treatment. (B) Tumor burden monitoring of PBS, αTIM-3 alone, ePAC alone, and ePAC plus αTIM-3 treated mice by bioluminescence imaging. (C) The photographs and H&E staining of tumor-bearing livers collected from mice after different treatments as indicated. ‘T’ represents tumor tissues, ‘L’ represents liver tissues, and there is the clear boundary with non-tumor sites. (D–I) Flow cytometry analysis of effector memory T cells in splenic CD8+ T cells (D and G), CD8+ T cell infiltration in the tumors (E and H), and Ptpn2376-384: H-2Kb specific CD8+ T cells in tumor infiltrating CD8+ T cells (F and I). Data are presented as the mean ± SEM. *p<0.05, **p<0.01, ***p<0.001, ****p<0.0001.
-
Figure 6—source data 1
Excel file with raw data used to generate Figure 6B, G, H, and I.
- https://cdn.elifesciences.org/articles/98579/elife-98579-fig6-data1-v2.xlsx
Figure 7 with 2 supplements
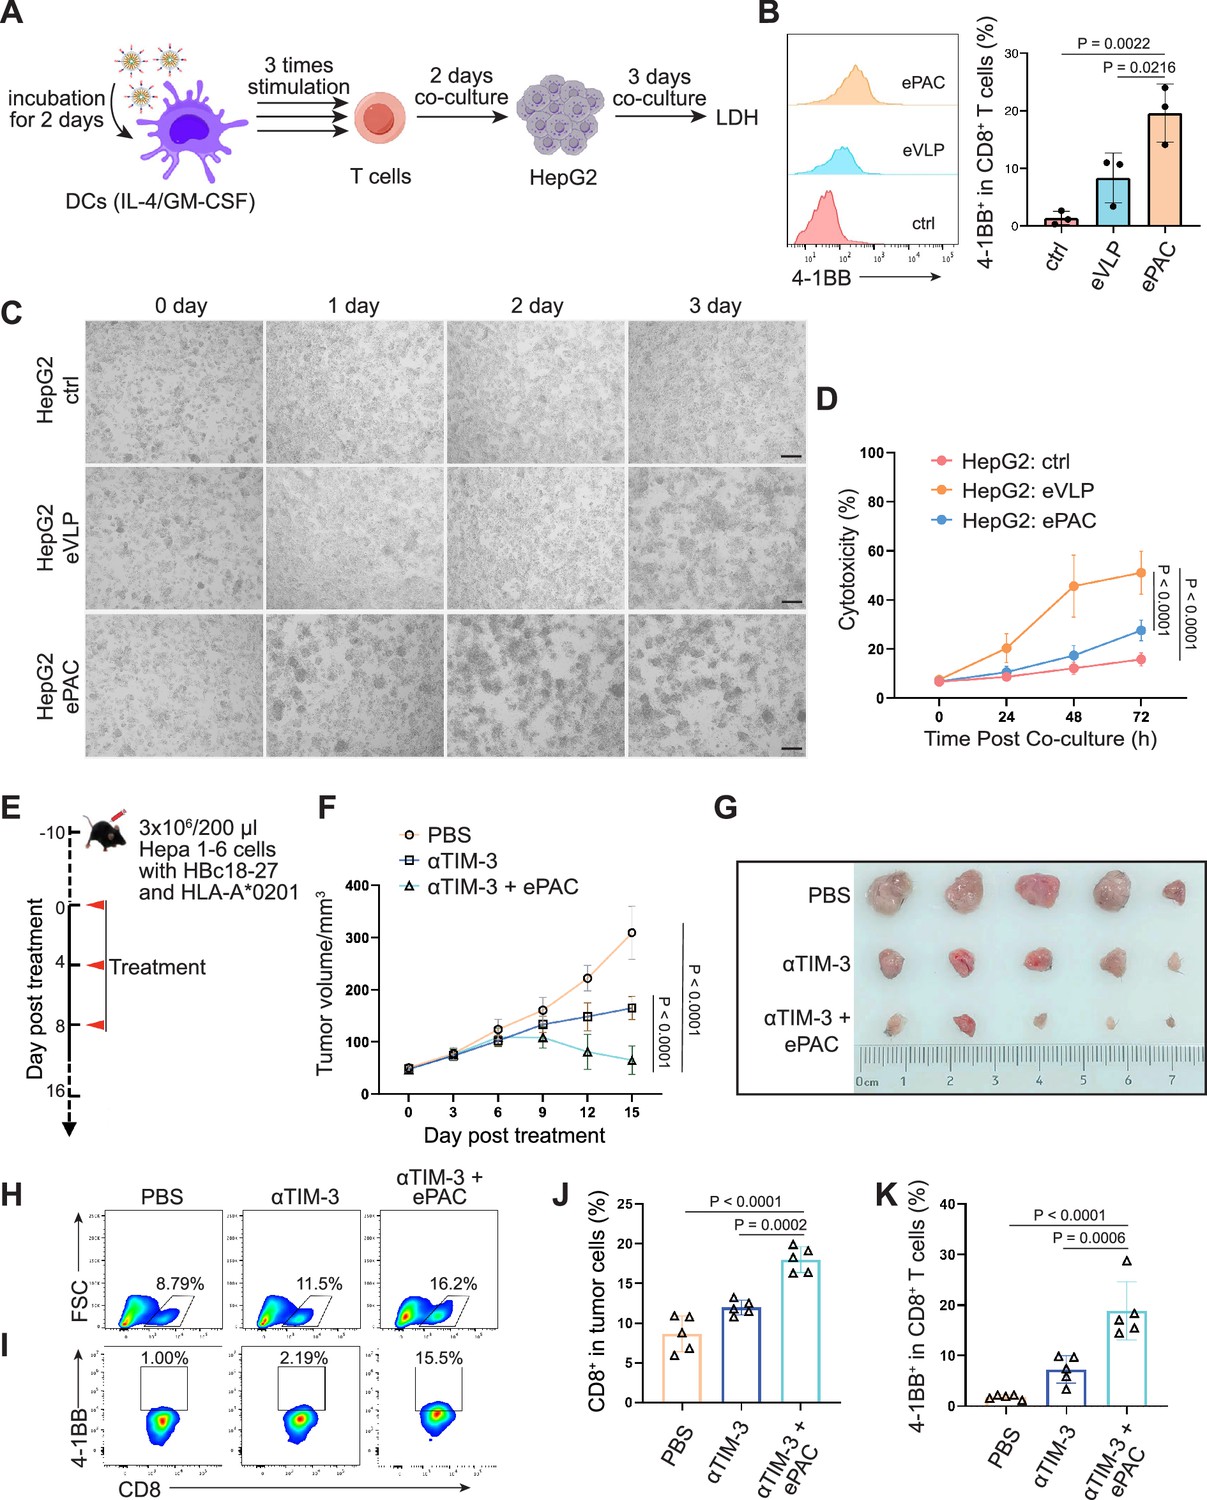
HBc18-27-specific immune response induced by endogenous virus-like particle (eVLP)-based vaccine.
(A) The strategy for T cell stimulation and tumor cell killing. (B) The analysis of stimulated CD8+ T cells detected by flow cytometry (n=3; one-way ANOVA). Peripheral blood mononuclear cells (PBMCs) were first activated by anti-CD3 and anti-CD28 for 2 days and then co-cultured with ePAC stimulated dendritic cells (DCs) for three times. (C) Tumor killing assay of HepG2(2.15) cells visualized by microscopy. (D) In vitro cytotoxicity analysis after PBMC and HepG2 co-culture (n=3; two-way ANOVA). The supernatant from different time points were harvested for LDH assay. Scale bar, 100 μm. (E) Schematic diagram of vaccination-associated therapy in subcutaneous HCC model constructed by HLA-A*0201 transgenic mice (n=5 mice). (F) Growth curves of the average tumor volumes in the indicated groups (n=5 mice; two-way ANOVA). (G) Representative images of tumors harvested from tumor-bearing mice on day 16. (H–K) Flow cytometry analysis of CD8+ T cell infiltration in the tumors (H and J) and the activated level of CD8+ T cells in tumors (I and K). n=6 mice; one-way ANOVA. Data are presented as the mean ± SEM. *p<0.05, **p<0.01, ***p<0.001, ****p<0.0001.
-
Figure 7—source data 1
Excel file with raw data used to generate Figure 7B, D, F, J, and K.
- https://cdn.elifesciences.org/articles/98579/elife-98579-fig7-data1-v2.xlsx
Figure 7—figure supplement 1
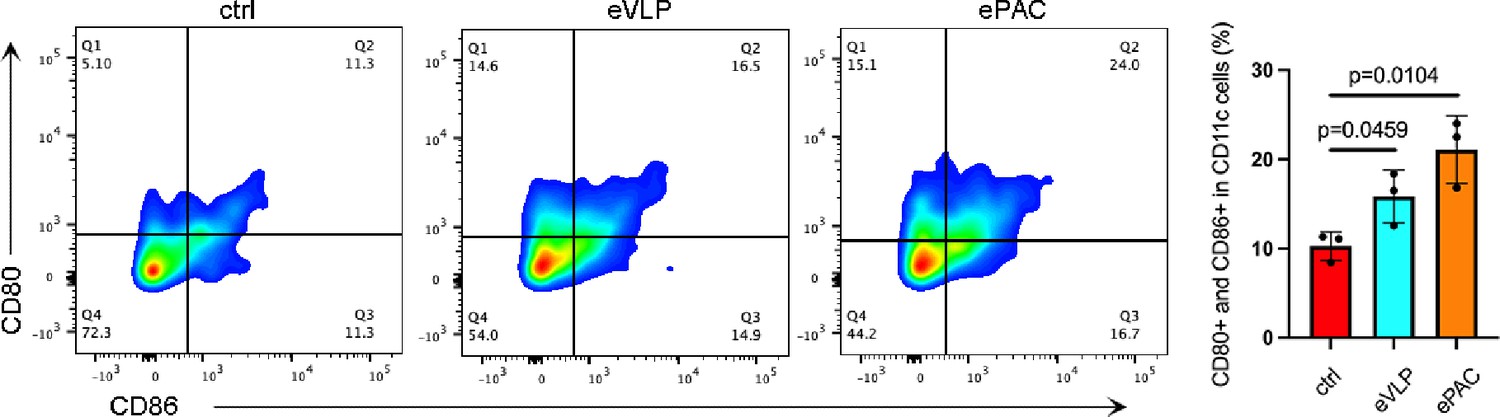
The co-expression of CD80 and CD86 in dendritic cells (DCs) treated by different formulations and detected by flow cytometry.
Figure 7—figure supplement 2
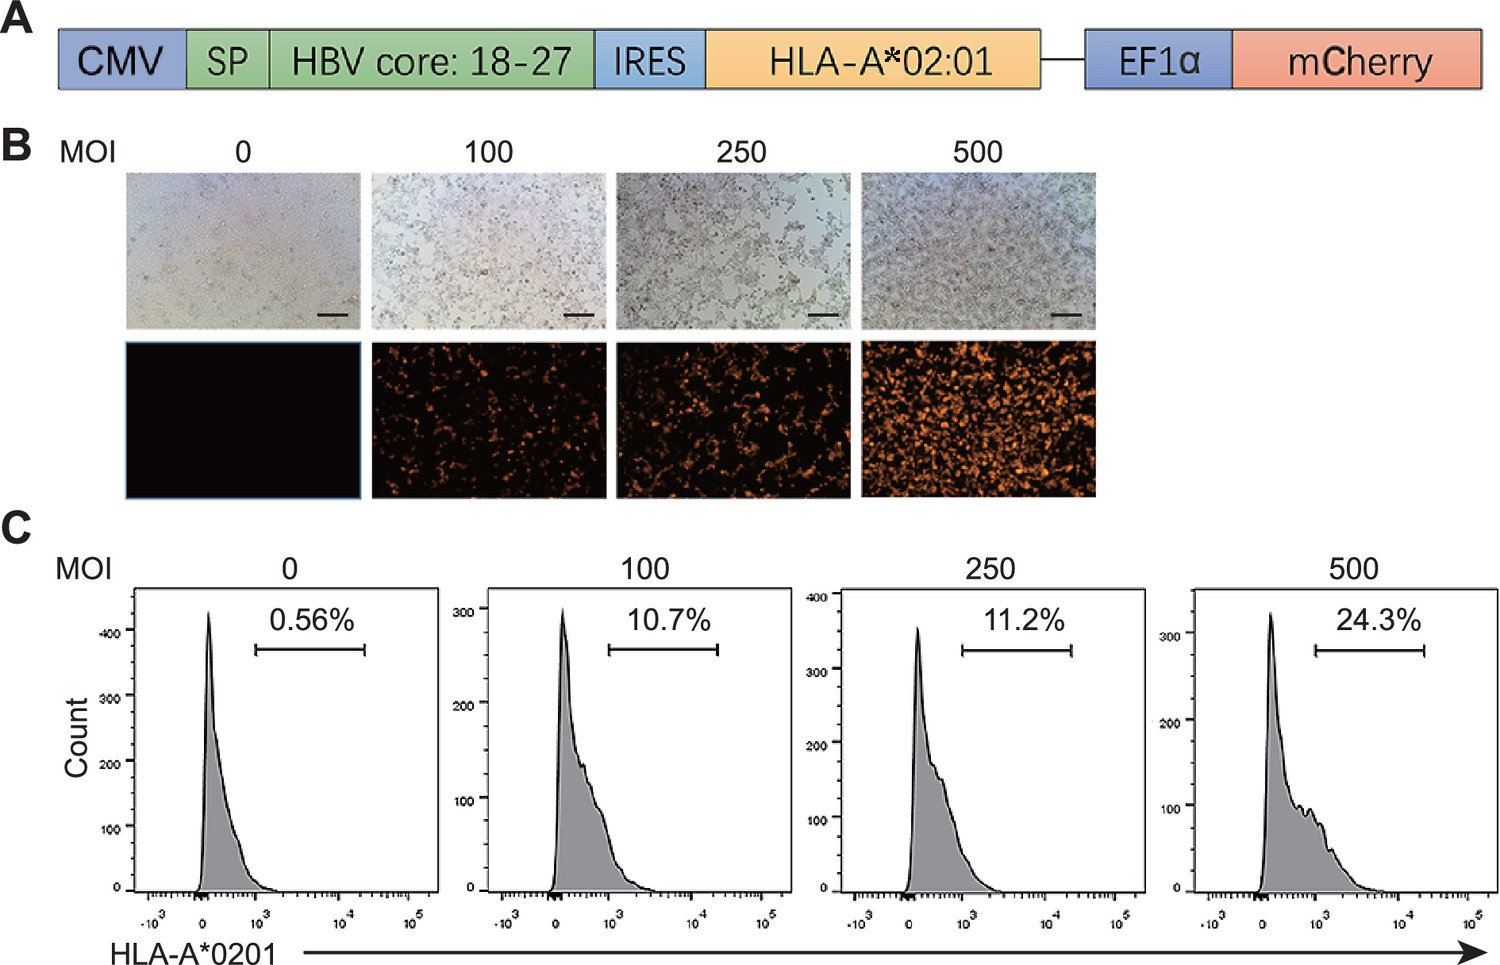
Assessment of the expression of HLA-A*0201 in Hepa1-6 cells.
(A) The plasmid structure of pDC315 for adenovirus package. SP: signal peptide from HLA. (B) The fluorescent images from Hepa1-6 cells infected by adenovirus at various multiplicity of infection (MOI). (C) The expression of HLA-A*0201 in Hepa1-6 cells from (B).
Additional files
-
Supplementary file 1
The sequences of plasmids and antibodies used in the study.
(a) The sequences of plasmids used in the study. (b) Antibodies used in the study.
- https://cdn.elifesciences.org/articles/98579/elife-98579-supp1-v2.docx
-
MDAR checklist
- https://cdn.elifesciences.org/articles/98579/elife-98579-mdarchecklist1-v2.pdf
Download links
A two-part list of links to download the article, or parts of the article, in various formats.
Downloads (link to download the article as PDF)
Open citations (links to open the citations from this article in various online reference manager services)
Cite this article (links to download the citations from this article in formats compatible with various reference manager tools)
Engineering PEG10-assembled endogenous virus-like particles with genetically encoded neoantigen peptides for cancer vaccination
eLife 13:RP98579.
https://doi.org/10.7554/eLife.98579.3


