Combined forces of hydrostatic pressure and actin polymerization drive endothelial tip cell migration and sprouting angiogenesis
- Laboratory for Vascular Morphogenesis, RIKEN Center for Biosystems Dynamics Research, Japan
- Department of Immunology, Genetics and Pathology, Rudbeck Laboratory, Uppsala University, Sweden
- Department of Medicine Huddinge, Karolinska Institutet, Sweden
Figures
Figure 1 with 3 supplements

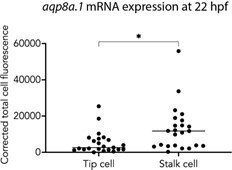
Differential expression of aqp1a.1 and aqp8a.1 mRNAs in tip and stalk cells.
(A–F) Detection of aqp1a.1 and aqp8a.1 mRNA by RNAscope in situ hybridization in 20 (A–D) and 22 (E, F) hpf embryos. Representative maximum intensity projection of confocal z-stacks of tip and stalk cells sprouting from DA are shown (n = 9 embryos, two independent experiments). (B) and (F) show magnified region of a tip cell from a 20 hpf and 22 hpf zebrafish, respectively (tip cell and EC nuclei in the DA are outlined). (G) Percentage of vascular sprouts with differential expression of aqp1a.1 and aqp8a.1 mRNA in tip and stalk cells in 22 hpf embryos (n = 23 sprouts from eight embryos, two independent experiments). (H) qPCR analysis of aqp1a.1 and aqp8a.1 expression in zebrafish embryos treated with 0.01% DMSO or 1 µM Ki8751 at 20 hpf for 6 hr (n = 3 independent experiments). (I) qPCR analysis of AQP1 gene expression in human aortic endothelial cells (HAECs) treated with 0.01% DMSO, 1 or 10 nM Ki8751 for 6 hr (n = 2 independent experiments). In panels (H) and (J), gene expressions are shown relative to gapdh expression and data are presented as mean ± SD; statistical significance was determined by Brown–Forsythe and Welch ANOVA tests with Dunnett’s multiple-comparisons test; ns p>0.05, **p<0.01, ***p<0.001, and ****p<0.0001. DA, dorsal aorta; PCV, posterior cardinal vein. Scale bar, 10 µm (B, F) and 40 µm (A, C–E).
-
Figure 1—source data 1
Raw data used to generate panels G-I.
- https://cdn.elifesciences.org/articles/98612/elife-98612-fig1-data1-v1.xlsx
Figure 1—figure supplement 1
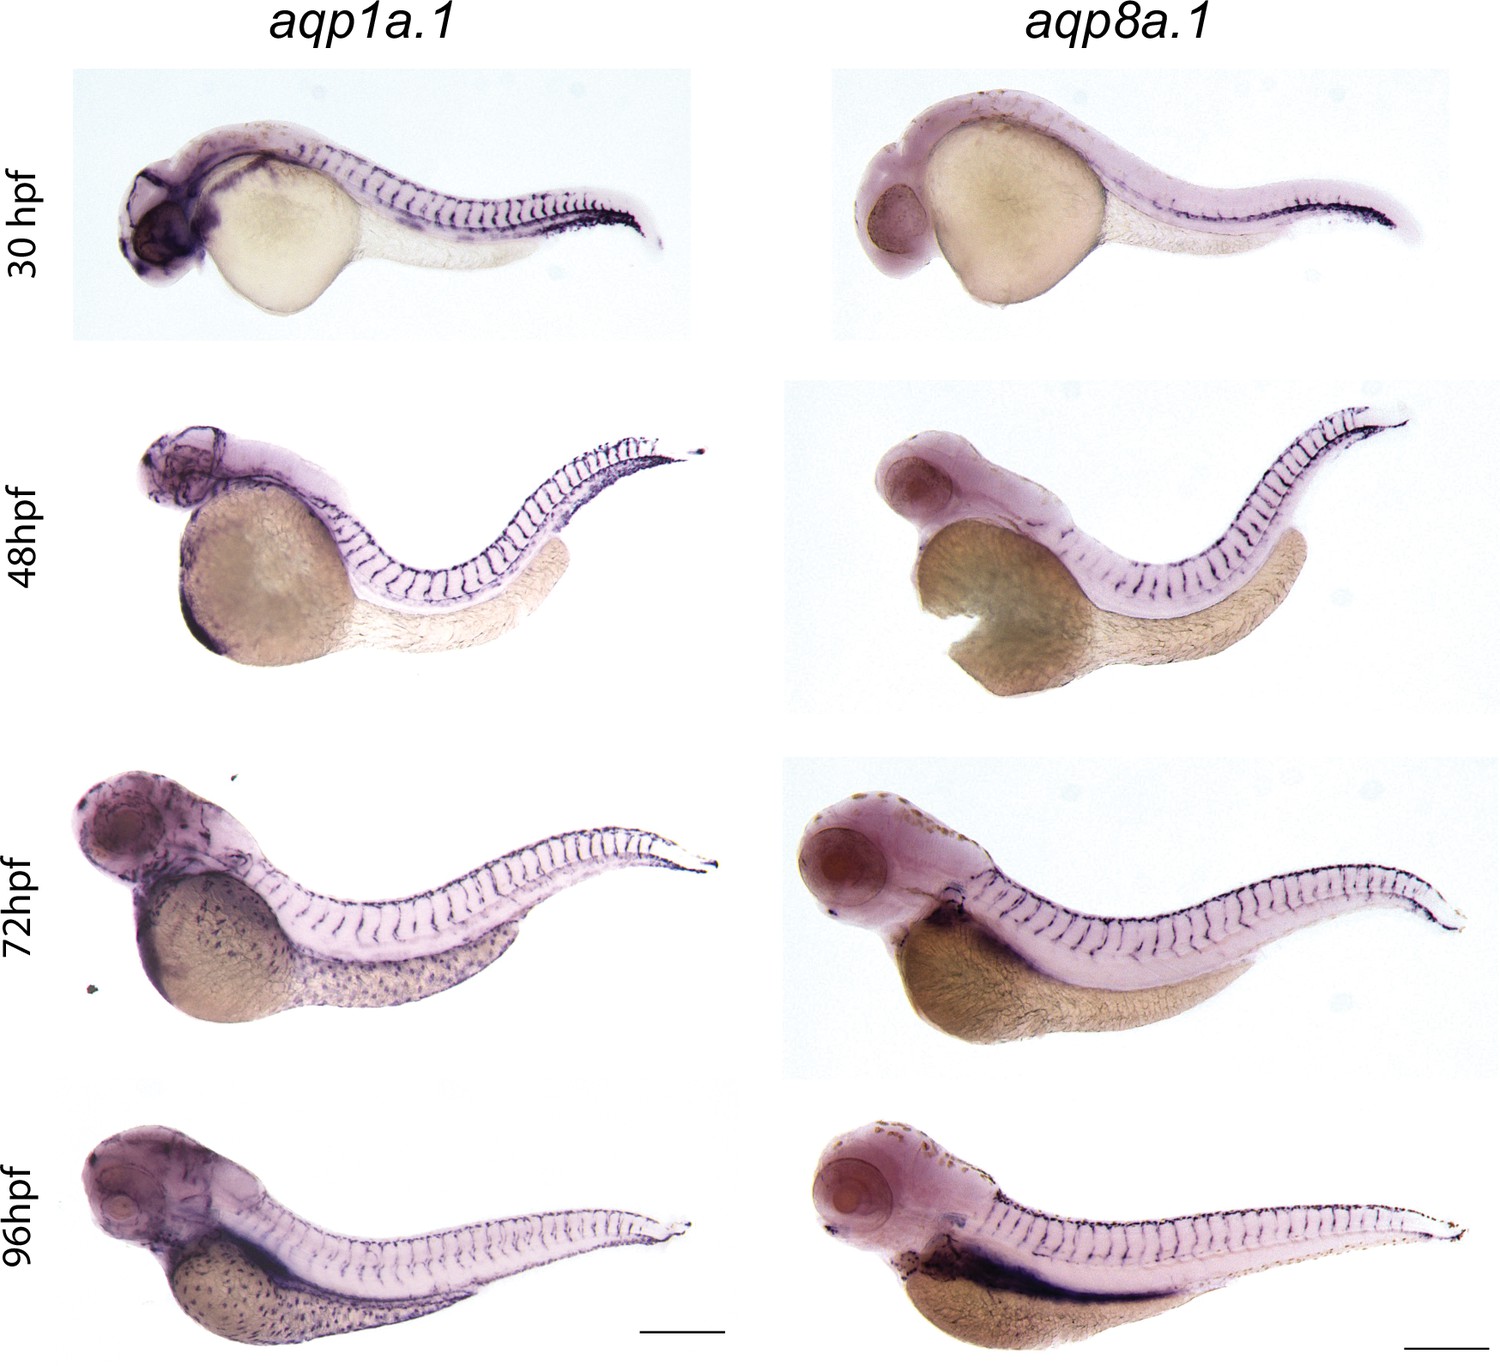
Expression of endothelial-specific aquaporins during development.
Whole-mount in situ hybridization with aqp1a.1 and aqp8a.1 RNA probes at different developmental stages. Images are representative of 10 embryos for every stage and probe (n = 2 independent experiments). Scale bar, 250 μm.
Figure 1—figure supplement 2
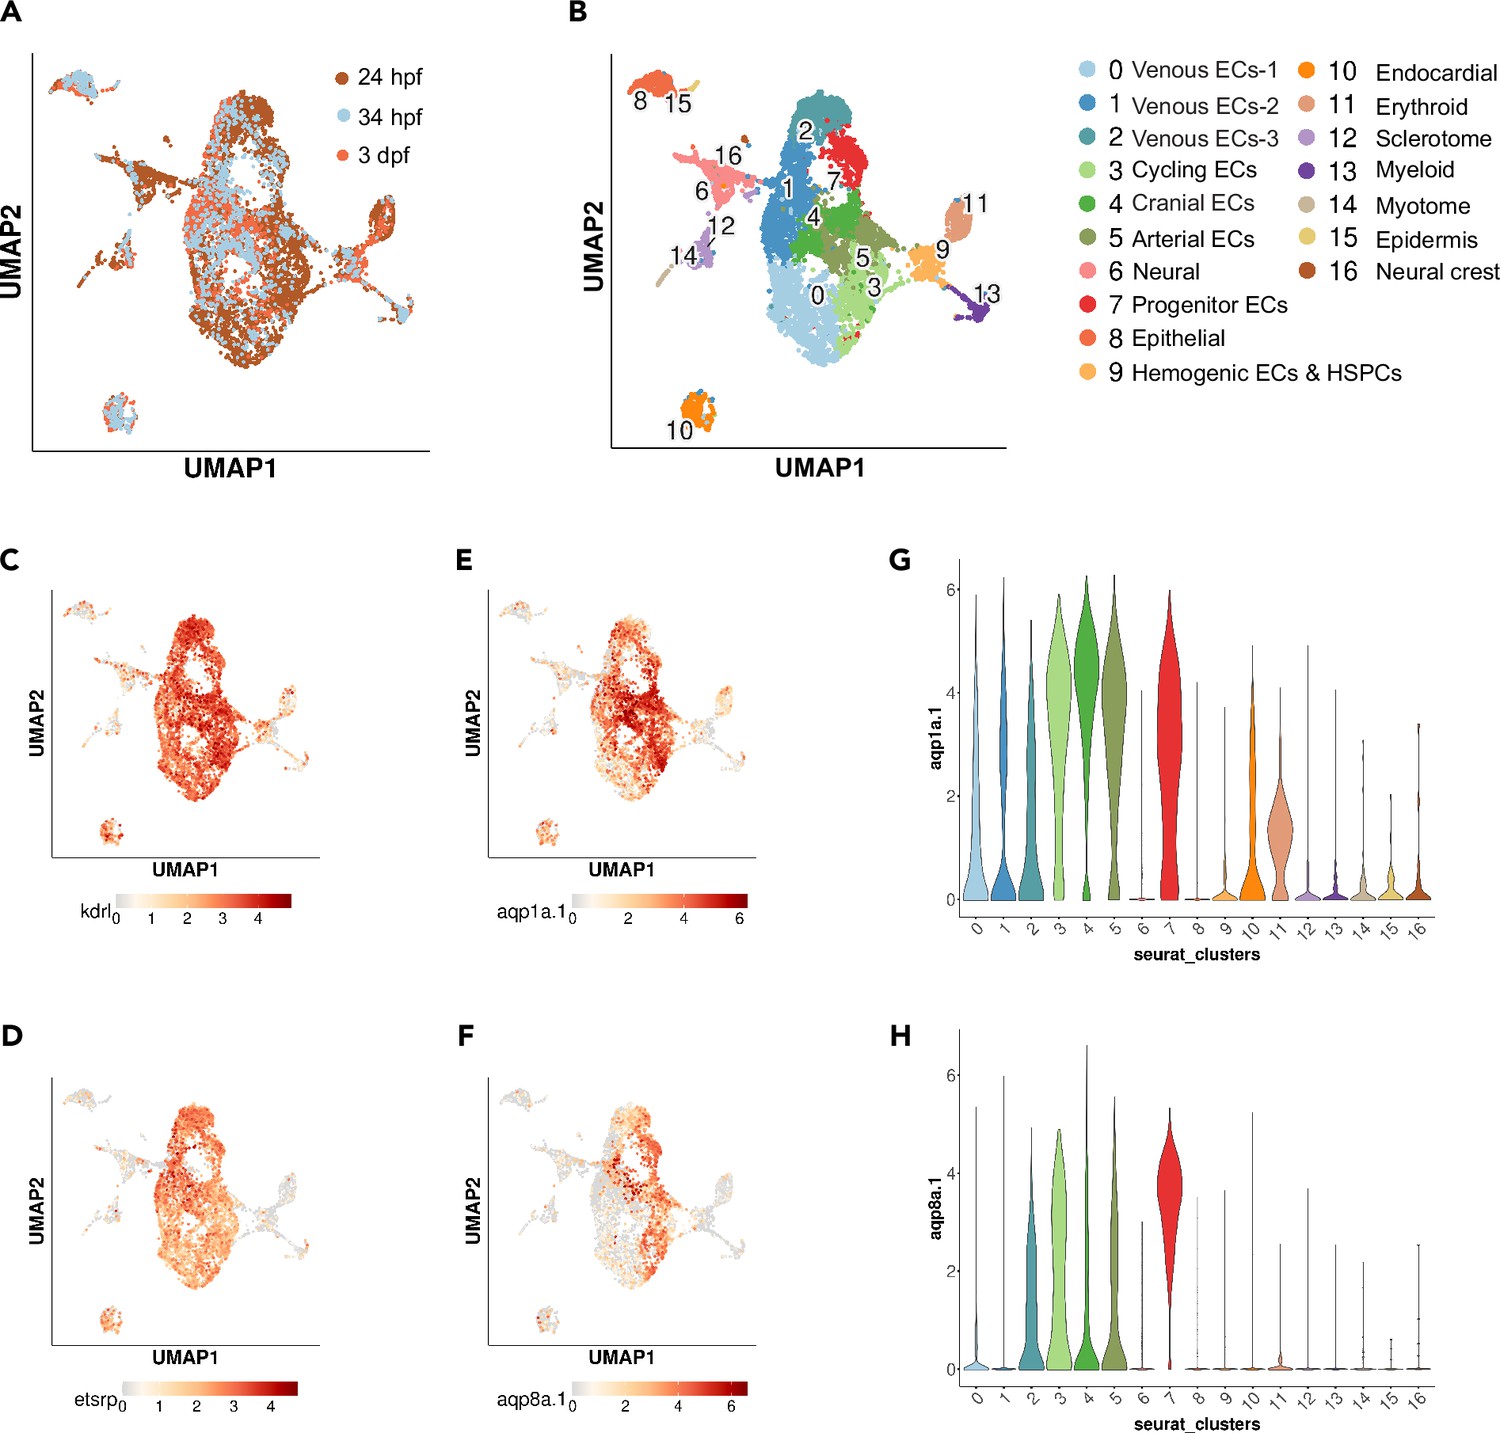
scRNA-seq analysis of kdrl-positive cells from 24 hpf, 34 hpf, and 3 dpf zebrafish.
(A, B) UMAP plots of 5576 cells from 24 hpf Tg(kdrl:mCherry) (Gurung et al., 2022), 1475 cells from 34 hpf Tg(kdrl:EGFP)s843 zebrafish, and 1692 cells from 3 dpf Tg(kdrl:EGFP)s843 zebrafish (A) showing 16 distinct clusters (B). Classifications were based on previously known marker genes that are enriched in each cluster. (C–F) UMAP feature plots showing expression of kdrl (C), etsrp/etv2 (D), aqp1a.1 (E), and aqp8a.1 (F). (G, H) Violin plots showing expression of aqp1a.1 (G) and aqp8a.1 (H) in different cell populations.
Figure 1—figure supplement 3
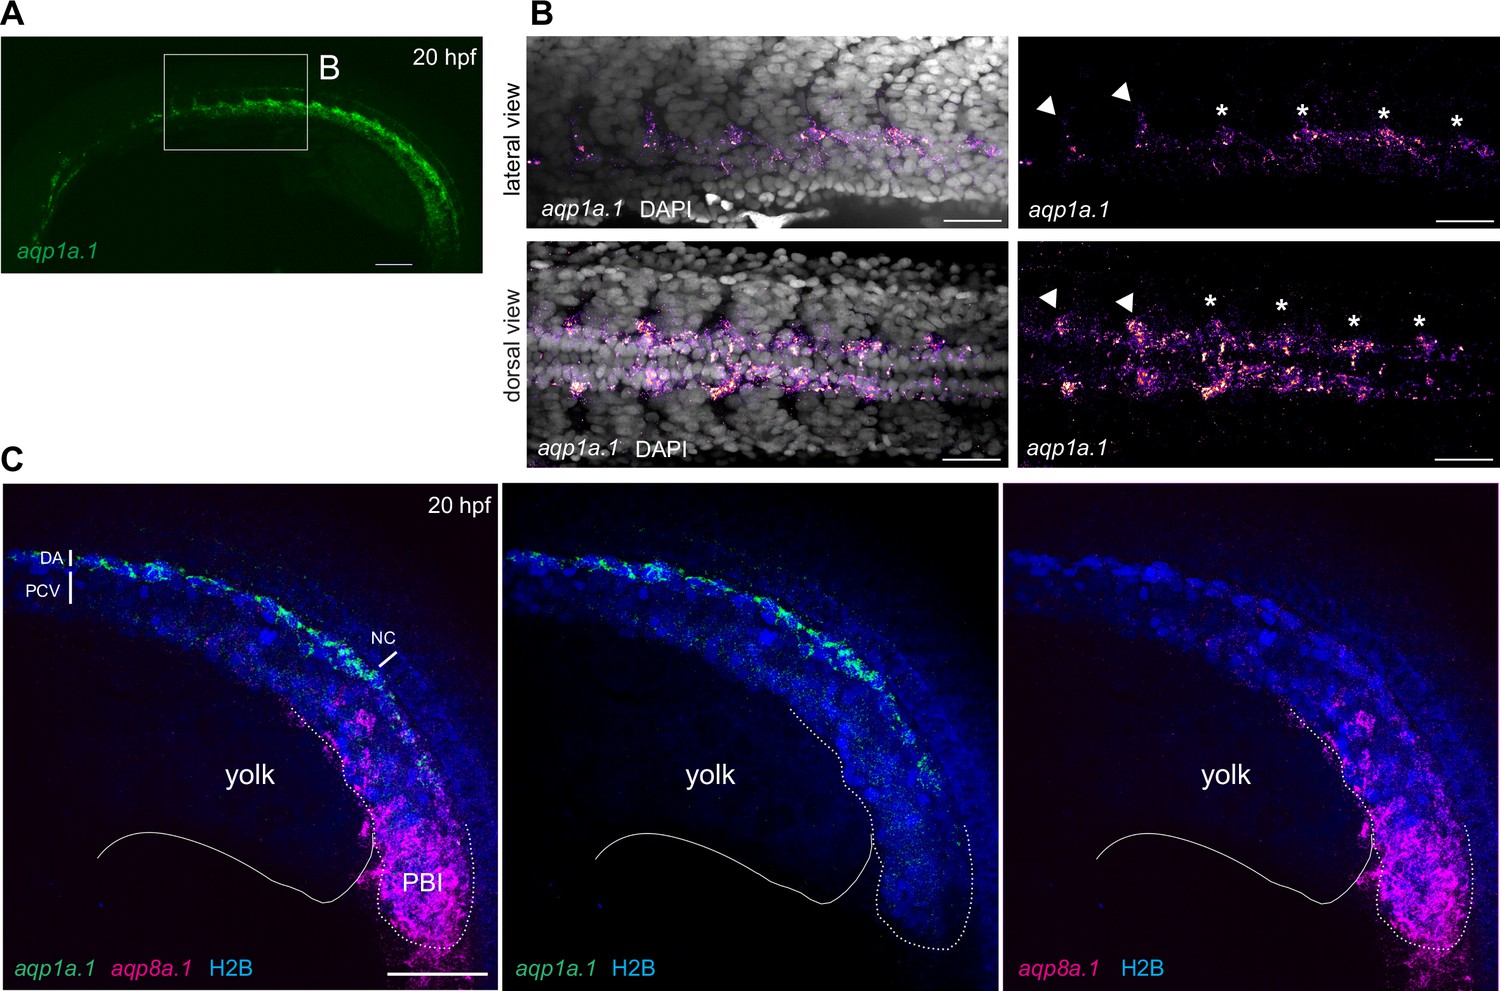
aqp1a.1 and aqp8a.1 are differentially expressed in the dorsal aorta at 20 hpf.
(A, B) aqp1a.1 mRNA expression in the DA, as determined by RNAscope in situ hybridization. (B) Magnified region of the anterior trunk. aqp1a.1 expression is heterogeneous, with higher expression in endothelial tip cells of newly formed intersegmental vessels (ISVs) (arrowhead) and in endothelial cells (ECs) of the DA destined to be tip cells (asterisk). (C) aqp8a.1 mRNA expression in the posterior blood island, as determined by RNAscope in situ hybridization. Endothelial nuclei are labeled with EGFP (pseudocolored in blue) in Tg(fli1a:H2B-EGFP)nvc69 transgenic line. Representative confocal images of nine embryos (n = 2 independent experiments). Anterior to the left. DA, dorsal aorta; NC, notochord; PCV, posterior cardinal vein; PBI, posterior blood island. Scale bar, 100 µm (A) and 40 µm (B, C).
Figure 2 with 2 supplements
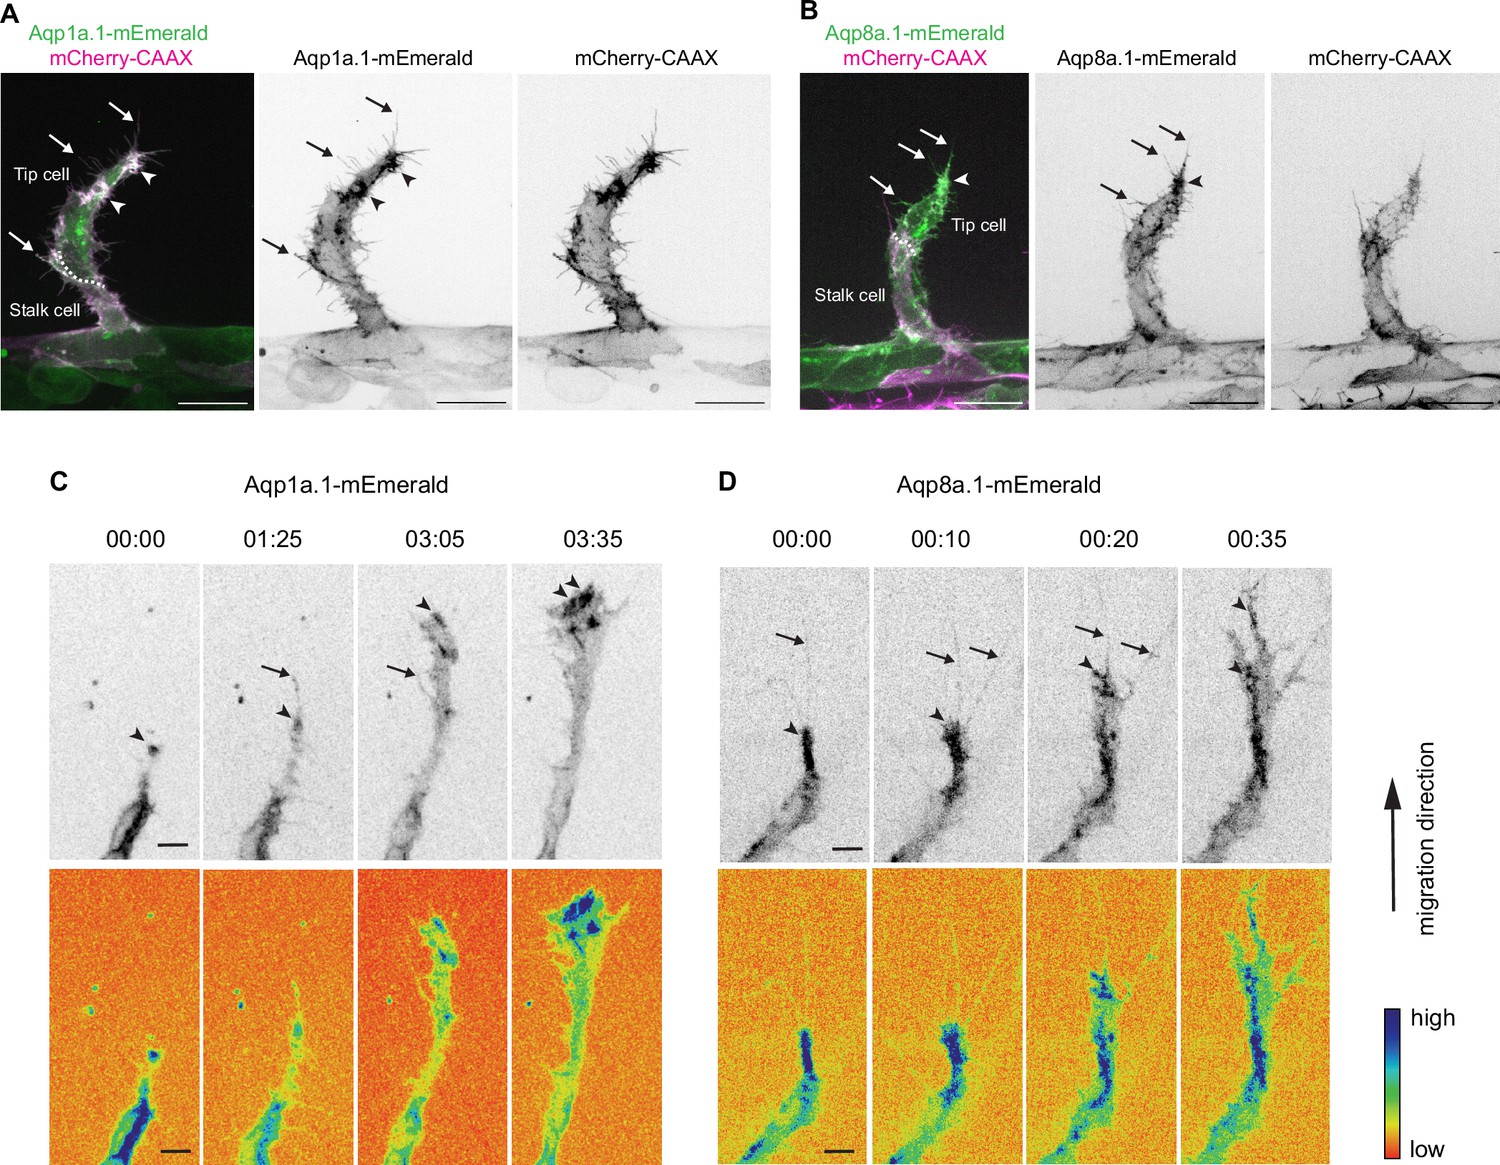
Aquaporin proteins are enriched at the leading edge of migrating tip cells.
(A, B) Representative maximum intensity projection confocal z-stacks of endothelial tip cells of 25 hpf Tg(fli1ep:aqp1a.1-mEmerald)rk30;(kdrl:Hsa.HRAS-mCherry)s916 (A) and Tg(fli1ep:aqp8a.1-mEmerald)rk31;(kdrl:Hsa.HRAS-mCherry)s916 (B) embryos. White serrated line outlines tip-stalk cell border. (C, D) Still images from time-lapse movies of migrating tip cells from Tg(fli1ep:aqp1a.1-mEmerald)rk30 (C) and Tg(fli1ep:aqp8a.1-mEmerald)rk31 (D) embryos. Movies were taken from 24 hpf to 30 hpf. Arrowheads, aquaporin protein localization at the leading edge of migrating tip cells. Arrows, aquaporin protein localization in filopodia. Time, hour:minutes. Scale bar, 5 µm (C, D) and 20 µm (A, B).
Figure 2—video 1
Aqp1a.1 protein enrichment at the leading edge of migrating tip cells.
Live imaging of Tg(fli1ep:aqp1a.1-mEmerald)rk30 transgenic embryo from 25 hpf to 30 hpf (5 min time interval). 00:00, hour:minutes post fertilization.
Figure 2—video 2
Aqp8a.1 protein enrichment at the leading edge of migrating tip cells.
Live imaging of Tg(fli1ep:aqp8a.1-mEmerald)rk31 transgenic embryo from 25 hpf to 28 hpf (5 min time interval). 00:00, hour:minutes post fertilization.
Figure 3 with 7 supplements
Loss of Aquaporin function leads to defective trunk vessel formation.
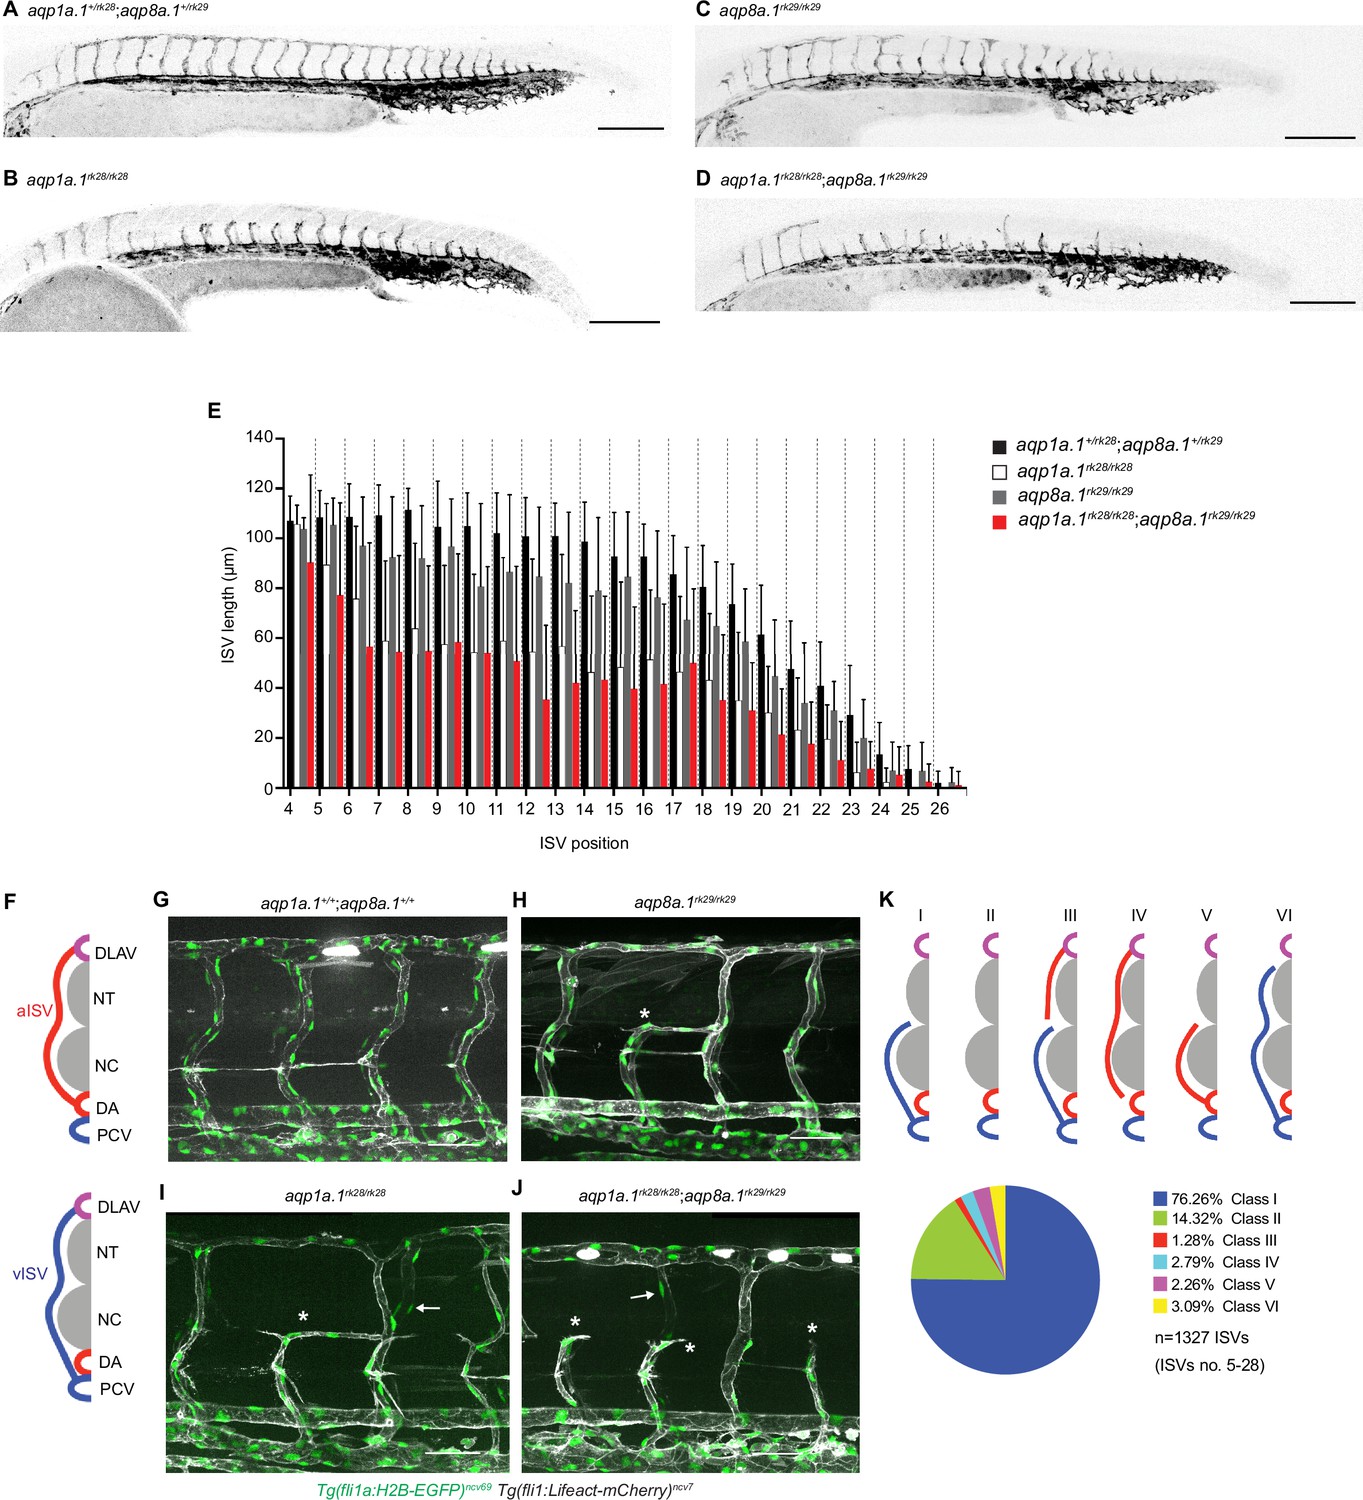
(A–D) Representative maximum intensity projection confocal z-stacks of 28 hpf aqp1a.1+/rk28;aqp8a.1+/rk29 (A), aqp1a.1rk28/rk28 (B), aqp8a.1rk29/rk29 (C), and aqp1a.1rk28/rk28;aqp8a.1rk29/rk29 (D) embryos. (E) Quantification of ISV length at different positions along the trunk in 28 hpf embryos (aqp1a.1+/rk28;aqp8a.1+/rk29: n = 21 embryos; aqp1a.1rk28/rk28: n = 20 embryos; aqp8a.1rk29/rk29: n = 20 embryos; aqp1a.1rk28/rk28;aqp8a.1rk29/rk29: n = 19 embryos from two independent experiments); data is presented as mean ± SD. (F) Illustration of aISV and vISV connections in the trunk of wildtype embryo at 3 dpf. (G–J) Representative maximum intensity projection confocal z-stacks of 3 dpf wild type (G), aqp8a.1rk29/rk29 (H), aqp1a.1rk28/rk28 (I), and aqp1a.1rk28/rk28;aqp8a.1rk29/rk29 (J) embryos. Asterisk marks incomplete ISVs, arrows point to EC nuclei on the contralateral side. (K) Pie chart showing the proportion of different classes of truncated ISV phenotypes (I–VI) found in aqp1a.1rk28/rk28;aqp8a.1rk29/rk29 mutant embryos at 3 dpf. DA, dorsal aorta; DLAV, dorsal longitudinal anastomotic vessel; ISV, intersegmental vessel; aISV, arterial ISV; vISV, venous ISV; NC, notochord; NT, neural tube; PCV, posterior cardinal vein. Scale bar, 50 µm (G–J) and 200 µm (A–D).
-
Figure 3—source data 1
Raw data used to generate panel E.
- https://cdn.elifesciences.org/articles/98612/elife-98612-fig3-data1-v1.xlsx
Figure 3—figure supplement 1
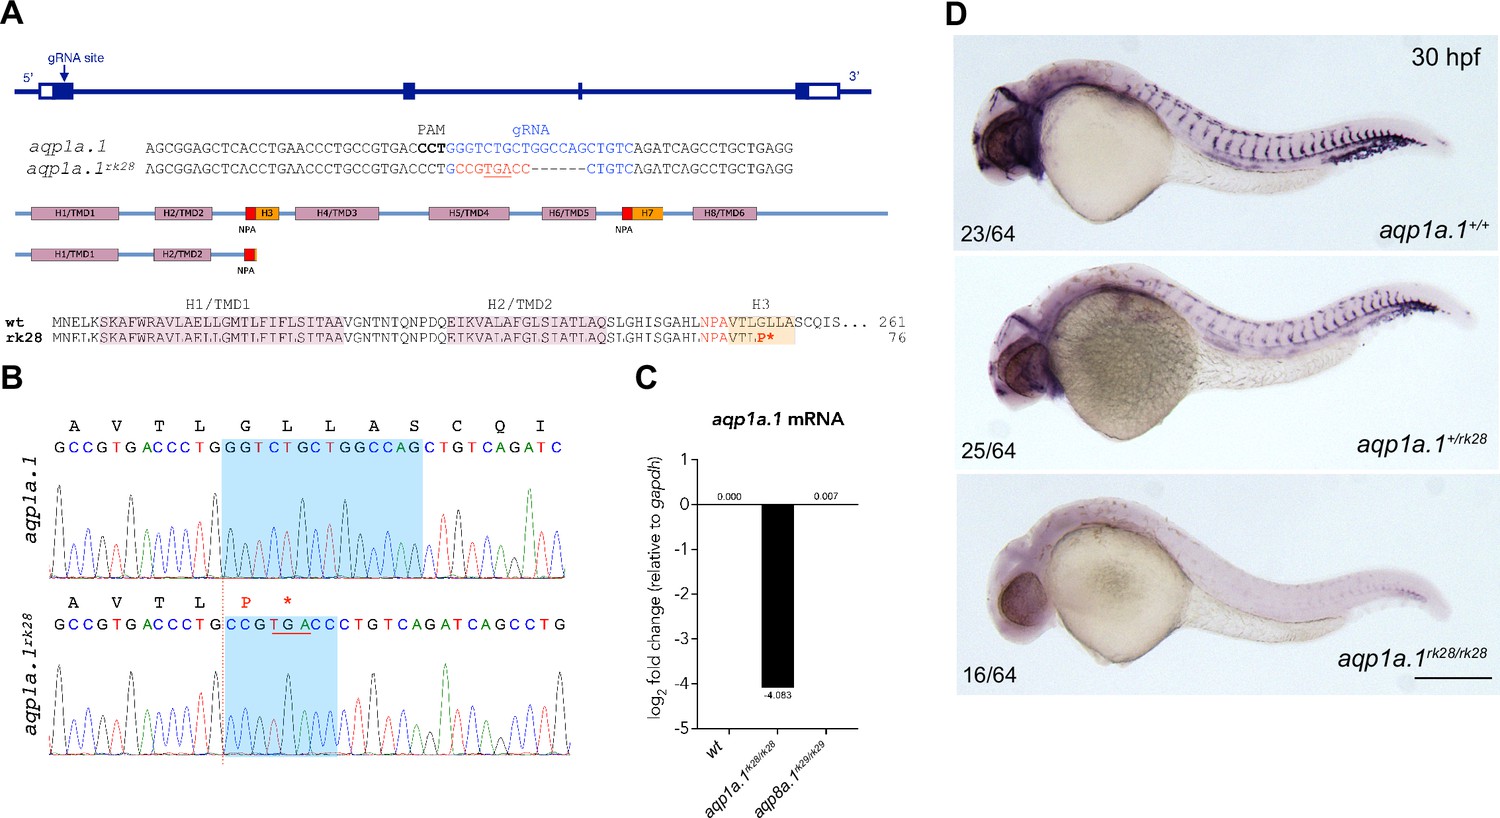
CRISPR/Cas9-induced mutation in zebrafish aqp1a.1 gene.
(A) Zebrafish aqp1a.1 gene structure, gRNA binding site (in blue), aqp1a.1rk28 allele, Aqp1a.1 wildtype (261 aa) and Aqp1a.1rk28 (truncated at 76 aa) protein structure. The rk28 mutation causes a 14-nt deletion and an 8-nt insertion (in red), which leads to a premature termination codon (underlined), and as a result, to the loss of four out of six transmembrane domains/helices (H4/TMD3-H8/TMD6) and two membrane-inserted non-membrane-spanning helices (H3 and H7). (B) Sequence read showing 14-nt deletion (shadowed area in wildtype allele) and 8-nt insertion (shadowed area in rk28 allele) in aqp1a.1rk28 allele. Premature termination codon is underlined. Amino acid sequence is shown above the nucleotide sequences. (C) qPCR analysis of aqp1a.1 mRNA expression in wildtype, aqp1a.1rk28/rk28 and aqp8a.1rk29/rk29 embryos. (D) Representative images of wildtype, heterozygote, and homozygote embryos after whole-mount in situ hybridization with aqp1a.1 RNA probe at 30 hpf. Scale bar, 250 µm.
Figure 3—figure supplement 2
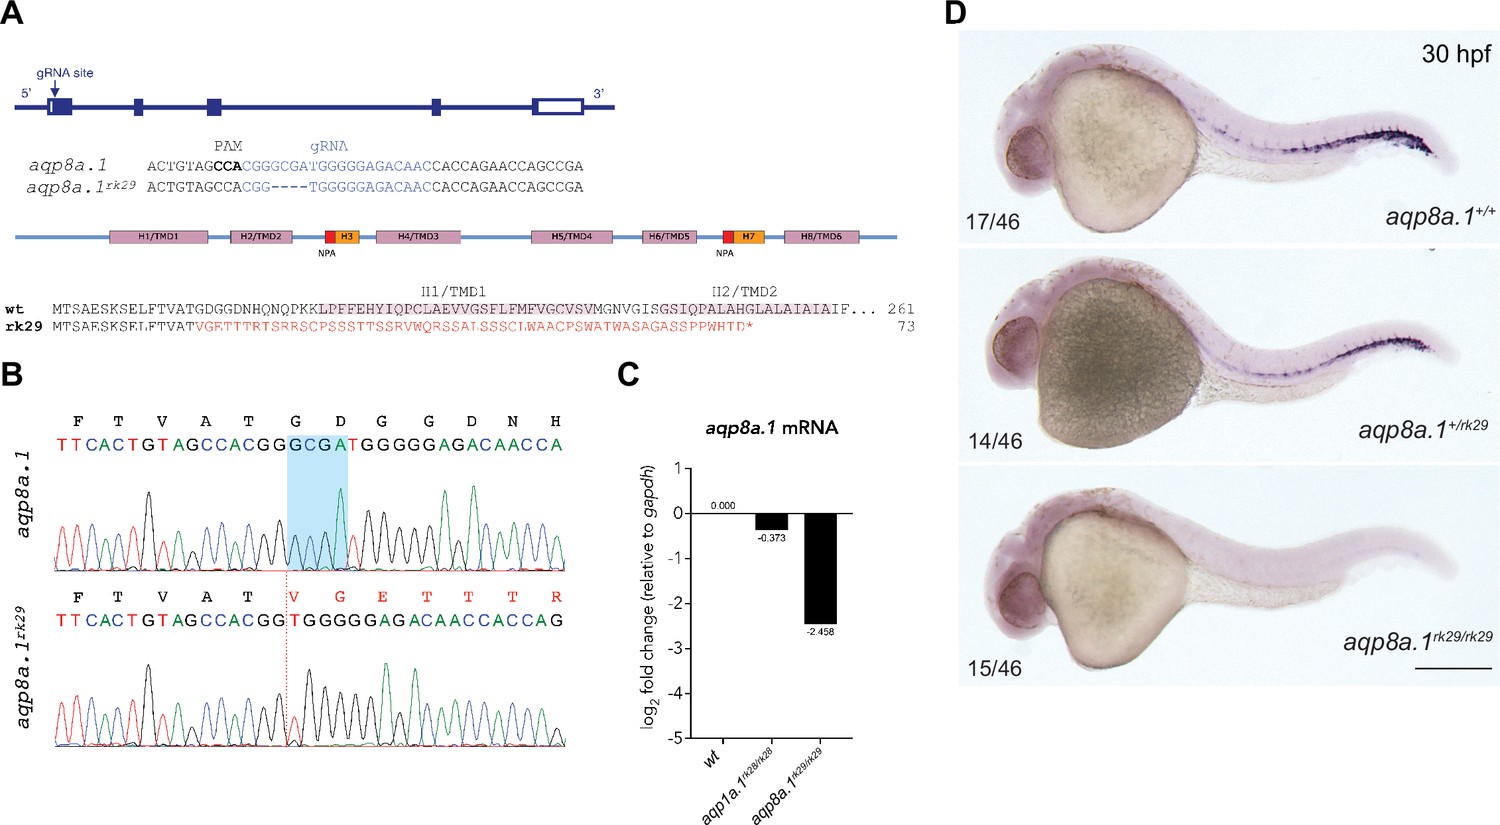
CRISPR/Cas9-induced mutation in zebrafish aqp8a.1 gene.
(A) Zebrafish aqp8a.1 gene structure, gRNA binding site (in blue), aqp8a.1rk29 allele, Aqp8a.1 wildtype (261 aa), and Aqp8a.1rk29 (truncated at 73 aa) protein structure. The rk29 mutation causes a 4-nt deletion, which leads to a frameshift after Thr15 and premature termination codon at amino acid 73 after 58 missense amino acids, and as a result to the loss of six transmembrane domains/helices (H1/TMD1-H8/TMD6) and two membrane-inserted non-membrane-spanning helices (H3 and H7). (B) Sequence read showing 4-nt deletion (shadowed area in wildtype allele) in aqp8a.1rk29 allele (red dotted line). Amino acid sequence is shown above the nucleotide sequences. (C) qPCR analysis of aqp8a.1 mRNA expression in wildtype, aqp1a.1rk28/rk28 and aqp8a.1rk29/rk29 embryos. (D) Representative images of wildtype, heterozygote, and homozygote embryos after whole-mount in situ hybridization with aqp8a.1 RNA probe at 30 hpf. Scale bar, 250 µm.
Figure 3—figure supplement 3
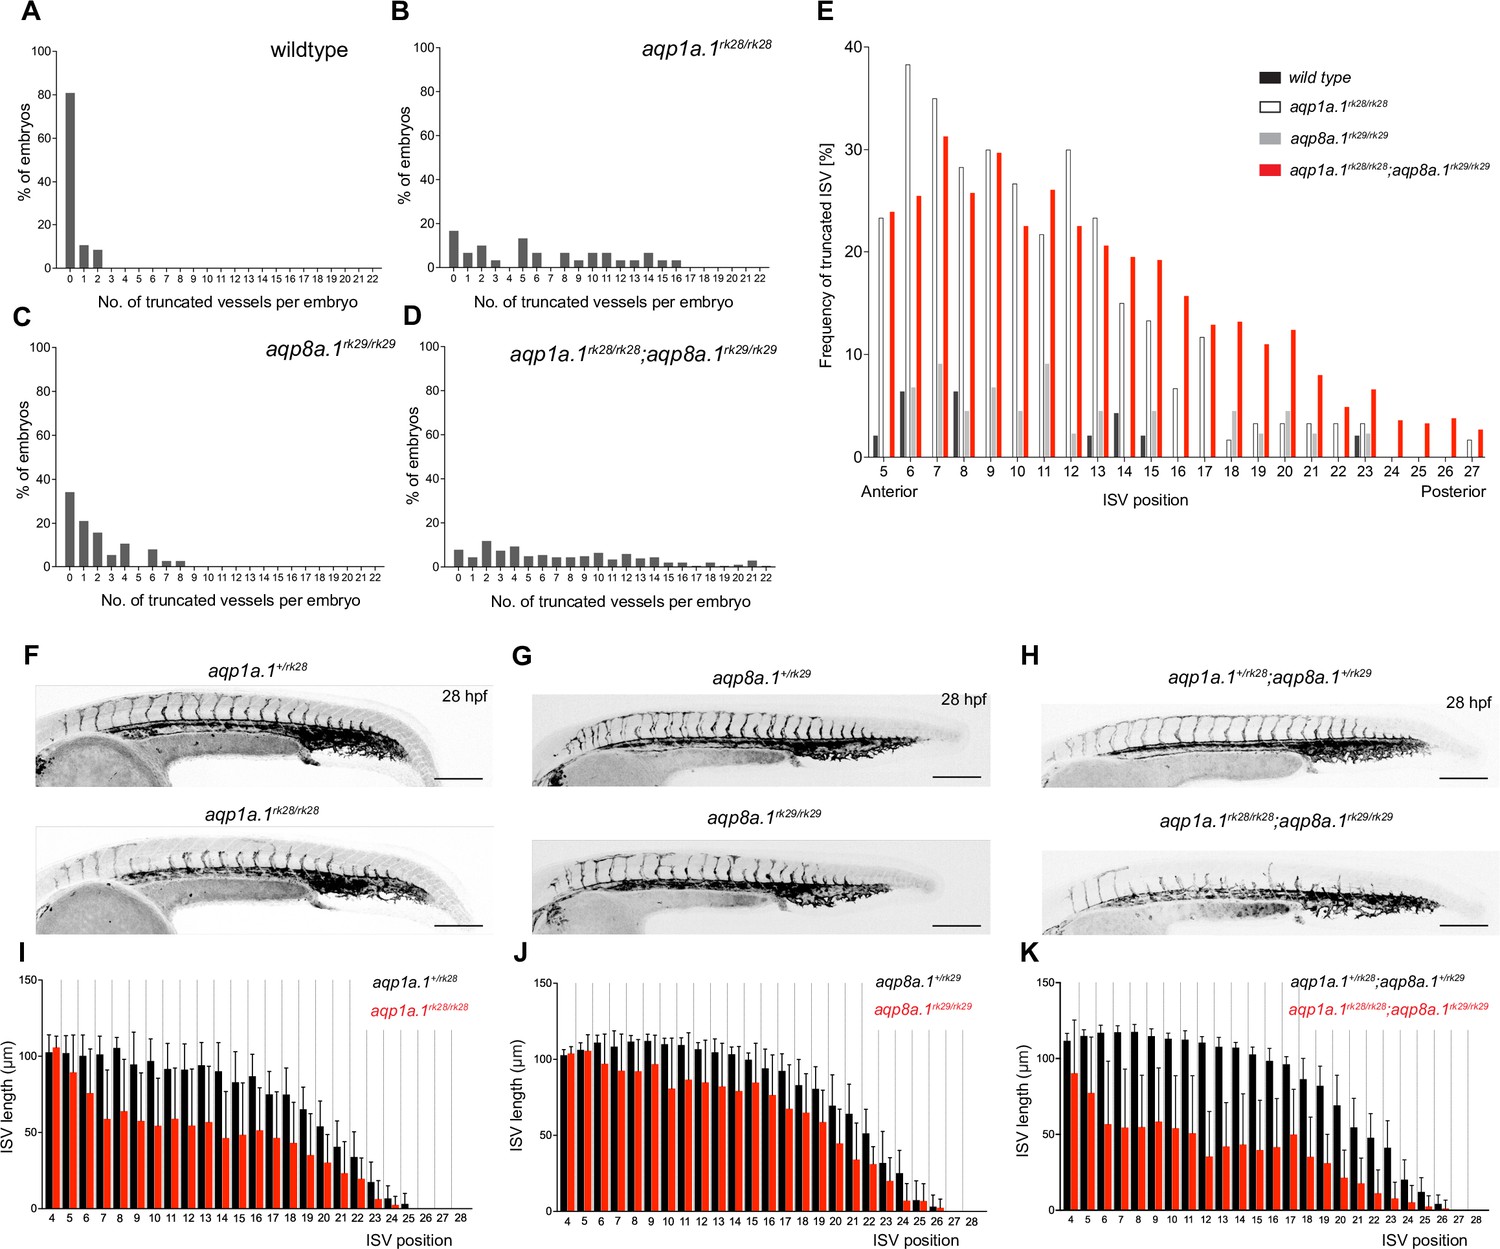
Analysis of ISV defects in aquaporin mutant embryos.
(A–D) Number of truncated ISVs per embryo in wildtype (A, n = 47), aqp1a.1rk28/rk28 (B, n = 30), aqp8a.1rk29/rk29 (C, n = 38), and aqp1a.1rk28/rk28;aqp8a.1rk29/rk29 (D, n = 204) larvae at 3 dpf. (E) Anterior-to-posterior distribution of truncated ISVs in the trunk and tail region. (F–H) Maximum intensity projection confocal z-stacks of aquaporin heterozygote and homozygote embryos at 28 hpf. Images are representative of 10 embryos for each genotype. Scale bar, 200 µm. (I–K) Quantification of ISV length at each position along the length of the embryos in aquaporin heterozygote and homozygote embryos at 28 hpf; data is presented as mean ± SD. ISVs, intersegmental vessels.
-
Figure 3—figure supplement 3—source data 1
Raw data used to generate panels A-E, I-K.
- https://cdn.elifesciences.org/articles/98612/elife-98612-fig3-figsupp3-data1-v1.xlsx
Figure 3—figure supplement 4
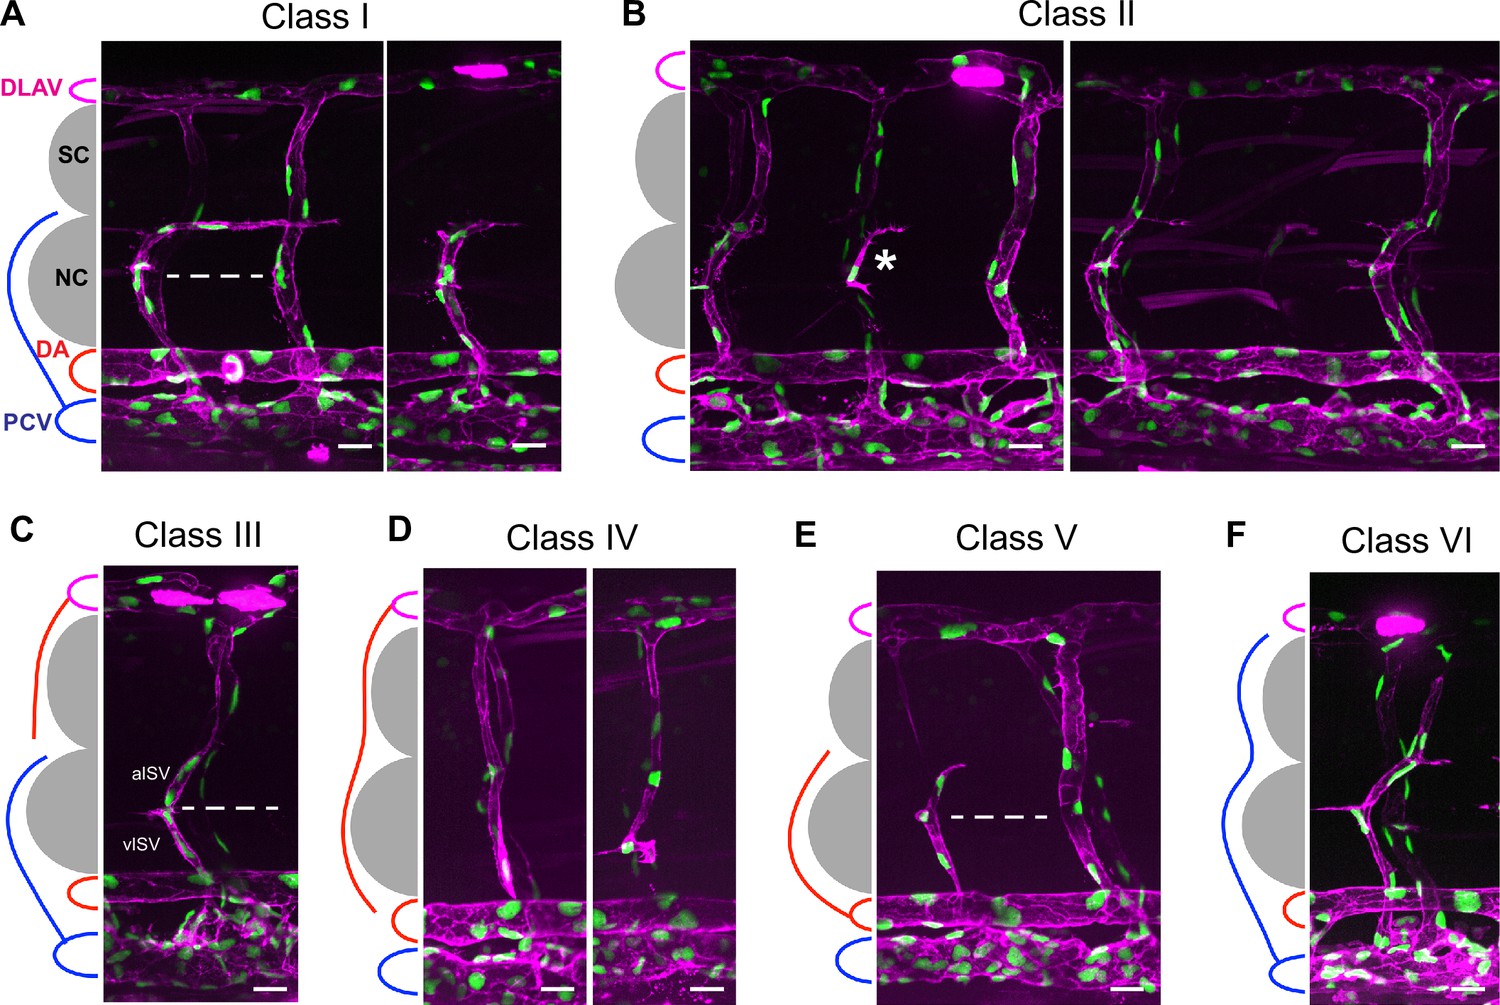
ISV phenotype classification in aqp1a.1rk28/rk28;aqp8a.1rk29/rk29 mutant embryos at 3 dpf.
(A) Class I (76.3% of truncated ISVs). vISV crosses horizontal myoseptum and turns right (posteriorly toward the tail) along the ventral side of the spinal cord. Vessel comprises four ECs. (B) Class II (14.3% of truncated ISVs). Absence of ISV in segmental position (sometimes a single EC is present, which is neither connected to the DA nor DLAV, asterisk). (C) Class III (1.3% of truncated ISVs). vISV does not cross horizontal myoseptum and aISV is not connected to the DA. (D) Class IV (2.8% of truncated ISVs). aISV is not connected to the DA. (E) Class V (2.3% of truncated ISVs). aISV crosses horizontal myoseptum, but has no connection to DLAV. Vessel comprises three ECs. (F) Class VI (3.1% of incomplete ISVs). vISV extends over the notochord and spinal cord, but does not connect to DLAV. In panels (A, C, E), dashed line marks an approximate position of horizontal myoseptum. DA, dorsal aorta; DLAV, dorsal longitudinal anastomotic vessel; EC, endothelial cell; ISV, intersegmental vessel; aISV, arterial ISV; vISV, vein ISV; NC, notochord; PCV, posterior cardinal vein; SC, spinal cord. Scale bar, 20 µm.
Figure 3—figure supplement 5
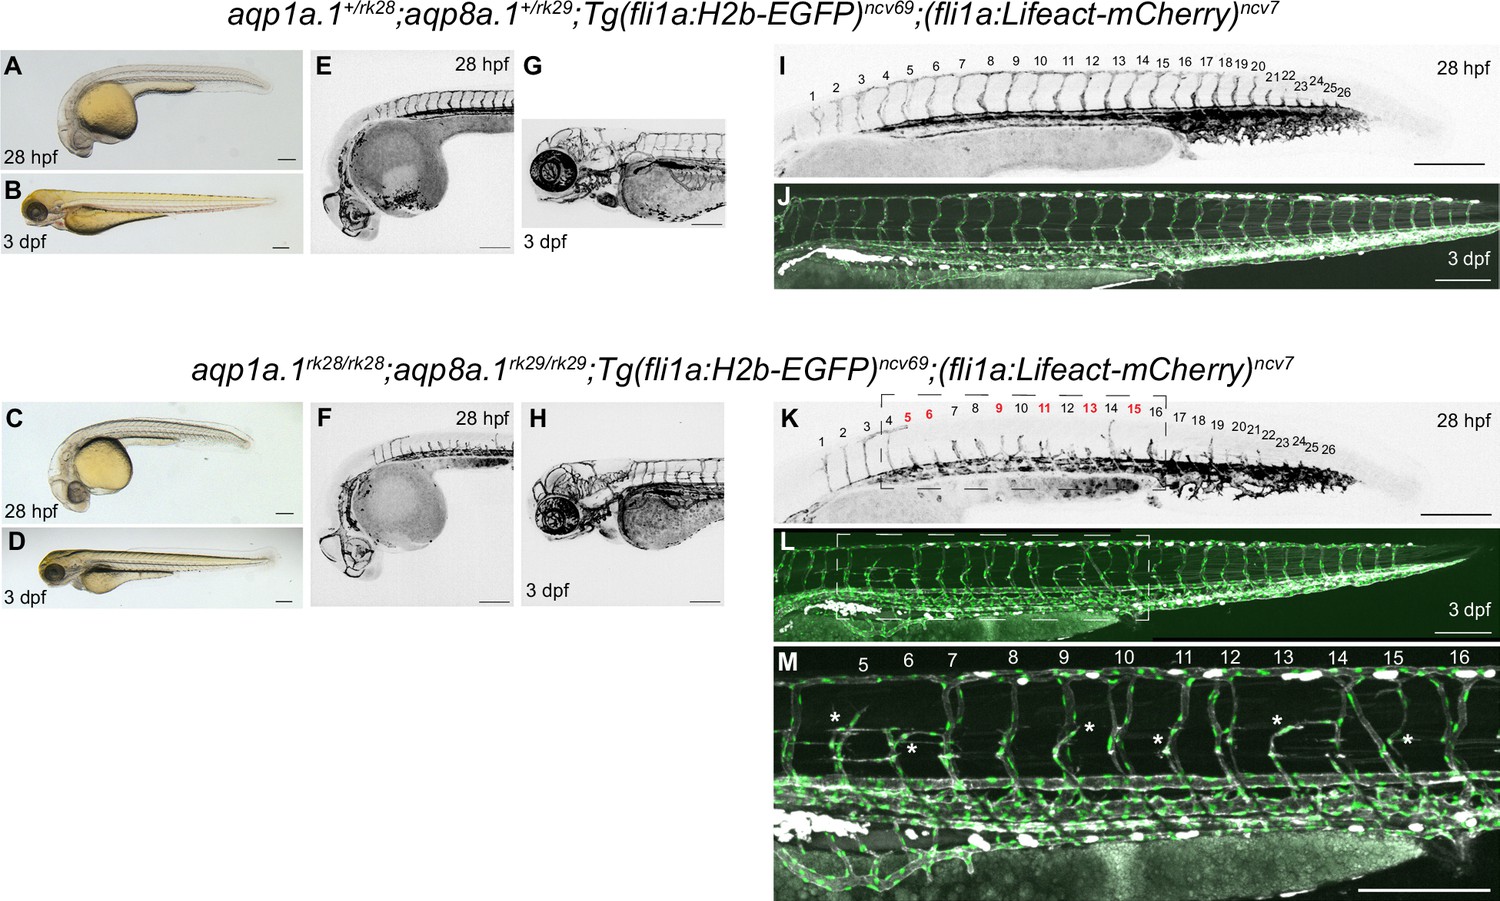
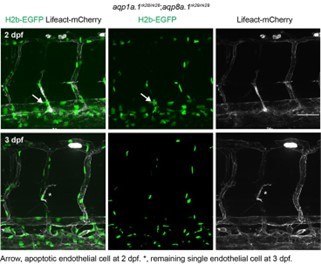
Phenotype of aqp1a.1rk28/rk28;aqp8a.1rk29/rk29 double mutant at 28 hpf and 3 dpf.
The same aqp1a.1+/rk28;aqp8a.1+/rk29 heterozygote and aqp1a.1rk28/rk28;aqp8a.1rk29/rk29 homozygote embryos were imaged at 28 hpf and 3 dpf. (A–D) Brightfield images of 28 hpf (A, C) and 3 dpf (B, D) embryos showing normal gross morphology of aqp1a.1rk28/rk28;aqp8a.1rk29/rk29 embryo. (E–H) Maximum intensity projections of confocal z-stacks of the brain vasculature of 28 hpf (E, F) and 3 dpf (G, H) embryos. (I–M) Maximum intensity projections of confocal z-stacks of the trunk vasculature of 28 hpf (I, K) and 3 dpf (J, L, M) embryos. The trunk and tail were imaged separately and stitched using Fiji stitching plugin to make an entire image. A magnified image of the boxed areas in (K) and (L) is shown in (M). In panel (K), numbers in red correspond to those sprouts (ISV5, ISV6, ISV9, ISV11, ISV13, and ISV15) that will not form complete ISVs at 3 dpf (asterisks in M). Scale bar, 200 µm.
Figure 3—figure supplement 6
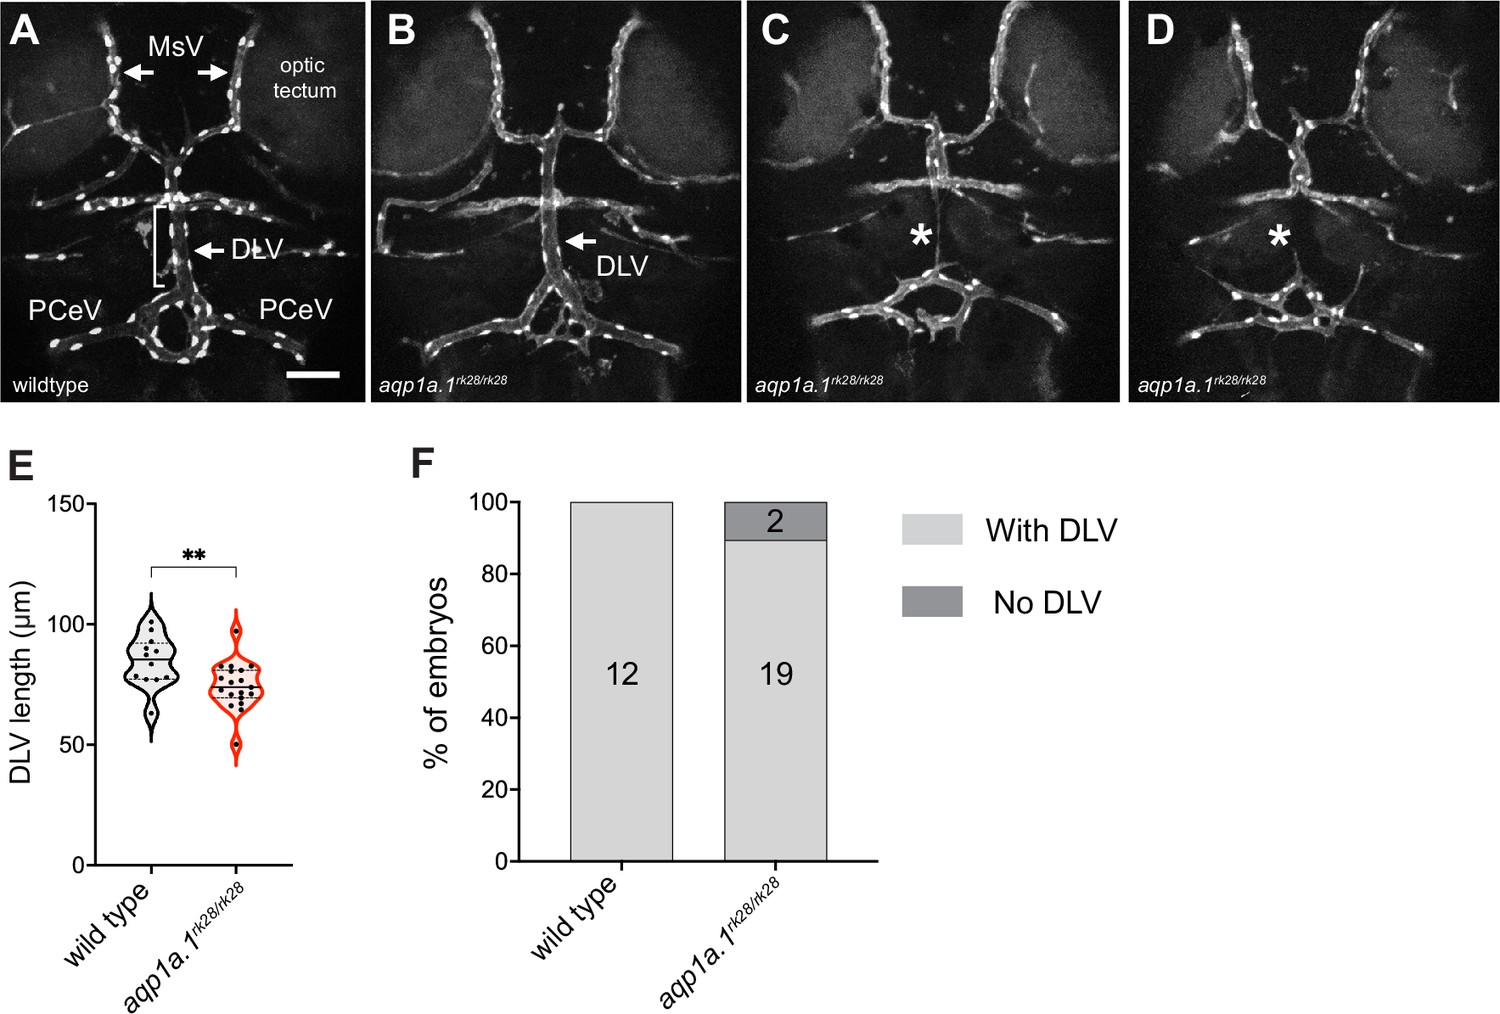
Cerebral vascular formation defects in aqp1a.1 mutant zebrafish.
(A) Dorsal view of 4 dpf wildtype cranial vasculature visualized by Tg(fli1a:H2B-EGFP)ncv69;(fli1:Lifeact-mCherry)ncv7 expression, showing distinct cranial vessels. (B–D) Dorsal view of cranial vasculature of 4 dpf aqp1a.1rk28/rk28 zebrafish, showing one representative embryo with DLV (B, arrow) and two other embryos lacking the DLV (C and D, asterisks). (E) Quantification of DLV lengths in embryos that formed the DLV at 4 dpf (n = 12 wildtype embryos; n = 19 aqp1a.1rk28/rk28 embryos, two independent experiments). Statistical significance was determined by unpaired t-test; **p<0.01. (F) Percentage of the embryos of indicated genotype with and without the DLV at 4 dpf (n = 12 wildtype embryos, n = 21 aqp1a.1rk28/rk28 embryos, two independent experiments). DLV, dorsal longitudinal vein; MsV, mesencephalic vein; PCeV, posterior cerebral vein. Scale bar, 50 µm.
-
Figure 3—figure supplement 6—source data 1
Raw data used to generate panel E.
- https://cdn.elifesciences.org/articles/98612/elife-98612-fig3-figsupp6-data1-v1.xlsx
Figure 3—figure supplement 7
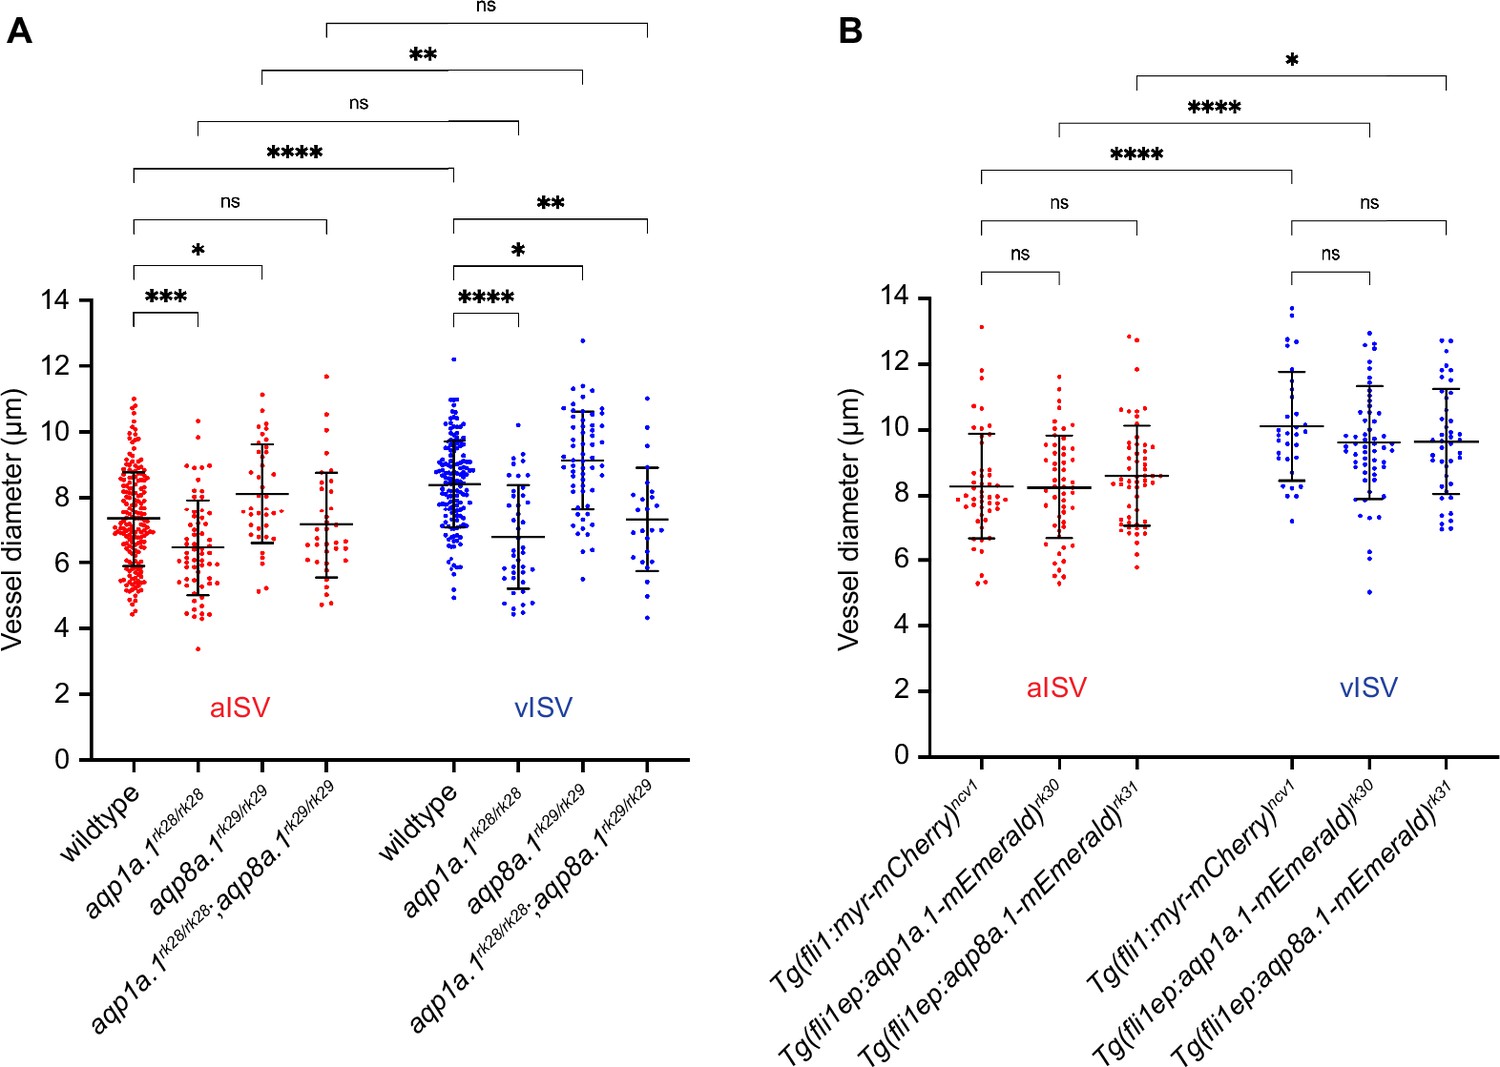
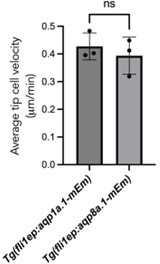
Depletion of aqp1a.1 and aqp8a.1 expression alters vessel diameter.
(A) Quantification of vessel diameter in wildtype and aquaporin mutant embryos at 2 dpf (wildtype: n = 178 aISVs/148 vISVs from 31 embryos; aqp1a.1rk28/rk28: n = 63 aISVs/42 vISVs from 21 embryos; aqp8a.1rk29/rk29: n = 39 aISVs/59 vISVs from 10 embryos; aqp1a.1rk28/rk28;aqp8a.1rk29/rk29: n = 36 aISVs/25 vISVs from 13 embryos). Data collected from three (wildtype) and two (aquaporin mutants) independent experiments. (B) Quantification of vessel diameter in Tg(fli1:myr-mCherry)ncv1 (n = 49 aISVs/32 vISVs from eight embryos), Tg(fli1ep:aqp1a.1-mEmerald)rk30 (n = 53 aISVs/58 vISVs from 15 embryos) and Tg(fli1ep:aqp8a.1-mEmerald)rk31 (n = 56 aISVs/43 vISVs from 12 embryos) transgenic embryos at 2 dpf. Data collected from two independent experiments. Statistical significance was determined by ordinary one-way ANOVA with Sidak’s multiple-comparison test; data is presented as mean ± SD. ns, p>0.05, *p<0.05, **p<0.01, ***p<0.001, and ****p<0.0001. aISV, arterial intersegmental vessel; vISV, venous intersegmental vessel.
-
Figure 3—figure supplement 7—source data 1
Diameter of ISVs in wildtype, aquaporin mutant and aquaporin-overexpressing embryos at 2 dpf.
- https://cdn.elifesciences.org/articles/98612/elife-98612-fig3-figsupp7-data1-v1.xlsx
Figure 4 with 5 supplements
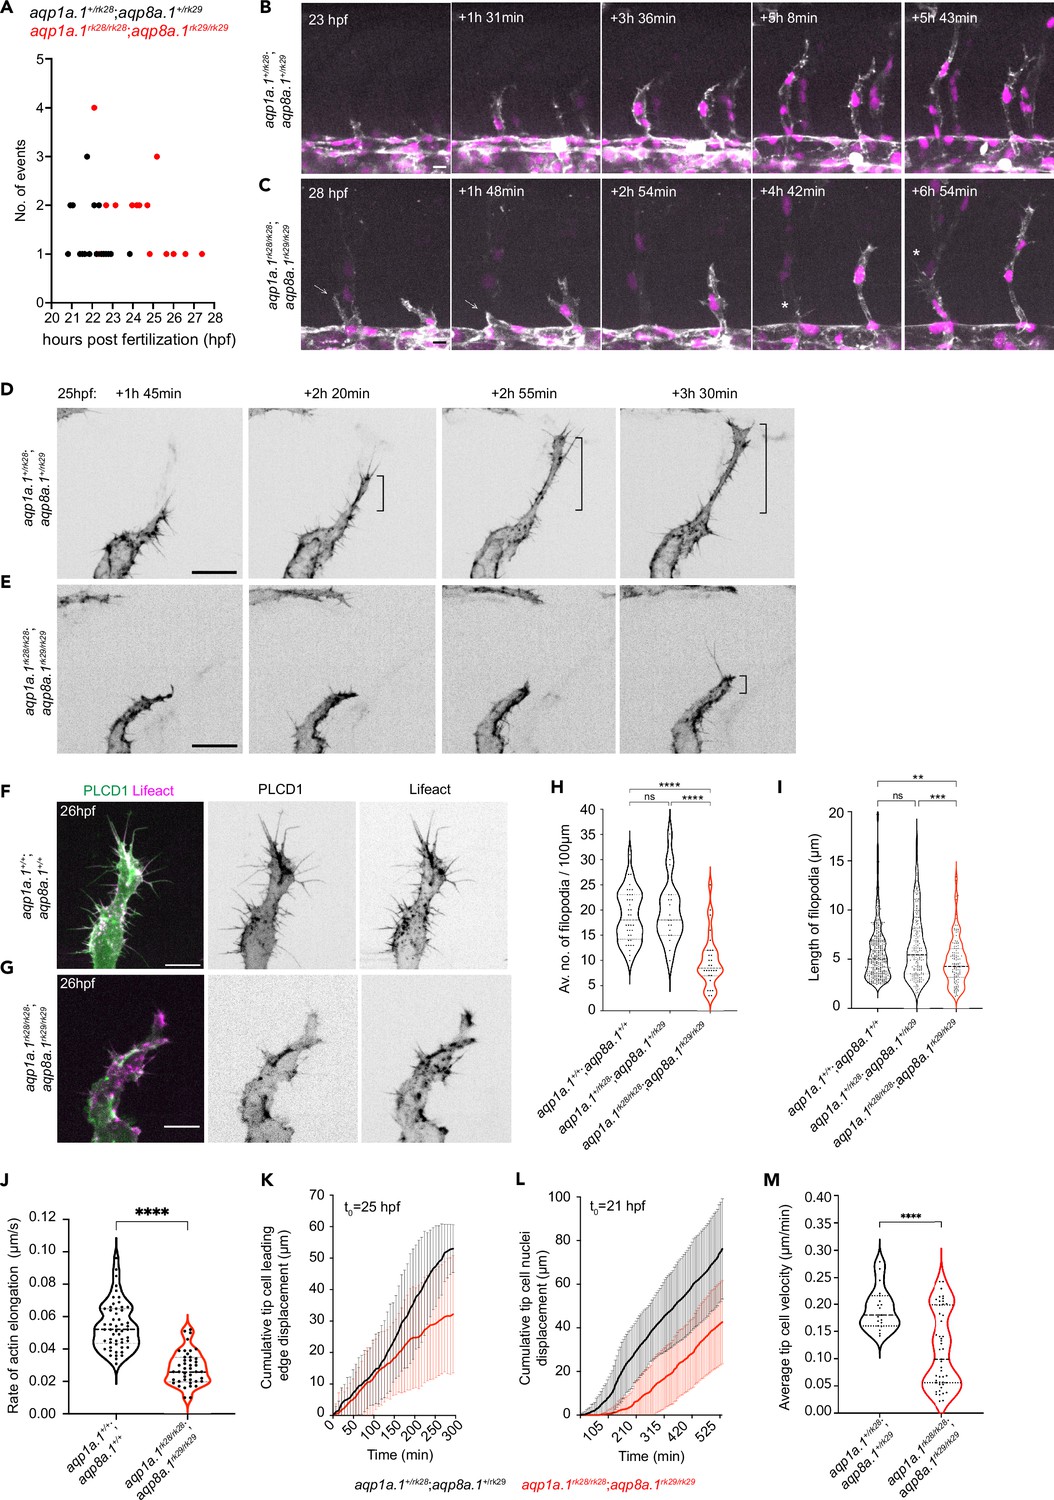
Aquaporins promote endothelial tip cell protrusion and migration.
(A) Timing of tip cell emergence from the dorsal aorta (DA) in aqp1a.1+/rk28;aqp8a.1+/rk29 (n = 23 cells) and aqp1a.1rk28/rk28;aqp8a.1rk29/rk29 (n = 27 cells). (B, C) Still images from time-lapse imaging of migrating tip cells from aqp1a.1+/rk28;aqp8a.1+/rk29 (B) and aqp1a.1rk28/rk28;aqp8a.1rk29/rk29 (C) embryos from 20 hpf to 30 hpf. White arrows, retracting tip cell. *, secondary sprouting from posterior cardinal vein (PCV). Scale bar, 10 µm. (D, E) Stills images from representative time-lapse movies of migrating tip cells in aqp1a.1+/rk28;aqp8a.1+/rk29 (D, n = 2) and aqp1a.1rk28/rk28;aqp8a.1rk29/rk29 (E, n = 5) embryos. Movies were taken from 25 hpf to 30 hpf (n = 2 independent experiments). Bracket, formation of stable protrusions. Scale bar, 20 µm. (F, G) Representative maximum intensity projection confocal z-stacks of tip cells from wildtype (F) and aqp1a.1rk28/rk28;aqp8a.1rk29/rk29 (G) embryos at 26 hpf. Scale bar, 10 µm. (H) Quantification of filopodia number in tip cells of wildtype (n = 36 cells from 10 embryos, two independent experiments), aqp1a.1+/rk28;aqp8a.1+/rk29 (n = 19 cells from six embryos, two independent experiments), and aqp1a.1rk28/rk28;aqp8a.1rk29/rk29 (n = 28 cells from nine embryos, two independent experiments) embryos. (I) Quantification of filopodia length in tip cells of wildtype (n = 24 cells from seven embryos, two independent experiments), aqp1a.1+/rk28;aqp8a.1+/rk29 (n = 16 cells from seven embryos, two independent experiments), and aqp1a.1rk28/rk28;aqp8a.1rk29/rk29 (n = 11 cells from six embryos, two independent experiments) embryos. (J) Growth rate of actin bundles in tip cell filopodia in 25 hpf wildtype (n = 12 cells from seven embryos, two independent experiments) and aqp1a.1rk28;aqp8a.1rk29 (n = 12 cells from six embryos, two independent experiments) embryos. (K) Quantification of tip cell leading edge displacement of aqp1a.1+/rk28;aqp8a.1+/rk29 (n = 19 cells from five embryos, three independent experiments) and aqp1a.1rk28/rk28;aqp8a.1rk29/rk29 (n = 47 cells from 13 embryos, six independent experiments) embryos at 25–30 hpf; data is presented as mean ± SD. (L) Quantification of tip cell nuclei displacement of aqp1a.1+/rk28;aqp8a.1+/rk29 (n = 20 cells from six embryos, four independent experiments) and aqp1a.1rk28/rk28;aqp8a.1rk29/rk29 (n = 20 cells from four embryos, two independent experiments) embryos at 21–30 hpf; data is presented as mean ± SD. (M) Quantification of tip cell migration velocity in aqp1a.1+/rk28;aqp8a.1+/rk29 (n = 19 cells from five embryos, three independent experiments) and aqp1a.1rk28/rk28;aqp8a.1rk29/rk29 (n = 47 cells from 13 embryos, six independent experiments) embryos at 25–30 hpf. Statistical significance was determined by Brown–Forsythe and Welch ANOVA tests with Dunnett’s (H) or Sidak’s (I) multiple-comparisons test, and with unpaired t-test (J, M). ns, p>0.05, **p<0.01, ***p<0.001, and ****p<0.0001.
-
Figure 4—source data 1
Raw data used to generate panels A, H-M.
- https://cdn.elifesciences.org/articles/98612/elife-98612-fig4-data1-v1.xlsx
Figure 4—figure supplement 1
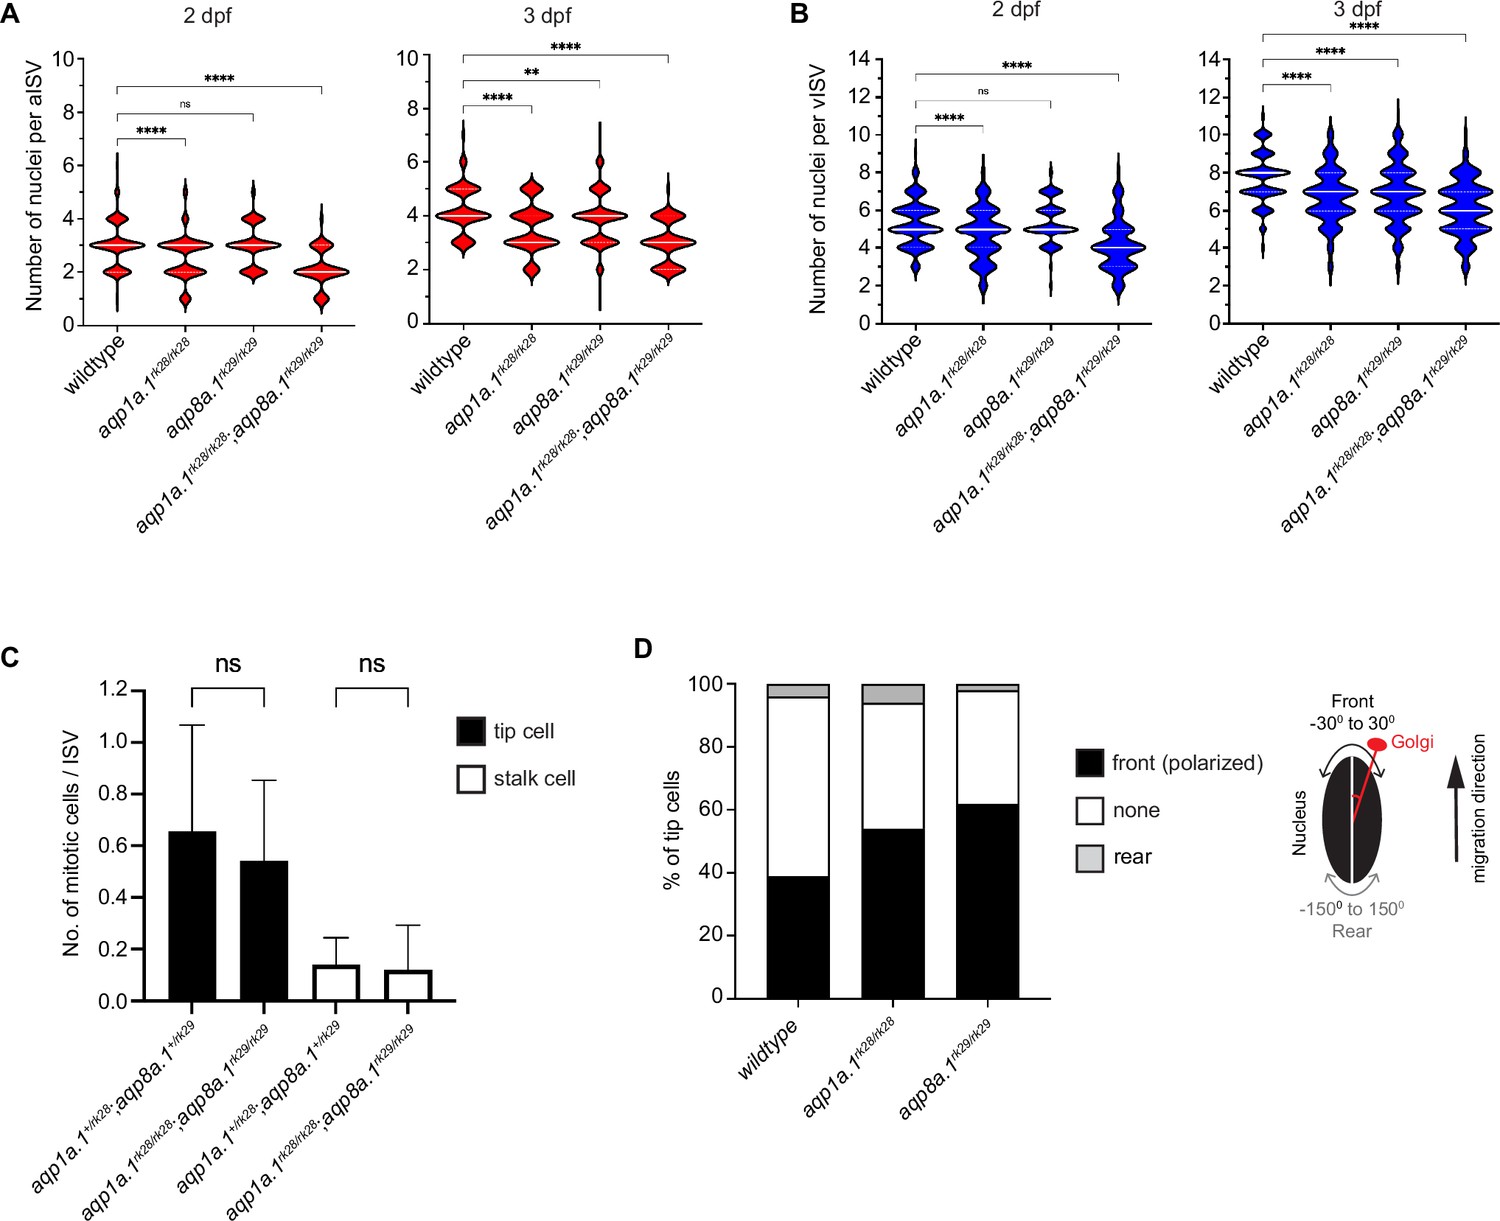
Reduction in endothelial cell (EC) number per ISV in aqp1a.1rk28/rk28;aqp8a.1rk29/rk29 embryos.
(A) Quantification of EC number in arterial ISVs (aISVs) of wildtype and aquaporin mutant embryos at 2 dpf (wildtype: n = 273 aISVs from 31 embryos; aqp1a.1rk28/rk28: n = 189 aISVs from 21 embryos; aqp8a.1rk29/rk29: n = 84 aISVs from 10 embryos; aqp1a.1rk28/rk28;aqp8a.1rk29/rk29: n = 65 aISVs from 13 embryos) and 3 dpf (wildtype: n = 98 aISVs from 10 embryos; aqp1a.1rk28/rk28: n = 86 aISVs from 20 embryos; aqp8a.1rk29/rk29: n = 175 aISVs from 22 embryos; aqp1a.1rk28/rk28;aqp8a.1rk29/rk29: n = 102 aISVs from 22 embryos). Data collected from three (wildtype) and two (aquaporin mutants) independent experiments. (B) Quantification of EC number in venous ISVs (vISVs) of wildtype and aquaporin mutant embryos at 2 dpf (wildtype: n = 266 vISVs from 31 embryos; aqp1a.1rk28/rk28: n = 143 vISVs from 21 embryos; aqp8a.1rk29/rk29: n = 121 vISVs from 10 embryos; aqp1a.1rk28/rk28;aqp8a.1rk29/rk29: n = 95 vISVs from 13 embryos) and 3 dpf (wildtype: n = 121 vISVs from 10 embryos; aqp1a.1rk28/rk28: n = 143 vISVs from 20 embryos; aqp8a.1rk29/rk29: n = 280 vISVs from 22 embryos; aqp1a.1rk28/rk28;aqp8a.1rk29/rk29: n = 160 vISVs from 22 embryos). Data collected from three (wildtype) and two (aquaporin mutants) independent experiments. (C) Quantification of number of mitotic events per ISV in aqp1a.1+/rk28;aqp8a.1+/rk29 and aqp1a.1rk28/rk28;aqp8a.1rk29/rk29 embryos from 21 hpf to 30 hpf (aqp1a.1+/rk28;aqp8a.1+/rk29, n = 34 ISVs from five embryos, four independent experiments; aqp1a.1rk28/rk28;aqp8a.1rk29/rk29, n = 43 ISVs from nine embryos, three independent experiments). Data is presented as mean ± SD. (D) Quantification of tip cell polarization in wildtype (n = 79 cells from 10 embryos), aqp1a.1rk28/rk28 (n = 35 cells from 16 embryos) and aqp8a.1rk29/rk29 (n = 90 cells from nine embryos) embryos at 24–26 hpf. The orientation of the Golgi apparatus relative to the nucleus was assessed to determine cell polarization: the position of the Golgi apparatus within –30° ~+30° angle of the direction of cell migration was considered as polarized. Data collected from two independent experiments. Statistical significance was determined by ordinary one-way ANOVA with Sidak’s multiple-comparisons test (A, B) and unpaired t-test (C). ns, p>0.05, **<0.01, and ****p<0.0001. ISV, intersegmental vessel.
-
Figure 4—figure supplement 1—source data 1
Raw data used to generate panels A-C.
- https://cdn.elifesciences.org/articles/98612/elife-98612-fig4-figsupp1-data1-v1.xlsx
Figure 4—video 1
Sprouting angiogenesis in aqp1a.1+/rk28;aqp8a.1+/rk29 heterozygote embryos.
Live imaging of aqp1a.1+/rk28;aqp8a.1+/rk29 heterozygote embryos in Tg(fli1a:H2B-EGFP)ncv69;(fli1:Lifeact-mCherry)ncv7 double transgenic background from 22 hpf to 30 hpf (7 min time interval). 00:00, hour:minutes post fertilization.
Figure 4—video 2
Defective sprouting angiogenesis in aqp1a.1rk28//rk28;aqp8a.1+rk29/rk29 embryos.
Live imaging of aqp1a.1rk28/rk28;aqp8a.1rk29/rk29 mutant embryos in Tg(fli1a:H2B-EGFP)ncv69;(fli1:Lifeact-mCherry)ncv7 double transgenic background from 28 hpf to 40 hpf (6 min time interval). 00:00, hour:minutes post fertilization. Arrows point the retraction of tip cell protrusions and the failure of tip cells to invade into the zebrafish trunk from the dorsal aorta.
Figure 4—video 3
Tip cells form an elongated protrusion in the direction of migration during sprouting angiogenesis.
Live imaging of aqp1a.1+/rk28;aqp8a.1+/rk29 heterozygote embryos in Tg(fli1:Lifeact-mCherry)ncv7 transgenic background from 25 hpf to 30 hpf (7 min time interval). 00:00, hour:minutes post fertilization.
Figure 4—video 4
Defective tip cell leading edge expansion in aqp1a.1rk28/rk28;aqp8a.1rk29/rk29 embryos.
Live imaging of aqp1a.1rk28/rk28;aqp8a.1rk29/rk29 mutant embryos in Tg(fli1:Lifeact-mCherry)ncv7 transgenic background from 25 hpf to 30 hpf (7 min time interval). 00:00, hour:minutes post fertilization.
Figure 5
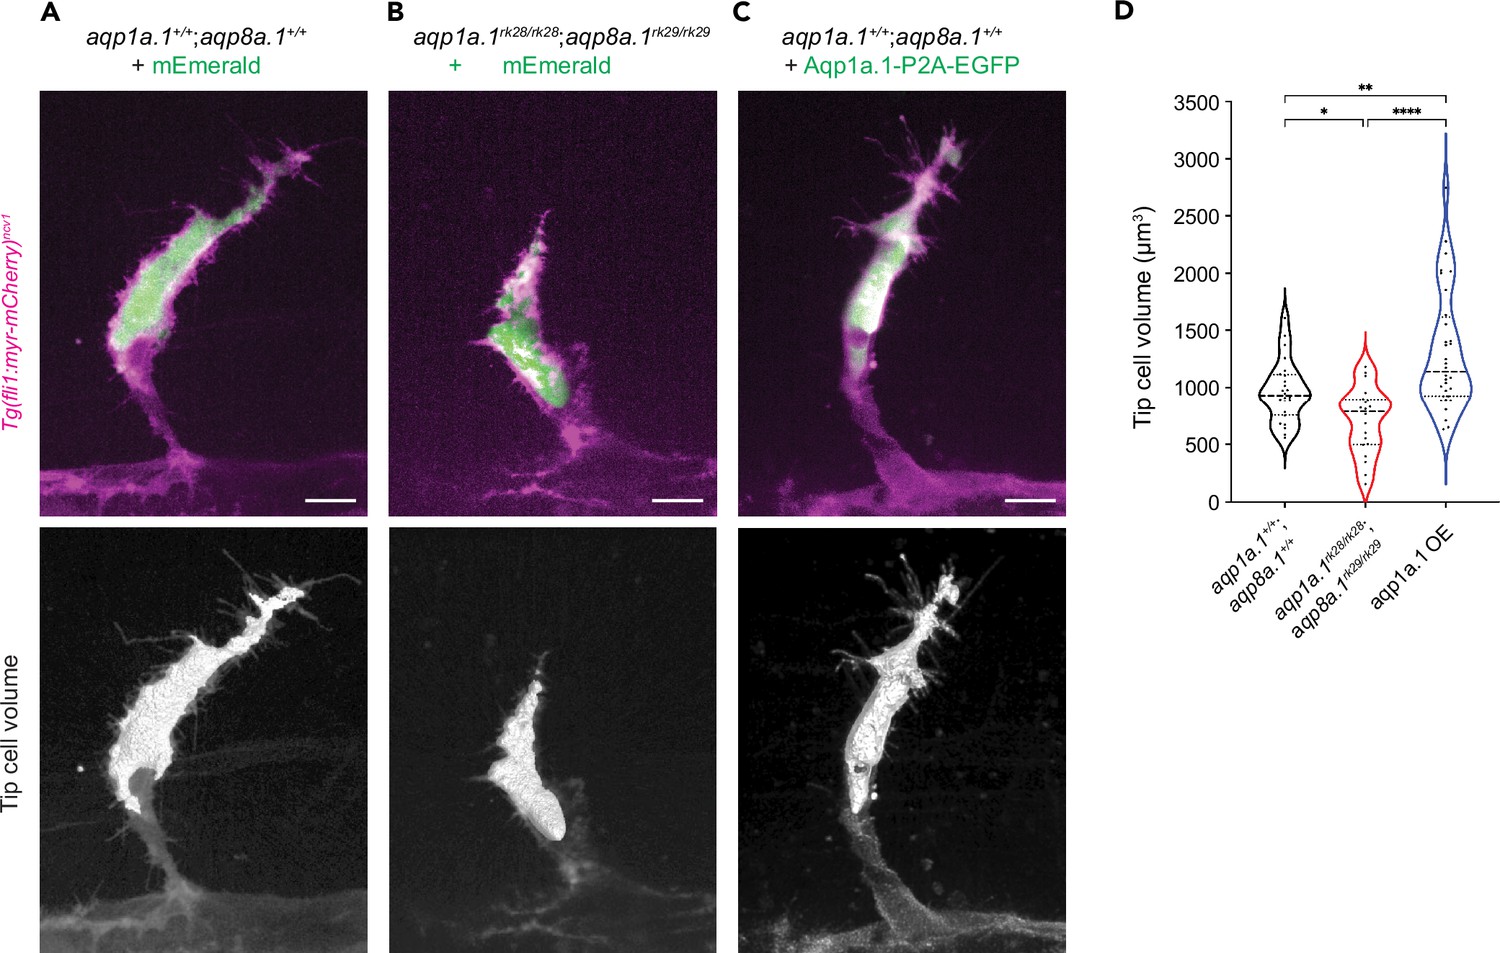
Aquaporin-mediated water influx increases tip cell volume.
(A–C) Representative maximum intensity projection confocal z-stacks of tip cell and its 3D-volume rendering of 25 hpf wildtype (A), aqp1a.1rk28/rk28;aqp8a.1rk29/rk29 (B) and wildtype embryos overexpressing Aqp1a.1 (C) labeled with cytosolic mEmerald or EGFP. Scale bar, 10 µm. (D) Quantification of tip cell volume in 25 hpf wildtype (n = 24 cells) and aqp1a.1rk28/rk28;aqp8a.1rk29/rk29 (n = 20 cells) and wildtype overexpressing Aqp1a.1 (n = 32 cells) embryos from three independent experiments. Statistical significance was determined by Brown–Forsythe and Welch ANOVA tests. *p<0.05, **p<0.01, and ****p<0.0001.
-
Figure 5—source data 1
Raw data used to generate panel D.
- https://cdn.elifesciences.org/articles/98612/elife-98612-fig5-data1-v1.xlsx
Figure 6 with 1 supplement

The chloride channel SWELL1 promotes endothelial cell (EC) migration and sprouting angiogenesis.
(A, B) UMAP plots showing co-expression of lrrc8aa and aqp1a.1 (A), and lrrc8aa and aqp8a.1 (B) in ECs from 24 hpf, 34 hpf, and 3 dpf embryos. (C–E) Detection of aqp1a.1, aqp8a.1, and lrrc8aa mRNA by RNAscope in situ hybridization in 22 hpf zebrafish embryo. Representative maximum intensity projection rendering of confocal z-stacks of tip and stalk cells (C). (D) and (E) show surface rendering of image (C) where only endothelial expression of lrrc8aa is shown after masking. Scale bar, 10 µm. (F, G) Representative maximum intensity projection confocal z-stacks of 26 hpf wildtype embryos treated with 0.05% EtOH (F) or 5 µM DCPIB (G) from 20 hpf to 26 hpf (control, n = 16 embryos; DCPIB, n = 18 embryos; two independent experiments). Scale bar, 50 µm. (H) Quantification of intersegmental vessel (ISV) length in 26 hpf wildtype embryos treated with 0.05% EtOH or 5 µM DCPIB (control, n = 133 vessels from 16 embryos; DCPIB, 157 vessels from 18 embryos; two independent experiments). (I) Quantification of tip cell leading edge displacement of wildtype embryos treated with 0.05% EtOH (n = 29 cells from seven embryos, two independent experiments) or 5 µM DCPIB (n = 29 cells from eight embryos, three independent experiments) at 25–30 hpf; data is presented as mean ± SD. (J) Quantification of tip cell migration velocity in wildtype treated with 0.05% EtOH (n = 29 cells from seven embryos, two independent experiments) or 5 µM DCPIB (n = 29 cells from eight embryos, three independent experiments) at 25–30 hpf. (K) Filopodia number in tip cells of wildtype embryos treated with 0.05% EtOH (n = 34 vessels from nine embryos, three independent experiments) or 5 µM DCPIB (n = 53 vessels from 16 embryos, three independent experiments). (L) Filopodia length in tip cells of wildtype embryos treated with 0.05% EtOH (n = 34 vessels from nine embryos, three independent experiments) or 5 µM DCPIB (n = 53 vessels from 12 embryos, three independent experiments). Statistical significance was determined with unpaired t-test; ****p<0.0001 (H, J, K, and L). (M, N) Still images from representative time-lapse movies of migrating tip cells in wildtype embryos treated with 0.05% EtOH (M, n = 7) or 5 µM DCPIB (N, n = 8). Movies were taken from 25 to 30 hpf (n = 3 independent experiments). Bracket, formation of stable protrusions. Scale bar, 20 µm.
-
Figure 6—source data 1
Raw data used to generate panels H-L.
- https://cdn.elifesciences.org/articles/98612/elife-98612-fig6-data1-v1.xlsx
Figure 6—video 1
The chloride channel SWELL1 promotes EC migration and sprouting angiogenesis.
Live imaging of Tg(fli1:EGFP-Hsa.PLCD1)rk26;(fli1:Lifeact-mCherry)ncv7 embryos from 25 hpf to 30 hpf (5 min time interval). Embryos were treated either with 0.05% EtOH or 5 µM DCPIB from 20 hpf to 25 hpf and then imaged. 00:00, hours:minutes post fertilization.
Figure 7 with 1 supplement
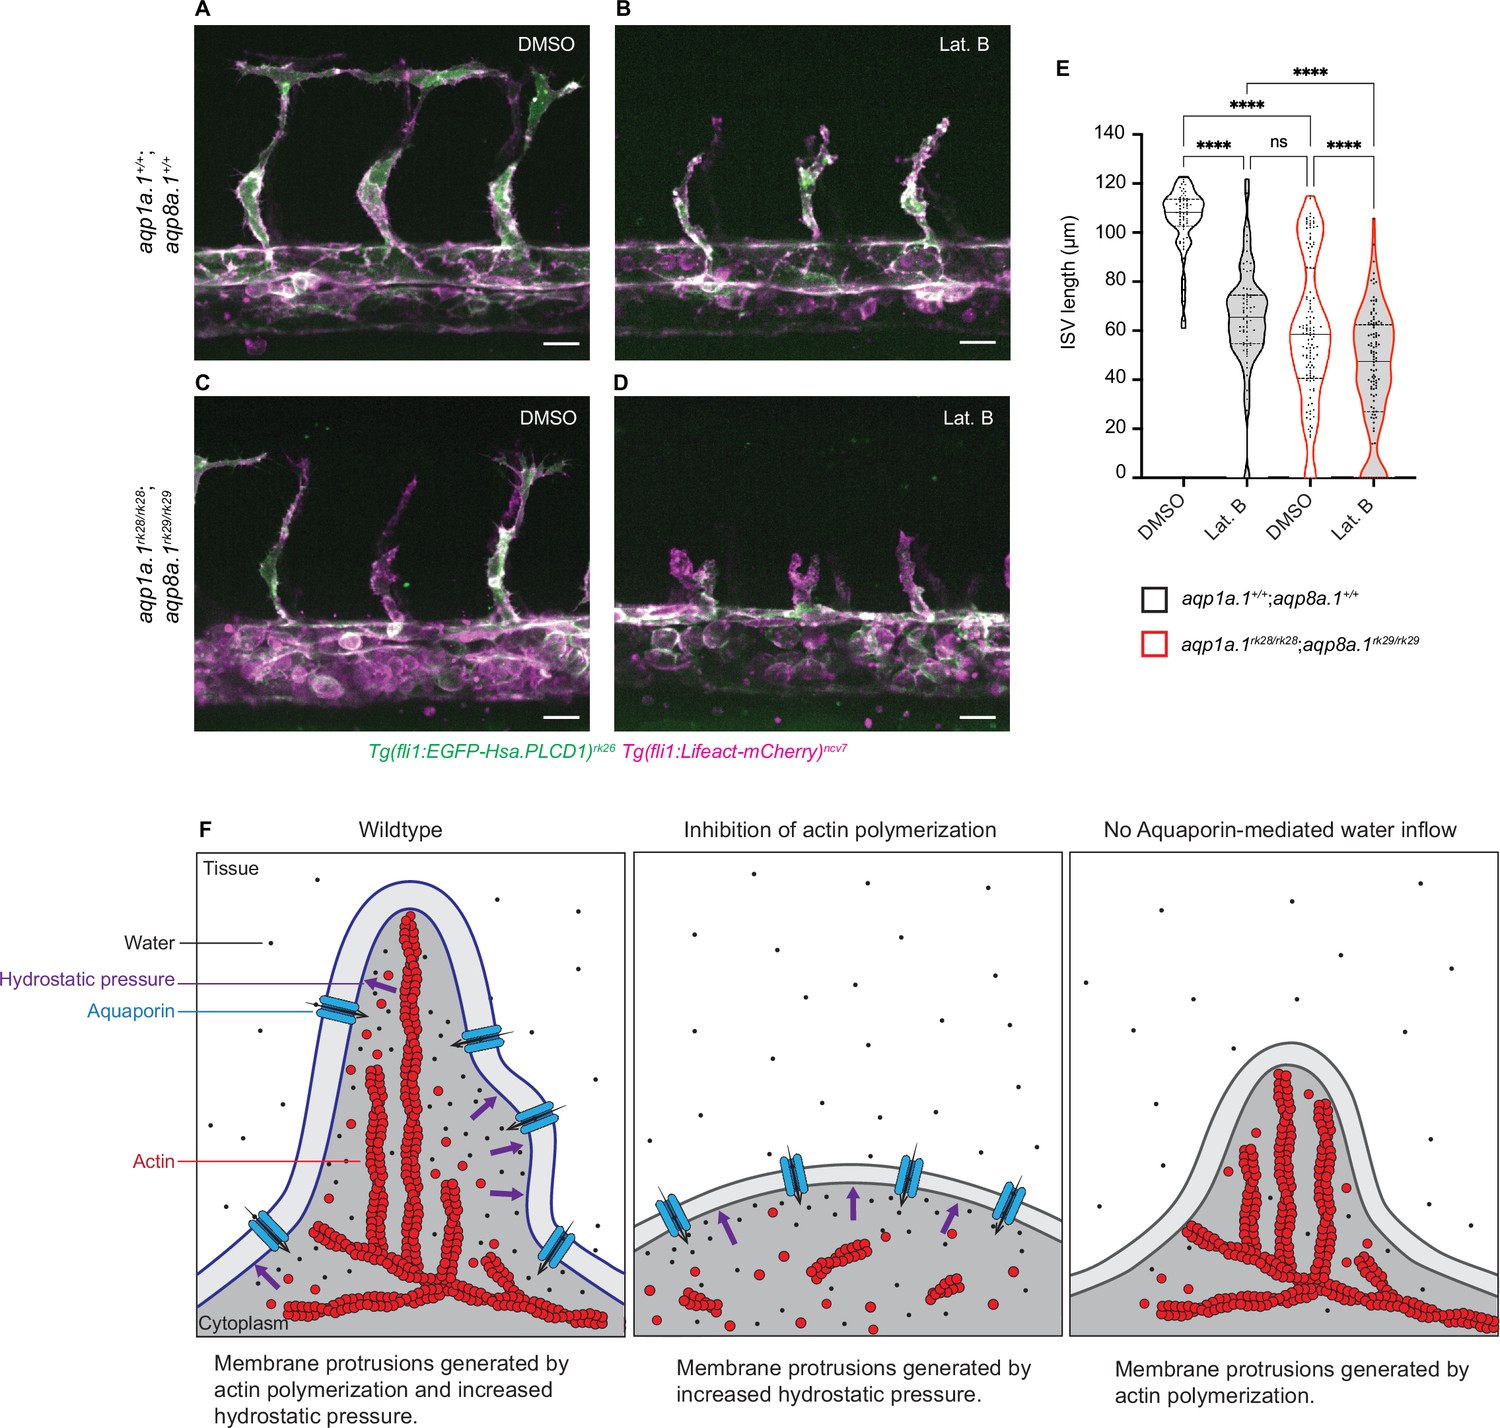
Additive function of actin polymerization and hydrostatic pressure in driving endothelial cell (EC) migration and sprouting angiogenesis.
(A–D) Representative maximum intensity projection confocal z-stacks of 28 hpf wildtype (A, B) and aqp1a.1rk28/rk28;aqp8a.1rk29/rk29 (C, D) embryos treated with 0.1% DMSO (A, C) or 0.8 µg/ml Lat. B (B, D) from 20 hpf to 28 hpf (for each condition: wildtype, n = 10 embryos; aqp1a.1rk28/rk28;aqp8a.1rk29/rk29, n = 12 embryos, two independent experiments). Scale bar, 20 µm. (E) Intersegmental vessel (ISV) length in 28 hpf wildtype and aqp1a.1rk28/rk28;aqp8a.1rk29/rk29 embryos treated with 0.1% DMSO or 0.8 µg/ml Lat. B (wildtype: n = 60 vessels from 10 control embryos, n = 66 vessels from 10 Lat. B-treated embryos; aqp1a.1rk28;aqp8a.1rk29: n = 126 vessels from 12 control embryos, n = 112 vessels from 11 Lat. B-treated embryos, two independent experiments). Statistical significance was determined by Brown–Forsythe ANOVA test with Sidak’s multiple-comparisons test; ns, p>0.05, **p<0.01, and ****p<0.0001. (F) Model of endothelial tip cell migration. Tip cells generate membrane protrusions by actin polymerization and increased hydrostatic pressure via Aquaporin-mediated water inflow. In the absence of actin polymerization and presence of Aquaporins, hydrostatic pressure deforms membranes to generate membrane protrusions. When Aquaporin function is lost, membrane protrusions is generated by actin polymerization. Fewer membrane protrusions are formed when only one mechanism is utilized, resulting in slower EC migration.
-
Figure 7—source data 1
Raw data used to generate panel E.
- https://cdn.elifesciences.org/articles/98612/elife-98612-fig7-data1-v1.xlsx
Figure 7—video 1
Additive function of actin polymerization and hydrostatic pressure in driving EC migration and sprouting angiogenesis.
Live imaging of wildtype and aqp1a.1rk28/rk28;aqp8a.1rk29/rk29 mutant embryos in Tg(fli1:EGFP-Hsa.PLCD1)rk26;(fli1:Lifeact-mCherry)ncv7 double transgenic background. Embryos were treated either with DMSO or Latrunculin B from 20 to 28 hpf.
Author response image 1
Author response image 2
Author response image 3
Tables
Key resources table
| Reagent type (species) or resource | Designation | Source or reference | Identifiers | Additional information |
|---|---|---|---|---|
| Strain, strain background (Danio rerio) | AB | Zebrafish International Resource Center | RRID:ZIRC_ZL1 | |
| Strain, strain background (Danio rerio) | Tg(kdrl:EGFP)s843 | Jin et al., 2005 | ZFIN:ZDB-ALT-050916-14 | |
| Strain, strain background (Danio rerio) | Tg(fli1:zgc:114046-EGFP)ncv69 | Ando et al., 2019 | ZFIN:ZDB-ALT-200226-15 | Referred to as Tg(fli1a:H2B-EGFP)ncv69 |
| Strain, strain background (D. rerio) | Tg(fli1:Lifeact-mCherry)ncv7 | Wakayama et al., 2015 | ZFIN:ZDB-ALT-150603–1 | |
| Strain, strain background (Danio rerio) | Tg(fli1:myr-mCherry)ncv1 | Fukuhara et al., 2014 | ZFIN:ZDB-ALT-131216–1 | |
| Strain, strain background (Danio rerio) | Tg(fli1:EGFP-Hsa.PLCD1)rk26 | Kondrychyn et al., 2020 | ZFIN:ZDB-ALT-201118-4 | |
| Strain, strain background (Danio rerio) | Tg(kdrl:Hsa.HRAS-mCherry)s916 | Hogan et al., 2009 | ZFIN:ZDB-ALT-090506-2 | |
| Strain, strain background (Danio rerio) | "Tg(kdrl:nls-EGFP)ubs1;(fli1:Hsa.B4GALT1-mCherry)bns9" | Kwon et al., 2016 | ZFIN:ZDB-ALT-081105–1; ZFIN:ZDB-ALT-160804–2 | |
| Strain, strain background (Danio rerio) | Tg(fli1:GAL4FF)ubs3 | Herwig et al., 2011 | ZFIN:ZDB-ALT-120113-6 | |
| Strain, strain background (Danio rerio) | Tg(fli1ep:aqp1a.1-mEmerald)rk30 | This study | See Materials and methods ‘Plasmid construction and transgenesis’ | |
| Strain, strain background (Danio rerio) | Tg(fli1ep:aqp8a.1-mEmerald)rk31 | This study | See Materials and methods ‘Plasmid construction and transgenesis’ | |
| Cell line (Homo sapiens) | HAEC-Human Aortic Endothelial Cells | Lonza | Lonza:CC-2535 | lot-20TL231227 |
| Antibody | Anti-digoxigenin (sheep polyclonal) Fab fragments, conjugated with alkaline phosphatase | Roche | Roche:11093274910; RRID:AB_514497 | Whole-mount in situ hybridization (1:5000) |
| Recombinant DNA reagent | mEmerald-N1 (plasmid) | Addgene | RRID:Addgene_53976 | A source of mEmerald protein for In-Fusion cloning |
| Recombinant DNA reagent | Ds-MCS (plasmid) | Emelyanov et al., 2006 | N/A | The minimal cis-required sequences of Dissociation (Ds) element from the maize (used in In-Fusion cloning) |
| Recombinant DNA reagent | NLS-AcTP-SP6 (plasmid) | Emelyanov et al., 2006 | N/A | Activator (Ac) transposase cDNA from the maize |
| Recombinant DNA reagent | Ds-fli1ep:NLS-EGFP-P2A-mKate2-GM130 (plasmid) | This study | In-Fusion cloning | |
| Recombinant DNA reagent | Ds-6xUAS:aqp1a.1-P2A-EGFP-T2A-mKate2-CAAX (plasmid) | This study | In-Fusion cloning | |
| Recombinant DNA reagent | Ds-kdrl:mEmerald (plasmid) | This study | In-Fusion cloning | |
| Sequence-based reagent | RNAscope Probe-Dr-aqp1a.1 | Advanced Cell Diagnostics | ADC:893521 | |
| Sequence-based reagent | RNAscope Probe-Dr-aqp8a.1-C3 | Advanced Cell Diagnostics | ADC:802961-C3 | |
| Sequence-based reagent | RNAscope Probe-Dr-lrrc8aa-C2 | Advanced Cell Diagnostics | ADC:1596611-C2 | |
| Software, algorithm | Huygens Essential 22.10 | Scientific Volume Imaging B.V. | RRID:SCR_014237 | https://svi.nl/Huygens-Essential |
| Software, algorithm | Fiji | Schindelin et al., 2012 | RRID:SCR_002285 | https://fiji.sc |
| Software, algorithm | Cell Ranger v2.1 | 10X Genomics | RRID:SCR_017344 | https://www.10xgenomics.com/support/software/cell-ranger |
| Software, algorithm | Seurat package v4.3.0 | Hao et al., 2021 | RRID:SCR_016341 | https://satijalab.org/seurat |
| Software, algorithm | ShinyCell package v2.1 | Ouyang et al., 2021 | RRID:SCR_022756 | https://github.com/SGDDNB/ShinyCell |
| Software, algorithm | Prism v10.2.0 | GraphPad | RRID:SCR_002798 | https://www.graphpad.com |
| Software, algorithm | QuantStudio Design and Analysis software v1.5.3 | Applied Biosystems | N/A | https://www.thermofisher.com |
Additional files
-
Supplementary file 1
Plasmids used in this study.
- https://cdn.elifesciences.org/articles/98612/elife-98612-supp1-v1.xlsx
-
Supplementary file 2
Oligonucleotides used in this study.
- https://cdn.elifesciences.org/articles/98612/elife-98612-supp2-v1.xlsx
-
MDAR checklist
- https://cdn.elifesciences.org/articles/98612/elife-98612-mdarchecklist1-v1.docx
Download links
A two-part list of links to download the article, or parts of the article, in various formats.
Downloads (link to download the article as PDF)
Open citations (links to open the citations from this article in various online reference manager services)
Cite this article (links to download the citations from this article in formats compatible with various reference manager tools)
Combined forces of hydrostatic pressure and actin polymerization drive endothelial tip cell migration and sprouting angiogenesis
eLife 13:RP98612.
https://doi.org/10.7554/eLife.98612.3


