PIM kinase control of CD8 T cell protein synthesis and cell trafficking
- Cell Signalling and Immunology Division, School of Life Sciences, University of Dundee, United Kingdom
- Molecular Cell and Developmental Biology Division, School of Life Sciences, University of Dundee, United Kingdom
Figures
Figure 1 with 2 supplements
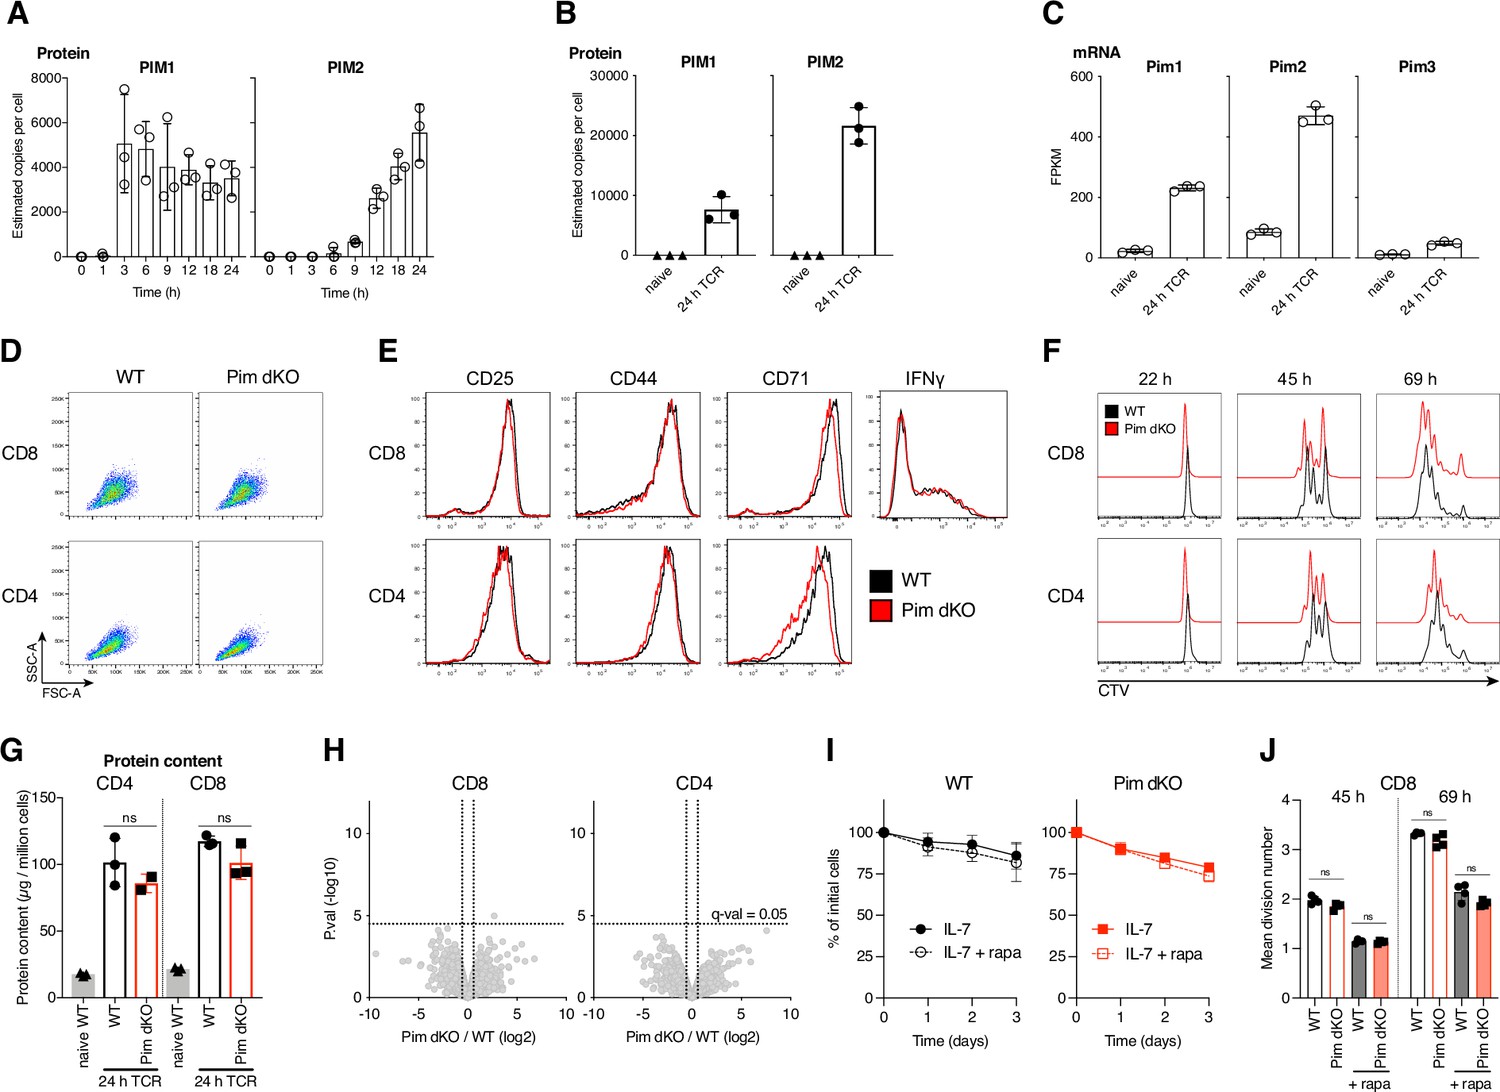
Pim1 and Pim2 are strongly TCR-induced, but dispensable for T cell activation.
Estimated copies per cell of PIM1 and PIM2 protein from quantitative proteomics analysis of (A) OT1 CD8 T cells stimulated with SIINFEKL peptide for indicated times from published dataset (Marchingo et al., 2020) or (B) naive ex vivo and 24 hr αCD3/αCD28 (TCR) activated WT CD8 T cells (see (G, H)) for further details. (C) Fragments per kilobase million (FPKM) of Pim1, Pim2, and Pim3 mRNA from published (Spinelli et al., 2021) bulk RNAseq analysis of naive and 24 hr gp33-41 peptide stimulated P14 CD8 T cells. Lymph node cell suspensions from C57BL/6 (WT) and Pim1KO/Pim2KO (Pim dKO) mice were activated for 24 hr with αCD3/αCD28 (both 0.5 µg/mL) and CD4 and CD8 T cell (D) FSC-A SSC-A profiles, (E) expression of surface activation markers (CD25, CD44, CD71) or CD8 T cell intracellular IFNγ were measured by flow cytometry. (F) Lymph node single-cell suspensions from WT and Pim dKO mice were labelled with CellTrace Violet (CTV), activated with αCD3/αCD28 (both 0.5 µg/mL) and CD4 and CD8 T cell CTV proliferation profiles were measured at indicated time points. (G, H) Lymph node cell suspensions from WT and Pim dKO mice were stimulated for 24 hr with αCD3/αCD28 (both 0.5 µg/mL) and activated CD4 and CD8 T cells were sorted for analysis by quantitative proteomics. Data was analysed using proteomic ruler method (Wiśniewski et al., 2014) to estimate protein copy number per cell. An interactive version of the proteomics expression data is available for exploration on the Immunological Proteome Resource website: immpres.co.uk (G) Total protein content (µg/million cells) (one-way ANOVA), (H) Volcano plots of p-value (-log10) versus fold-change (log2) in protein copy number between Pim dKO and WT. Horizontal dotted line represents multi-test correction cut-off of q=0.05, vertical dotted line shows 1.5-fold change. Phosphoribosyl Pyrophosphate synthase 1 like 1 (Prps1l1), was found to be higher in Pim dKO CD8 T cells, but was a low confidence quantification (based on only two unique peptides) with no known function in T cells. Lymph node single-cell suspensions from WT and Pim dKO mice were labelled with CellTrace Violet (CTV) and (I) cells were cultured in IL-7 (5 ng/mL) +/- rapamycin (20 nM) and CD8 T cell numbers measured over time or (J) cells were activated with αCD3/αCD28 (both 0.5 µg/mL) +/- rapamycin (20 nM) and CD8 T cell mean division number was calculated over time (two-way ANOVA). Symbols in bar charts represent biological replicates, symbols in (I) represent the mean. Error bars show mean ± S.D. Flow cytometry dot plots and histograms are representative of (D, E) n=3, except for IFNγ staining which is n=2, (F) n=5, or show pooled data from (I) n=3–4 and (J) n=5 biological replicates, with data collected over at least two independent experiments. Quantitative proteomics was performed on biological triplicates.
-
Figure 1—source data 1
Raw values plotted in Figure 1.
- https://cdn.elifesciences.org/articles/98622/elife-98622-fig1-data1-v1.xlsx
Figure 1—figure supplement 1
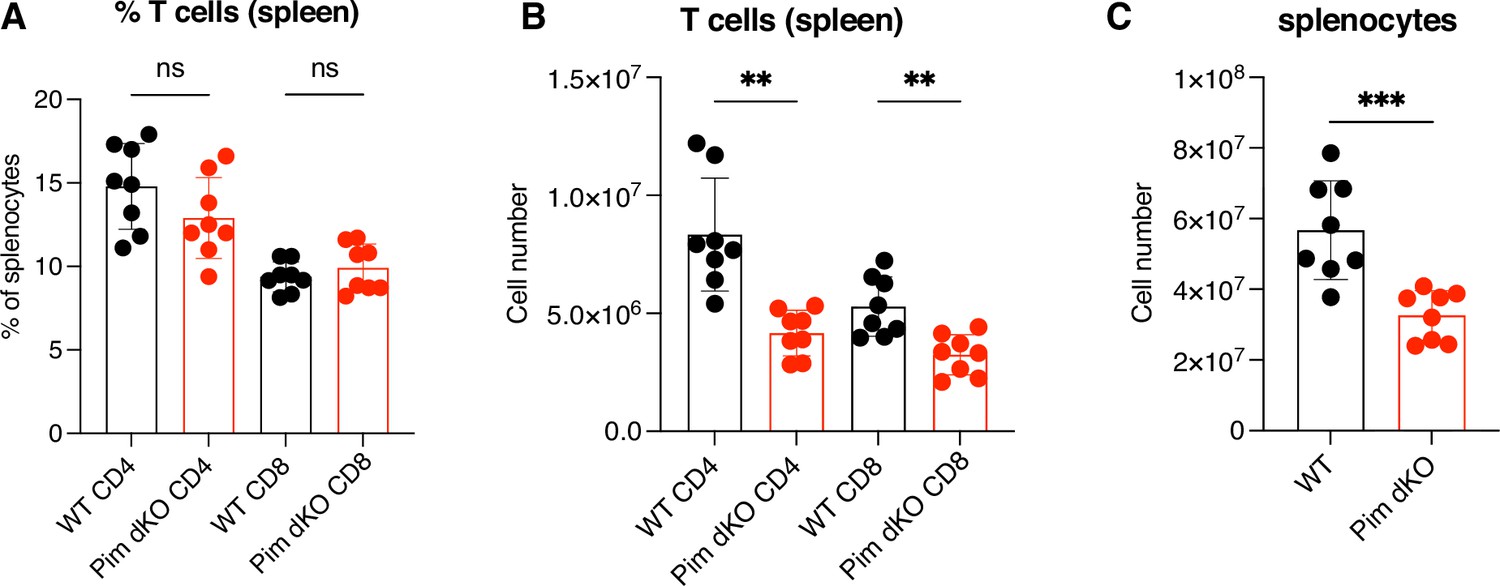
T cell counts in WT vs Pim dKO spleen.
Comparison of Pim dKO and age/sex matched WT control mice for (A) proportion of splenocytes that were CD4+ and CD8+ (one-way ANOVA), (B) total number of CD4 and CD8 T cells in spleens (one-way ANOVA), and (C) total number of splenocytes (student t-test). Symbols in bar charts represent biological replicates: error bars show mean ± S.D. (A–C) n=8 collected over four independent experiments. ** q<0.01, ***q<0.001.
-
Figure 1—figure supplement 1—source data 1
Raw values plotted in Figure 1—figure supplement 1.
- https://cdn.elifesciences.org/articles/98622/elife-98622-fig1-figsupp1-data1-v1.xlsx
Figure 1—figure supplement 2
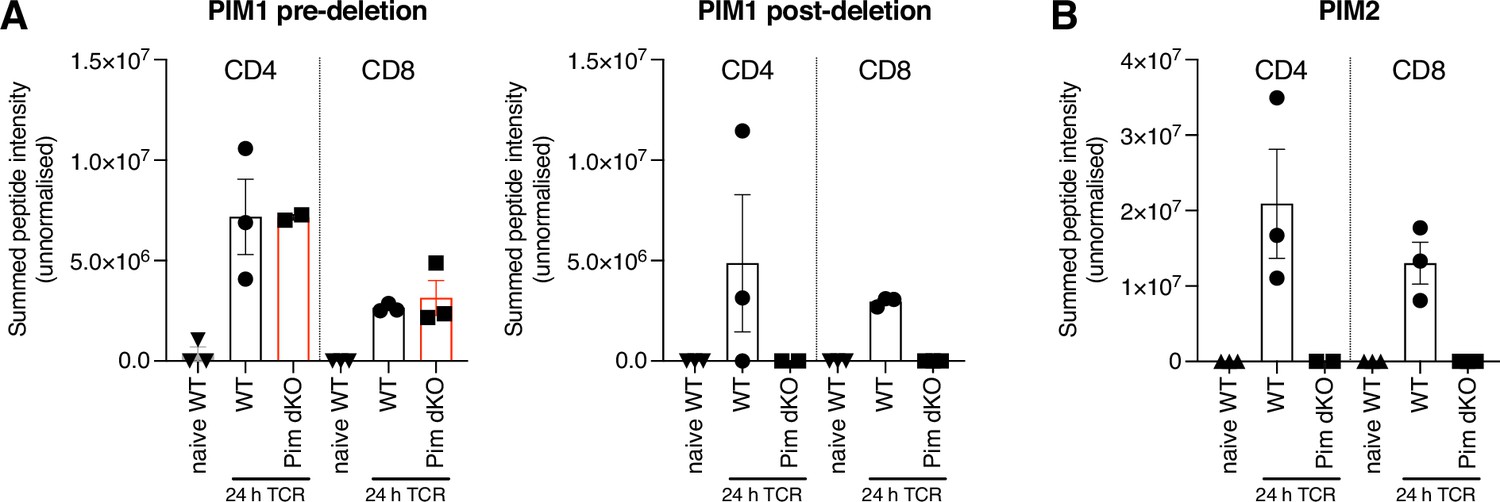
Proteomics data confirms deletion of catalytically active PIM1 and PIM2.
Pim1 KO mice have the Pim1 gene deleted from 98 codons post-ATG start site onwards (mid exon 4) and ablation of kinase activity was confirmed in Laird et al., 1993. In Pim2 KO mice exons 1–3 are deleted from the Pim2 gene (Mikkers et al., 2004). Summed peptide intensities from unnormalized proteomics data collected as described in Figure 1G–H from (A) before the PIM1 deletion point (left) and after the deletion point (right) and (B) whole of PIM2 protein confirms deletion of functional PIM1 and PIM2 protein.
-
Figure 1—figure supplement 2—source data 1
Raw values plotted in Figure 1—figure supplement 2.
- https://cdn.elifesciences.org/articles/98622/elife-98622-fig1-figsupp2-data1-v1.xlsx
Figure 2
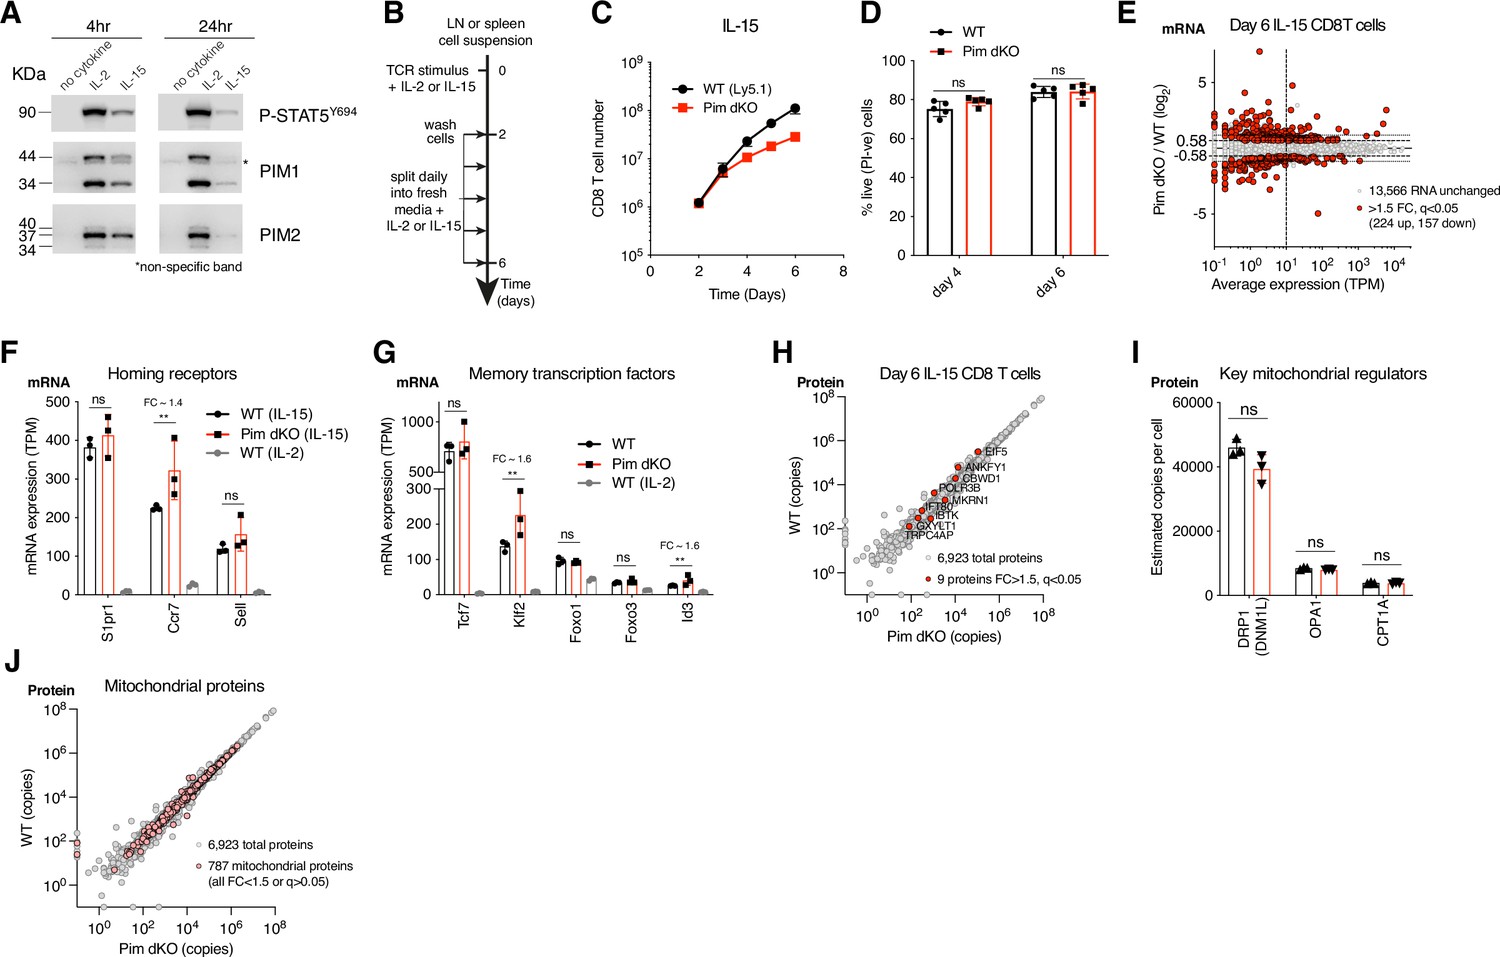
Pim1/Pim2 deficiency reduces IL-15-driven CD8 T cell proliferation but does not prevent memory differentiation.
(A) OT1 lymph node cell suspensions were SIINFEKL peptide activated for 36 hr, washed then cultured with no cytokine, IL-15 (20 ng/mL) or IL-2 (20 ng/mL) for 4 or 24 hr. Western blots of PIM1 (two isoforms of 44 and 34 kDa, non-specific band indicated by *), PIM2 (three isoforms of 40, 37, and 34 kDa) or pSTAT5 Y694 expression. (B) Schematic of cytokine driven memory and effector CD8 T cell expansion and differentiation cultures. Lymph node or spleen cell suspensions were activated for 2 days with TCR stimulus + cytokine, washed, then split daily into fresh media + cytokine. (C) WT (Ly5.1) and Pim dKO LN suspensions were mixed at a 50:50 ratio for T cells and cultured as outlined in (B) with TCR stimulus αCD3/αCD28 (both 0.5 µg/mL) + cytokine IL-15 (20 ng/mL), and CD8 T cell number was measured daily. (D) WT and Pim dKO T cells were expanded with IL-15 in separate cultures as per (B, C) and % live cells (PI-ve) were assessed on days 4 and 6 (two-way ANOVA). (E–J) WT and Pim dKO CD8 T cells were activated with TCR stimulus αCD3/αCD28 (both 0.5 µg/mL) + cytokine IL-15 (20 ng/mL), expanded with IL-15 as per (B), with an additional CD4 T cell magnetic depletion step on day 3 of culture. CD8 T cells were harvested on day 6 for parallel RNAseq and proteomic analysis. An interactive version of the proteomics expression data is available for exploration on the Immunological Proteome Resource website: immpres.co.uk (E) Fold-change in mRNA expression between Pim dKO and WT versus average mRNA expression (TPM). mRNA expression (Transcripts per million, TPM) of (F) secondary lymphoid homing receptors Sell, Ccr7, S1pr1 and (G) key transcription factors involved in CD8 T cell memory differentiation and maintenance Tcf7, Klf2, Foxo1, Foxo3, Id3. (H) WT vs Pim dKO protein copy numbers, differentially expression proteins (FC >1.5, q<0.05) are highlighted in red (I) Protein copy numbers per cell for key mitochondrial proteins DRP1, OPA1, and CPT1A. (J) WT vs Pim dKO protein copy numbers, mitochondrial proteins (as defined in MitoCarta 3.0) are highlight in pink. Symbols in bar charts represent biological replicates, symbols in (C, E, H, J) represent the mean. Error bars show mean ± S.D. Data are representative of (A) n=3 or show pooled data from (C) n=4, and (D) n=5 biological replicates with data collected over at least two independent experiments. Quantitative proteomics and RNAseq was performed on biological triplicates. ** q≤0.01, fold-change (FC) shown on bar graphs when q<0.05.
-
Figure 2—source data 1
PDF files containing labelled and uncropped images for western blots displayed in Figure 2A.
- https://cdn.elifesciences.org/articles/98622/elife-98622-fig2-data1-v1.zip
-
Figure 2—source data 2
Original files for western blot images displayed in Figure 2A.
- https://cdn.elifesciences.org/articles/98622/elife-98622-fig2-data2-v1.zip
-
Figure 2—source data 3
Raw values plotted in Figure 2.
- https://cdn.elifesciences.org/articles/98622/elife-98622-fig2-data3-v1.xlsx
Figure 3
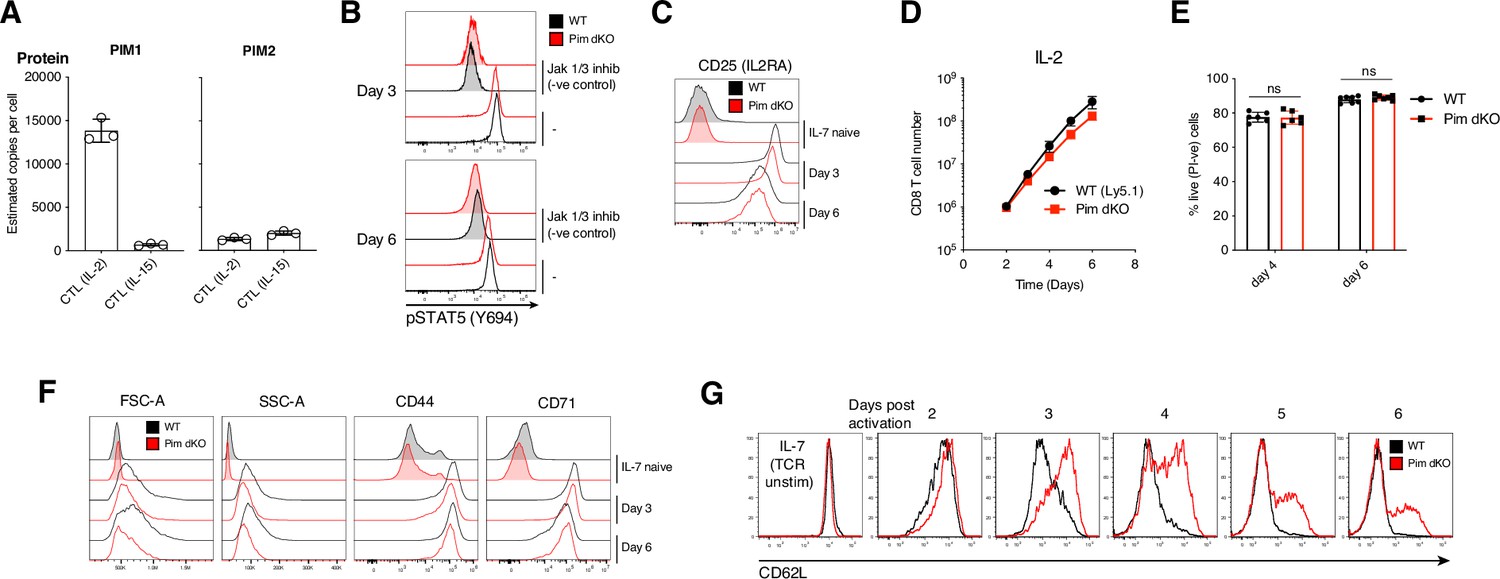
Pim dKO IL-2 differentiated effector T cells have reduced cell size and sustained expression of CD62L.
(A) Estimated copies per cell of PIM1 and PIM2 protein from published quantitative proteomics analysis Howden et al., 2019; Brenes et al., 2023 of CD8 T cells expanded in IL-2 or IL-15 as outlined in Figure 2B. (B–D, F, G) WT (Ly5.1) and Pim dKO lymph node or spleen single-cell suspensions were mixed at a 50:50 ratio of T cells, activated for 2 days with αCD3/αCD28 (both 0.5 µg/mL) and IL-2 (20 ng/mL), washed then split into fresh medium containing IL-2 (20 ng/mL) daily (as per Figure 2B). Some of the mixed cell suspensions were also cultured in IL-7 (5 ng/mL) to sustain a naive T cell reference. (B) WT and Pim dKO CTL were treated 1 hr +/- Jak1/3 inhibitor Tofacitinib (100 nM; negative control) before pSTAT5 Y694 expression was measured on day 3 and 6 of culture, (C) surface CD25 expression was measured on days 3 and 6 of culture, (D) CD8 T cell number vs time was calculated, (F) CD8 T cell FSC-A, SSC-A and surface activation markers (CD44, CD71) were measured on days 3 and 6 of culture (G) expression of adhesion molecule CD62L was measured daily. (E) WT and Pim dKO T cells were activated and expanded with IL-2 as per (B-D) and (F, G) except in separate cultures and % live cells (PI-ve) was assessed on days 4 and 6 (two-way ANOVA). Symbols in bar charts represent biological replicates, symbols in (D) represent the mean. Error bars show mean ± S.D. Data are representative of (B, G) n=4, (C, F) n=6 or show pooled data from (D) n=4, (E) n=6 biological replicates with data collected over at least two independent experiments.
-
Figure 3—source data 1
Raw values plotted in Figure 3.
- https://cdn.elifesciences.org/articles/98622/elife-98622-fig3-data1-v1.xlsx
Figure 4 with 2 supplements
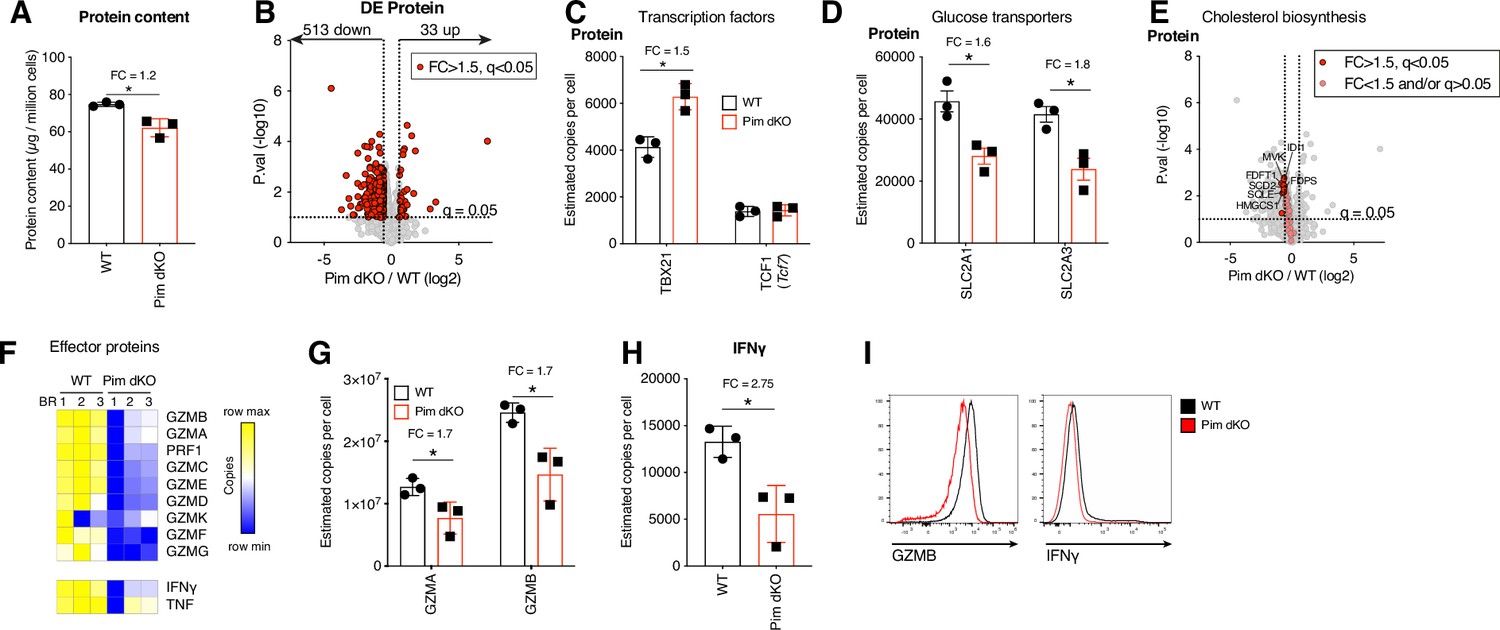
Major glucose transporters and effector proteins are reduced in Pim dKO IL-2 expanded CTL.
WT and Pim dKO CD8 T cells were activated for 2 days with αCD3/αCD28 (both 0.5 µg/mL) and IL-2 (20 ng/mL), washed then split into fresh medium containing IL-2 (20 ng/mL) daily (as per Figure 2B), with an additional CD4 T cell magnetic depletion step on day 3 of culture. CD8 T cells were harvested on day 6 of culture for high-resolution mass spectrometry. An interactive version of the proteomics expression data is available for exploration on the Immunological Proteome Resource website: immpres.co.uk (A) Estimated total protein content per cell (student t-test). (B) Volcano plots of Pim dKO vs WT protein copy numbers, differentially expressed proteins (FC >1.5, q<0.05) are highlighted in red. Estimated protein copy number per cell of (C) transcription factor TBX21 and TCF1 (D) glucose transporters SLC2A1 and SLC2A3. (E) Volcano plots of Pim dKO vs WT protein copy numbers. Proteins with KEGG term = ‘terpenoid backbone biosynthesis’, ‘biosynthesis of unsaturated fatty acids’ or ‘steroid biosynthesis’ are highlighted with proteins with FC >1.5, q<0.05 shown in red and proteins with FC <1.5 and/or q>0.05 shown in pink. (F) Heatmap of protein copy numbers for granzymes, perforin, and effector cytokines. Estimated protein copies for (G) major cytolytic Granzymes A and B and (H) IFNγ. (I) Granzyme B and IFNγ expression was measured by flow cytometry in day 6 IL-2 expanded WT and Pim dKO CTL. Symbols in bar charts show biological replicates. Error bars show mean ± S.D. Data are representative of (I) n=3–4, with data collected over at least two independent experiments. Quantitative proteomics was performed on biological triplicates. * indicates q<0.05, fold-change (FC) shown on graph when q<0.05.
-
Figure 4—source data 1
Raw values plotted in Figure 4.
- https://cdn.elifesciences.org/articles/98622/elife-98622-fig4-data1-v1.xlsx
Figure 4—figure supplement 1
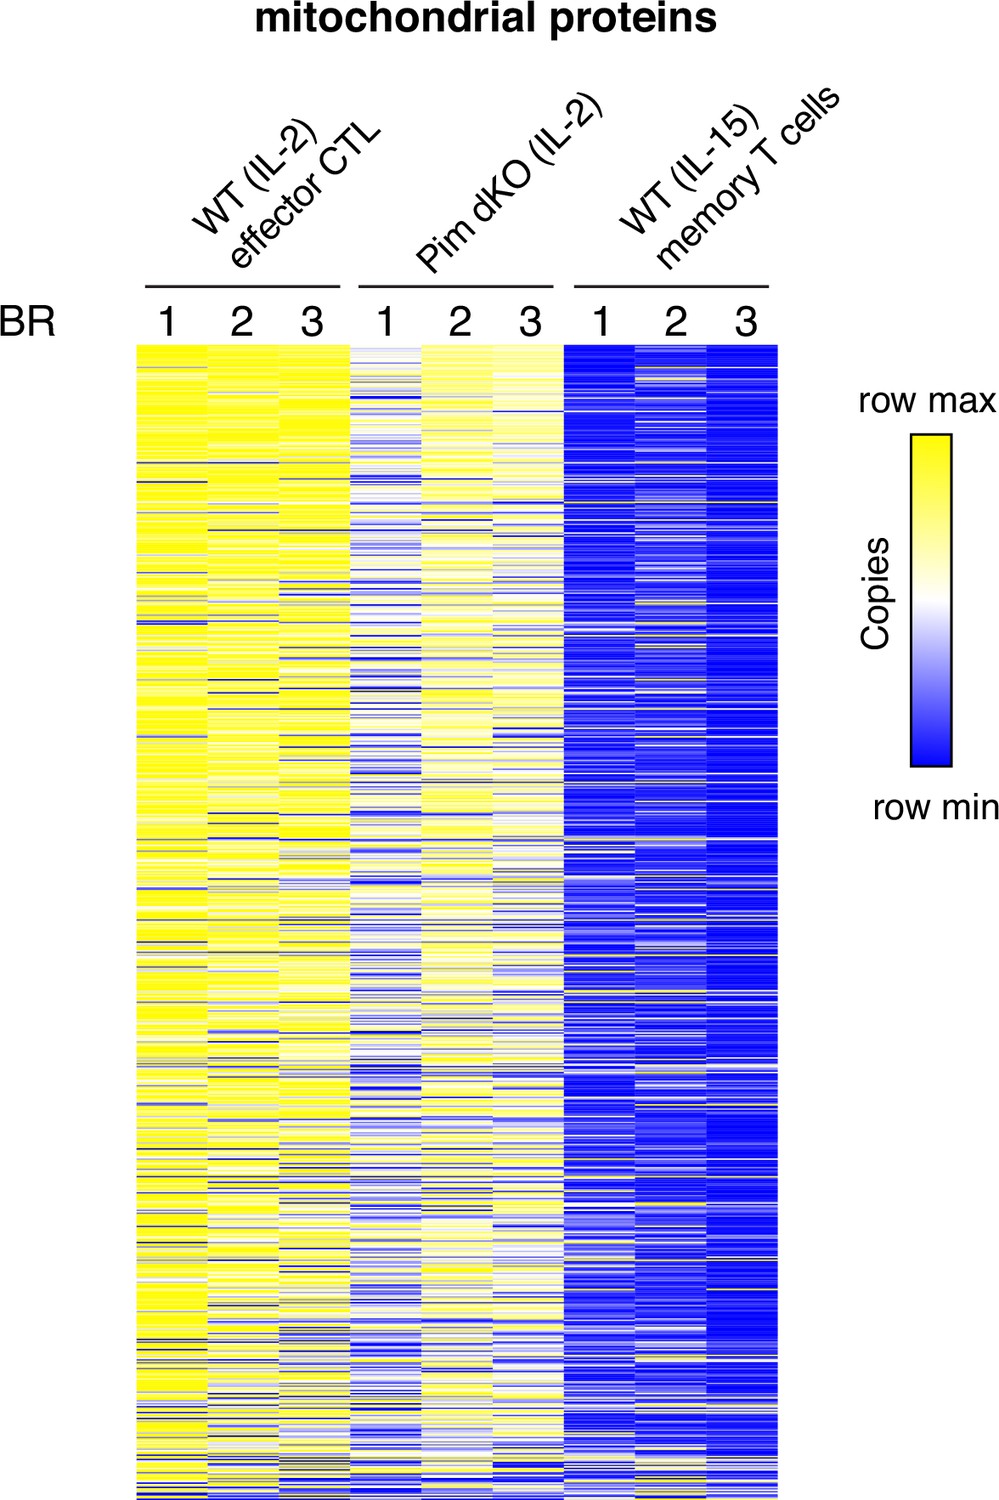
Pim dKO IL-2 expanded CD8 T cells exhibit an effector-like mitochondrial proteome profile.
Heatmap showing protein copy number of mitochondrial proteins (as defined by inclusion on Mitocarta 3.0 list) from IL-2 expanded WT (effector), Pim dKO and IL-15 expanded WT (memory) proteomics experiments described in Figures 2 and 4. Proteins are ranked based on average expression in IL-2 WT condition. Proteomics was performed on biological triplicates.
-
Figure 4—figure supplement 1—source data 1
Raw values plotted in Figure 4—figure supplement 1.
- https://cdn.elifesciences.org/articles/98622/elife-98622-fig4-figsupp1-data1-v1.xlsx
Figure 4—figure supplement 2
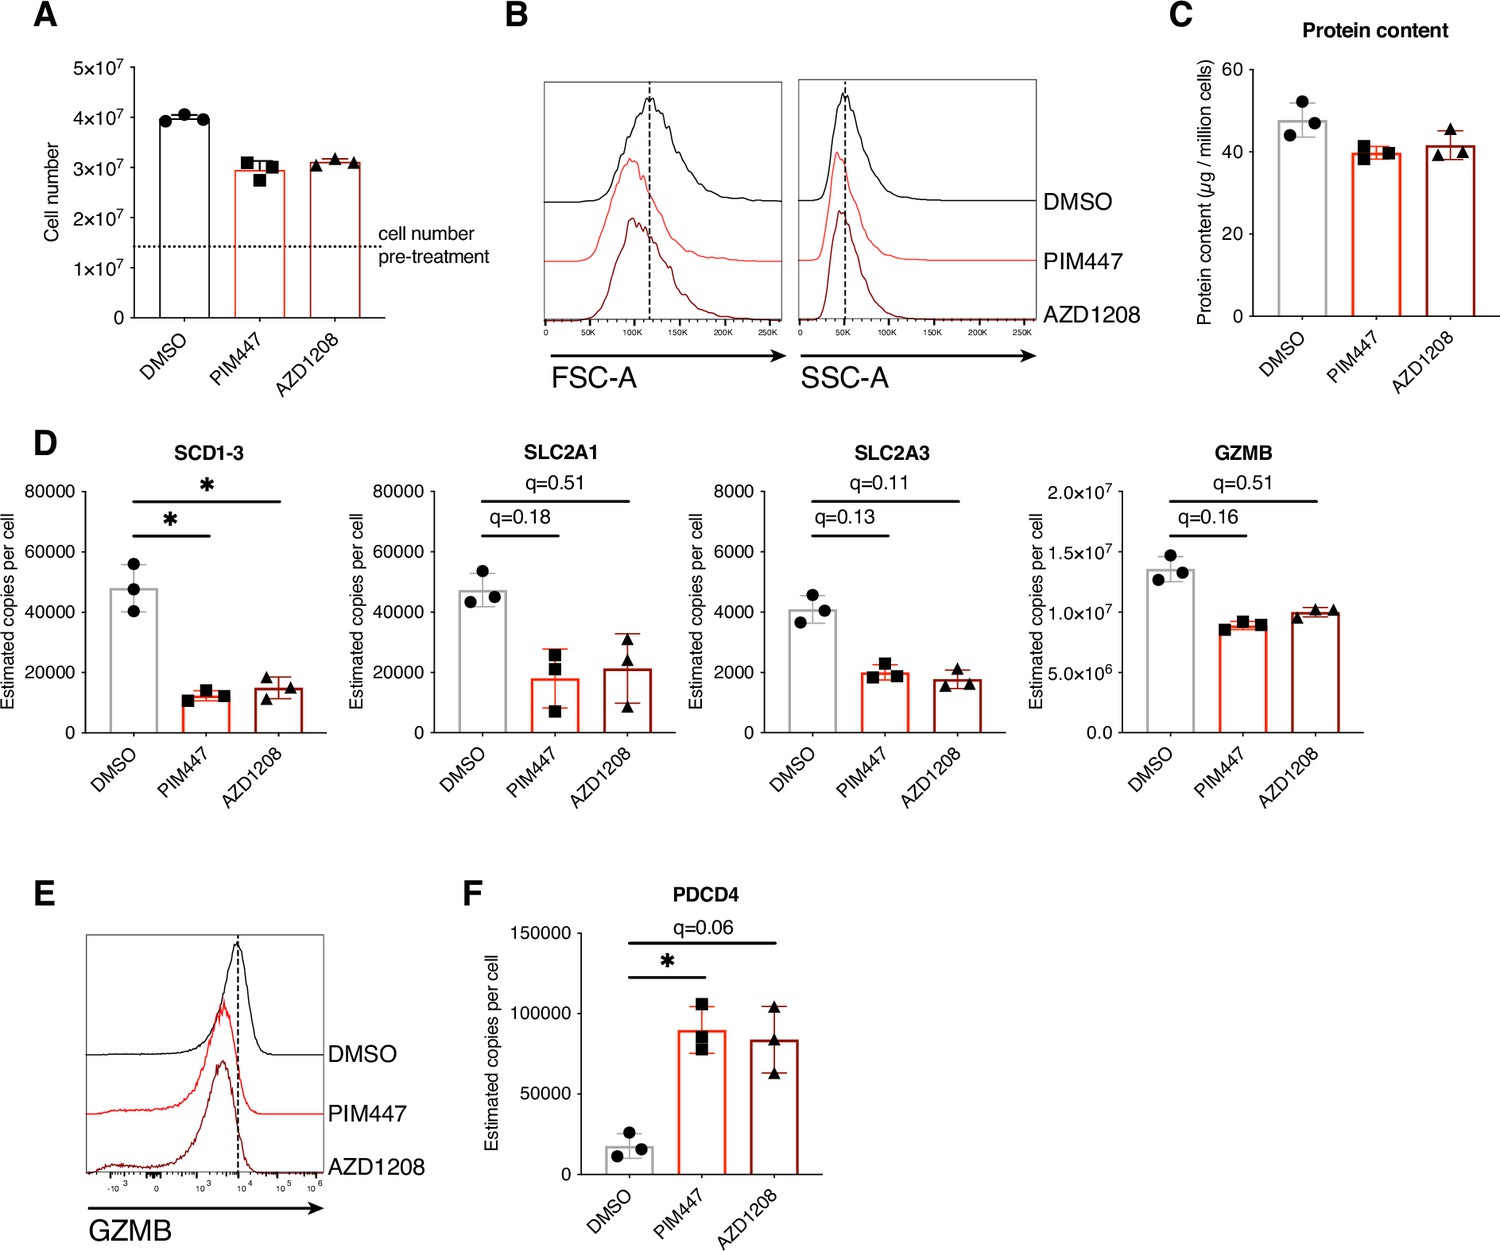
24 hr treatment of IL-2 CTL with pan-PIM kinase inhibitors PIM447 or AZD1208 recapitulates many features of Pim1/Pim2-deficiency.
Single-cell suspension from P14 TCR-transgenic mouse lymph nodes were activated with gp33 peptide (100 ng/mL), IL-2 (20 ng/mL), and IL-12 (2 ng/mL) for 2 days, then split daily into fresh media containing IL-2 (20 ng/mL). On day 5 of culture IL-2 expanded CTL were treated with pan-PIM kinase inhibitors PIM447 (5 µM) or AZD1208 (10 µM), or DMSO vehicle control for 24 hr and harvested on day 6 of culture to measure (A) Cell number (B) FSC-A SSC-A. Proteome analysis was also performed on inhibitor-treated CTL to measure (C) protein content, (D) protein expression of SCD1-3, SLC2A1, SLC2A3, GZMB, or (F) PDCD4. (E) Day 6 IL-2 expanded CTL from WT (C57BL/6) mice were treated for 24 hr with PIM447 or AZD1208 (both 1 µM) and GZMB expression was measured by flow cytometry. Symbols show biological replicates. Error bars show mean ± S.D. Data are representative of (E) n=2 biological replicates collected across at least two independent experiments. Proteomics analysis was performed on biological triplicates, with (A, B) collected in parallel with proteomics analysis. * q<0.05.
-
Figure 4—figure supplement 2—source data 1
Raw values plotted in Figure 4—figure supplement 2.
- https://cdn.elifesciences.org/articles/98622/elife-98622-fig4-figsupp2-data1-v1.xlsx
Figure 5 with 1 supplement
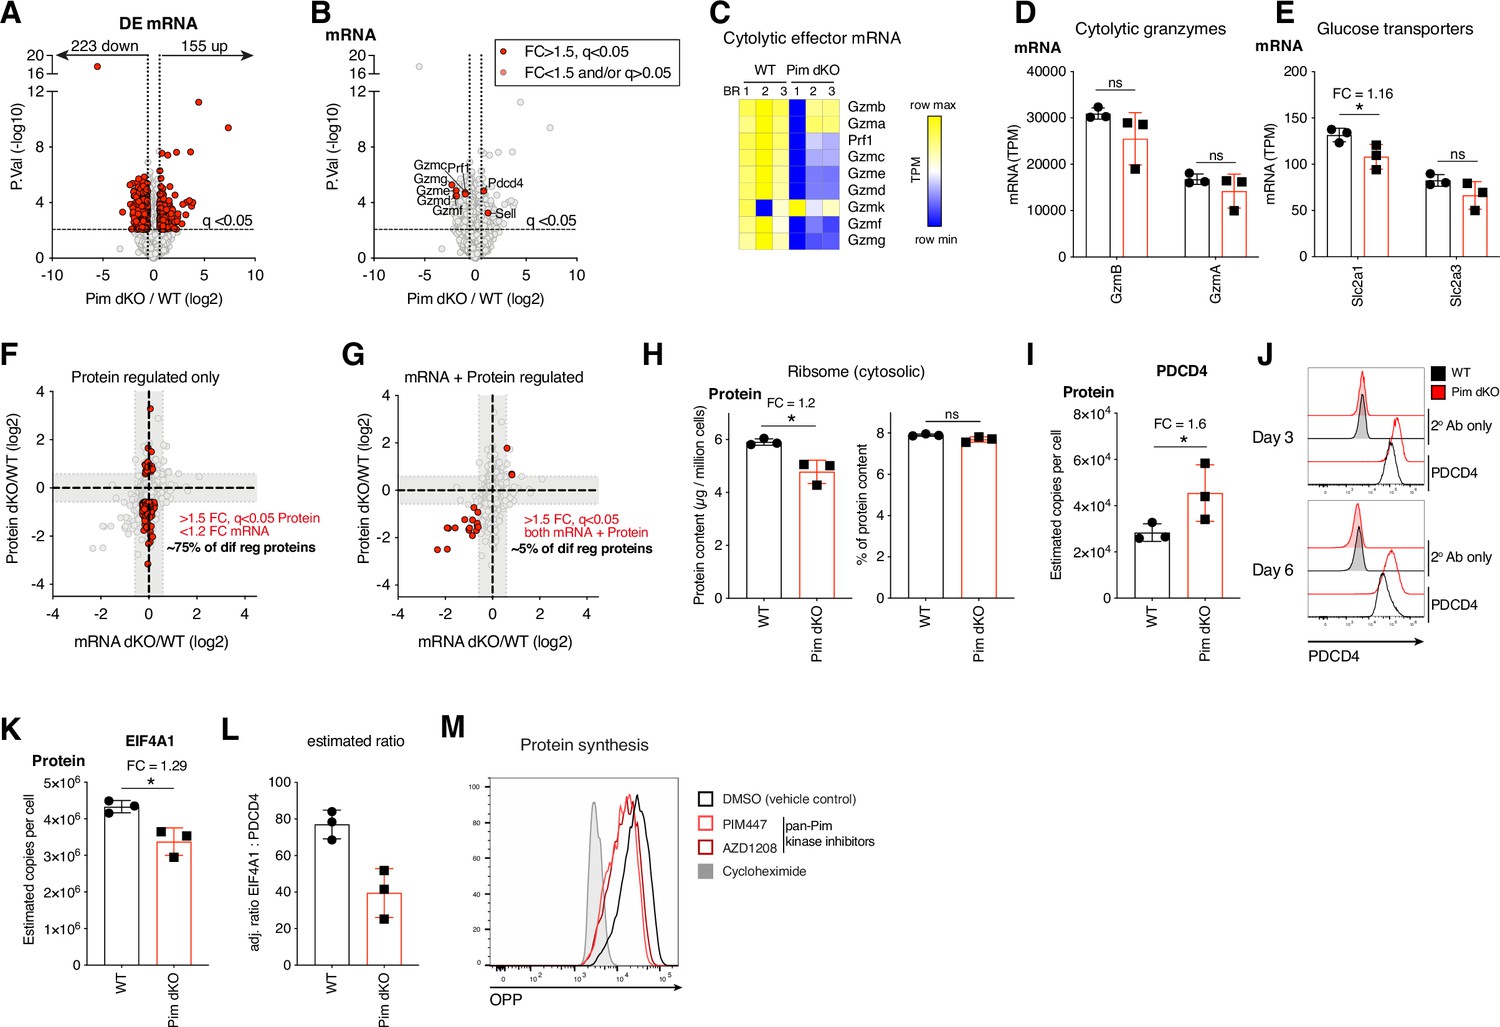
Disconnect between protein and mRNA expression in Pim1/Pim2-deficient effector CTL corresponds with a reduction in protein synthesis.
RNAseq analysis was performed in day 6 IL-2 expanded WT and Pim dKO CD8 T cells which were collected in parallel with proteomics analysis described in Figure 4A. (A) Volcano plot of RNAseq data, differentially expressed mRNA (FC >1.5, q<0.05) are highlighted in red. (B) Volcano plot of RNAseq data, Granzymes C-K, perforin, Pdcd4 and Sell are highlighted in red. (C) Heatmap of mRNA expression (TPM) for granzymes, perforin and effector cytokines. Bar chart of mRNA expression (TPM) of (D) Granzymes A and B (E) Glucose transporters Slc2a1 and Slc2a3. (F, G) Fold change of PimdKO/WT protein from proteomics analysis described in Figure 4 vs mRNA (F) highlighting in red proteins that are differentially expressed (FC >1.5, q<0.05) where mRNA is not substantially different (FC <1.2) and (G) highlighting in red protein and mRNA that are both differentially expressed (FC >1.5, q<0.05). (H) Estimated cytosolic ribosome content per cell (left), % ribosome of total cellular protein content (right). (I) Estimated protein copy number per cell of translation repressor PDCD4. (J) PDCD4 expression measured by flow cytometry on day 3 and 6 in IL-2 expanded WT vs Pim dKO CD8 T cells. (K) Estimated protein copy number per cell of EIF4A1. (L) Adjusted ratio of PDCD4: EIF4A1 (assuming 1 PDCD4 binds 2 x EIF4A1) in WT and Pim dKO proteomes. (M) Protein synthesis measured by OPP incorporation in day 6 IL-2-expanded WT CTL treated for 24 hours with pan PIM kinase inhibitors PIM447 (5 µM) or AZD1208 (10 µM). 30-min cycloheximide (100 µg/mL) treatment gives no protein synthesis background control. Symbols in bar charts show biological replicates: error bars show mean ± S.D. Data are representative of (M) n=2 biological replicates collected over two independent experiments, (J) n=2 biological replicates. Quantitative proteomics and RNAseq were performed on biological triplicates. * indicates q<0.05, fold-change (FC) shown on graph when q<0.05.
-
Figure 5—source data 1
Raw values plotted in Figure 5.
- https://cdn.elifesciences.org/articles/98622/elife-98622-fig5-data1-v1.xlsx
Figure 5—figure supplement 1
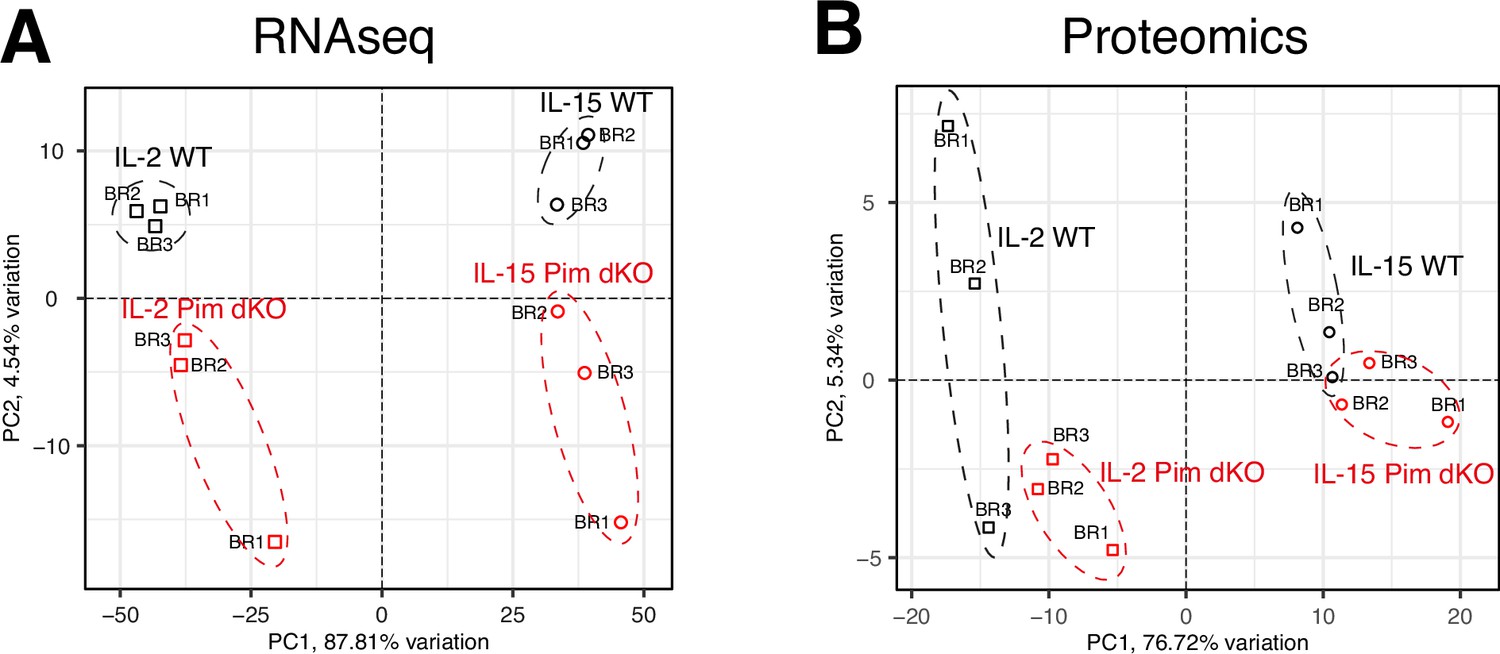
Pim dKO IL-2 expanded CD8 T cells are more similar to IL-2 WT effector T cells than IL-15 expanded memory T cells.
Figure 6

PIM kinases regulate mTORc1 activity and lymphoid homing in effector CTL.
(A) Western blot of pS6K T389 and pan S6K from day 6 WT and PimdKO IL-2 CTL (paired student t-test, *=p < 0.05). (B) WT and Pim dKO T cells were mixed in a 50:50 ratio, activated with αCD3/αCD28 (both 0.5 µg/mL) and IL-2 (20 ng/mL) and expanded in IL-2 as per Figure 2B and pS6 (Ser235/236) measured after 1 hr +/- PdBU and ionomycin (positive control), +/- rapamycin (mTORc1 inhibitor, negative control) or no additional treatment. mRNA expression (TPM) from RNAseq analysis of IL-2 expanded WT and Pim dKO CTL described in Figure 5A for (C) cell homing receptors S1pr1, Ccr7 and Sell and (D) transcription factor Klf2. (E) WT and Pim dKO T cells were activated and expanded with IL-2 in separate cultures as per Figure 2B. On day 6 of culture WT and Pim dKO CTL were labelled with CFSE or CTV, mixed at a 50:50 ratio and transferred into C57BL/6-recipient mice. Values indicate percentage of transferred cells detected in blood, lymph node or spleen 4 or 23 hr post-transfer that were WT or Pim dKO (one-way ANOVA). Symbols show biological replicates. Error bars show mean ± S.D. Data are representative of (A) n=6, (B) n=2–4 collected across at least two independent experiments and (E) n=6 recipient mice, from n=2 biological donor replicates. RNAseq was performed on biological triplicates. * q<0.05, ** q<0.01, *** q<0.001, fold-change (FC) shown on graph when q<0.05 but FC <1.5.
-
Figure 6—source data 1
PDF files containing labelled and uncropped images for western blots displayed in Figure 6A.
- https://cdn.elifesciences.org/articles/98622/elife-98622-fig6-data1-v1.zip
-
Figure 6—source data 2
Original files for western blot images displayed in Figure 6A.
- https://cdn.elifesciences.org/articles/98622/elife-98622-fig6-data2-v1.zip
-
Figure 6—source data 3
Raw values plotted in Figure 6.
- https://cdn.elifesciences.org/articles/98622/elife-98622-fig6-data3-v1.xlsx
Author response image 1

PIM1 or PIM2 overexpression drives increased GzmB expression and S6 phosphorylation in WT IL-2 CTL.
OT1 lymph node cell suspensions were activated for 24 hours with SIINFEKL peptide (10 ng/mL), IL-2 (20 ng/mL) and IL-12 (2 ng/mL) then transfected with retroviruses to drive expression of PIM1-GFP, PIM2-GFP fusion proteins or a GFP only control. T cells were split into fresh media and IL-2 daily and (A) GzmB expression and (B) S6 phosphorylation assessed by flow cytometry in GFP+ve vs GFP-ve CD8 T cells 5 days post-transfection (i.e. day 6 of culture). Histograms are representative of 2 independent experiments.
Tables
Key resources table
| Reagent type (species) or resource | Designation | Source or reference | Identifiers | Additional information |
|---|---|---|---|---|
| Genetic reagent (Mus musculus) | Pim1KO/Pim2KO (Pim1/2 dKO) | PMID:8233823, PMID:15199164 | Pim1 and Pim2 KO strains generated on the FVB/N background in references listed and backcrossed to C57BL/6 background in this paper | |
| Genetic reagent (M. musculus) | C57BL/6 J (WT) | Charles River UK | ||
| Genetic reagent (M. musculus) | TCR α-; P14 TCRVα2Vβ8 (P14) | PMID:2573841 | maintained in house as an P14 TCR transgene heterozygote | |
| Genetic reagent (M. musculus) | C57BL/6-Tg(TcraTcrb)1100Mjb (OT1) | PMID:8287475 | maintained in house as an OT1 TCR transgene heterozygote on a CD45.1 (Ly5.1) background | |
| Genetic reagent (M. musculus) | C57BL/6 J Ly5.1 (Ly5.1) | Charles River UK | ||
| Antibody | Anti-CD3 (armenian hamster, monoclonal, 145–2C11) | Thermo Fisher Scientific | Cat # 14-0031-82, RRID:AB_467049 | T cell culture: 0.5 μg/mL |
| Antibody | Anti-CD28 (syrian hamster, monoclonal, 37.51) | Thermo Fisher Scientific | Cat # 16-0281-82, RRID:AB_468921 | T cell culture: 0.5 μg/mL |
| Antibody | Anti-CD4 biotin (Rat, monoclonal, RM4-5) | Biolegend | Cat # 100508, RRID:AB_312710 | CD4 T cell depletion: 5 µg/mL |
| Antibody | Anti-mouse CD16/CD32 Fc Block, (rat, monoclonal) | BD Biosciences | Cat # 553141, RRID:AB_394656 | Fc block: 1:60 |
| Antibody | anti-mouse CD4 (Rat, monoclonal, RM4-5) | Thermo Fisher Scientific/eBioscience | Cat # 47-0042-82, RRID:AB_1272183 | cell surface stain 1:200, APC eF780 |
| Antibody | anti-mouse CD4 (Rat, monoclonal, RM4-5) | BD Biosciences | Cat # 560782, RRID:AB_1937327; Cat # 553650, RRID:AB_394970; Cat # 552775, RRID:AB_394461 | cell surface stain 1:200, V500, FITC, PECy7 |
| Antibody | anti-mouse CD4 (Rat, monoclonal, RM4-5) | Biolegend | Cat # 100553, RRID:AB_2561388 | cell surface stain 1:200, BV510 |
| Antibody | anti-mouse CD8a (Rat, monoclonal, 53–6.7) | Biolegend | Cat # 100738, RRID:AB_11204079; Cat # 100708, RRID:AB_312747; Cat # 100722, RRID:AB_312761; Cat # 100712, RRID:AB_312750 | cell surface stain 1:200, BV421, PE, PECy7, APC |
| Antibody | anti-mouse CD8a (Rat, monoclonal, 53–6.7) | BD Biosciences | Cat # 551162, RRID:AB_394081 | cell surface stain 1:200, PerCPCy5.5 |
| Antibody | anti-mouse CD8a (Rat, monoclonal, 53–6.7) | Thermo Fisher Scientific/eBioscience | Cat # 47-0081-82, RRID:AB_1272185 | cell surface stain 1:200, APC eF780 |
| Antibody | anti-mouse CD25 (Rat, monoclonal, 7D4) | BD Biosciences | Cat # 553072, RRID:AB_394604 | cell surface stain 1:200, FITC |
| Antibody | anti-mouse CD25 (Rat, monoclonal, PC61) | Biolegend | Cat # 102016, RRID:AB_312864 | cell surface stain 1:200, PECy7 |
| Antibody | anti-mouse CD44 (Rat, monoclonal, IM7) | Biolegend | Cat # 103044, RRID:AB_2561391; Cat # 103006, RRID:AB_312956; Cat # 103030, RRID:AB_830787 | cell surface stain 1:200, BV510, FITC, PECy7 |
| Antibody | anti-mouse CD44 (Rat, monoclonal, IM7) | Thermo Fisher Scientific/eBioscience | Cat # 47-0441-82, RRID:AB_1272244 | cell surface stain 1:200, APC eF780 |
| Antibody | anti-mouse CD45.1 (Mouse, monoclonal, A20) | Biolegend | Cat # 110728, RRID:AB_893346; Cat # 110714, RRID:AB_313503 | Cell surface stain 1:200, PerCPCy5.5, APC |
| Antibody | anti-mouse CD62L (Rat, monoclonal, MEL-14) | Thermofisher Scientific/eBioscience | Cat # 12-0621-83, RRID:AB_465722 | Cell surface stain 1:200, PE |
| Antibody | anti-mouse CD62L (Rat, monoclonal, MEL-14) | Biolegend | Cat # 104435, RRID:AB_10900082; Cat # 104412, RRID:AB_313099 | Cell surface stain 1:200, BV421, APC |
| Antibody | anti-mouse CD69 (Armernian Hamster, monoclonal, H1.2F) | Thermo Fisher Scientific/eBioscience | Cat # 17-0691-82, RRID:AB_1210795 | Cell surface stain 1:200, APC |
| Antibody | anti-mouse CD71 (Rat, monoclonal, RI7217) | Biolegend | Cat # 113813, RRID:AB_10899739; Cat # 113820, RRID:AB_2728134 | cell surface stain 1:200, BV421, APC |
| Antibody | anti-mouse TCRbeta (Armenian Hamster, monoclonal, H57-597) | Thermo Fisher Scientific/eBioscience | Cat # 45-5961-82, RRID:AB_925763 | cell surface stain 1:200, PerCPCy5.5 |
| Antibody | anti-mouse IFNγ (Rat, monoclonal, XMG1.2) | Biolegend | Cat # 505810, RRID:AB_315404 | intracellular stain 1:100, APC |
| Antibody | anti-mouse Granzyme B (Rat, monoclonal, NGZB) | Thermo Fisher Scientific/eBioscience | Cat # 12-8898-82, RRID:AB_10870787; Cat # 17-8898-82, RRID:AB_2688068 | intracellular stain 1:200, PE, APC |
| Antibody | anti-phospho S6 ribosomal protein (Ser235/236) Alexa Fluor 647 (Rabbit, monoclonal, D57.2.2E) | Cell Signaling Technology | Cat # 4851 S, RRID:AB_10695457 | intracellular stain 1:100, AF647 |
| Antibody | anti-phospho STAT5 Y694 (Rabbit, monoclonal, C11C5) | Cell Signaling Technology | Cat # 9359 S, RRID:AB_823649 | intracellular stain 1:200; western blot 1:1000 |
| Antibody | anti-PDCD4 (Rabbit, monoclonal, D29C6) | Cell Signaling Technology | Cat # 9535 S, RRID:AB_2162318 | intracellular stain 1:100 |
| Antibody | anti-rabbit IgG Fab2 Alexa Fluor 647 (goat) | Cell Signaling Technology | Cat # 4414 S, RRID:AB_10693544 | intracellular stain 1:1000 |
| Antibody | p70 S6 Kinase Antibody (Rabbit, polyclonal) | Cell Signaling Technology | Cat # 9202 S, RRID:AB_331676 | western blot 1:1000 |
| Antibody | Phospho-p70 S6 Kinase (Thr389) (Rabbit, monoclonal, 108D2) | Cell Signaling Technology | Cat # 9234 S, RRID:AB_2269803 | western blot 1:1000 |
| Antibody | Pim1 antibody (mouse, monoclonal, 12H8) | Santa Cruz | Cat # sc-13513; RRID:AB_628129 | western blot 1:200 |
| Antibody | Pim2 antibody (mouse, monoclonal, 1D12) | Santa Cruz | Cat # SC-13514; SC-13514 | western blot 1:200 |
| Antibody | Anti-rabbit IgG HRP (goat, polyclonal) | Thermo Fisher Scientific | Cat # 31460; RRID:AB_228341 | western blot 1:5000 |
| Antibody | Anti-mouse IgG HRP (horse, polyclonal) | Cell Signaling Technology | Cat # 7076 S; RRID:AB_330924 | western blot 1:5000 |
| Peptide, recombinant protein | recombinant human IL-2 | Novartis, UK | Proleukin | T cell culture: 20 ng/mL |
| Peptide, recombinant protein | recombinant human IL-15 | Peprotech | Cat # 200–15 | T cell culture: 20 ng/mL |
| Peptide, recombinant protein | recombinant mouse IL-7 | Peprotech | Cat # 217–17 | T cell culture: 5 ng/mL |
| Peptide, recombinant protein | recombinant mouse IL-12 | R&D Systems, UK | Cat # 419 ML | T cell culture: 2 ng/mL |
| Peptide, recombinant protein | gp33-41 peptide | Anaspec | Cat #AS-61296 | T cell culture: 100 ng/mL |
| Commercial assay or kit | RNAeasy mini kit | Qiagen | Cat # 74104 | RNA purification |
| Commercial assay or kit | TruSeq Stranded mRNA sample preparation kit | Illumina | Cat # 15031047 | RNASeq library preparation |
| Commercial assay or kit | EZQ protein quantitation kit | Thermo Fisher Scientific | Cat # R33200 | Protein quantification |
| Commercial assay or kit | CBQCA protein quantitation kit | Thermo Fisher Scientific | Cat # C6667 | Peptide quantification |
| Commercial assay or kit | eBioscience Intracellular Fixation and Permeabilization Buffer Set | Thermo Fisher Scientific/eBioscience | Cat # 88-8824-00 | Intracellular stain |
| Chemical compound, drug | PIM447 | MedChemExpress | Cat # HY-19322B | 1 or 5 µM as indicated |
| Chemical compound, drug | AZD1208 | MedChemExpress | Cat # HY-15604 | 1 or 10 µM as indicated |
| Chemical compound, drug | Tofacitinib | Selleckchem | Cat # CP-690550 | 100 nM |
| Chemical compound, drug | Rapamycin | Merck/Calbiochem | Cat # 553211 | 20 nM |
| Chemical compound, drug | PDBu | Cell Signaling Technology | Cat # 12808 | 20 ng/mL |
| Chemical compound, drug | ionomycin | Merck/Calbiochem | Cat # 407951 | 500 ng/mL |
| Chemical compound, drug | DAPI | Thermo Fisher Scientific | Cat # D1306 | 1 µg/mL |
| Chemical compound, drug | Propidium iodide | Sigma | Cat # P4170 | 0.2 µg/mL |
| Chemical compound, drug | GolgiPlug | BD Biosciences | Cat # 555029 | 1:1000 |
| Chemical compound, drug | CellTrace Violet | Invitrogen | Cat # C34557 | 5 µM |
| Chemical compound, drug | CFSE | Invitrogen | Cat # C34554 | 5 µM |
| Chemical compound, drug | O-propargyl puromycin | Jena Bioscience | Cat # NU-931 | 20 µM, 10 min |
| Chemical compound, drug | cycloheximide | Sigma | Cat # C7698 | 100 µg/mL, 30 min |
| Chemical compound, drug | Alexa-647-azide | Thermo Fisher Scientific | Cat # A10277 | 5 µM in click reaction buffer |
| Software, algorithm | FlowJo software | BD Biosciences, developed by Treestar | RRID:SCR_008520 | versions 9.9.6 or version 10.6.1 and above |
| Software, algorithm | Maxquant | https://www.maxquant.org, PMID:19029910 | RRID:SCR_014485 | version 1.6.10.43 |
| Software, algorithm | Perseus | https://www.maxquant.org/perseus, PMID:27348712 | RRID:SCR_015753 | version 1.6.6.0 |
| Software, algorithm | Spectronaut | Biognosys | version 14.7 | |
| Software, algorithm | Morpheus | https://software.broadinstitute.org/morpheus | RRID:SCR_017386 | heatmap generation |
| Software, algorithm | Prism | GraphPad | RRID:SCR_002798 | version 9 or 10 |
| Software, algorithm | Rstudio | Rstudio | RRID:SCR_000432 | version 1.6.10.43 |
| Other | Sera-Mag SpeedBead Carboxylate-modified magnetic particles (hydrophilic) | GE Lifesciences | Cat # 45152105050250 | proteomic sample prep |
| Other | Sera-Mag SpeedBead Carboxylate-modified magnetic particles (hydrophobic) | GE Lifesciences | Cat # 65152105050250 | proteomic sample prep |
| Other | S-Trap Mini columns | Protifi | Cat # CO2-mini-80 | proteomic sample prep |
| Other | RapidSphere Beads | EasySep | Cat # 50001 | CD4 T cell depletion |
| Other | sphero rainbow beads | BD Biosciences | Cat # 556288 | cell counting, 10,000 beads/sample |
Additional files
-
Supplementary file 1
Protein copy numbers and statistical test results for 24 hour TCR-activated WT and Pim dKO CD4 and CD8 T cells proteomics data.
- https://cdn.elifesciences.org/articles/98622/elife-98622-supp1-v1.xlsx
-
Supplementary file 2
mRNA expression data, mRNA annotation and statistical test results for RNAseq analysis of Day 6 IL-15 expanded WT and Pim dKO CD8 T cells.
- https://cdn.elifesciences.org/articles/98622/elife-98622-supp2-v1.xlsx
-
Supplementary file 3
Protein copy numbers and statistical test results for proteomics analysis of Day 6 IL-15 expanded WT and Pim dKO CD8 T cells.
- https://cdn.elifesciences.org/articles/98622/elife-98622-supp3-v1.xlsx
-
Supplementary file 4
Protein copy numbers and statistical test results for proteomics analysis of Day 6 IL-2 expanded WT and Pim dKO CD8 T cells.
- https://cdn.elifesciences.org/articles/98622/elife-98622-supp4-v1.xlsx
-
Supplementary file 5
Protein copy numbers and statistical test results for proteomics analysis of Day 6 IL-2 expanded P14 CD8 T cells treated for 24 hours with pan PIM kinase inhibitors PIM447 or AZD1208.
- https://cdn.elifesciences.org/articles/98622/elife-98622-supp5-v1.xlsx
-
Supplementary file 6
mRNA expression data and statistical test results for RNAseq analysis of Day 6 IL-2 expanded WT and Pim dKO CD8 T cells.
- https://cdn.elifesciences.org/articles/98622/elife-98622-supp6-v1.xlsx
-
Supplementary file 7
Combined proteomics and RNAseq expression data and statistical test results from Day 6 IL-2 expanded WT and Pim dKO CD8 T cells.
- https://cdn.elifesciences.org/articles/98622/elife-98622-supp7-v1.xlsx
-
MDAR checklist
- https://cdn.elifesciences.org/articles/98622/elife-98622-mdarchecklist1-v1.docx
Download links
A two-part list of links to download the article, or parts of the article, in various formats.
Downloads (link to download the article as PDF)
Open citations (links to open the citations from this article in various online reference manager services)
Cite this article (links to download the citations from this article in formats compatible with various reference manager tools)
PIM kinase control of CD8 T cell protein synthesis and cell trafficking
eLife 13:RP98622.
https://doi.org/10.7554/eLife.98622.3


