Multifaceted role of galanin in brain excitability
- Department of Molecular Life Sciences, University of Zurich, Switzerland
- Life Science Zürich Graduate School, Switzerland
Figures
Figure 1
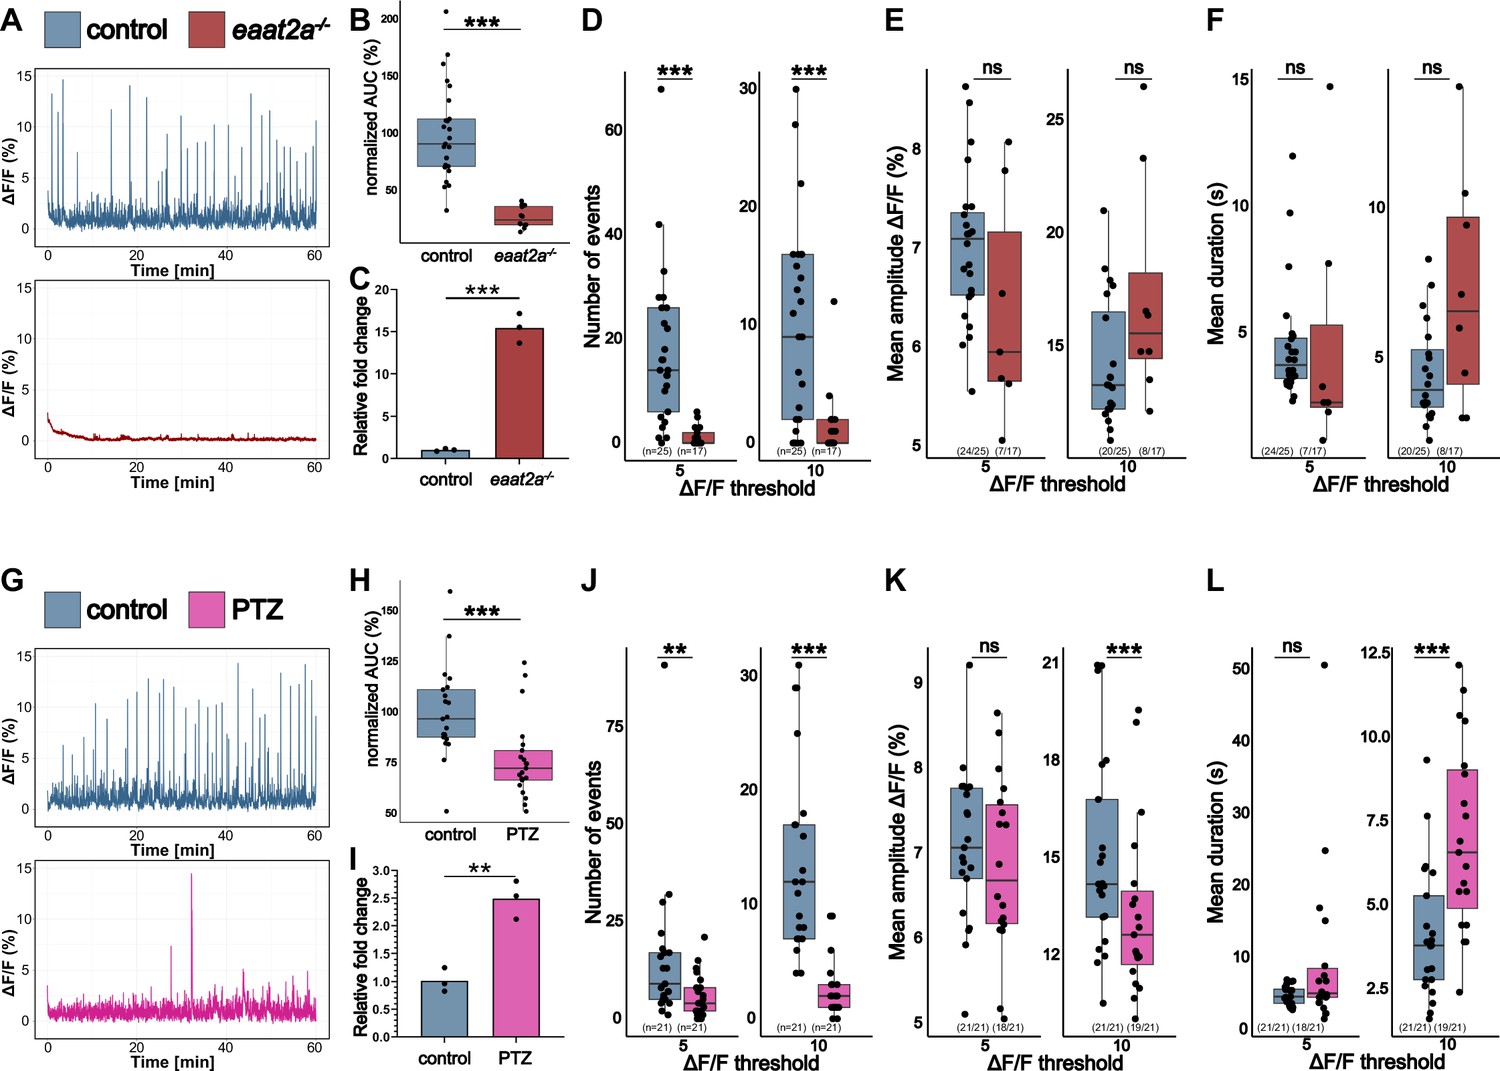
gal expression correlates with whole-brain activity.
(A) Representative calcium signals (elavl3:GCaMP5G) recorded across the brain of 5 dpf control (eaat2a+/+) larva (blue, top) and eaat2a-/- mutant without seizure activity (red, bottom). (B) Area under the curve (AUC) calculated and averaged over two 5 min time windows per animal and normalized to control (n control = 25; n eaat2a-/- = 12). (C) Galanin transcript levels in pools of control vs. eaat2a-/- brains (n = 3). (D) Number of Ca2+ events above 5% ΔF/F0 (left) and 10% ΔF/F0 (right). (E) Average amplitude of Ca2+ events above 5% ΔF/F0 (left) and 10% ΔF/F0 (right) per larva. (F) Average duration of Ca2+ events above 5% ΔF/F0 (left) and 10% ΔF/F0 (right) per larva. (G) Representative calcium signals (elavl3:GCaMP6f) recorded across the brain of 5 dpf control (blue, top) and larvae 2 hr after pentylenetetrazole (PTZ) exposure (PTZ rebound) (magenta, bottom). (H) AUC calculated over 1 hr recording, normalized to control (n control = 21; n PTZ rebound = 21). (I) Galanin transcript levels in pools of control vs. PTZ rebound brains (n = 3). (G) Number of Ca2+ events above 5% ΔF/F0 (left) and 10% ΔF/F0 (right). (J) Average amplitude of Ca2+ events above 5% ΔF/F0 (left) and 10% ΔF/F0 (right) per larva. (K) Average duration of Ca2+ events above 5% ΔF/F0 (left) and 10% ΔF/F0 (right) per larva. Significance levels: ***p<0.001, **p<0.01, *p<0.05, ns = not significant (p>0.05), Wilcoxon-Mann-Whitney test (B, E, H, J, K), negative binomial regression (D, I), Student’s t-test (C, F).
Figure 2 with 2 supplements
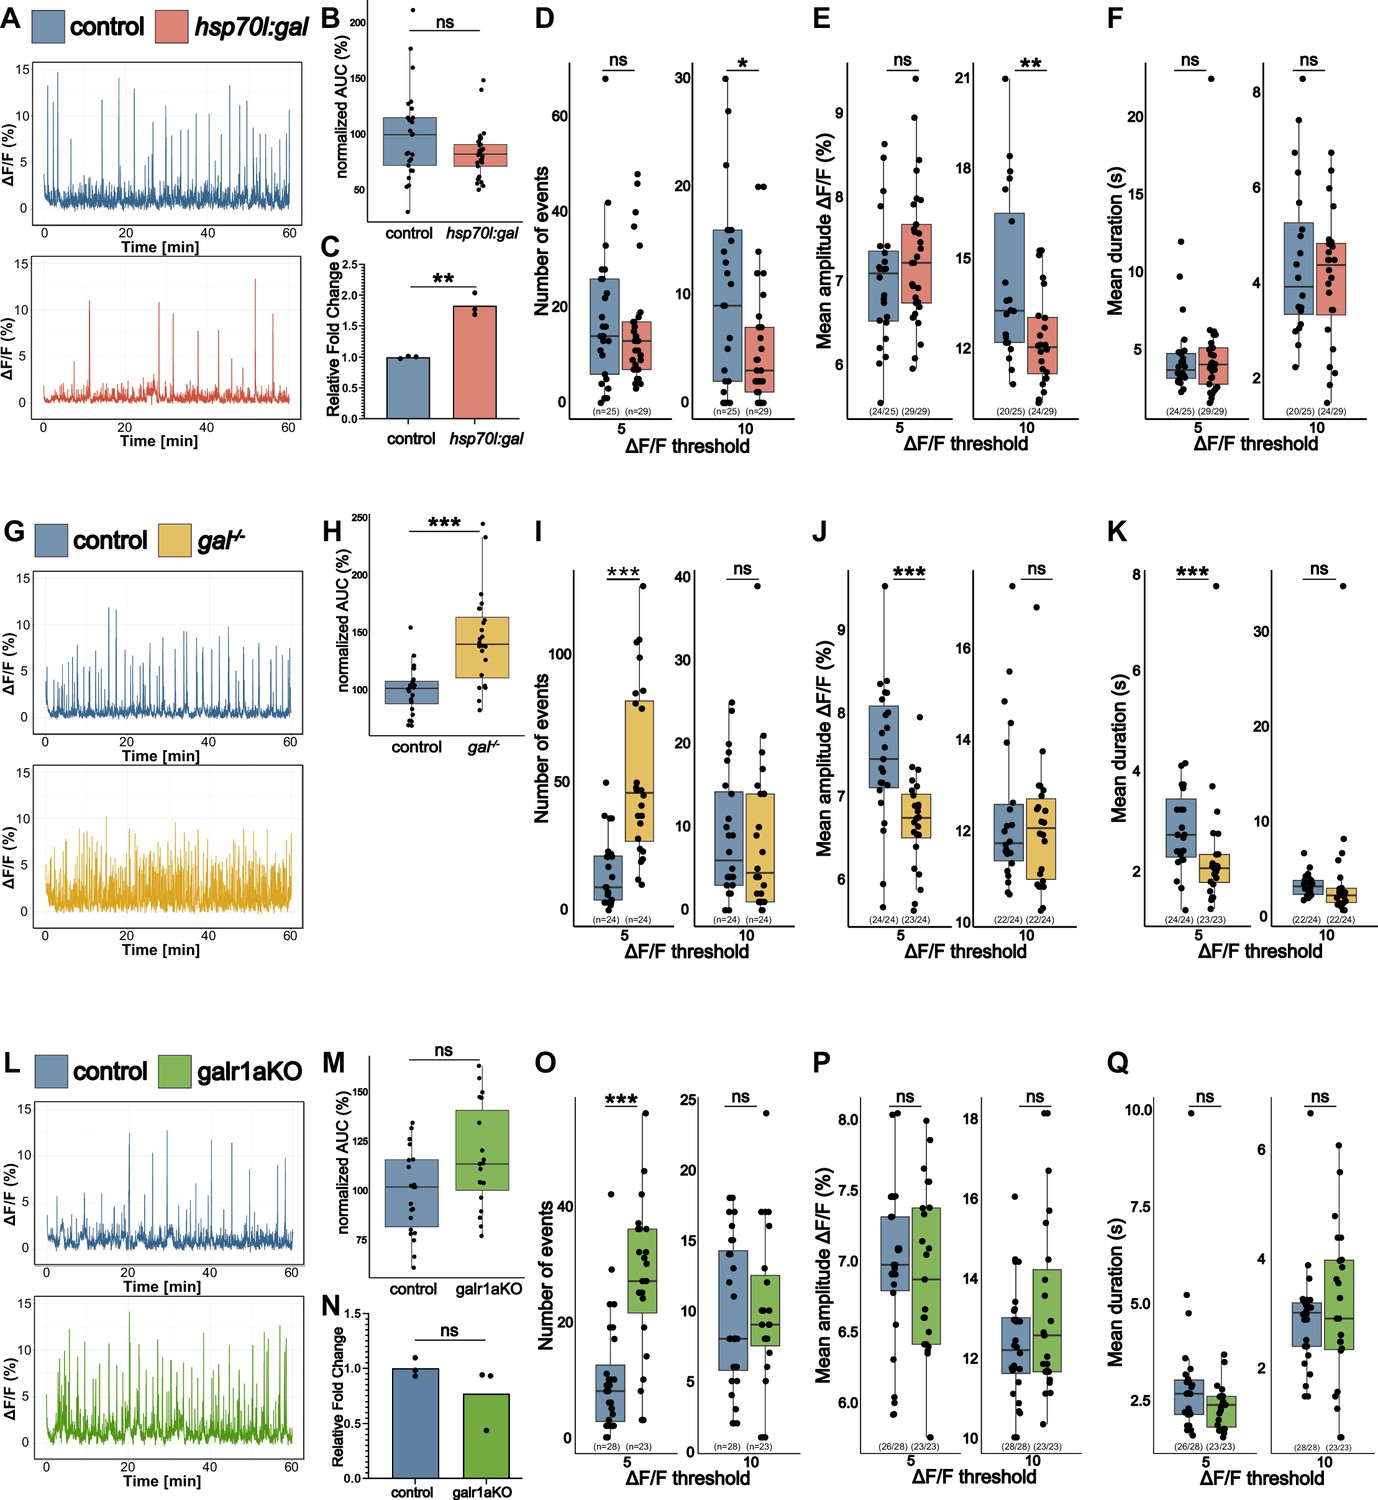
gal controls whole-brain activity.
(A) Representative calcium signals (elavl3:GCaMP5G) recorded across the brain of 5 dpf control (blue, top) and hsp70l:gal sibling (orange, bottom). (B) Area under the curve (AUC) calculated over 1 hr recording, normalized to control (n control = 25; n hsp70l:gal = 29). (C) Galanin transcript levels in pools of control vs. hsp70l:gal brains (n = 3). (D) Number of Ca2+ events above 5% ΔF/F0 (left) and 10% ΔF/F0 (right). (E) Average amplitude of Ca2+ events above 5% ΔF/F0 (left) and 10% ΔF/F0 (right) per larva. (F) Average duration of Ca2+ events above 5% ΔF/F0 (left) and 10% ΔF/F0 (right) per larva. (G) Representative calcium signals (elavl3:GCaMP5G) recorded across the brain of 5 dpf control (blue, top) and gal-/- larva (yellow, bottom). (H) AUC calculated over 1 hr recording, normalized to control (n control = 24; n gal-/- = 24). (I) Number of Ca2+ events above 5% ΔF/F0 (left) and 10% ΔF/F0 (right). (J) Average amplitude of Ca2+ events above 5% ΔF/F0 (left) and 10% ΔF/F0 (right) per larva. (K) Average duration of Ca2+ events above 5% ΔF/F0 (left) and 10% ΔF/F0 (right) per larva. (L) Representative calcium signals (elavl3:GCaMP6f) recorded across the brain of 5 dpf control injected (blue, top) and galr1a crispants (galr1aKO) larva (green, bottom). (M) AUC calculated over 1 hr recording, normalized to control (n control = 28; n galr1a crispants = 23). (N) Galanin transcript levels in pools of control vs. galr1aKO brains (n = 3). (O) Number of Ca2+ events above 5% ΔF/F0 (left) and 10% ΔF/F0 (right). (P) Average amplitude of Ca2+ events above 5% ΔF/F0 (left) and 10% ΔF/F0 (right) per larva. (Q) Average duration of Ca2+ events above 5% ΔF/F0 (left) and 10% ΔF/F0 (right) per larva. Significance levels: ***p<0.001, **p<0.01, *p<0.05, ns = not significant (p>0.05), Wilcoxon-Mann-Whitney test (B, E, F, H, J, K, M, O, P), negative binomial regression (D).
Figure 2—figure supplement 1
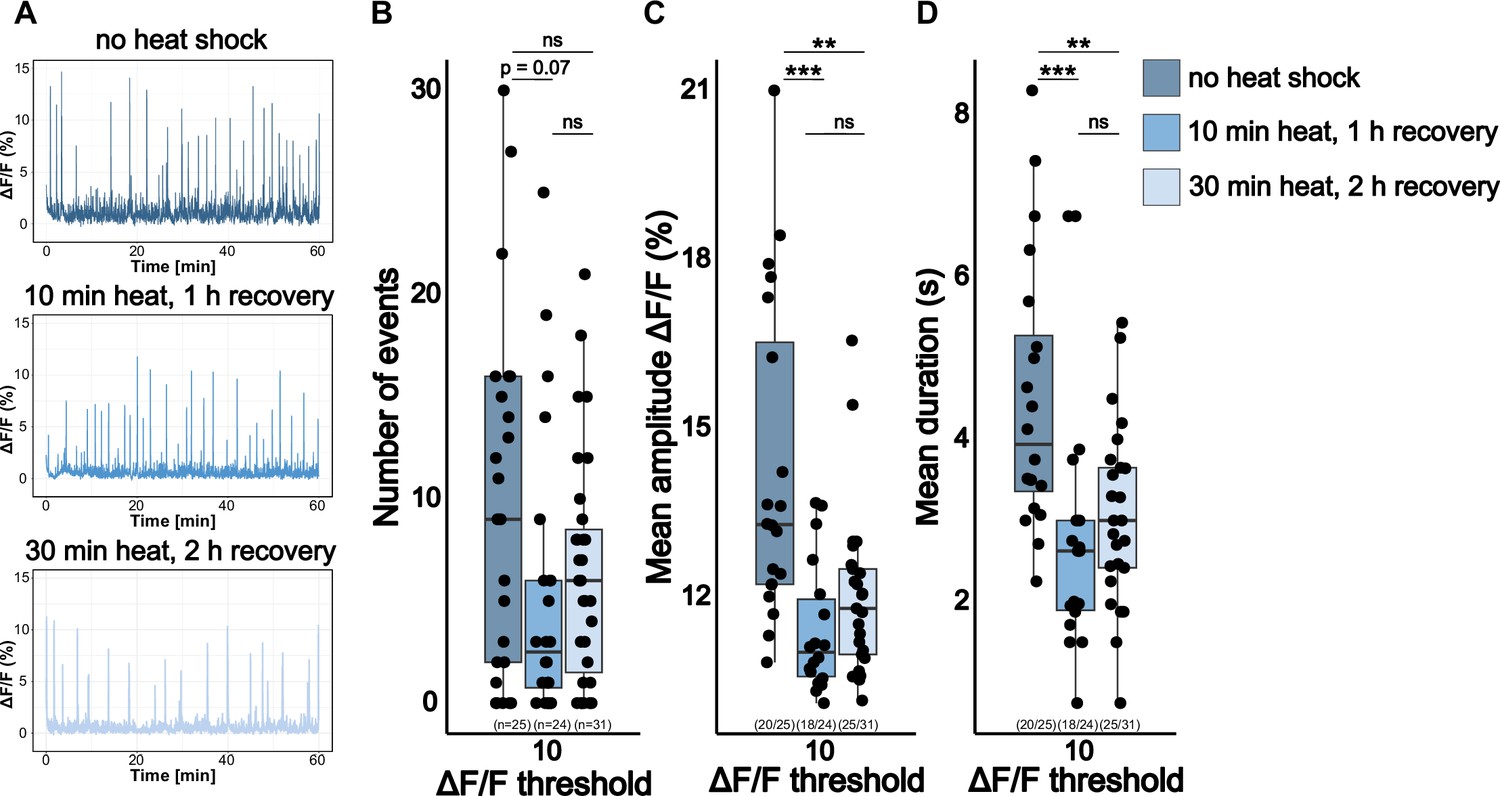
Heat shock decreases brain activity of 5 dpf wild-type larvae.
(A) Representative calcium signals (elavl3:GCaMP5G) recorded across the brain of 5 dpf unexposed wild-type larva (blue, top) and 5 dpf wild-type larvae with a 37 °C heat shock for either 10 min (steelblue blue, middle) or 30 min (light blue, bottom) with different recovery times at room temperature. Significance levels: ***p<0.001, **p<0.01, *p<0.05, ns = not significant (p>0.05), Wilcoxon-Mann-Whitney test (C, D), negative binomial regression (B).
Figure 2—figure supplement 2
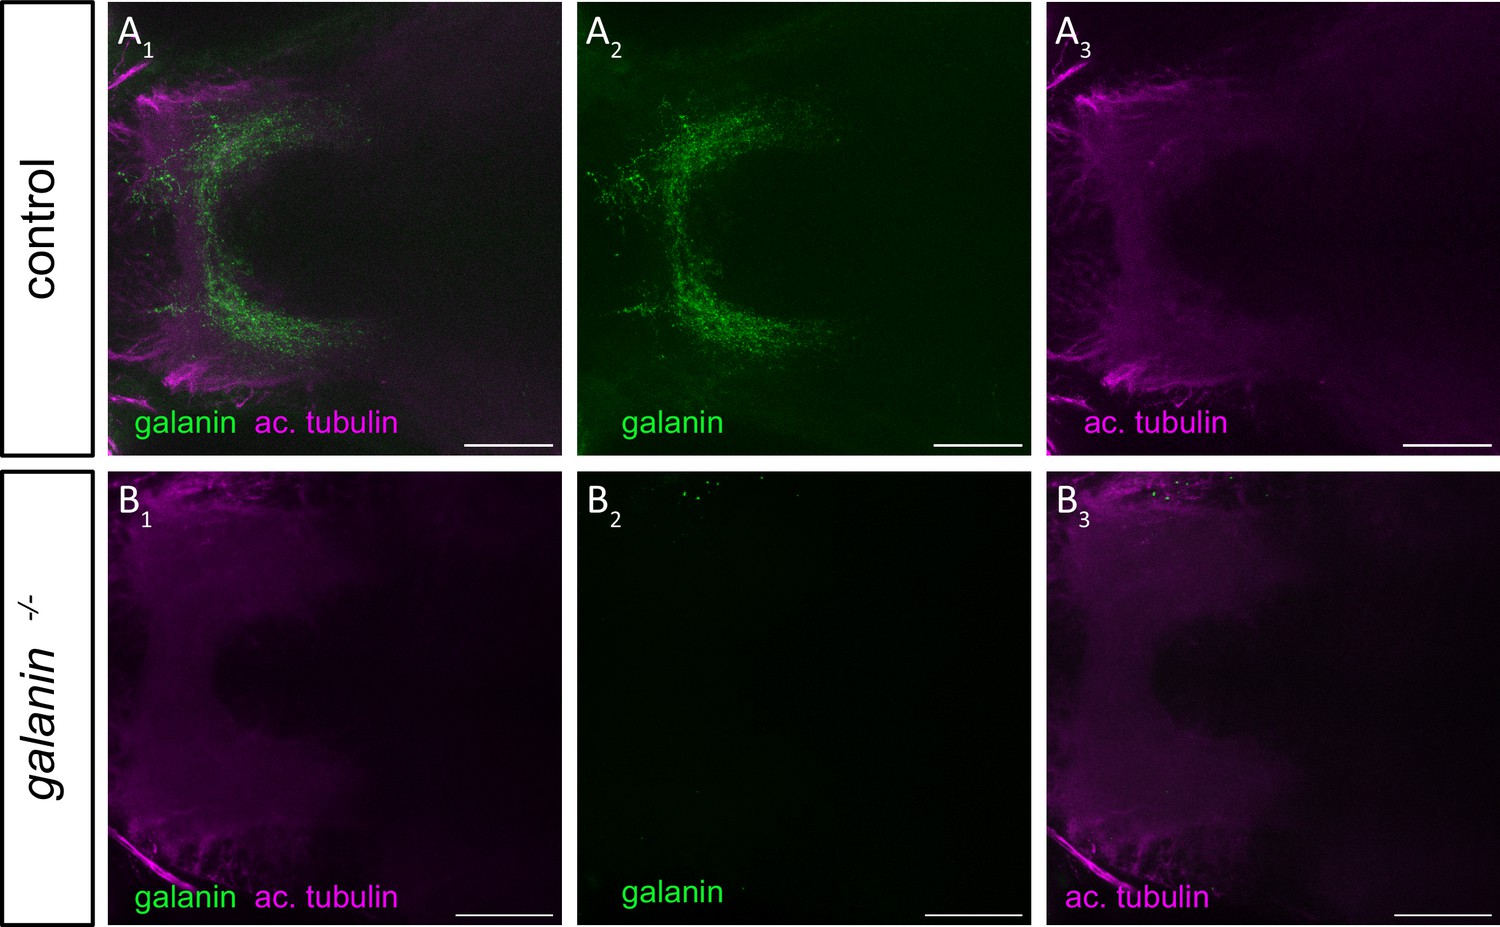
Immunostaining confirms protein deficiency in gal -/- mutants whole-mount immunostaining of galanin localized in the diencephalon of 5 dpf zebrafish larvae.
Antibodies used for staining included anti-galanin (green) and anti-ac. tubulin (acetylated tubulin, magenta). (A1) representative galanin staining in control larvae. (A2, A3) Single immunohistochemical channels. (B1) representative galanin staining in gal -/- larvae. (B2, B3) Single immunohistochemical channels. Scale bar = 25 μm.
Figure 3
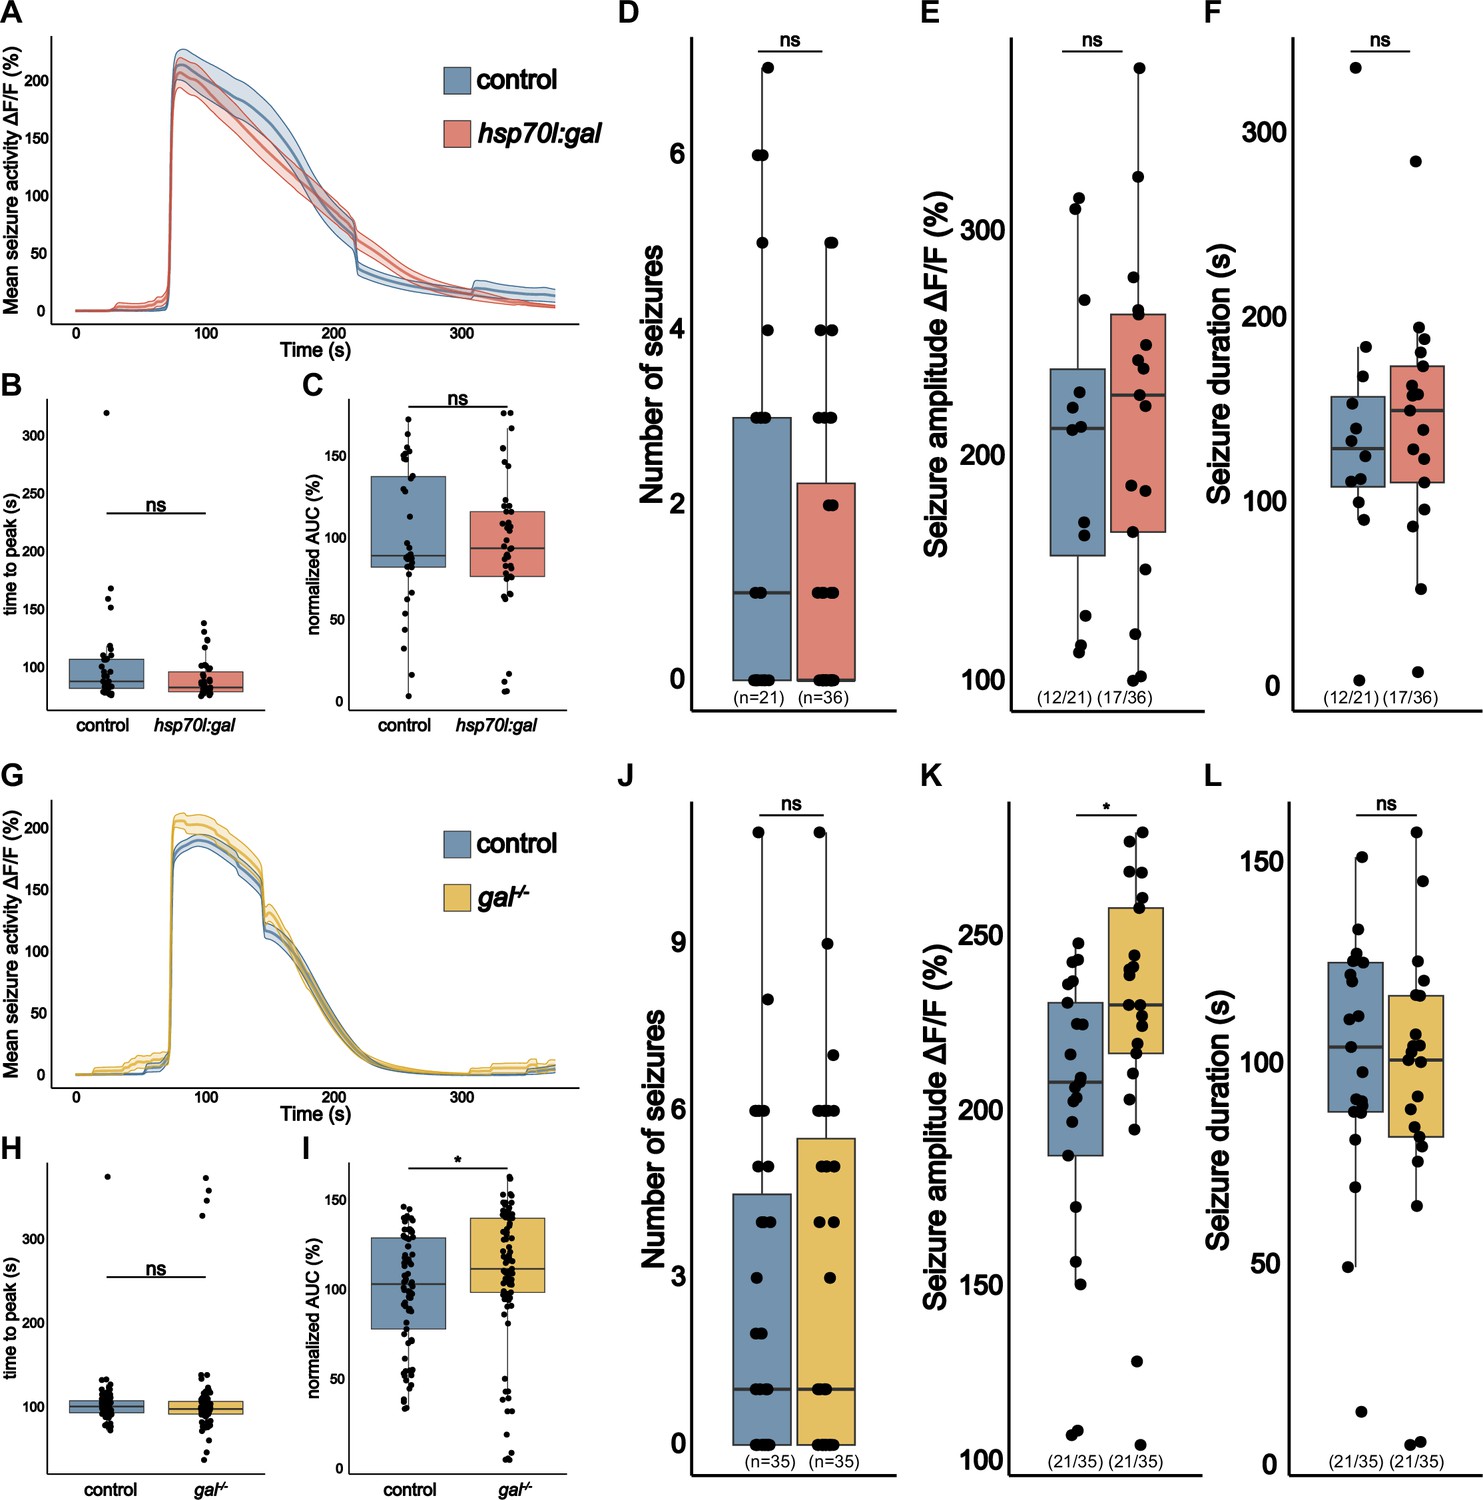
gal Exerts a modest effect on seizure activity in eaat2a-/- mutants.
(A) Averaged calcium signals (elavl3:GCaMP5G) for spontaneous seizures recorded across the brain of 5 dpf control (eaat2a-/-) larva (blue, 35 events) and eaat2a-/-;hsp70l:gal (orange, 39 events) aligned by 50% of maximum amplitude. Shaded area represents SEM. (B) Time to peak calculated from beginning of aligned seizure until maximum ΔF/F0 signal. (C) Area under the curve (AUC) calculated over spontaneous seizures normalized to control (n control = 35; n eaat2a-/-;hsp70l:gal = 39). (D) Number of spontaneous seizures per larva. (E) Amplitude of spontaneous seizures per larva. (F) Duration of spontaneous seizures per larva. (G) Averaged calcium signals (elavl3:GCaMP5G) for spontaneous seizures recorded across the brain of 5 dpf control (eaat2a-/-) larva (blue, 77 events) and eaat2a-/-;gal-/- (yellow, 89 events) aligned by 50% of maximum amplitude. Shaded area represents SEM. (H) Time to peak calculated from beginning of aligned seizure until maximum ΔF/F0 signal. (I) AUC calculated over spontaneous seizures normalized to control (n control = 77; n eaat2a-/-;gal-/- = 89). (J) Number of spontaneous seizures per larva. (K) Amplitude of spontaneous seizures per larva. (L) Duration of spontaneous seizures per larva. Significance levels: ***p<0.001, **p<0.01, *p< 005, ns = not significant (p>0.05), Wilcoxon-Mann-Whitney test (B, C, E, F, H, I, K, L), negative binomial regression (D, J).
Figure 4
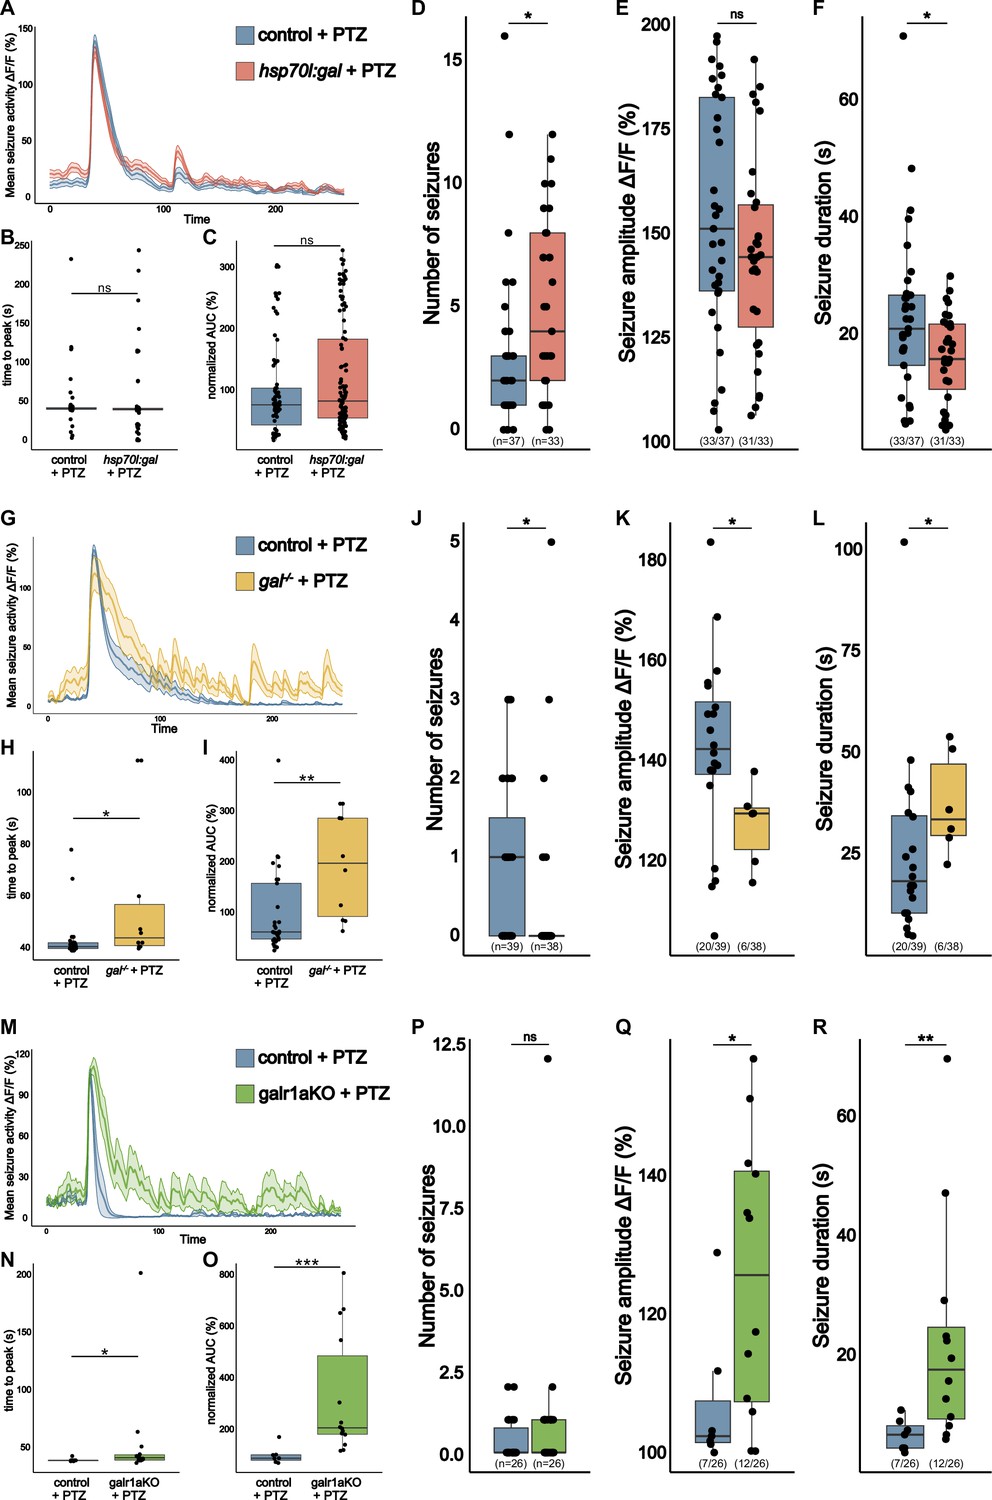
gal promotes seizures in pentylenetetrazole (PTZ) exposed larvae.
(A) Averaged calcium signals (elavl3:GCaMP6f) for seizures elicited by 20 mM PTZ recorded across the brain of 5 dpf control (blue, 76 events) and hsp70l:gal (orange, 113 events) aligned by 50% of maximum amplitude. Shaded area represents SEM. (B) Time to peak calculated from beginning of aligned seizure until maximum ΔF/F0 signal. (C) Area under the curve (AUC) calculated over seizures normalized to control (n control = 76; n hsp70l:gal = 113). (D) Number of seizures per larva. (E) Amplitude of seizures per larva. (F) Duration of seizures per larva. (G) Averaged calcium signals (elavl3:GCaMP6f) for seizures elicited by 20 mM PTZ recorded across the brain of 5 dpf control (blue, 29 events) and gal-/- (yellow, 10 events) aligned by 50% of maximum amplitude. Shaded area represents SEM. (H) Time to peak calculated from beginning of aligned seizure until maximum ΔF/F0 signal. (I) AUC calculated over seizures normalized to control (n control = 29; n gal-/- = 10). (J) Number of seizures per larva. (K) Amplitude of seizures per larva. (L) Duration of seizures per larva. (M) Averaged calcium signals (elavl3:GCaMP6f) for seizures elicited by 20 mM PTZ recorded across the brain of 5 dpf control injected (blue, seven events) and galr1a crispants (galr1aKO, green, 14 events) aligned by 50% of maximum amplitude. Shaded area represents SEM. (N) Time to peak calculated from beginning of aligned seizure until maximum ΔF/F0 signal. (O) AUC calculated over seizures normalized to control (n control = 7; n galr1a crispants = 14). (P) Number of seizures per larva. (Q) Amplitude of seizures per larva. (R) Duration of seizures per larva. Significance levels: ***p<0.001, **p<0.01, *p<0.05, ns = not significant (p>0.05), Wilcoxon-MannWhitnMann Whitney (B, C, E, F, H, I, K, L, N, O, Q, R), negative binomial regression (D, J, P).
Videos
Video 1
Whole brain activity recording in control and hsp70:gal larvae.
Representative raw data of recorded calcium signals (elavl3:GCaMP5G) recorded across the brain of 5 dpf control (left) and hsp70:gal (right, galanin-OE) over a 15 min time period chosen at random. The recordings were exported with 7fps. Both larvae were recorded on the same day.
Video 2
Whole brain activity recording in control and gal-/- larvae.
Representative raw data of recorded calcium signals (elavl3:GCaMP5G) recorded across the brain of 5 dpf control (left) and gal-/- (right, galanin-KO) over a 15 min time period chosen at random. The recordings were exported with 7fps. Both larvae were recorded on the same day.
Video 3
Whole brain activity recording in control and galr1aKO larvae.
Representative raw data of recorded calcium signals (elavl3:GCaMP5G) recorded across the brain of 5 dpf control (left) and galr1aKO (right) over a 15 min time period chosen at random. The recordings were exported with 7fps. Both larvae were recorded on the same day.
Video 4
Seizure recordings in control and hsp70:gal larvae in eaat2a -/- background.
Representative raw data of recorded calcium signals (elavl3:GCaMP5G) during a typical seizure recorded across the brain of 5 dpf control (left) and hsp70:gal (right, galanin-OE) in eaat2a -/- background. The seizures were captured over 150 frames (about 1 min 50 s recording) and exported with 7fps. Both larvae were recorded on the same day.
Video 5
Seizure recordings in control and gal-/- larvae in eaat2a -/- background.
Representative raw data of recorded calcium signals (elavl3:GCaMP5G) during a typical seizure recorded across the brain of 5 dpf control (left) and gal-/- (right, galanin-KO) in eaat2a -/- background. The seizures were captured over 150 frames (about 1 min 50 s recording) and exported with 7fps. Both larvae were recorded on the same day.
Video 6
Seizure recordings in control and hsp70:gal larvae acutely exposed to 20 mM PTZ.
Representative raw data of recorded calcium signals (elavl3:GCaMP5G) during a typical seizure recorded across the brain of 5 dpf control (left) and hsp70:gal (right, galanin-OE) acutely exposed to 20 mM PTZ. The seizures were captured over 125 frames (about 1 min 50 s recording) and exported with 7fps. Both larvae were recorded on the same day.
Video 7
Seizure recordings in control and gal-/- larvae acutely exposed to 20 mM PTZ.
Representative raw data of recorded calcium signals (elavl3:GCaMP5G) during a typical seizure recorded across the brain of 5 dpf control (left) and gal-/- (right, galanin-KO) acutely exposed to 20 mM PTZ. The seizures were captured over 125 frames (about 1 min 50 s recording) and exported with 7fps. Both larvae were recorded on the same day.
Video 8
Seizure recordings in control and galr1aKO larvae acutely exposed to 20 mM PTZ.
Representative raw data of recorded calcium signals (elavl3:GCaMP5G) during a typical seizure recorded across the brain of 5 dpf control (left) and galr1aKO (right) acutely exposed to 20 mM PTZ. The seizures were captured over 125 frames (about 1 min 50 s recording) and exported with 7fps. Both larvae were recorded on the same day.
Additional files
Download links
A two-part list of links to download the article, or parts of the article, in various formats.
Downloads (link to download the article as PDF)
Open citations (links to open the citations from this article in various online reference manager services)
Cite this article (links to download the citations from this article in formats compatible with various reference manager tools)
Multifaceted role of galanin in brain excitability
eLife 13:RP98634.
https://doi.org/10.7554/eLife.98634.4


