Human CD29+/CD56+ myogenic progenitors display tenogenic differentiation potential and facilitate tendon regeneration
- Department of Orthopedic Surgery, Xinhua Hospital Affiliated to Shanghai Jiao Tong University School of Medicine, China
- Department of Sports Medicine, Peking University Third Hospital, Institute of Sports Medicine of Peking University, Beijing Key Laboratory of Sports Injuries, China
- Department of Bioinformatics, Fujian Key Laboratory of Medical Bioinformatics. School of Medical Technology and Engineering. Fujian Medical University, China
- State Key Laboratory of Cell Biology, Shanghai Institute of Biochemistry and Cell Biology, Center for Excellence in Molecular Cell Science, Chinese Academy of Sciences, China
- Department of Orthopedic Surgery, Wuhan Third Hospital, Tongren Hospital of Wuhan University, China
- Guangzhou Laboratory, China
- Institute for Stem Cell and Regeneration, Chinese Academy of Sciences, China
Figures
Figure 1
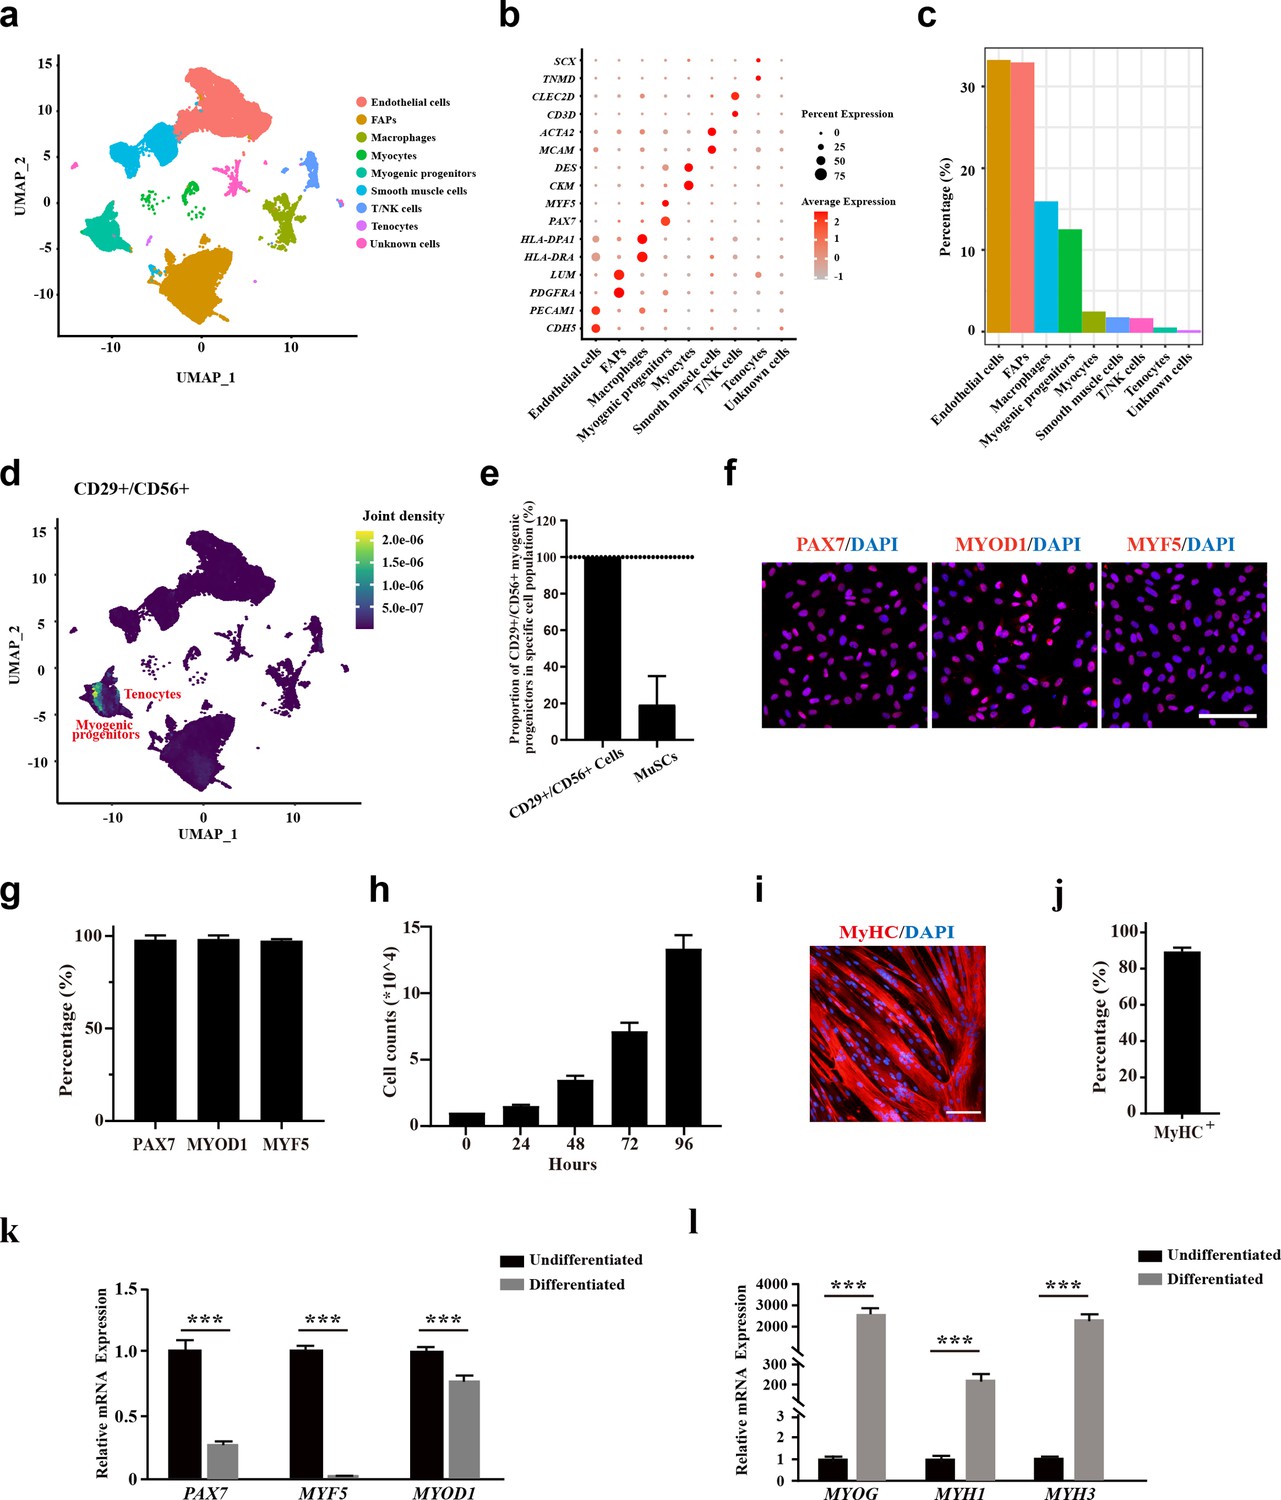
The CD29+/CD56+ cells isolated from human muscle biopsies display robust features of myogenic progenitors.
(a) UMAP plot of all mononuclear cells isolated from human skeletal muscle which were colored by cell clusters. Three samples with a total of 57,193 cells were included for analysis. (b) Dot blot of representative genes in each cell cluster. (c) Bar plot of cell proportion for each cell cluster. (d) Plot of joint expression analysis for CD29+/CD56+ cells in total mononuclear cells isolated from human skeletal muscle. (e) Proportion of CD29+/CD56+ myogenic progenitors in specific cell population. Error bars indicate standard deviation (n=3). (f) Immunofluorescence staining of PAX7, MYOD1, and MYF5 in primary human CD29+/CD56+ myogenic progenitors. Scale bars, 100 µm.(g) Statistical analysis of the percentage of PAX7+, MYOD1+, and MYF5+ cells in the isolated CD29+/CD56+ myogenic progenitors. Error bars indicate standard deviation (n=5). (h) Analysis of cell proliferation for human CD29+/CD56+ myogenic progenitors in vitro. 10,000 isolated human CD29+/CD56+ myogenic progenitors were plated for proliferation and counted at each time point. Error bars indicate standard deviation (n=3). (I) Immunofluorescence staining of MyHC in myotubes differentiated from human CD29+/CD56+ myogenic progenitors. Primary human CD29+/CD56+ myogenic progenitors were isolated and differentiated to myotubes for 5 days followed by MyHC immunofluorescence staining. Scale bars, 100 µm. (j) Statistical analysis of the percentage of nuclei in MyHC+ myotubes after differentiation of the human CD29+/CD56+ myogenic progenitors. Error bars indicate standard deviation (n=5). (k) Relative expression level of PAX7, MYF5, and MYOD1 in human CD29+/CD56+ myogenic progenitors (Undifferentiated) and differentiated myotubes (Differentiated). RT-qPCR assays were performed for human CD29+/CD56+ myogenic progenitors before and after myogenic differentiation. GAPDH served as a reference gene. Error bars indicate standard deviation (n=3). ***p<0.001. (l) Relative expression level of MYOG, MYH1, and MYH3 in human CD29+/CD56+ myogenic progenitors (Undifferentiated) and differentiated myotubes (Differentiated). RT-qPCR assays were performed for human CD29+/CD56+ myogenic progenitors before and after myogenic differentiation. GAPDH served as a reference gene. Error bars indicate standard deviation (n=3). ***p<0.001.
Figure 2 with 1 supplement
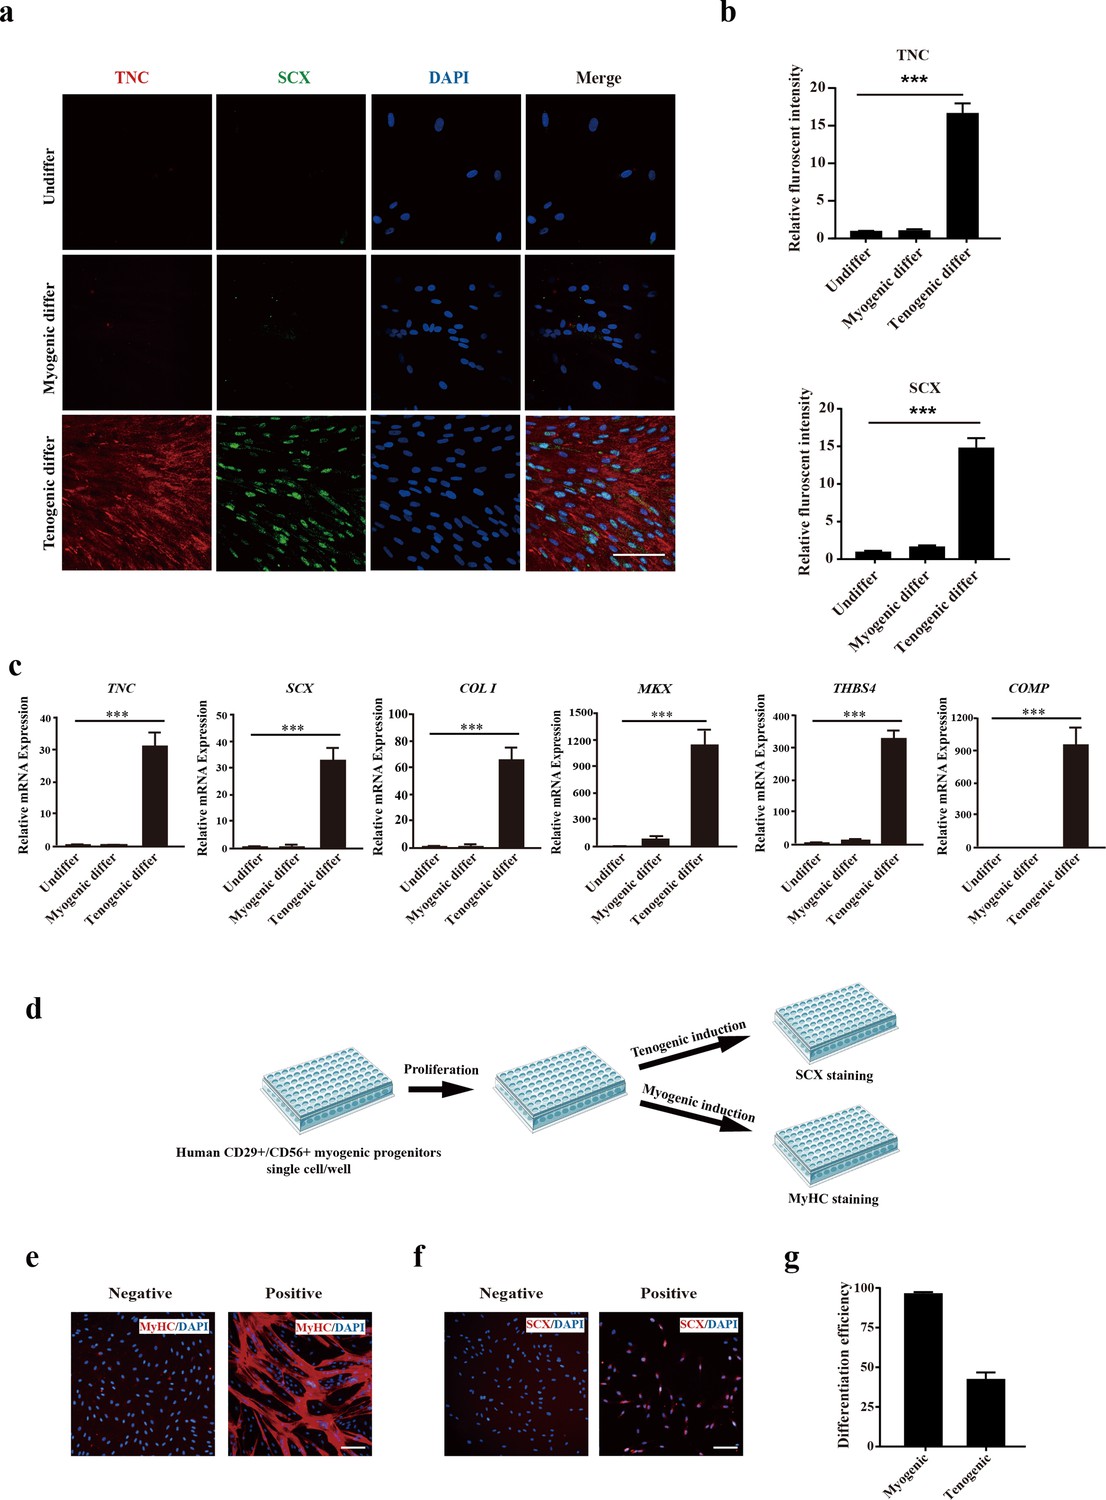
Human CD29+/CD56+ myogenic progenitors display tendon differentiation ability in vitro.
(a) Immunofluorescence staining of tendon marker TNC and SCX in human CD29+/CD56+ myogenic progenitors induced for myogenic and tenogenic differentiation, respectively. Scale bars, 100 µm. (b) Quantification of TNC and SCX fluorescent intensity in human CD29+/CD56+ myogenic progenitors undergoing myogenic and tenogenic differentiation, respectively. Error bars indicate standard deviation (n=5). (c) Relative expression levels of genes enriched in tendon cells. RT-qPCR assays were performed with human CD29+/CD56+ myogenic progenitors upon myogenic and tenogenic differentiation, respectively. GAPDH served as a reference gene. Error bars indicate standard deviation (n=3). ***p<0.001. (d) Scheme of clonal proliferation and differentiation assay. (e) Representative immunofluorescence staining images of MyHC as the marker for successful myogenic differentiation. Scale bars, 100 µm. (f) Representative immunofluorescence staining images of SCX as the marker for successful tenogenic differentiation. Scale bars, 100 µm. (g) Statistical analysis of the myogenic and tenogenic differentiation efficiency of human CD29+/CD56+ myogenic progenitors. Error bars indicate standard deviation (n=3).
Figure 2—figure supplement 1
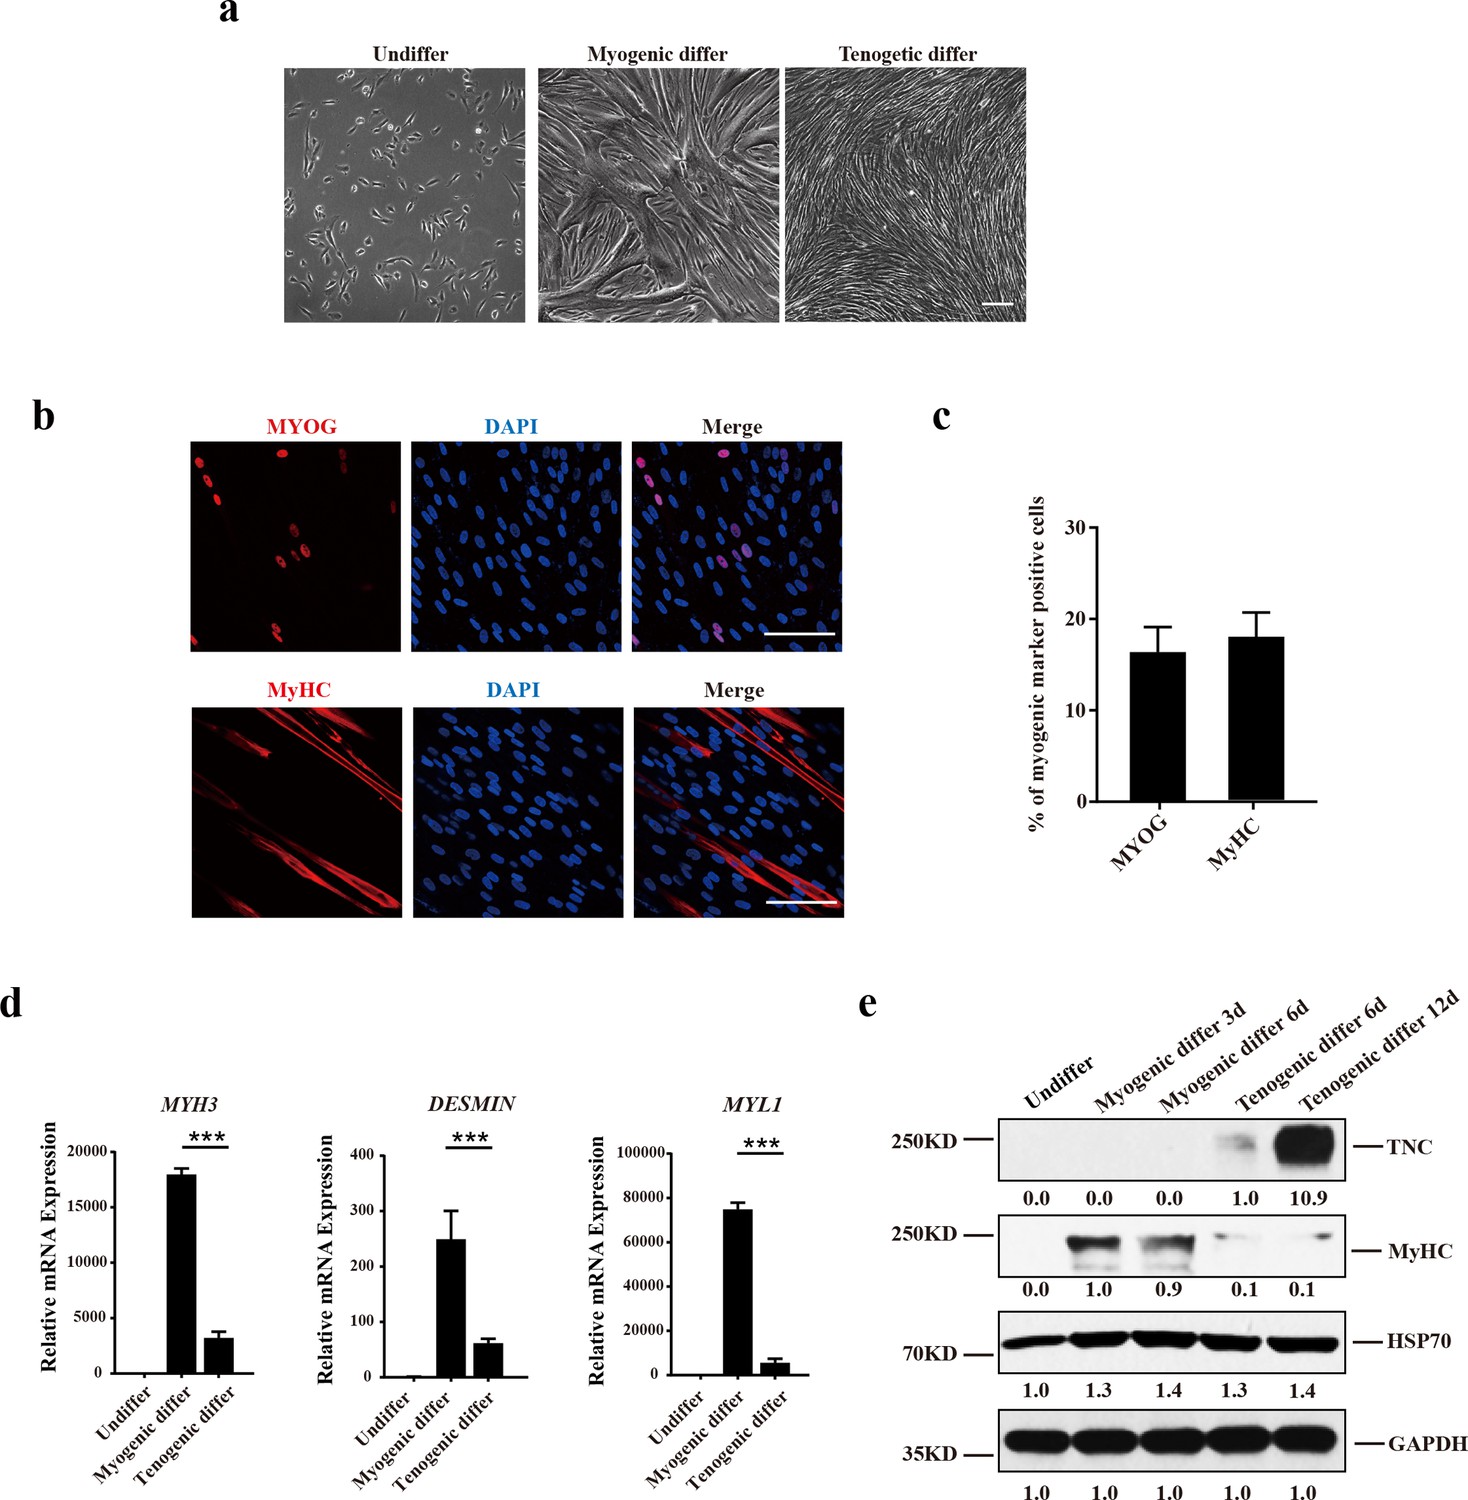
Human CD29+/CD56+ myogenic progenitors display tenogenic differentiation potential.
(a) Phase-contrast images of human CD29+/CD56+ myogenic progenitors before and after differentiation. Scale bars, 100 µm. (b) Immunofluorescence staining of myogenic differentiation marker genes MYOG and MyHC. Human CD29+/CD56+ myogenic progenitors were induced for tenogenic differentiation. The differentiated cells were stained with MYOG and MyHC antibody. Red indicates MYOG or MyHC; DAPI indicates nuclei staining; merge indicates the merged images of red and blue staining. Scale bars, 100 µm. (c) Statistical analysis of the percentage of human cells expressing MYOG or MyHC under tenogenic differentiation condition. Error bars indicate standard deviation (n=5). (d) Expression level of genes marking myogenic differentiation. Human CD29+/CD56+ myogenic progenitors were induced for myogenic and tenogenic differentiation, respectively. The undifferentiated and differentiated cells were subjected to RT-qPCR analysis of MYH3, DESMIN, and MYL1. GAPDH served as a reference gene. Error bars indicate standard deviation (n=5). ***p<0.001. (e) Protein levels of TNC and MyHC. Human CD29+/CD56+ myogenic progenitors were induced toward myogenic and tenogenic differentiation, respectively. Total protein was extracted from cells before and after differentiation and subjected to TNC and MyHC immunoblotting. HSP70 and GAPDH served as loading controls.
-
Figure 2—figure supplement 1—source data 1
Labeled raw data for TNC and MyHC of human CD29+/CD56+ myogenic progenitors which were induced towards myogenic and tenogenic differentiation.
- https://cdn.elifesciences.org/articles/98636/elife-98636-fig2-figsupp1-data1-v1.zip
-
Figure 2—figure supplement 1—source data 2
Raw data for TNC and MyHC of human CD29+/CD56+ myogenic progenitors which were induced towards myogenic and tenogenic differentiation.
- https://cdn.elifesciences.org/articles/98636/elife-98636-fig2-figsupp1-data2-v1.zip
Figure 3
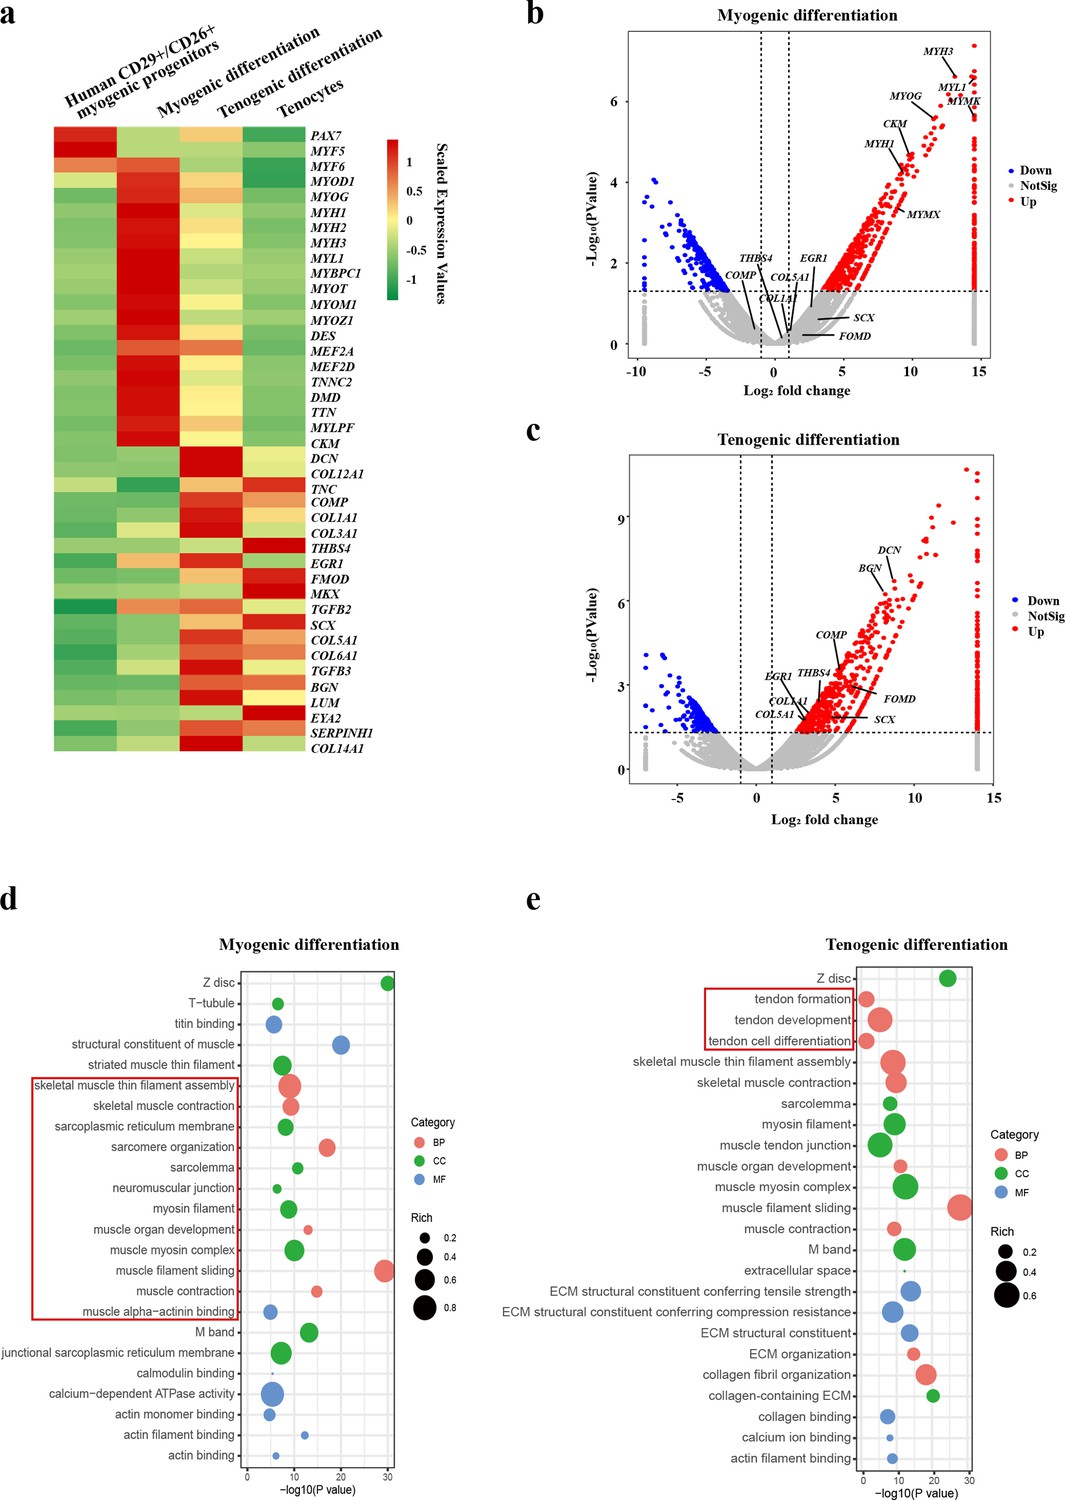
Human CD29+/CD56+ myogenic progenitors have tendon differentiation potential.
(a) Heat map of gene expression profiles of human CD29+/CD56+ myogenic progenitors, human CD29+/CD56+ myogenic progenitors after myogenic differentiation, human CD29+/CD56+ myogenic progenitors after tenogenic differentiation, and primary tenocytes.(b) Volcano plot of genes enriched in myogenic differentiation of human CD29+/CD56+ myogenic progenitors. (c) Volcano plot of genes enriched in tenogenic differentiation of human CD29+/CD56+ myogenic progenitors. (d) Bubble chart of GO analysis of cellular process upregulated in myogenic differentiation of human CD29+/CD56+ myogenic progenitors. (e) Bubble chart of GO analysis of cellular process up-regulated in tenogenic differentiation of human CD29+/CD56+ myogenic progenitors.
Figure 4 with 1 supplement
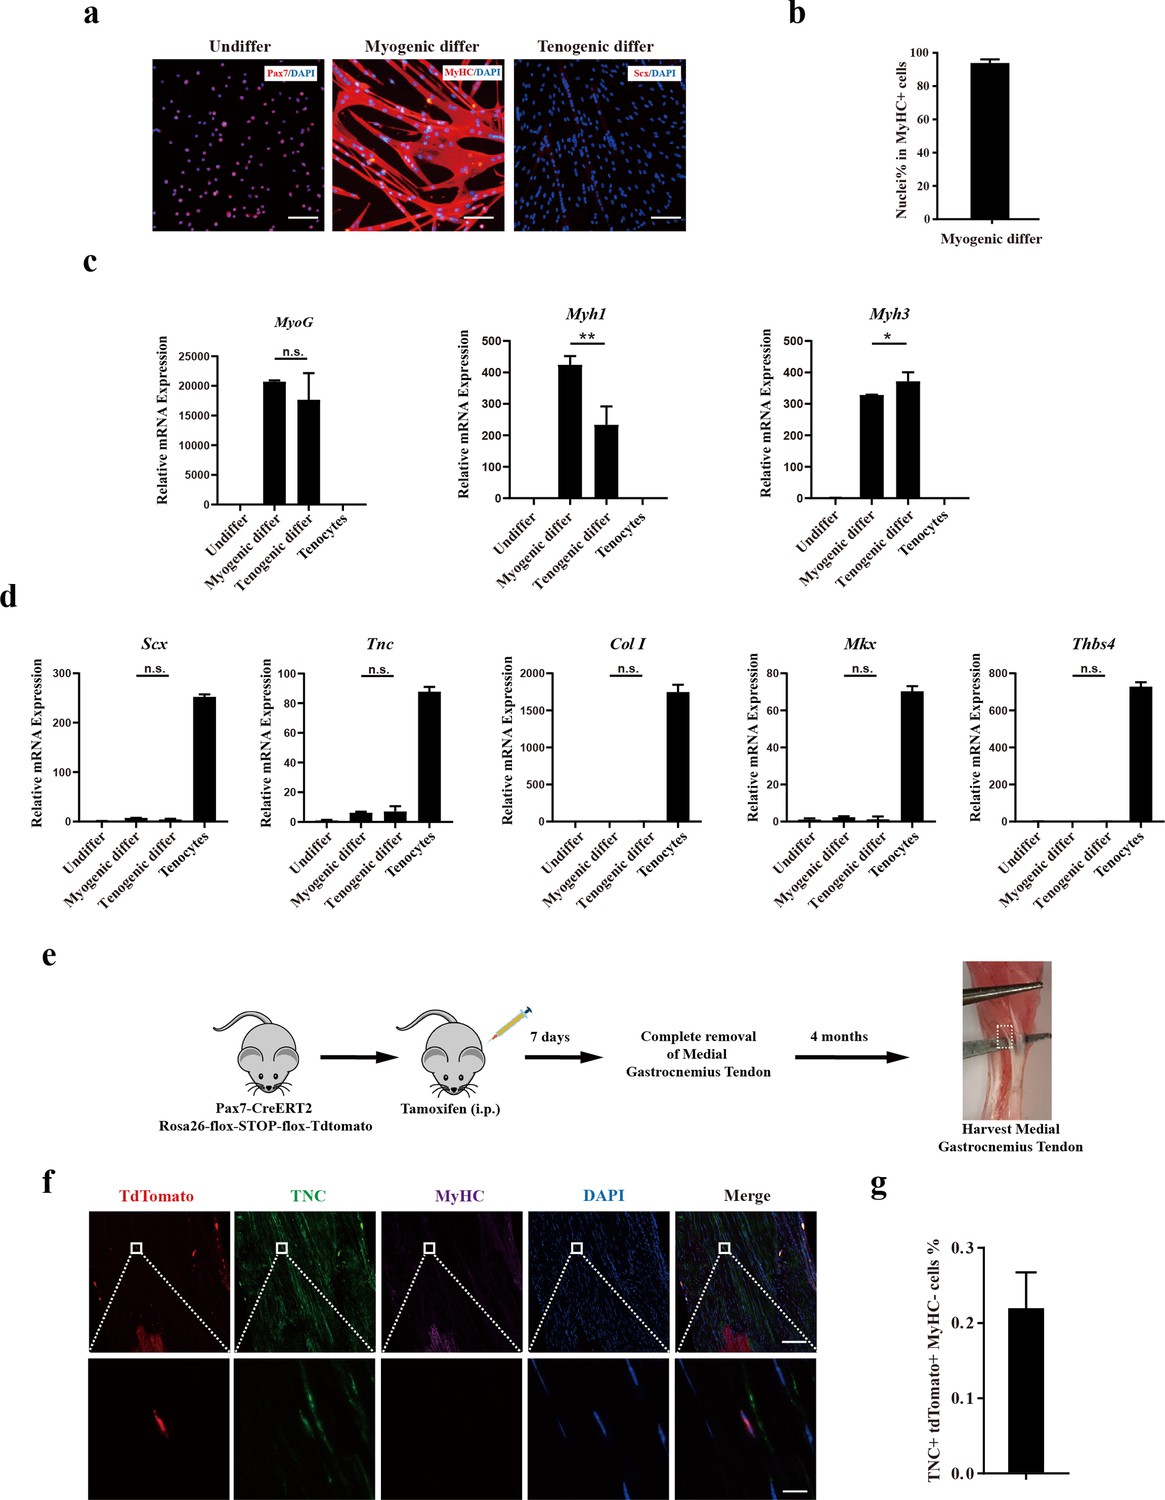
Murine muscle stem cells (MuSCs) display poor tenogenic differentiation ability.
(a) Immunofluorescence staining of murine MuSCs directed toward myogenic and tenogenic differentiation, respectively. The undifferentiated murine MuSCs were stained with Pax7 and DAPI. Murine MuSCs after myogenic differentiation were stained with MyHC and DAPI. Murine MuSCs after tenogenic differentiation were stained with Scx and DAPI. Scale bars, 100 µm. (b) Statistical analysis of the percentage of nuclei in MyHC+ myotubes. Error bars indicate standard deviation (n=5). (c) Relative expression levels of myogenic differentiation-specific genes MyoG, Myh1, and Myh3. Mouse MuSCs were induced to differentiate toward muscle and tendon, respectively. Mouse MuSCs before and after differentiation together with primary tenocytes were harvested and subjected to RT-qPCR analysis. Gapdh served as a reference gene. Error bars indicate standard deviation (n=3). *p<0.05, **p<0.01, n.s. indicated s n>0.05. (d) Relative expression levels of tenogenic differentiation marker genes Scx, Tnc, Col I, Mkx, and Thbs4. Mouse MuSCs were induced to differentiate toward muscle and tendon, respectively. Mouse MuSCs before and after differentiation together with primary tenocytes were harvested and subjected to RT-qPCR analysis. Gapdh served as a reference gene. Error bars indicate standard deviation (n=3). n.s. indicates n>0.05. (e) Scheme of Pax7+ MuSC progeny lineage tracing assay. (f) Immunofluorescence staining of tendon tissue 4 months after injury. tdTomato+ cells indicates the progeny of Pax7+MuSCs. TNC+ cells indicate tendon cells. MyHC+ cells indicate muscle fibers. DAPI indicates nuclei staining. Merged indicates the merged images of tdTomato, TNC, MyHC, and DAPI. The upper panel indicates the low-magnification images. Scale bars, 100 µm. The lower panel indicates the high-magnification images of the region label by white square in the upper panel. Scale bars, 10 µm. (g) The statistical analysis of the percentage of tdTomato+TNC+ cell 4 months after tendon injury. Error bars indicate standard deviation (n=5).
Figure 4—figure supplement 1
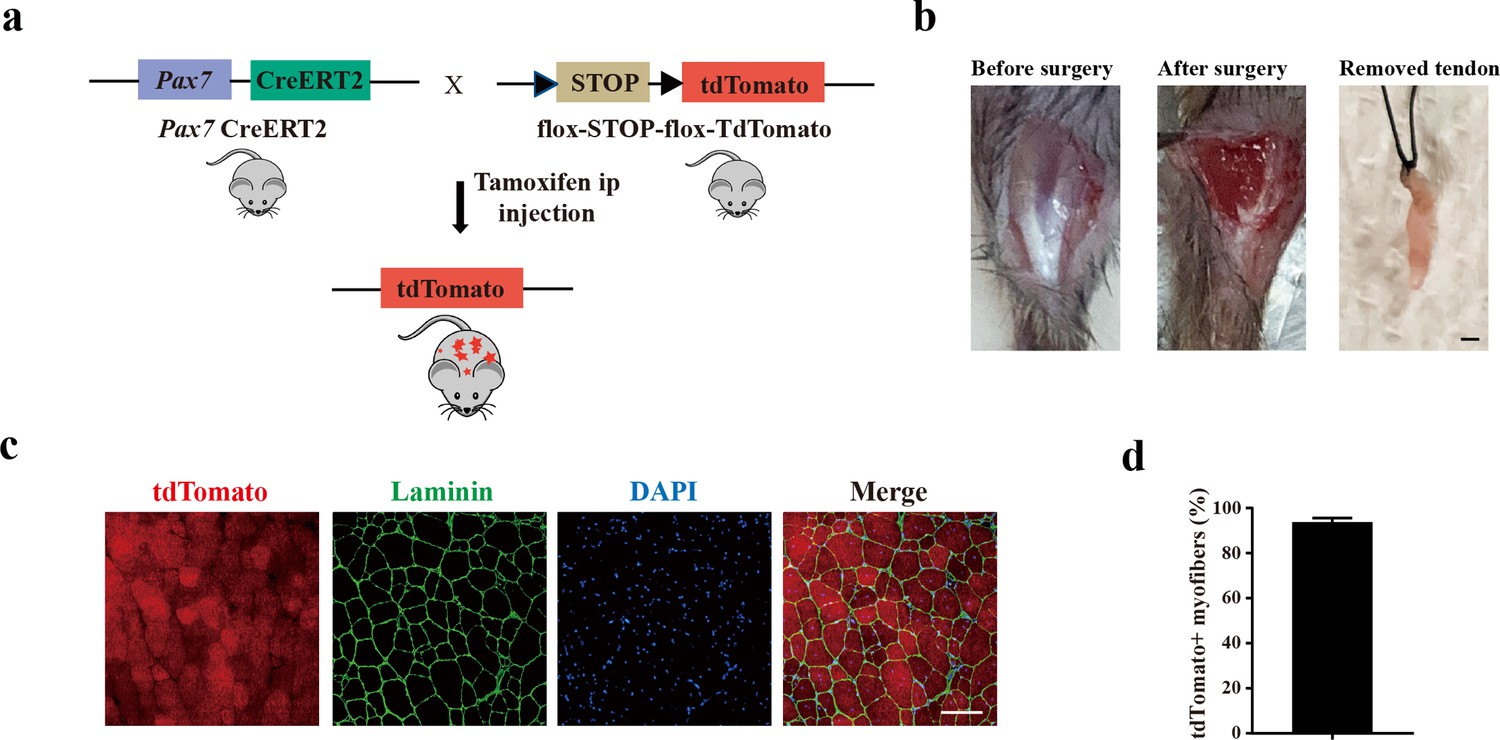
Murine muscle stem cells (MuSCs) display poor tenogenic differentiation ability.
(a) Schematic illustration of the mouse line for murine MuSCs lineage tracing. (b) The surgery in mice mimicking human peroneus longus tendon removal surgery. The medial gastrocnemius tendon was completely removed. Scale bars, 1 mm. (c) Immunofluorescence images of injured muscle adjacent to the removed tendon. The MuSCs were labeled with tdTomato before injury. The tdTomato-positive myofibers after muscle injury were analyzed to evaluate the tracing system. Scale bars, 100 μm. (d) Statistical analysis of the tdTomato-positive myofibers adjacent to the removed tendon. Error bars indicate standard deviation (n=5).
Figure 5 with 1 supplement
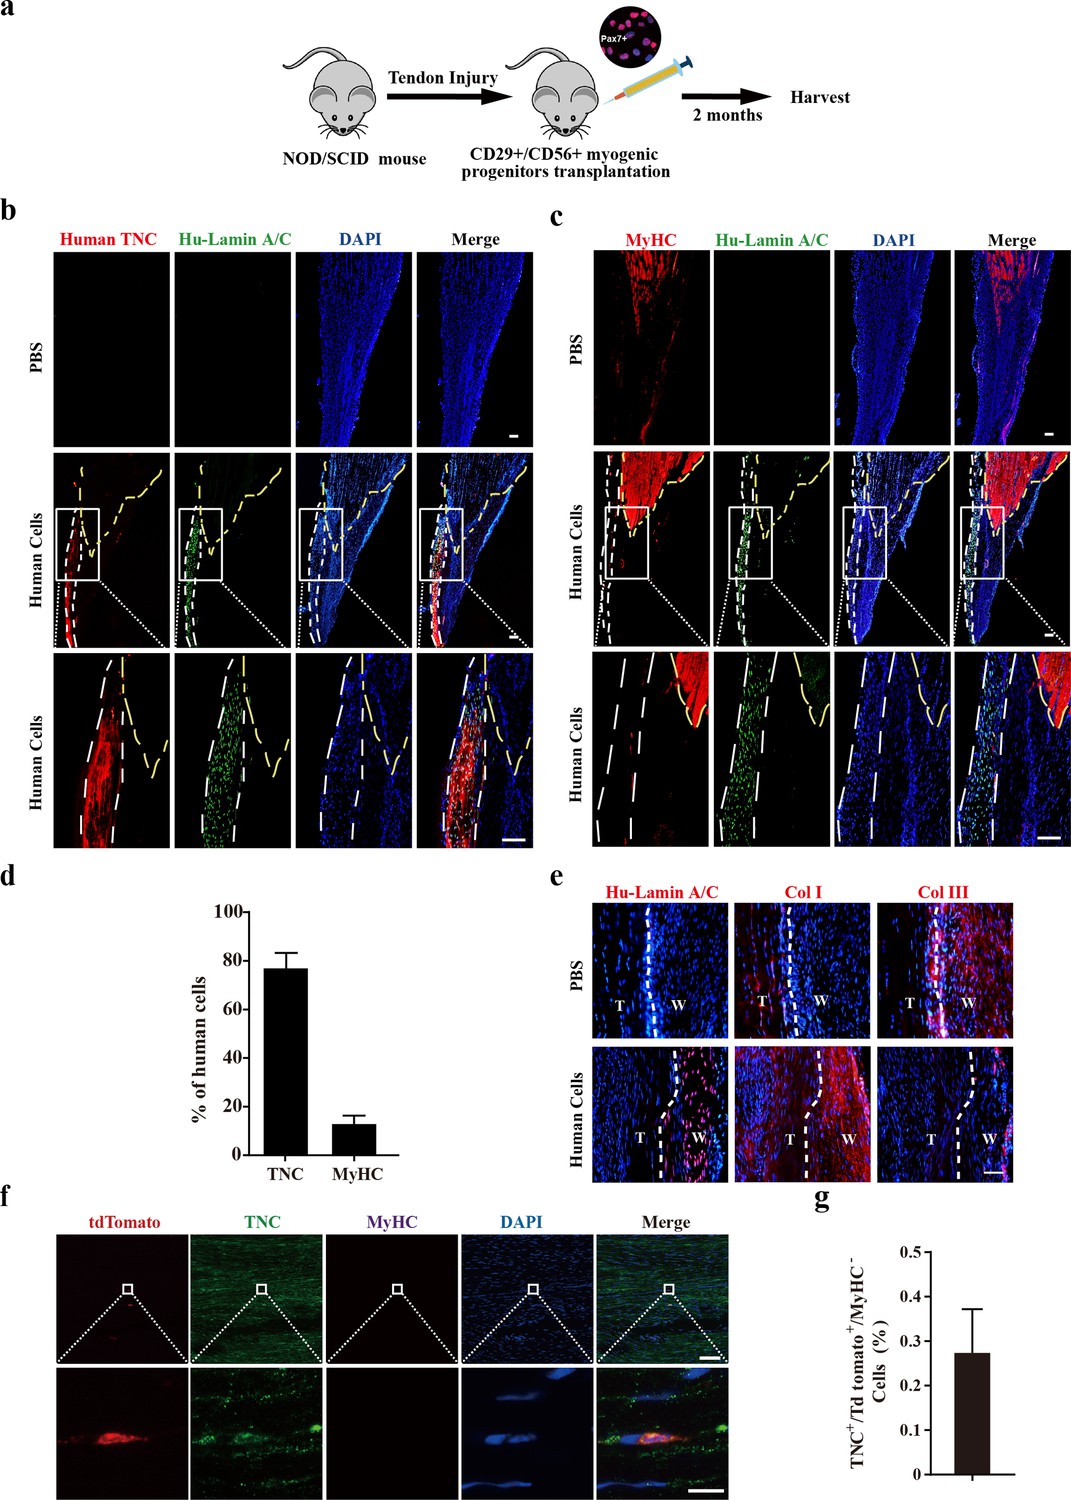
Transplantation of human CD29+/CD56+ myogenic progenitors facilitates tendon regeneration.
(a) Scheme of transplantation of human CD29+/CD56+ myogenic progenitors for NOD/SCID with tendon injury. (b) Immunofluorescence staining of the regenerated tendon-like tissue after transplantation of human CD29+/CD56+ myogenic progenitors. Tendon injury was induced in recipient NOD/SCID mice, and 50,000 human CD29+/CD56+ myogenic progenitors were transplanted to the injured tendon at the injured site. The regenerated tendon-like tissue, the connected muscle, and the surrounding soft tissues were harvested to make continuous cryosections. One of the continuous cryosections was subjected to immunofluorescence staining of tendon marker human-specific TNC and human-specific Lamin A/C. DAPI indicates nuclei staining. Merge indicates the merged images of human TNC, human Lamin A/C, and DAPI. The white lines indicate the location of regenerated tendon-like tissues from human CD29+/CD56+ myogenic progenitors based on human TNC staining. The yellow dashed lines indicate the superimposed location of muscle based on MyHC staining in (c). Scale bars, 100 µm. (c) Immunofluorescence staining of MyHC and human Lamin A/C. The regenerated tendon-like tissue, the connected muscle, and the surrounding soft tissues were harvested and subjected to continuous cryosection. One of the continuous cryosections was stained for MyHC, which was specifically expressed in skeletal muscle, and human Lamin A/C to label human cells. DAPI indicates nuclei staining. Merge indicates the merged images of MyHC, human Lamin A/C, and DAPI. The white lines indicate the location of regenerated tendon-like tissue from human CD29+/CD56+ myogenic progenitors based on human TNC staining in (b). The yellow dashed lines indicate the location of muscle based on MyHC staining. Scale bars, 100 µm. (d) Statistical analysis of the percentage of human cells expressing skeletal muscle marker MyHC or tendon marker TNC after being transplanted to the injured tendon. Error bars indicate standard deviation (n=5). (e) Immunofluorescence staining of Col I, Col III, and human Lamin A/C. Two months after human cell transplantation, continuous cryosections containing the regenerated tendon-like tissue and native tendon tissue were stained with Col I, Col III, and human Lamin A/C. DAPI indicates the staining of nuclei. T, native tendon tissue; W, wound tendon tissue. Scale bars, 50 µm. (f) Immunofluorescence staining of tendon tissue after transplantation of tdTomato+ murine MuSCs. tdTomato indicates the progenies of murine MuSCs. TNC indicates immunofluorescence staining of tendon marker TNC. MyHC indicates immunofluorescence staining of myofiber marker MyHC. DAPI indicates nuclei staining. Merge indicates merged images of tdTomato, TNC, MyHC, and DAPI. The upper panel indicates low-magnification images. Scale bars, 100 µm. The lower panel indicates the amplified images of the region indicated by the white square. Scale bars, 10 µm. (g) Statistical analysis of TNC+ tdTomato+ cells in tendon tissue after transplantation of murine MuSCs. Error bars indicate standard deviation (n=5).
Figure 5—figure supplement 1
Transplantation of human CD29+/CD56+ myogenic progenitors facilitates tendon regeneration, and transplantation of human/murine myogenic progenitors improves muscle regeneration.
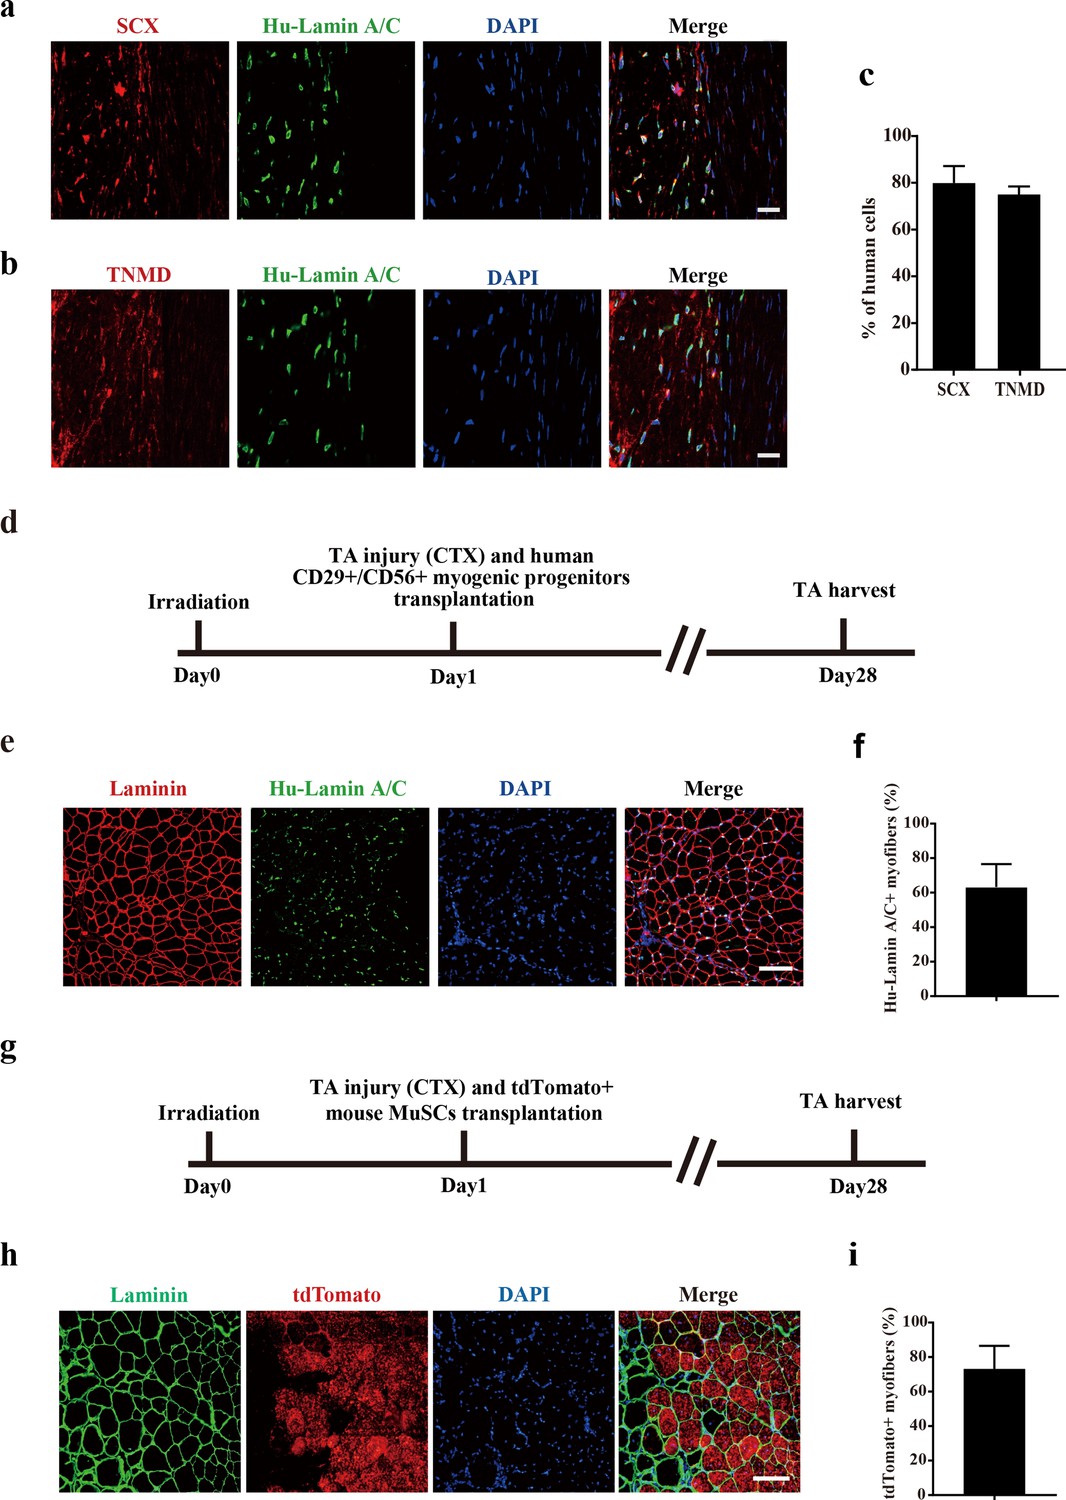
(a) Immunofluorescence staining of SCX and human-specific Lamin A/C in injured tendon. Two months after transplantation of human CD29+/CD56+ myogenic progenitors, the injured tendon was stained with SCX and human-specific Lamin A/C. DAPI indicates nuclei staining. Merge indicates the merged images of SCX, human-specific Lamin A/C, and DAPI. Scale bars, 20 µm. (b) Immunofluorescence staining of TNMD and human-specific Lamin A/C in injured tendon. Two months after transplantation of human CD29+/CD56+ myogenic progenitors, the injured tendon was stained with TNMD and human-specific Lamin A/C. DAPI indicates nuclei staining. Merge indicates the merged images of TNMD, human Lamin A/C, and DAPI. Scale bars, 20 µm. (c) Statistical analysis of the percentage of human cells expressing tendon-related markers SCX or TNMD after being transplanted to the injured tendon. Error bars indicate standard deviation (n=5). (d) Scheme of transplantation of human CD29+/CD56+ myogenic progenitors after muscle injury. TA muscles were first irradiated to kill the local muscle stem cells (MuSCs) in NOD/SCID mice. Then transplantation of human CD29+/CD56+ myogenic progenitors to the irradiated pre-injured recipient mice was performed and TA muscles were harvested after 28 days. (e) Immunofluorescence staining of MyHC and human-specific Lamin A/C after transplantation of human CD29+/CD56+ myogenic progenitors. Scale bars, 100 μm. (f) Statistical analysis of the engraftment efficiency of human CD29+/CD56+ myogenic progenitors transplantation in muscle. Error bars indicate standard deviation (n=5). (g) Scheme of murine MuSCs transplantation after muscle injury. TA muscles were first irradiated to kill the local MuSCs in NOD/SCID mice. Then transplantation of tdTomato-positive MuSCs to the irradiated pre-injured recipient mice was performed, and TA muscles were harvested after 28 days. (h) Immunofluorescence staining of Laminin and murine MuSCs constitutively expressing tdTomato after murine tdTomato-positive MuSCs transplantation. Scale bars, 100 μm. (i) Statistical analysis of the engraftment efficiency of murine MuSCs transplantation in muscle. Error bars indicate standard deviation (n=5).
Figure 6
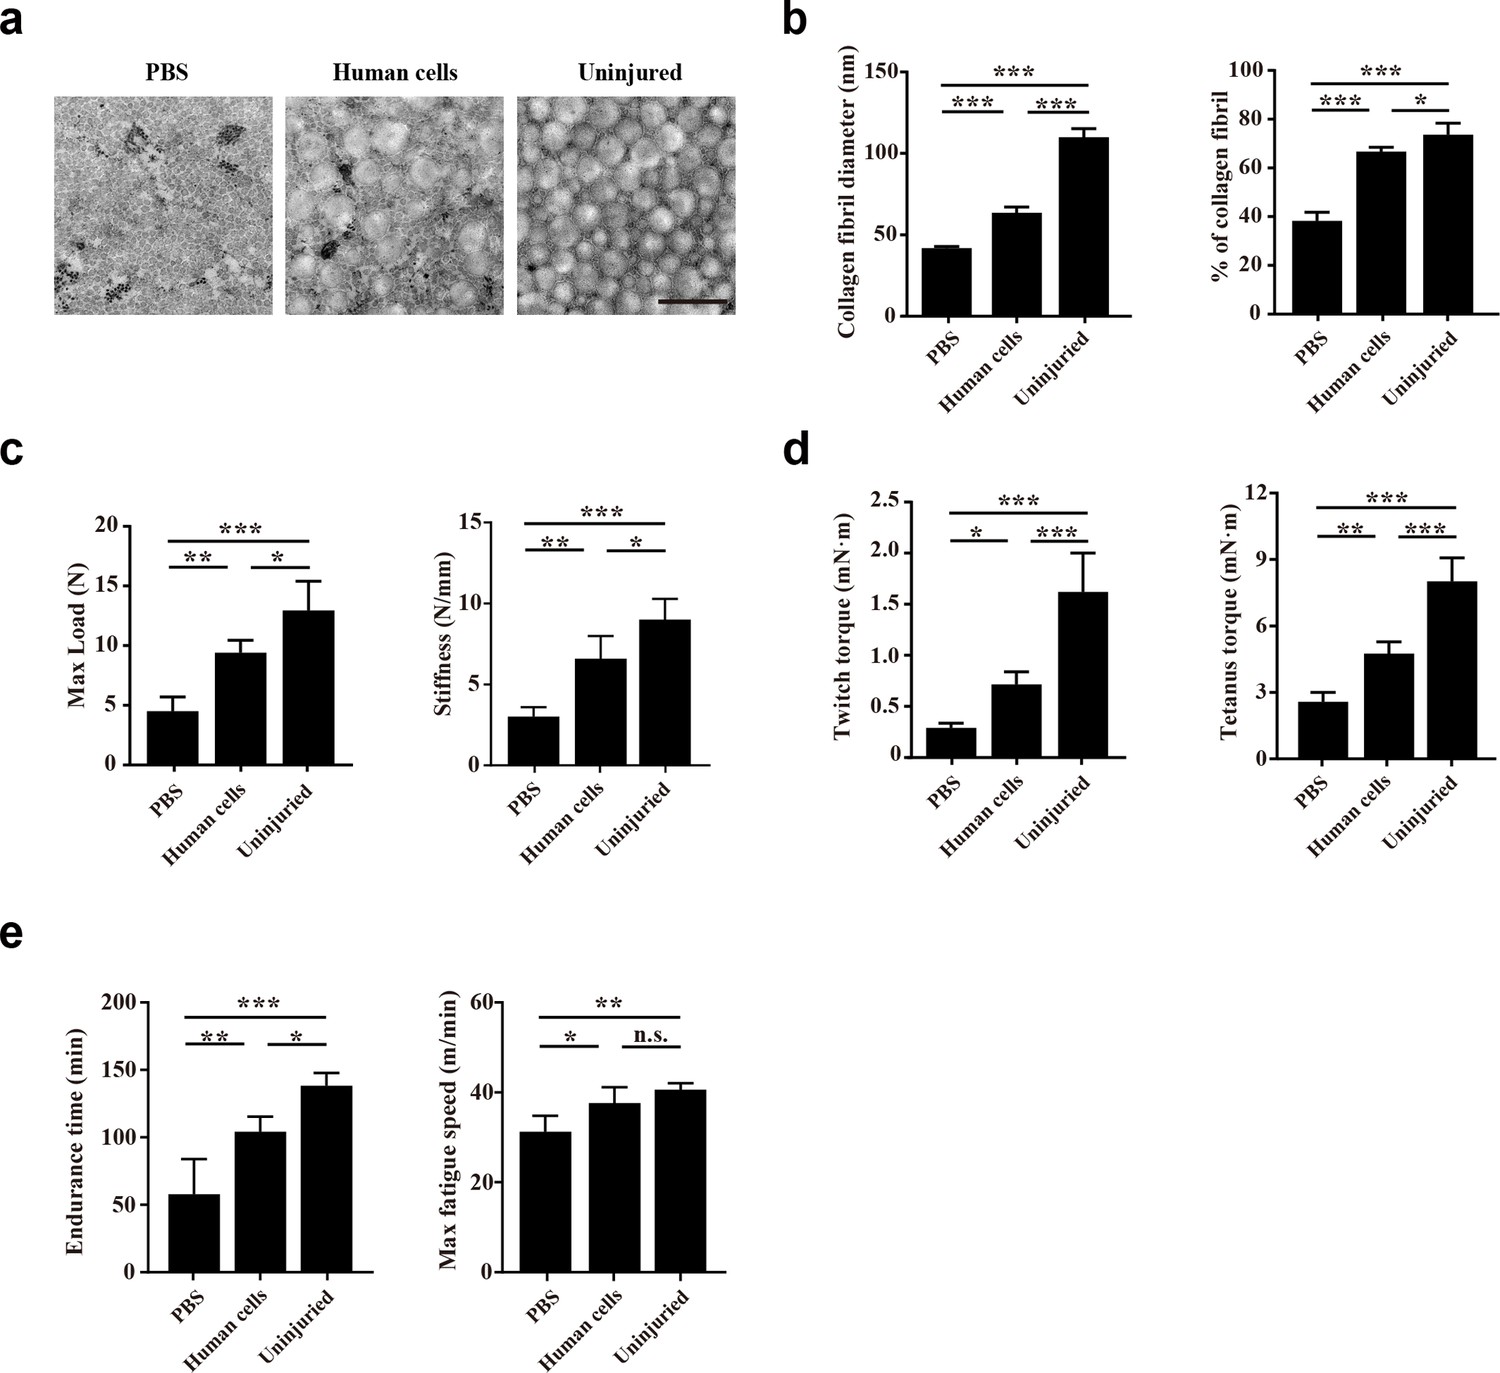
Transplantation of human CD29+/CD56+ myogenic progenitors improves the locomotor function after tendon injury.
(a) TEM images of collagen fibrils in the injured tendon with PBS injection, injured tendon with human CD29+/CD56+ myogenic progenitors transplantation, and uninjured tendon. Scale bars, 500 nm. (b) Statistical analysis of the collagen fibril diameter and percentage of collagen fibril area for the injured tendon with PBS injection, injured tendon with human CD29+/CD56+ myogenic progenitors transplantation, and uninjured tendon. Error bars indicatestandard deviation (n=5). *p<0.05, ***p<0.001. (c) Statistical analysis of the max load and stiffness of the injured tendon with PBS injection, injured tendon with human CD29+/CD56+cmyogenic progenitors transplantation, and uninjured tendon. Error bars indicate standard deviation (n=5). *p<0.05, **p<0.01, ***p<0.001. (d) Twitch and tetanus plantarflexion force of the involved limb with PBS injection after tendon injury, human CD29+/CD56+ myogenic progenitors transplantation after tendon injury, and uninjured tendon. Error bars indicate standard deviation (n=5). *p<0.05, **p<0.01, ***p<0.001. (e) The results of treadmill exercise for tendon-injured mice with or without human CD29+/CD56+ myogenic progenitors transplantation. The endurance time and max fatigue speed were compared. Error bars indicate standard deviation (n=4). *p<0.05, **p<0.01, ***p<0.001, and n.s. indicates p>0.05.
Figure 7
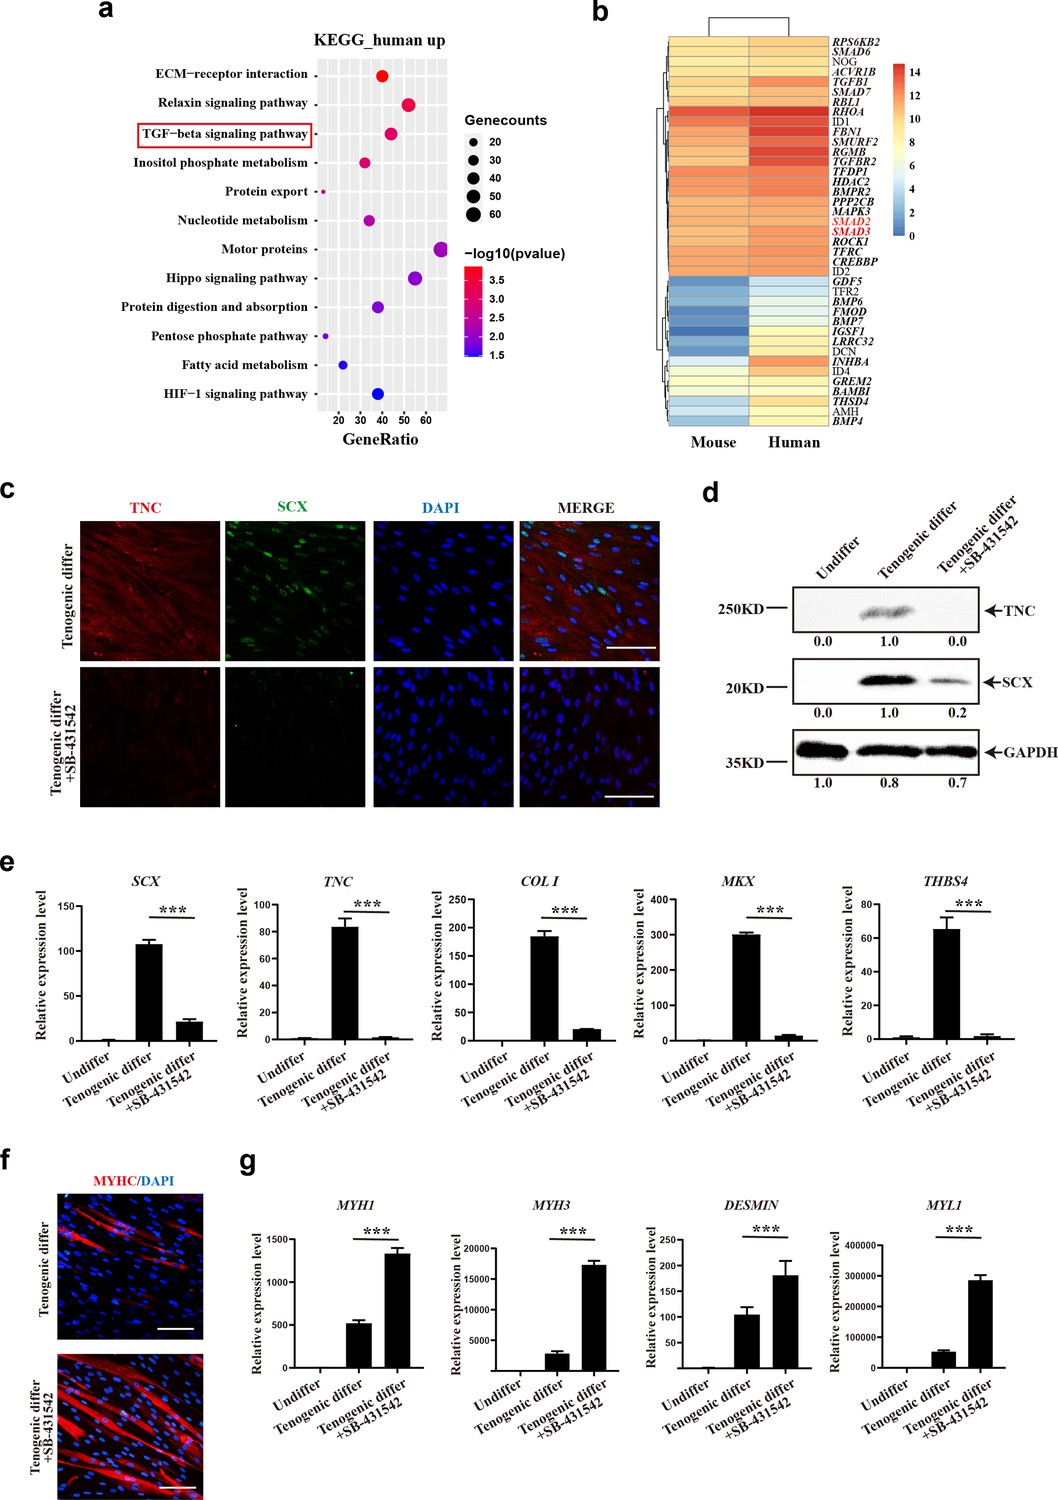
TGFβ signaling pathway contributes to tenogenic differentiation of human CD29+/CD56+ myogenic progenitors.
(a) Bubble chart of KEGG enrichment analysis of upregulated genes in human CD29+/CD56+ myogenic progenitors when compared with mouse muscle stem cells. (b) Heatmap of detailed upregulated genes in human CD29+/CD56+ myogenic progenitors which were enriched in TGFβ signaling pathway. (c) Immunofluorescence staining of tendon marker TNC and SCX in human CD29+/CD56+ myogenic progenitors induced for tenogenic differentiation with or without TGFβ signaling pathway inhibitor SB-431542 for 12 days, respectively. Scale bars, 100 µm. (d) Protein levels of TNC and SCX. Human CD29+/CD56+ myogenic progenitors were induced toward tenogenic differentiation with or without TGFβ signaling pathway inhibitor SB-431542 for 12 days, respectively. Total protein was extracted from cells before and after differentiation and subjected to TNC and SCX immunoblotting. GAPDH served as a loading control. (e) Relative expression levels of tendon-related genes. RT-qPCR assays were performed with human CD29+/CD56+ myogenic progenitors upon tenogenic differentiation with or without TGFβ signaling pathway inhibitor SB-431542 for 12 days, respectively. GAPDH served as a reference gene. Error bars indicate standard deviation (n=3). ***p<0.001. (f) Immunofluorescence staining of myogenic differentiation marker MyHC in human CD29+/CD56+ myogenic progenitors induced for tenogenic differentiation with or without TGFβ signaling pathway inhibitor SB-431542 for 12 days, respectively. Scale bars, 50 µm. (g) Relative expression levels of muscle-related genes. RT-qPCR assays were performed with human CD29+/CD56+ myogenic progenitors upon tenogenic differentiation with or without TGFβ signaling pathway inhibitor SB-431542 for 12 days, respectively. GAPDH served as a reference gene. Error bars indicate standard deviation (n=3). ***p<0.001.
-
Figure 7—source data 1
Labeled raw data for TNC and SCX for human CD29+/CD56+ myogenic progenitors which were induced towards tenogenic differentiation with or without TGFβ signaling pathway inhibitor.
- https://cdn.elifesciences.org/articles/98636/elife-98636-fig7-data1-v1.zip
-
Figure 7—source data 2
Raw data for TNC and SCX for human CD29+/CD56+ myogenic progenitors which were induced towards tenogenic differentiation with or without TGFβ signaling pathway inhibitor.
- https://cdn.elifesciences.org/articles/98636/elife-98636-fig7-data2-v1.zip
Author response image 1

TGFβ signaling pathway slightly elevated tenogenic differentiation ability of murine MuSCs.
(a) Immunofluorescence staining of tendon marker Scx and Tnc in murine MuSCs induced for tenogenic differentiation with or without TGFβ signaling pathway agonist SRI-011381, respectively. Scale bars, 50 µm. (b) Quantification of Scx and Tnc fluorescent intensity in murine MuSCs undergone tenogenic induction with or without TGFβ signaling pathway agonist SRI-011381, respectively. Error bars indicated standard deviation (n=5). (c) Protein levels of Tnc and Scx. Murine MuSCs were induced towards tenogenic differentiation with or without TGFβ signaling pathway agonist SRI-011381. Total protein was extracted from cells before and after differentiation and subjected for Tnc and Scx immunoblotting. GAPDH was served as loading control.
Additional files
Download links
A two-part list of links to download the article, or parts of the article, in various formats.
Downloads (link to download the article as PDF)
Open citations (links to open the citations from this article in various online reference manager services)
Cite this article (links to download the citations from this article in formats compatible with various reference manager tools)
Human CD29+/CD56+ myogenic progenitors display tenogenic differentiation potential and facilitate tendon regeneration
eLife 13:RP98636.
https://doi.org/10.7554/eLife.98636.3


