Opposing actions of co-released GABA and neurotensin on the activity of preoptic neurons and on body temperature
- Scintillon Institute, United States
Figures
Figure 1 with 1 supplement
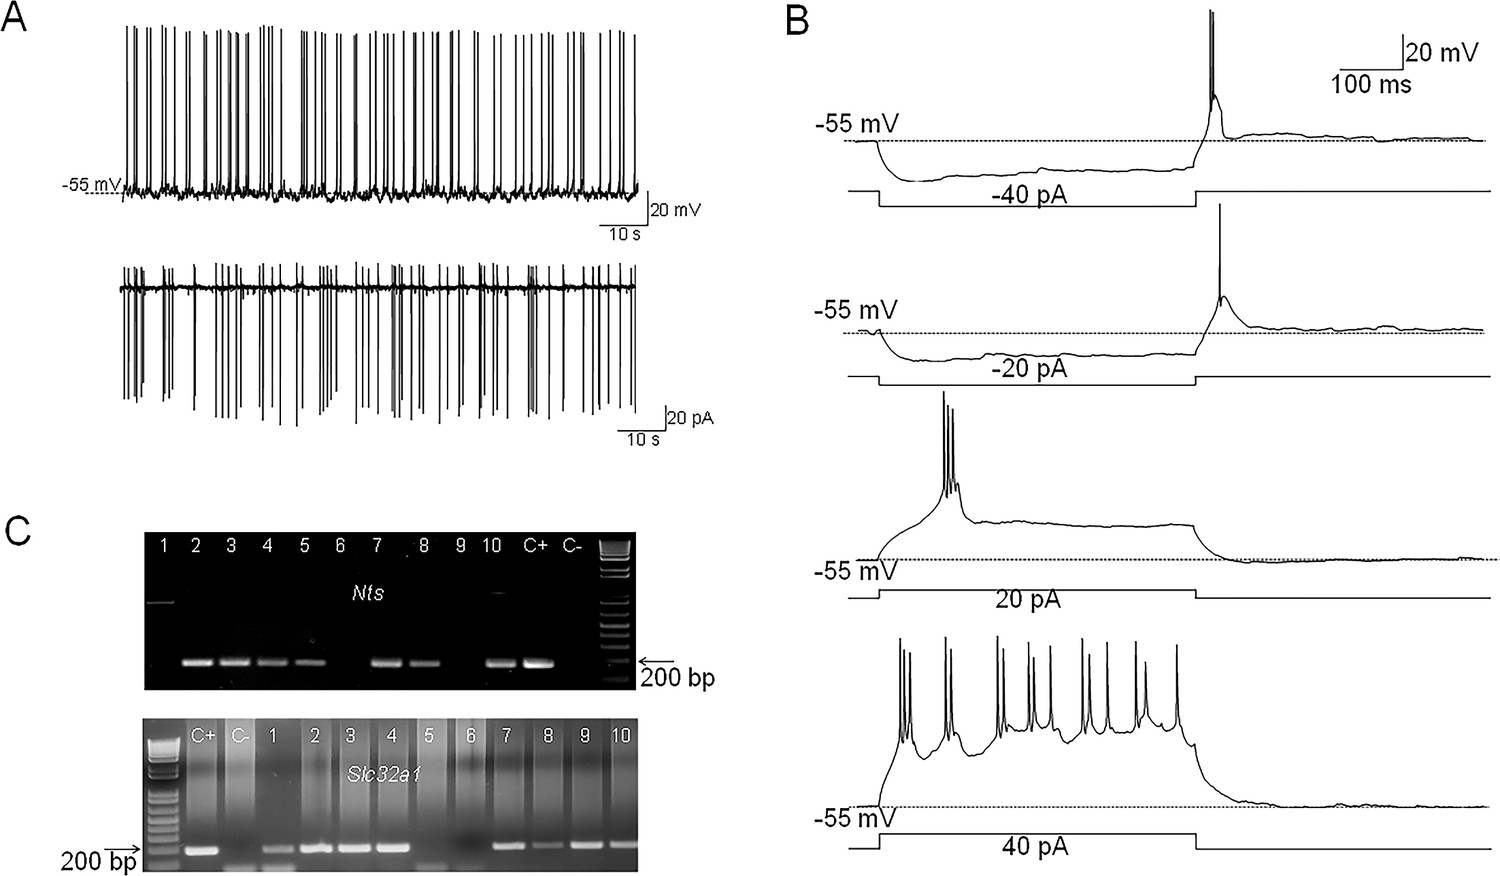
Electrophysiological characteristics of MPONts;ChR2 neurons.
(A) Representative example of spontaneous firing activity of MPONts;ChR2 neurons recorded in whole-cell (up) or cell-attached configuration (down). (B) Membrane potential responses to hyperpolarizing current steps of –40 and –20 pA reveal the presence of a low threshold spike (LTS) upon depolarization to the resting membrane potential. Depolarizing current injections of 20 and 40 pA (right) elicit burst firing activity. The neuron fires 2–3 action potentials during each burst. (C) Nts (up) and Slc32a1(VGAT) (down) transcripts are present in MPONts;ChR2 neurons. Representative results from 10 MPONts;ChR2 neurons. The expected sizes of the PCR product are 149 and 137 base pairs, respectively. Negative (−) control was amplified from a harvested cell without reverse-transcription, and positive control (+) was amplified using 1 ng of hypothalamic mRNA. Nts transcripts were detected in 7 out of 10 neurons while Slc32a1 was detected in 8 neurons. Six neurons expressed both transcripts.
-
Figure 1—source data 1
Spontaneous firing rates and cell capacitance values for the recorded cells.
- https://cdn.elifesciences.org/articles/98677/elife-98677-fig1-data1-v1.xlsx
-
Figure 1—source data 2
Uncropped images of the gels presented in Figure 1.
- https://cdn.elifesciences.org/articles/98677/elife-98677-fig1-data2-v1.zip
Figure 1—figure supplement 1
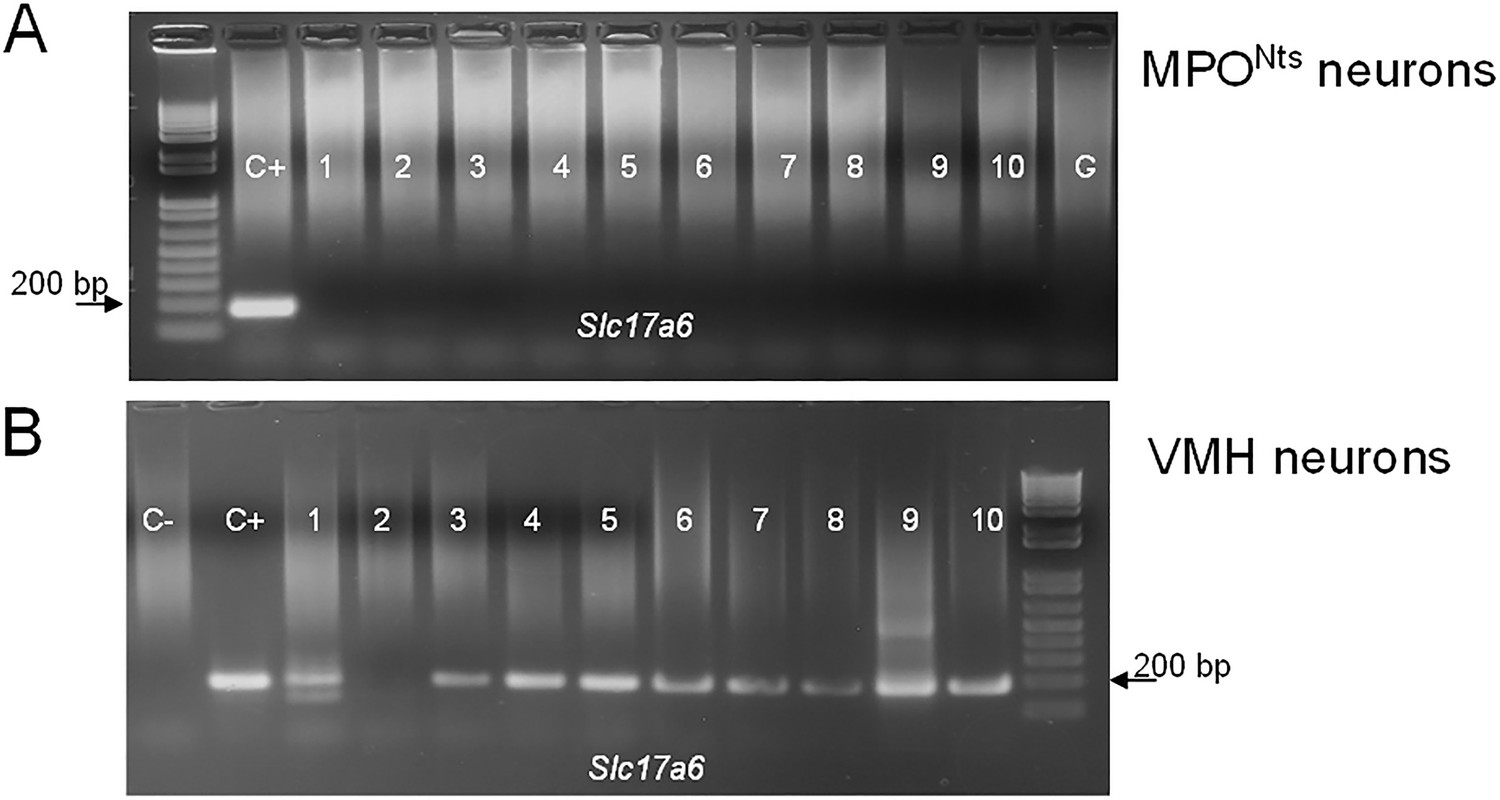
Lack of Slc17a6 (Vglut2) expression in MPONts neurons.
(A) Single cell RT/PCR analysis of Slc17a6 expression. Representative results from 10 MPONts;ChR2 neurons. (B) Slc17a6 expression in single ventromedial hypothalamus (VMH) neurons. Slc17a6 transcripts were detected in 9 out of 10 neurons. (A,B) The expected size of the PCR product is 184 base pairs. Negative (−) control was amplified from a harvested cell without reverse-transcription, and positive control (+) was amplified using 1 ng of hypothalamic mRNA.
Figure 2
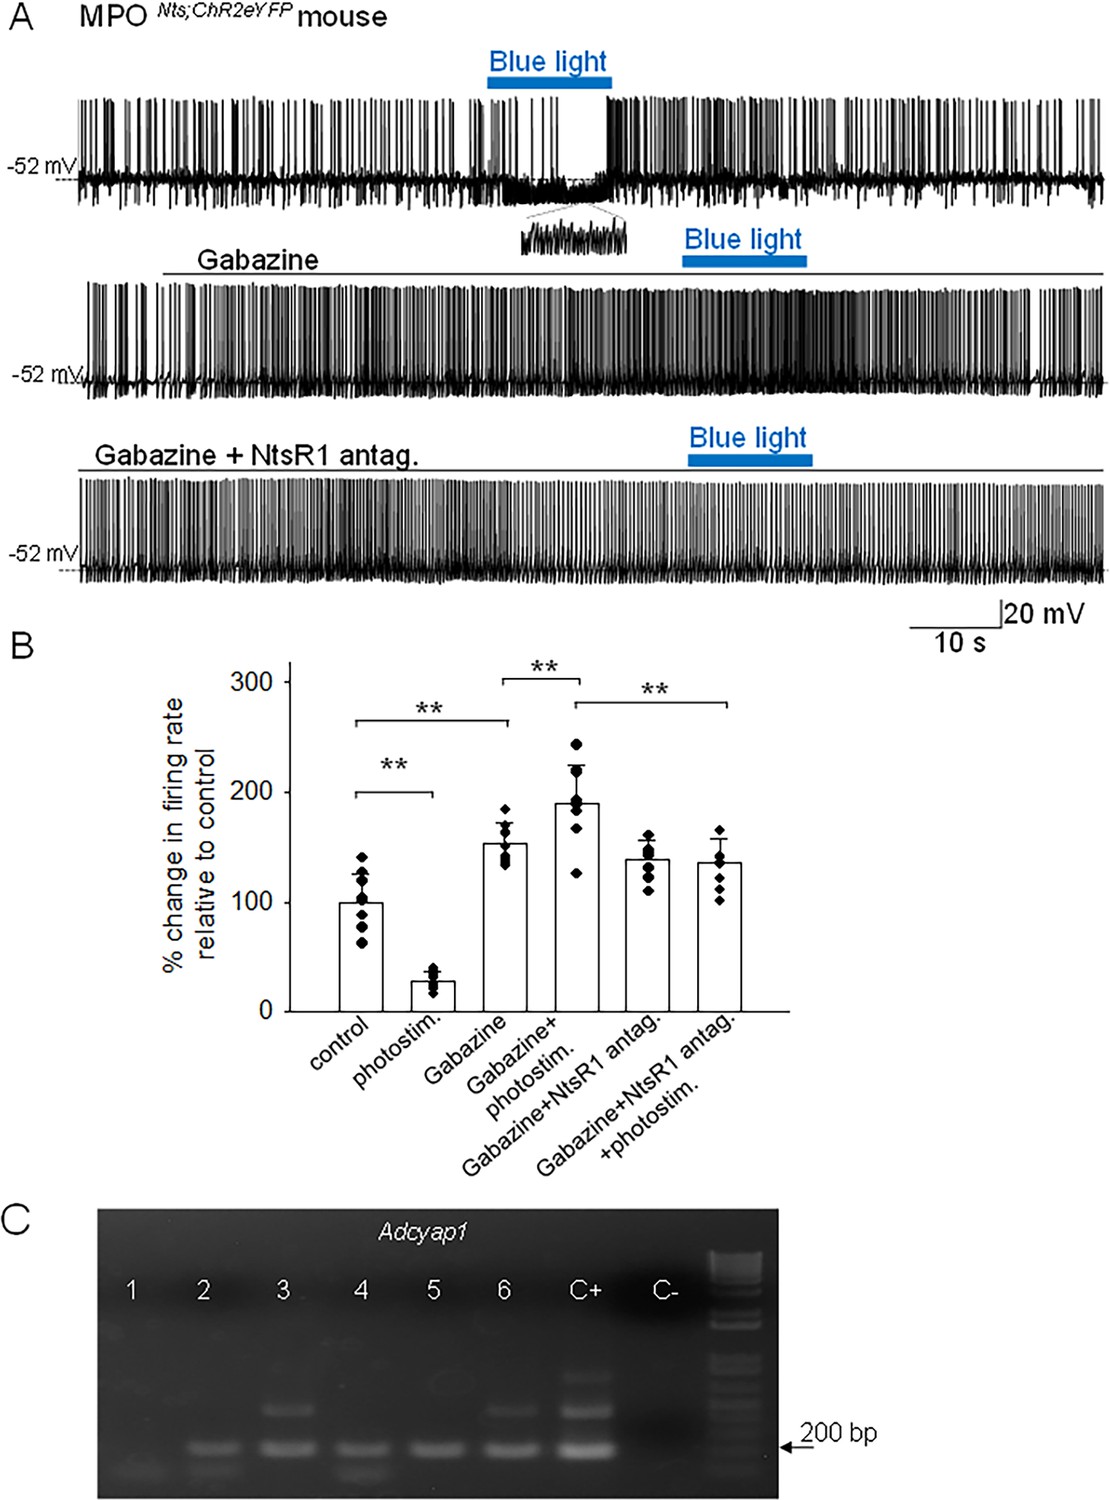
Effects of optogenetic stimulation of MPONts;ChR2 neurons on the firing activity of nearby MPO neurons.
(A) Optogenetic stimulation of a MPONts;ChR2 neuron decreases the spontaneous firing rate of a nearby MPO neuron (upper trace) from 2.2 Hz to 0.9 Hz and increases the frequency of IPSC from 0.5 Hz to 21.8 Hz (see expanded trace). Gabazine (5 µM) (middle trace) increased the spontaneous firing activity of the neuron and abolished the activation of IPSCs by optogenetic stimulation. In the presence of Gabazine optogenetic stimulation increased the firing activity of the neuron from 4.1 Hz to 9.6 Hz. This increase in firing activity was blocked by pe-incubation with the NtsR1 antagonist SR48692 (100 nM) (lower trace). (B) Bar charts summarizing the effects of optogenetic stimulation of MPONts;ChR2 neurons on the spontaneous firing rates of nearby MPO neurons in control and in the presence of Gabazine (5 µM) and/or the NtsR1 antagonist SR48692 (100 nM). Bars represent means ± S.D. of the normalized firing rate relative to the control. The control value for the firing rate was calculated as the average value during the 5 min period preceding the optogenetic stimulation. Data pooled from n=9 neurons in each condition. There was a statistically significant difference between groups as determined by one-way ANOVA (F(5,40) = 77.71, p=1.08 × 10⁻⁸) followed by Tukey’s test between conditions; ** indicates statistical significance of p<0.01. The p-values of the Tukey’s statistical comparisons among groups are presented in Supplementary file 1-table 2. (C) Adcyap1 transcripts are present in MPO neurons inhibited by optogenetic stimulation of nearby MPONts;ChR2 neurons. Representative results from six recorded MPO neurons. The expected size of the PCR product is 181 base pairs. Negative (−) control was amplified from a harvested cell without reverse-transcription, and positive control (+) was amplified using 1 ng of hypothalamic mRNA. Adcyap1 transcripts were detected in five out of six neurons.
-
Figure 2—source data 1
Values of the percentage change in firing rates in each recorded cell during the treatments presented in Figure 2B.
Change in firing rate in response to photostimulation.
- https://cdn.elifesciences.org/articles/98677/elife-98677-fig2-data1-v1.xlsx
-
Figure 2—source data 2
Uncropped image of the gel presented in Figure 2.
- https://cdn.elifesciences.org/articles/98677/elife-98677-fig2-data2-v1.zip
Figure 3 with 1 supplement
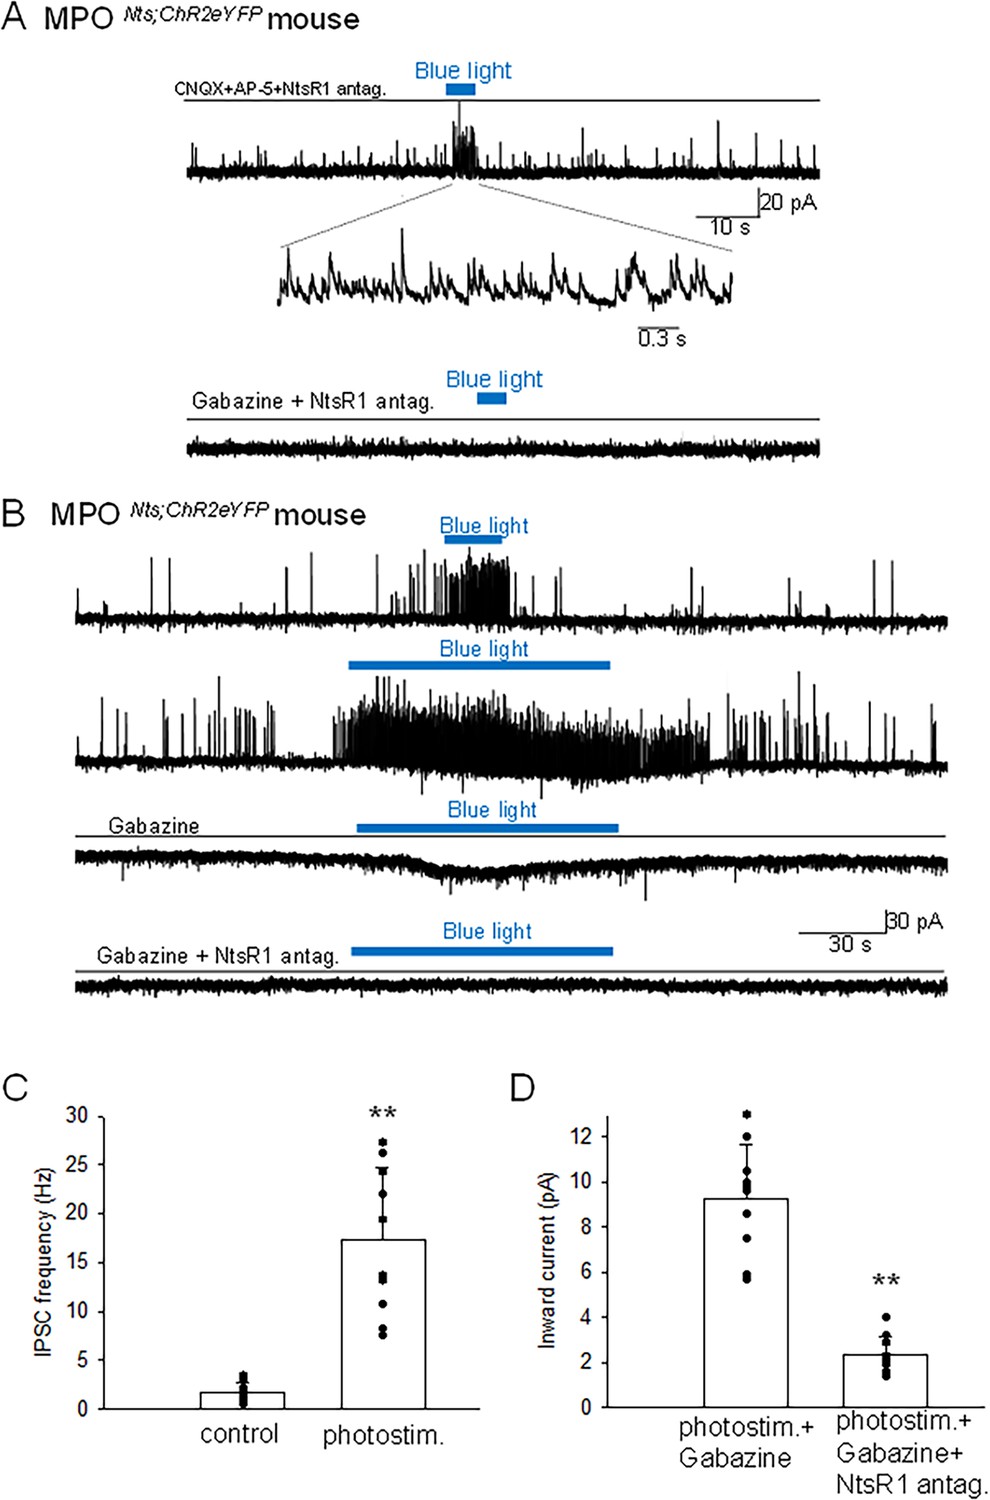
Optogenetic stimulation of MPONts;ChR2 neurons increases the frequency of IPSCs and activates an inward current in nearby MPO neurons.
(A) Optogenetic stimulation of a MPONts;ChR2 neuron activates IPSCs in a nearby MPO neuron. Recordings were performed in the presence of CNQX (20 µM), AP-5 (50 µM) and the NtsR1 antagonist SR48692 (100 nM). The sIPSCs were abolished by Gabazine (5 µM) (lower trace). The neuron was held at –50 mV. (B) Optogenetic stimulation of the whole field of view containing several MPONts;ChR2 neurons for 20 s activates IPSCs in a nearby MPO neuron (upper trace). Longer optogenetic stimulation (80 s) of the same neurons activated both IPSCs and an inward current (middle traces). The inward current was abolished by the NtsR1 antagonist SR48692 (100 nM) (lower trace). The neuron was held at –50 mV. (C, D) Bar charts summarizing the increase in the frequency of IPSCs (C) and the amplitude of the inward current (D) recorded in MPO neurons in response to optogenetic stimulation of several MPONts;ChR2 neurons. (C) The IPSCs frequency increased from1.75±0.97 Hz to 17.8±7.47 Hz in response to photostimulation (one-way ANOVA F(1,18)=42.5, p=4 × 10⁻⁴). The control value for the firing rate was calculated as the average value during the 5 min period preceding the optogenetic stimulation. (D) The average inward current activated by optogenetic stimulation decreased from 9.26±2.39 pA to 2.31±0.83 pA in the presence of the NtsR1 antagonist SR48692 (100 nM) (one-way ANOVA F(1,18)=75.35, p=7.5 × 10⁻⁸). Bars represent means ± S.D. Data pooled from n=10 neurons in each condition.
-
Figure 3—source data 1
Change in IPSCs frequency and amplitude of inward current in response to photostimulation.
- https://cdn.elifesciences.org/articles/98677/elife-98677-fig3-data1-v1.xlsx
Figure 3—figure supplement 1
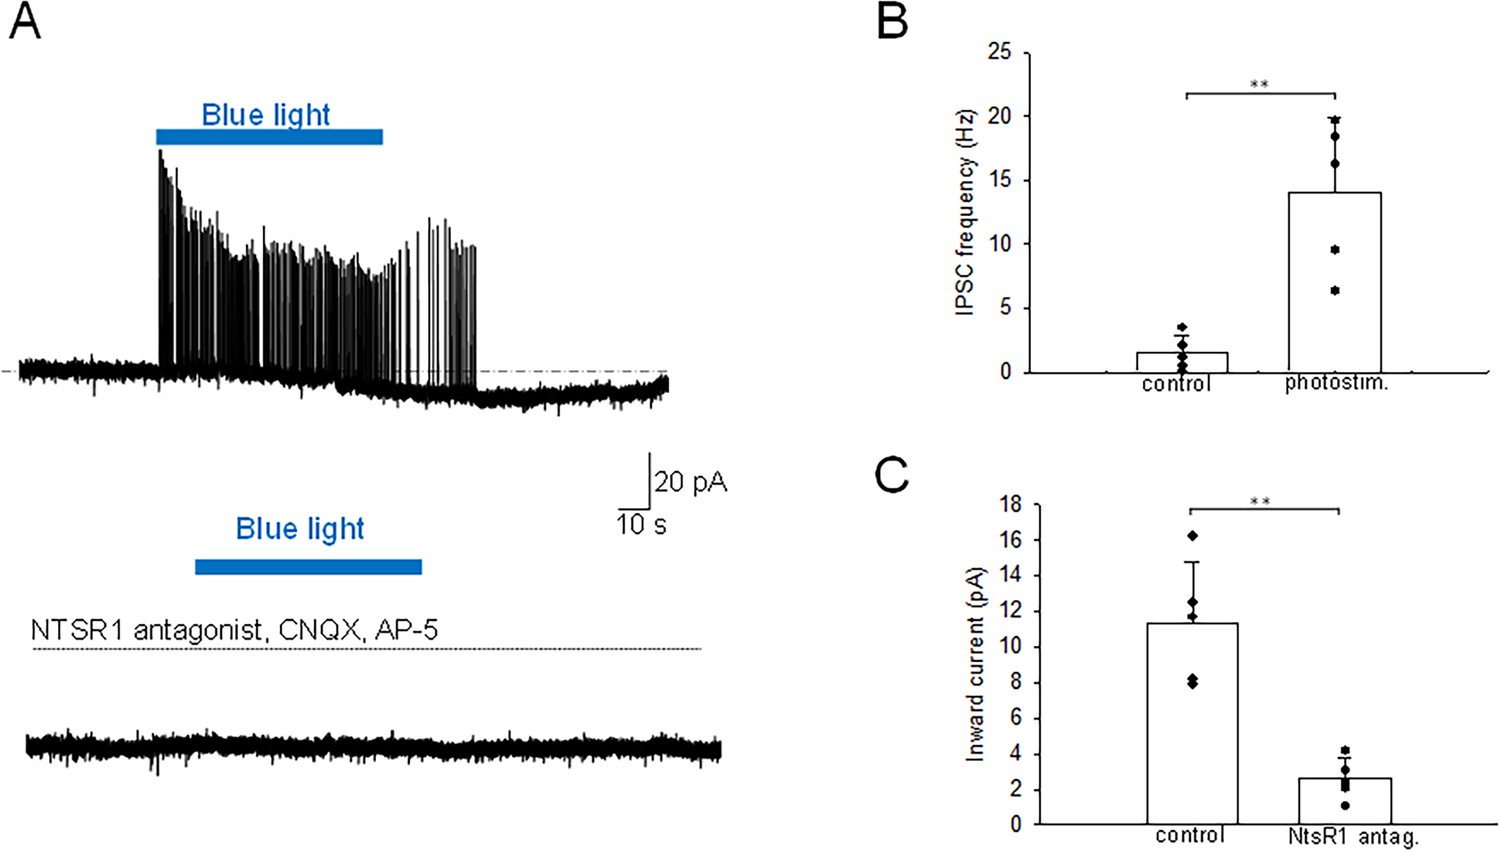
Optogenetic stimulation of MPONts;ChR2 neurons from females increases the frequency of IPSCs and activates an inward current in nearby MPO neurons.
(A) Optogenetic stimulation of a MPONts;ChR2 neuron activates IPSCs and an inward current in a nearby MPO neuron (upper trace). In the presence of CNQX (20 µM), AP-5 (50 µM), Gabazine (5 µM) and the NtsR1 antagonist SR48692 (100 nM) light stimulation was without effect (lower trace). The neuron was held at –50 mV. (B,C) Bar charts summarizing the increase in the frequency of IPSCs (B) and the amplitude of the inward current (C) recorded in MPO neurons in response to optogenetic stimulation of several MPONts;ChR2 neurons. (B) The IPSCs frequency increased from1.5±1.4 Hz to 14.1±5.8 Hz in response to photostimulation (one-way ANOVA F(1,9)=22.4, p=1.4 × 10⁻³). (C) The average inward current activated by optogenetic stimulation decreased from 11.3±3.4 pA to 2.6±1.2 pA in the presence of the NtsR1 antagonist SR48692 (100 nM) (one-way ANOVA F(1,9)=28.9, p=6.6 × 10⁻⁴). Bars represent means ± S.D. Data pooled from n=5 neurons.
-
Figure 3—figure supplement 1—source data 1
Change in IPSCs frequency and amplitude of inward current in response to photostimulation.
- https://cdn.elifesciences.org/articles/98677/elife-98677-fig3-figsupp1-data1-v1.xlsx
Figure 4 with 1 supplement
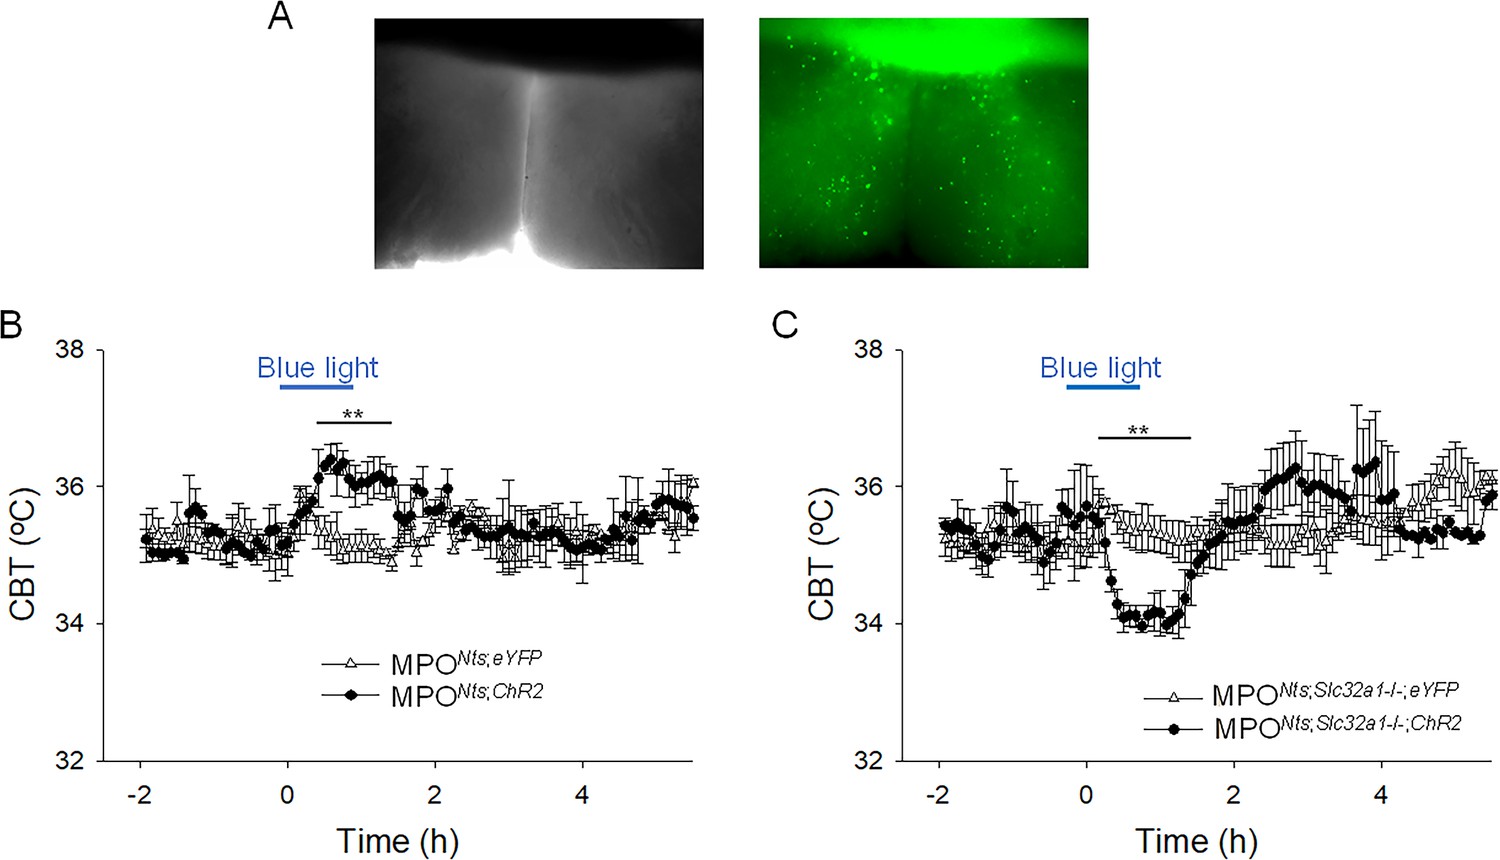
Optogenetic activation of MPONts;ChR2 neurons induces hyperthermia while optogenetic activation of MPONts;Slc32a1-/-;ChR2 neurons induces hypothermia.
(A) DIC (left) and fluorescence (right) images of an acute slice from MPONts;ChR2 mouse indicating hChR2-eYFP expression in the MPO. (B) Optogenetic stimulation of MPONts;ChR2 neurons (●) in vivo for 1 hr (blue light) induced a hyperthermia of 1.22 ± 0.35 °C relative to control (∆). The response was statistically different to the response to photostimulation of control MPONts;eYFP mice (∆) (one-way repeated measures ANOVA, F(1,111)=20.9, p=1.2 × 10⁻⁵, followed by Mann-Whitney U tests for each time point, ** p<0.01). (C) Optogenetic stimulation of MPONts;Slc32a1-/-;ChR2 neurons (●) in vivo for 1 hour (blue light) induced a hypothermia of 1.44 ± 0.29 °C relative to control (∆). The response was statistically different to the response to photostimulation of control MPONts;Slc32a1-/-;eYFP mice (∆) (one-way repeated measures ANOVA, F(1,112)=8.27, p=4.8 × 10⁻³, followed by Mann-Whitney U tests for each time point, ** p<0.01). (B,C) The points represent averages ± S.D. through the 7 hr recording period. Experiments were carried out in parallel in groups of six mice.
-
Figure 4—source data 1
Change in CBT in response to photostimulation.
- https://cdn.elifesciences.org/articles/98677/elife-98677-fig4-data1-v1.xlsx
Figure 4—figure supplement 1
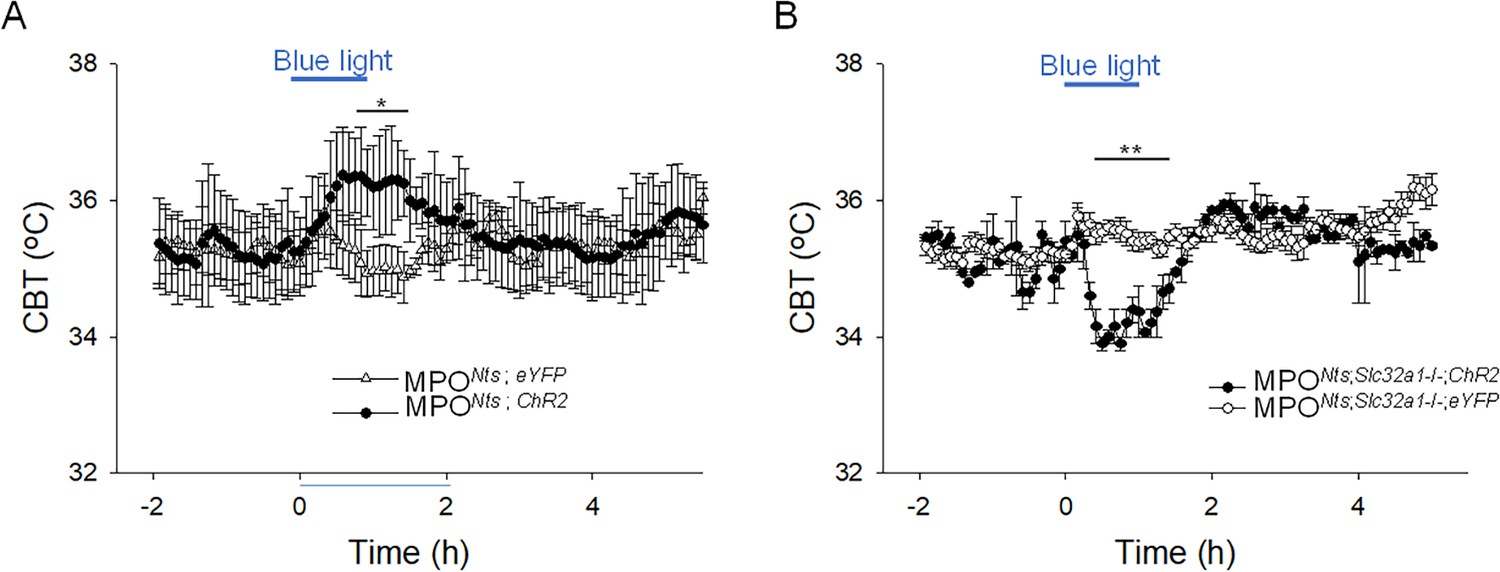
In female mice optogenetic activation of MPONts;ChR2 neurons induces hyperthermia while optogenetic activation of MPONts;Slc32a1-/-;ChR2 neurons induces hypothermia.
(A) Optogenetic stimulation of MPONts;ChR2 neurons (●) in vivo for 1 hr (blue light) induced a hyperthermia of 1.31 ± 0.65 °C relative to control (∆). The response was statistically different to the response to photostimulation of control MPONts;eYFP mice (∆) (one-way repeated measures ANOVA, F(1,110)=5.7, p=1.9 × 10⁻², followed by Mann-Whitney U tests for each time point, * p<0.05). (B) Optogenetic stimulation of MPONts;Slc32a1-/-;ChR2 neurons (●) in vivo for 1 hr (blue light) induced a hypothermia of 1.69 ± 0.22 °C relative to control (∆). The response was statistically different to the response to photostimulation of control MPONts;Slc32a1-/-;eYFP mice (∆) (one-way repeated measures ANOVA, F(1,83)=9.9, p=2.2 × 10⁻³, followed by Mann-Whitney U tests for each time point, ** p<0.01). (A,B) The points represent averages ± S.D. through the 7 hr recording period. Experiments were carried out in parallel in groups of six female mice.
-
Figure 4—figure supplement 1—source data 1
Change in CBT in response to photostimulation.
- https://cdn.elifesciences.org/articles/98677/elife-98677-fig4-figsupp1-data1-v1.xlsx
Figure 5 with 1 supplement
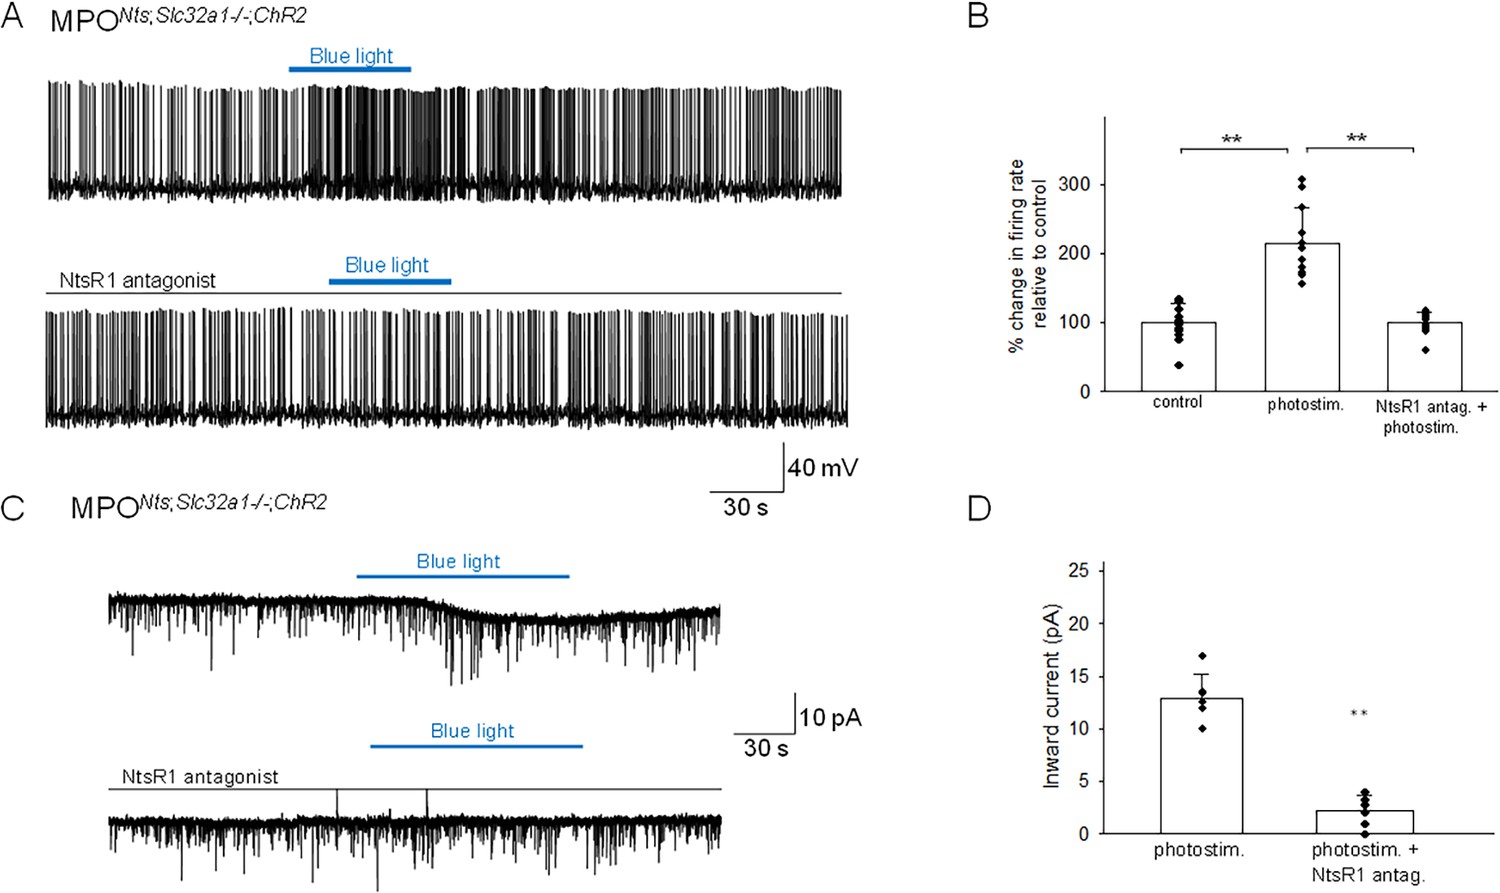
Optogenetic stimulation of MPONts;Slc32a1-/-;ChR2 neurons increases the firing activity of nearby MPO neurons.
(A) Optogenetic stimulation of MPONts;Slc32a1-/-;ChR2 neurons increases the spontaneous firing rate of a nearby MPO neuron (upper trace) from 1.6 Hz to 3.9 Hz. The photostimulation-induced increase in firing activity was blocked by pe-incubation with the NtsR1 antagonist SR48692 (100 nM) (lower trace). (B) Bar charts summarizing the effects of optogenetic stimulation of MPONts;Slc32a1-/-;ChR2 neurons on the spontaneous firing rates of nearby MPO neurons in control and in the presence of the NtsR1 antagonist SR48692 (100 nM). Bars represent means ± S.D. of the normalized firing rate relative to the control. Data pooled from n=12 neurons in each condition. There was a statistically significant difference between groups as determined by one-way (ANOVA F(2,22) = 42.45, p=2.80 × 10⁻⁸) followed by Tukey’s test between conditions; ** indicates statistical significance of p<0.01, * indicates p<0.05. The p-values of the Tukey’s statistical comparisons among groups are presented in Supplementary file 1-table 3. (C) Optogenetic stimulation of the whole field of view containing several MPONts;ChR2 neurons for 20 s activates IPSCs in a nearby MPO neuron (upper trace). Longer optogenetic stimulation (80 s) of the same neurons activated both IPSCs and an inward current (middle traces). The inward current was abolished by the NtsR1 antagonist SR48692 (100 nM) (lower trace). The neuron was held at –50 mV. (D) Bar chart summarizing the amplitude of the inward current recorded in MPO neurons in response to optogenetic stimulation in control and during incubation with the NtsR1 antagonist SR48692 (100 nM). The average inward current activated by optogenetic stimulation decreased from 12.86±2.33 pA to 2.18±1.49 pA in the presence of MPONts;Slc32a1-/-;ChR2 neurons the NtsR1 antagonist SR48692 (100 nM) (one-way ANOVA F(1,22)=193.73, p=2.49 × 10⁻⁸). Bars represent means ± S.D. Data pooled from n=12 neurons.
-
Figure 5—source data 1
Change in firing rate and amplitude of inward current in response to photostimulation.
- https://cdn.elifesciences.org/articles/98677/elife-98677-fig5-data1-v1.xlsx
Figure 5—figure supplement 1
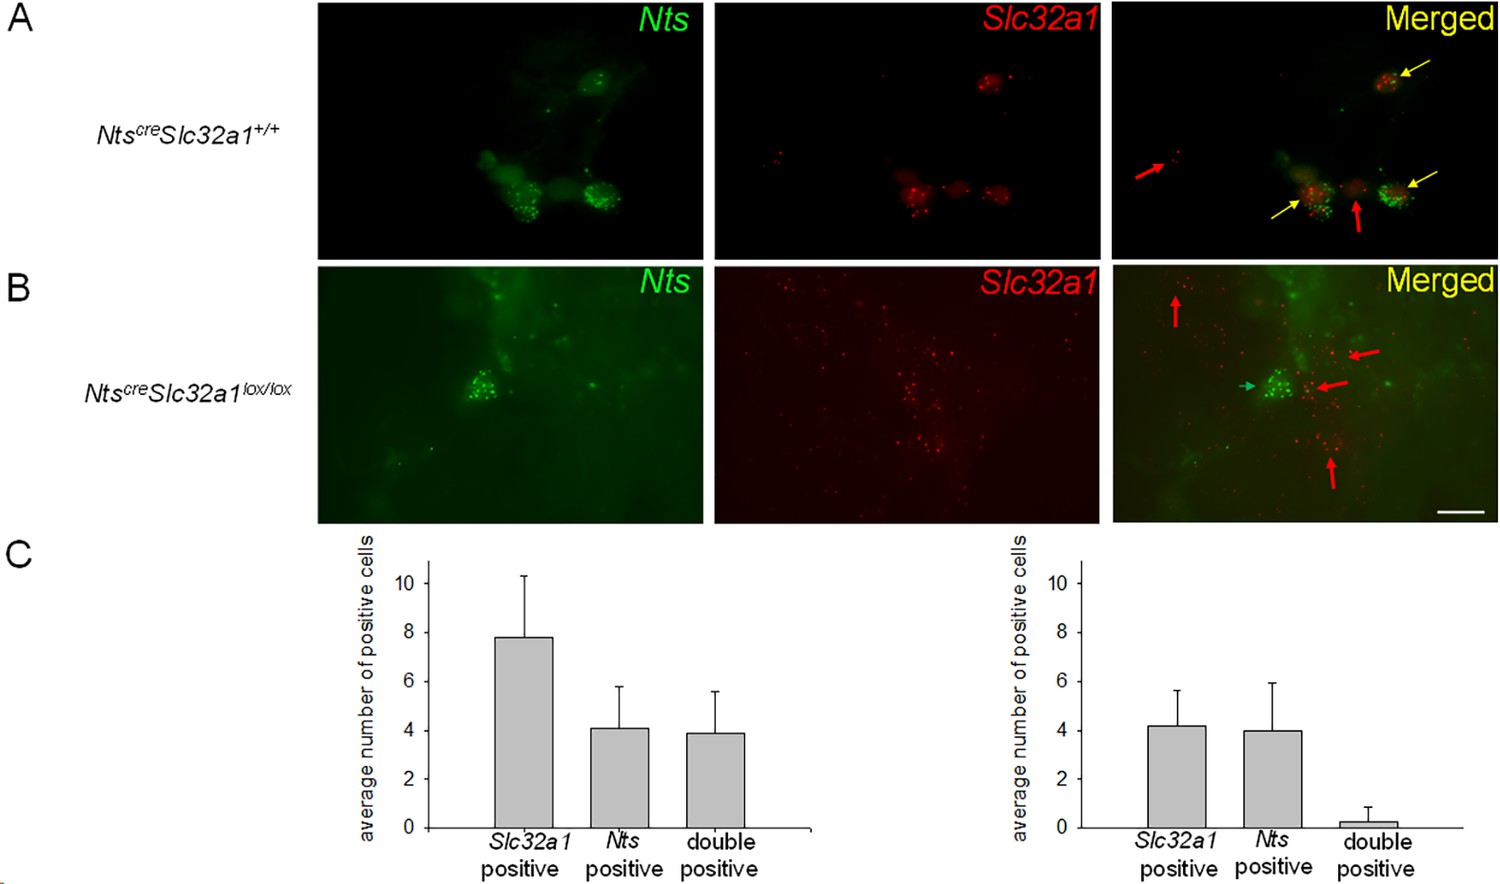
Expression of Slc32a1 transcripts in preoptic slices from Ntscre Slc32a1lox/lox and Ntscre Slc32a1+/+ male mice.
(A,B) Representative images of Slc32a1 (red) and Nts (green) transcripts visualized using RNAscope technology in preoptic slices from NtsSlc32a1+/+(A) and Ntscre Slc32a1lox/lox mice (B). (A) Nts transcripts (green, left) are present in 3 out of 5 Slc32a1-positive cells (red, middle) as indicated by their superimposed images (right, yellow arrows). Two other Slc32a1 expressing cells do not express Nts transcripts (right, red arrows). (B) Nts transcripts (green, left) are present in two cells while Slc32a1 transcripts (red, middle) are present in six cells (middle). In Ntscre Slc32a1lox/lox tissue the Slc32a1 positive cells (right, red arrows) do not co-express Nts transcripts. (A,B) The scale bar represents 10 µm. (C) Bar charts summarizing the average number positive cells for the respective transcripts in a randomly selected field of view in Ntscre Slc32a1+/+ (left) and Ntsccre Slc32a1lox/lox (right) preoptic slices. Data were averaged from 15 randomly selected fields of view and 3 different mice for each genotype. Overall, 139 cells expressed Slc32a1, 72 cells expressed Nts transcripts and 68 cells expressed both in Ntscre Slc32a1+/+ tissue. In the Ntsccre Slc32a1lox/lox tissue 75 cells expressed Slc32a1, 72 cells expressed Nts transcripts and 3 cells expressed both transcripts. The percentage of Nts expressing cells that co-expressed Slc32a1 was 94.4% and 4.2% in Ntscre Slc32a1+/+ and Ntscre Slc32a1lox/lox tissue, respectively.
-
Figure 5—figure supplement 1—source data 1
Average number of Slc32a1 positive cells in Ntscre Slc32a1+/+ and Ntscre Slc32a1lox/lox tissue.
- https://cdn.elifesciences.org/articles/98677/elife-98677-fig5-figsupp1-data1-v1.xlsx
Figure 6
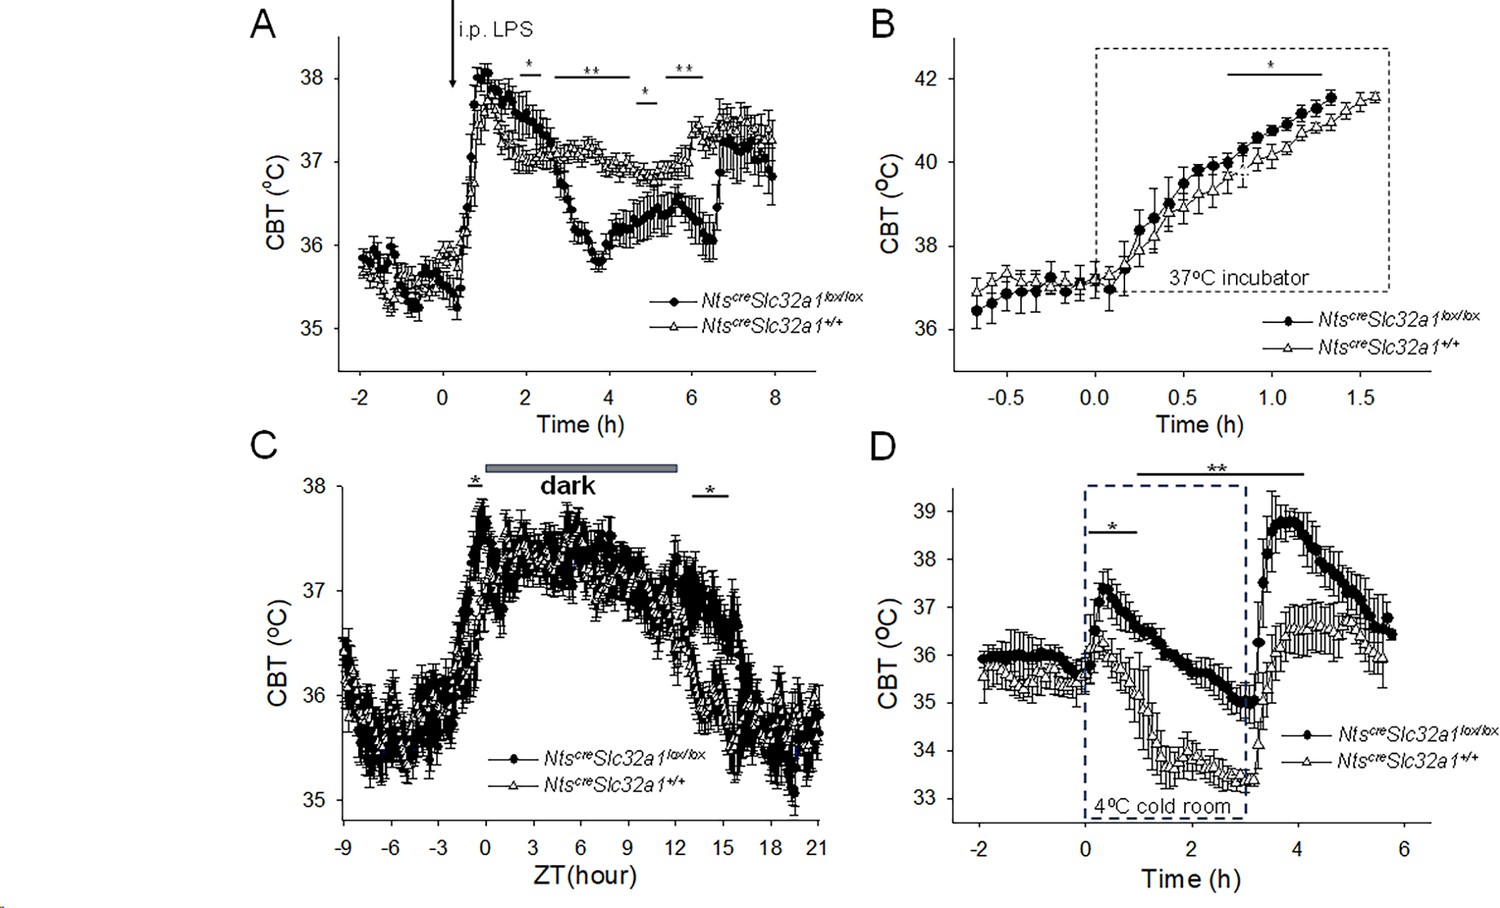
Altered thermoregulatory profile of Ntscre Slc32a1lox/lox mice.
(A) CBT responses to i.p. injection (arrow) of LPS (0.03 mg/kg) in Ntscre Slc32a1+/+ mice (∆, control) and Ntscre Slc32a1lox/lox mice (●). LPS induced fever responses with differential profiles (one-way repeated measures ANOVA, F(1,94)=9.31, p=2.948 × 10⁻³, followed by Mann-Whitney U tests for each time point, ** p<0.01, * p<0.05). (B) CBT responses during a heat test in an incubator at 37°C. The CBT increased faster in Ntscre Slc32a1lox/lox mice (●) than in Ntscre Slc32a1+/+ mice (∆, control) (repeated measures ANOVA, F(1,16) = 33.49, p=2.78 × 10⁻⁵, followed by Mann-Whitney U tests for each time point, * p<0.05). (C). Circadian CBT profiles in NtsSlc32a1-/- mice (●) than in Ntscre Slc32a1+/+ mice (∆, control). Ntscre Slc32a1lox/lox mice display a longer active phase relative to controls (repeated measures ANOVA, F(1,359) = 173.35, p=1.10 × 10⁻⁹, followed by Mann-Whitney U tests for each time point, * p<0.05). Data for each mouse represents the average of 10 different 24 hr periods. (D) CBT responses during a cold test in an incubator at 4 °C. Ntscre Slc32a1lox/lox mice (●), in contrast with Ntscre Slc32a1+/+ mice (∆, control), displayed a significant hyperthermia at the beginning as well as following the end of the cold exposure (repeated measures ANOVA, F(1,92)=220.89, p=4.3 × 10⁻¹⁴, followed by Mann-Whitney U tests for each time point, * p<0.05, ** p<0.01). (A–D) The points represent averages ± S.D. (n = 6 male mice).
-
Figure 6—source data 1
Differential CBT responses to LPS, heat and cold exposure in Ntscre Slc32a1+/+ and Ntscre Slc32a1lox/lox mice.
- https://cdn.elifesciences.org/articles/98677/elife-98677-fig6-data1-v1.xlsx
Figure 7
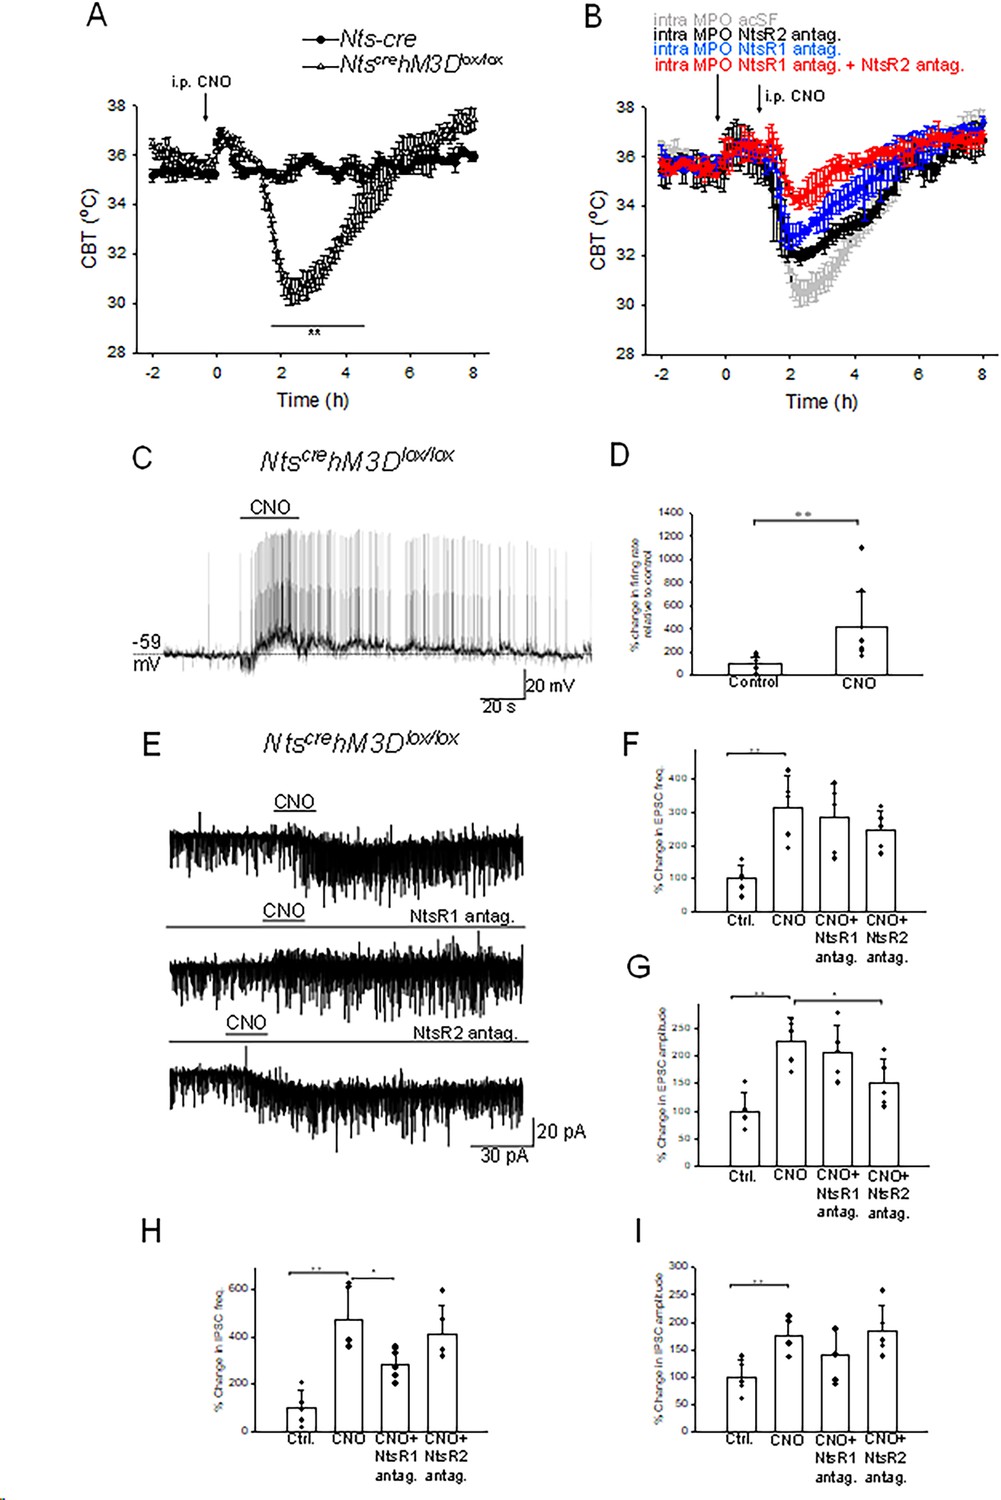
Chemogenetic activation of neurotensinergic neurons and projections induces hypothermia and potently excites MPO neurons.
(A) I.p. injection (arrow) of CNO (20 mM, 3 µl) in Ntscre hM3Dlox/lox mice (∆) and in Nts-cre mice (control, ●). CNO induced a hypothermia of 4.8 ± 0.6 °C (repeated measures ANOVA, F(1,242)=21.72, p=2.8 × 10⁻⁶, followed by followed by Mann-Whitney U tests for each time point, ** p<0.01). (B) Role of NtsR1 and NtsR2 expressed in the MPO in the CNO-induced activation of NtscrehM3Dlox/lox neurons. NtscrehM3Dlox/lox mice received a bilateral infusion of aCSF (gray), NtsR1 antagonist SR48692 (300 nM, 100 nl, blue), NtsR2 antagonist NTRC 824 (200 nM, 100 nl, black) and NtsR1 antagonist (300 nM, 100 nl)+NtsR2 antagonist (200 nM, 100 nl) (red) 1.5 hr prior to an i.p. injection of CNO (20 mM, 3 µl). The antagonists significantly reduced the hypothermia (repeated measures ANOVA, F(3,360)=71.33, p=8.82 × 10⁻¹⁶). (A,B) The points represent averages ± S.D. Experiments were carried out in parallel in groups of 6. (C) Chemogenetic activation of neurotensinergic neurons and neurotensinergic projections in the MPO by bath application of CNO (3 µM) in slices from NtscrehM3Dlox/lox mice depolarizes and increases the firing rate of a MPO neuron. The firing rate increased from 0.15 Hz to 1.65 Hz. (D) Bar chart summarizing the effect of chemogenetic activation of neurotensinergic neurons and projections in the MPO on the firing rates of MPO neurons. There was a statistically significant difference between groups as determined by one-way ANOVA (F(1,16)=8.99, p=8.52 × 10⁻³; ** indicates statistical significance of p<0.01). Bars represent means ± S.D. of the normalized firing rate relative to the control. Data pooled from n=10 neurons. (E) Chemogenetic activation of neurotensinergic neurons and neurotensinergic projections in the MPO by bath application of CNO (3 µM) in slices from NtscrehM3Dlox/lox mice increases the amplitudes and frequencies of both IPSCs and EPSCs and activates an inward current (upper trace). The NtsR1 antagonist SR48692 (100 nM) abolished the inward current activated by CNO (middle trace). The NtsR2 antagonist NTRC 824 (100 nM) did not change the inward current activated by CNO but significantly decreased the amplitude of sEPSCs (lower trace). The neuron was held at –50 mV. (F, G, H, I) Bar charts summarizing the increase in sEPSCs frequency (F) and amplitude (G) and IPSCs frequency (H) and amplitude (I) Bars represent means ± S.D. of the normalized frequency relative to the control. Data pooled from n=6 neurons. The changes were statistically significant for sEPSCs frequency (one-way ANOVA F(3,19)=6.94, p=3.33 × 10⁻³) and amplitude (one-way ANOVA F(3,19)=9.20, p=9.03 × 10⁻⁴) as well as for sIPSCs frequency (one-way ANOVA F(3,19)=12.61, p=1.71 × 10⁻⁴) and amplitude (one-way ANOVA F(3,19)=4.53, p=1.76 × 10⁻³). The P values for the inter-group comparisons are listed in Supplementary file 1-tables 4-7.
-
Figure 7—source data 1
Chemogenetic stimulation of NtscrehM3Dlox/lox neurons induces changes in CBT, firing rates, and in the amplitude and frequency of synaptic currents.
- https://cdn.elifesciences.org/articles/98677/elife-98677-fig7-data1-v1.xlsx
Figure 8
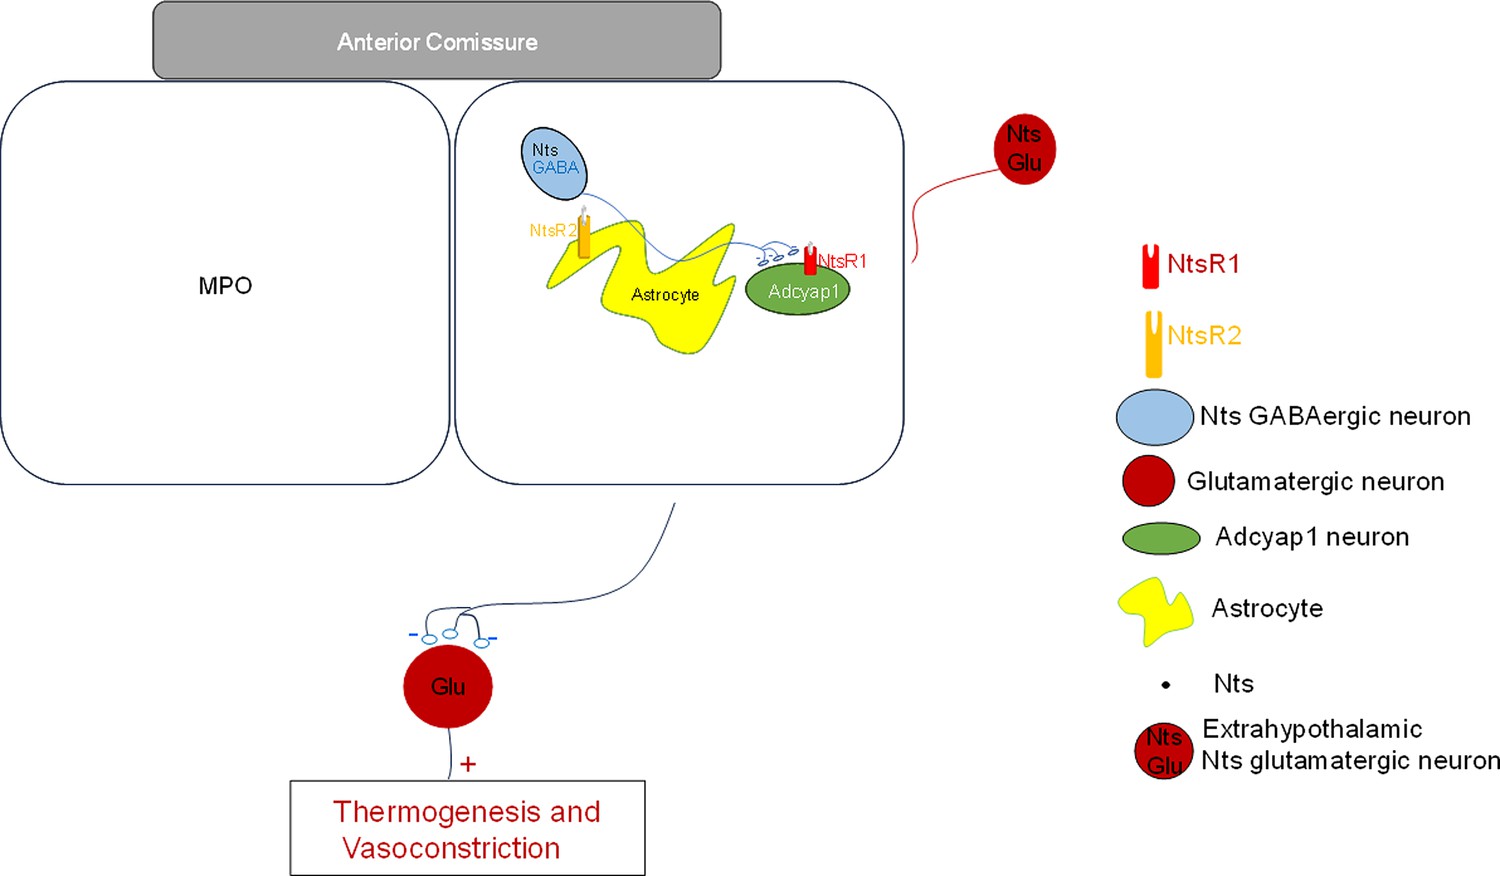
Schematic representation of neurotensinergic neurons in a thermoregulatory preoptic pathway.
Preoptic thermoregulatory Adcyap1 neurons, assumed to be glutamatergic, project to inhibitory interneurons in other brain regions that project to neurons controlling thermogenesis and vasoconstriction. Adcyap1 neurons’ inhibition results in increased thermogenesis and decreased vasoconstriction resulting in increased CBT. Conversely, excitation of the Adcyap1 thermoregulatory neurons results in hypothermia. Preoptic Nts neurons are GABAergic and project to preoptic thermoregulatory Adcyap1 neurons and modulate their activity. Preoptic astrocytes express NtsR2 receptors and their activation modulates the release of glutamate from nearby synaptic terminals.
Figure 9
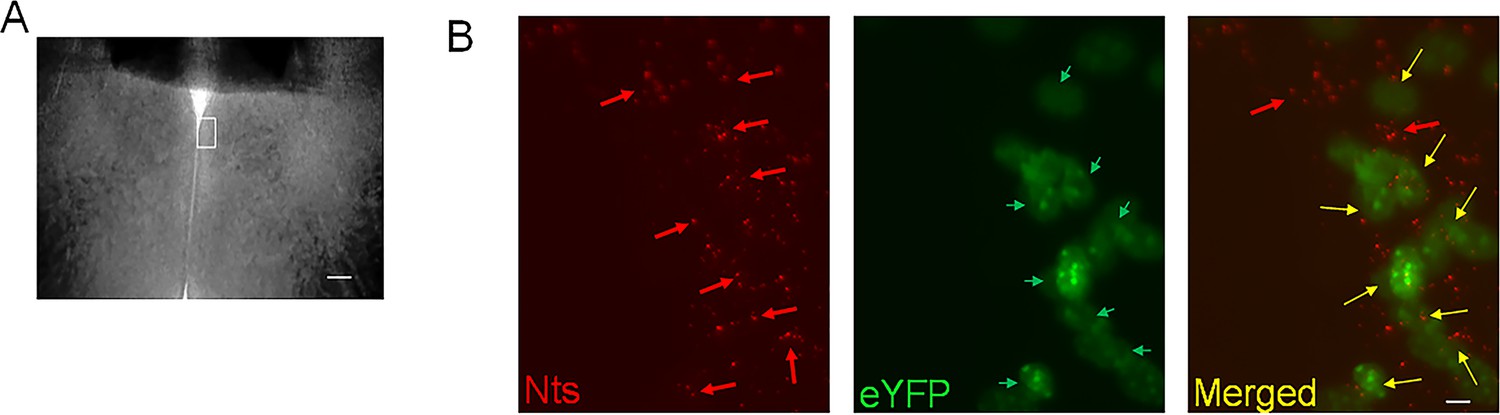
Transduction of MPONts neurons with ChR2-eYFP by injecting AAV-EF1a-double floxed-hChR2(H134R)-eYFP in Nts-cre mice.
(A) Brightfield image of a MPO slice. The white rectangle represents the region imaged in (B). The scale bar represents 100 µm. (B) Representative images of Nts transcripts visualized using RNAscope (red, left panel), eYFP (green, middle) and their superimposed images (right) in a coronal slice from a MPONts;ChR2 mouse. eYFP was visible in 8 out of 10 Nts positive cells. The scale bar represents 10 µm.
Tables
Key resources table
| Reagent type (species) or resource | Designation | Source or reference | Identifiers | Additional information |
|---|---|---|---|---|
| Genetic reagent (Mus musculus) | B6;129-Ntstm1(cre)Mgmj/J; Slc32a1tm1Lowl ; B6N;129-Tg(CAG-CHRM3*,-mCitrine)1Ute/J line | Jackson Laboratory Jackson Laboratory Jackson Laboratory | Cat. #:017525 RRID: IMSR_JAX:017525 Cat. #:012897 RRID:IMSR_JAX:012897 Cat. #:026220 RRID: IMSR_JAX:026220 | |
| Genetic reagent (AAV5) | AAV5-EF1a-double floxed-hChR2(H134R)-eYFP-WPRE-HGHpA; AAV5-EF1a-DIO-eYFP | Addgene Addgene | Cat. #:20298 Cat. #:27056 | |
| Sequence-based reagent | RNAscope Probe-Mm-Nts | ACDBio | Cat. #: 420441 | |
| Sequence-based reagent | RNAscope Probe-Mm-Slc32a1-C2 | ACDBio | Cat. #: 319191 C2 | |
| Sequence-based reagent | Slc17a6F external primer | This paper | PCR primers | CTGGATGGTCGTCAGTATTTTATG |
| Sequence-based reagent | Slc17a6R external primer | This paper | PCR primers | ATGAGAGTAGCCAACAACCAGAAG |
| Sequence-based reagent | Slc17a6F internal primer | This paper | PCR primers | GCAGGAGCTGGACTTTTTATTTAC |
| Sequence-based reagent | Slc17a6R internal primer | This paper | PCR primers | TAGTTGTTGAGAGAATTTGCTTGC |
| Sequence-based reagent | NtsF external primer | This paper | PCR primers | AGGCCCTACATTCTCAAGAG |
| Sequence-based reagent | NtsR external primer | This paper | PCR primers | CATTGTTCTGCTTTGGGTTA |
| Sequence-based reagent | NtsF internal primer | This paper | PCR primers | GGGGTTCCTACTACTACTGA |
| Sequence-based reagent | NtsR internal primer | This paper | PCR primers | CATCACATCCAATAAAGCAC |
| Sequence-based reagent | Slc32a1F PCR primers | This paper | PCR primers | GTCACGACAAACCCAAAGATCAC |
| Sequence-based reagent | Slc32a1R PCR primers | This paper | PCR primers | GTTGTTCCCTCATCATCTTCGCC |
| Sequence-based reagent | Adcyap1F PCR primers | This paper | PCR primers | CCTACCGCAAAGTCTTGGAC |
| Sequence-based reagent | Adcyap1R PCR primers | This paper | PCR primers | TTGACAGCCATTTGTTTTCG |
| Commercial assay or kit | Superscript III | Invitrogen | Cat. #:18080200 | |
| Chemical compound, drug | SR48692 | Tocris | Cat. #: 3721 | |
| Chemical compound, drug | NTRC 824 | Tocris | Cat. #:5438 | |
| Software, algorithm | pClamp10 | Molecular Devices | Version 10 | |
| Software, algorithm | MiniAnalysis software | Synaptosoft | Version 5 | |
| Software, algorithm | PolyScan2 | Mightex | Version 1 |
Additional files
-
MDAR checklist
- https://cdn.elifesciences.org/articles/98677/elife-98677-mdarchecklist1-v1.docx
-
Supplementary file 1
Tables of PCR primers and of the statistical parameters obtained in the Tukey's test group comparisons.
- https://cdn.elifesciences.org/articles/98677/elife-98677-supp1-v1.docx
Download links
A two-part list of links to download the article, or parts of the article, in various formats.
Downloads (link to download the article as PDF)
Open citations (links to open the citations from this article in various online reference manager services)
Cite this article (links to download the citations from this article in formats compatible with various reference manager tools)
Opposing actions of co-released GABA and neurotensin on the activity of preoptic neurons and on body temperature
eLife 13:RP98677.
https://doi.org/10.7554/eLife.98677.2


