Nuclear magnetic resonance-based metabolomics with machine learning for predicting progression from prediabetes to diabetes
- Institute and Department of Endocrinology and Metabolism, Shanghai Ninth People's Hospital, Shanghai Jiao Tong University School of Medicine, China
- Department of Medical Sciences, Uppsala University, Sweden
- Department of Big Data in Health Science, School of Public Health, Zhejiang University School of Medicine, China
- Department of Endocrinology, the Fifth Affiliated Hospital of Kunming Medical University, Yunnan Honghe Prefecture Central Hospital (Ge Jiu People's Hospital), China
Figures
Figure 1
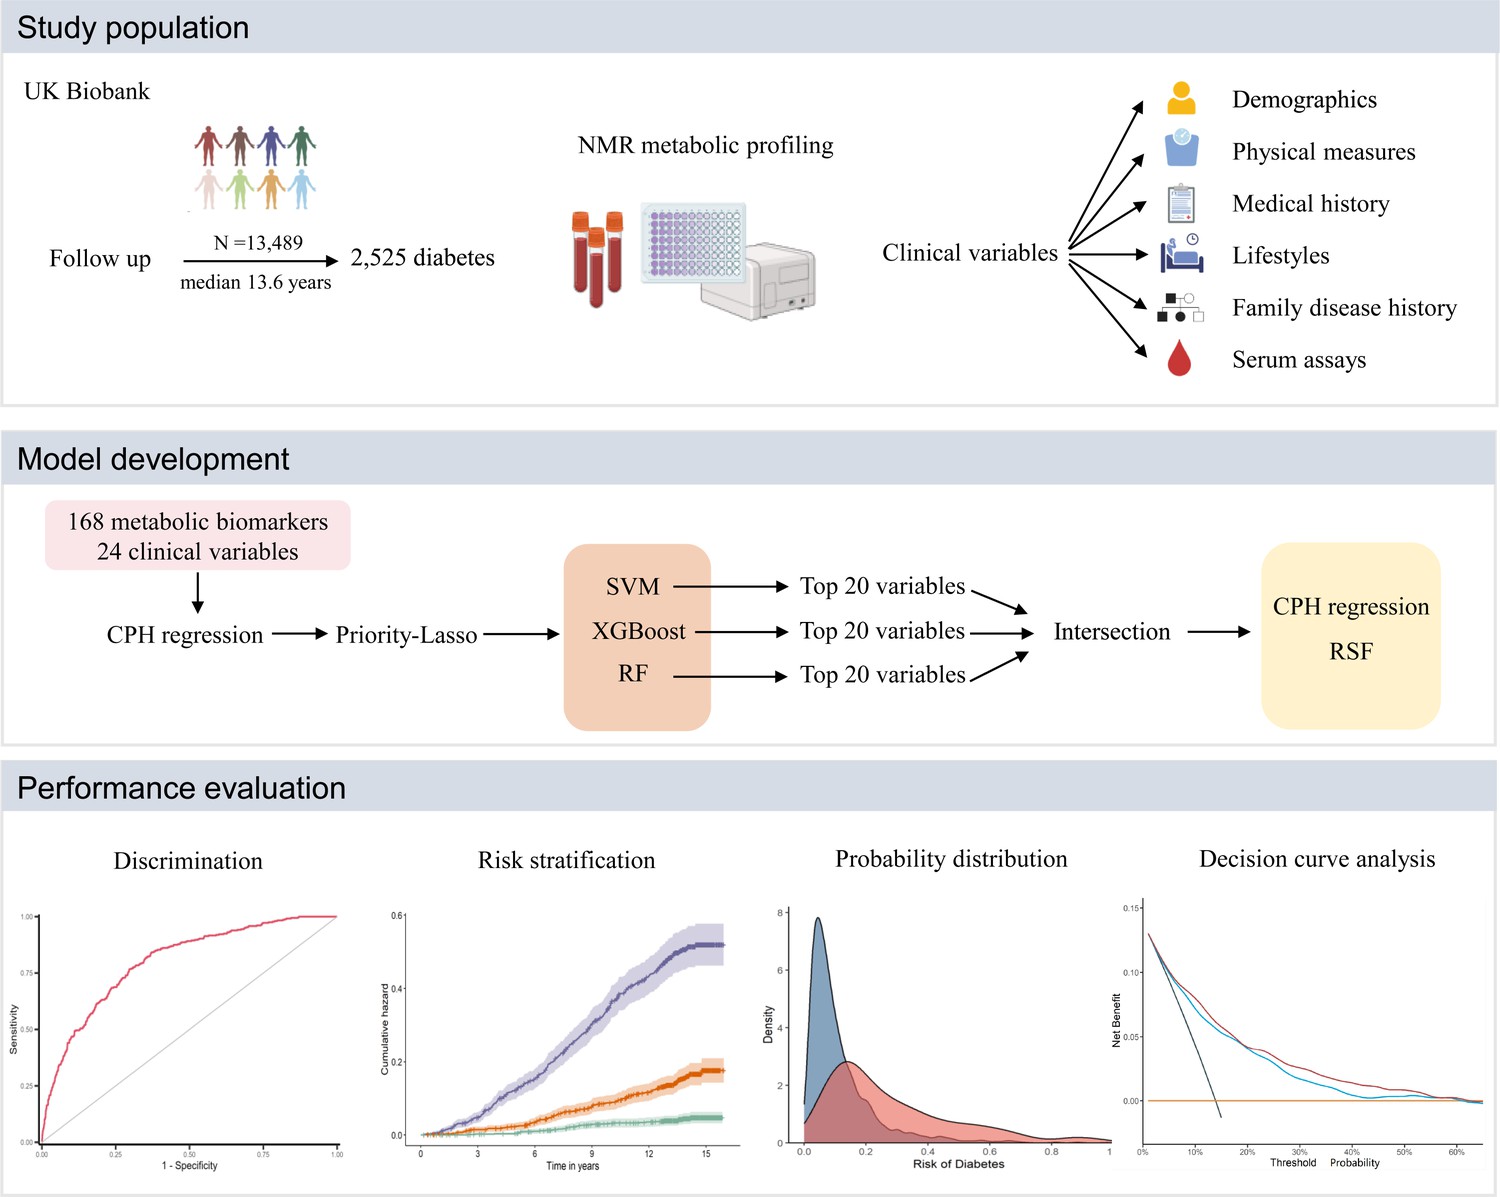
Overall schematic workflow of the study.
CPH, Cox proportional hazard; NMR, nuclear magnetic resonance; RF, random forest; RSF, random survival forest; SVM, supporting vector machine; XGBoost, extreme gradient boosting.
Figure 2
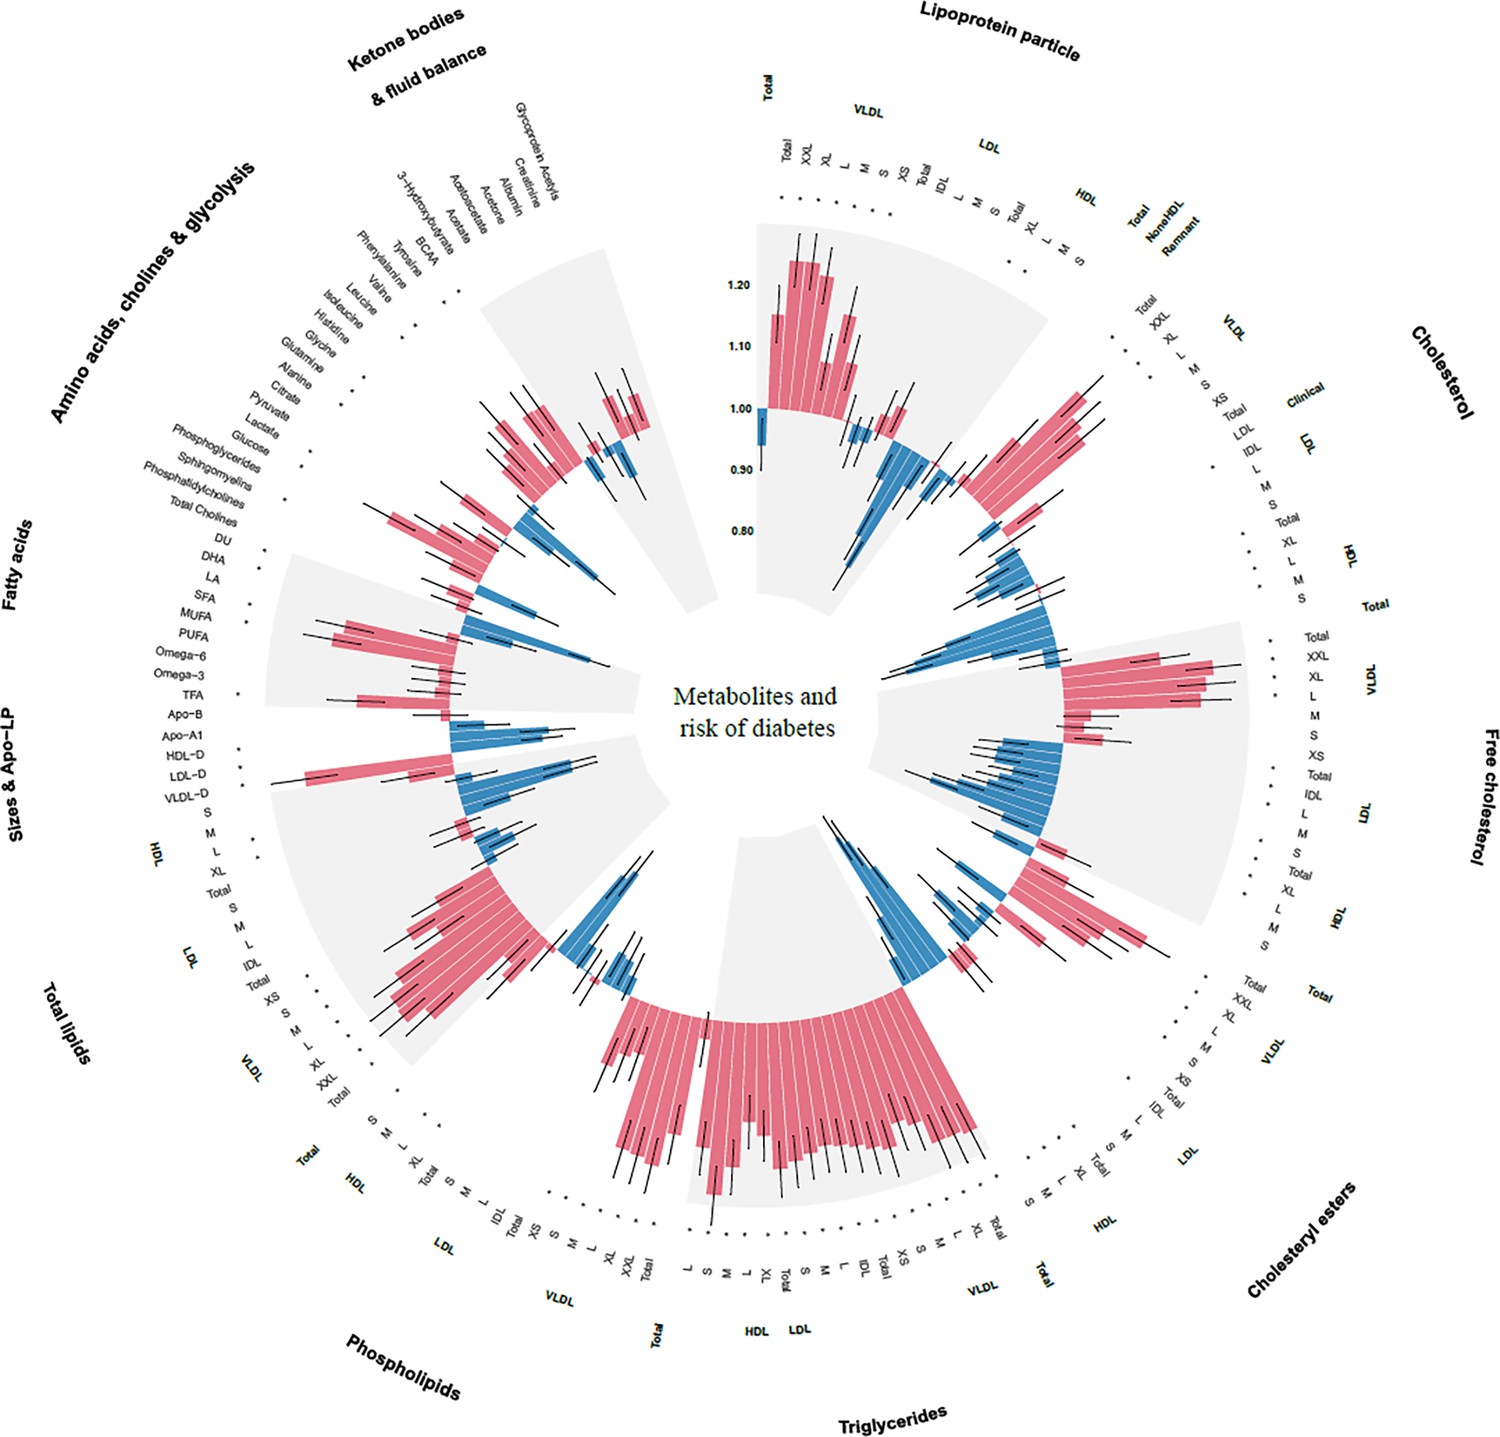
Associations of 168 metabolic biomarkers with risk of diabetes among 13,489 participants with prediabetes.
Hazard ratios (HRs) were presented per 1 standard deviation (SD) higher of metabolic biomarkers on the natural log scale and were adjusted for age, sex, ethnicity, education, Townsend Deprivation Index, employment status, household income, family history of diabetes, history of CVD, history of hypertension, history of dyslipidemia, history of CLD, history of cancer, body mass index, waist circumference, hip circumference, smoking status, moderate alcohol, healthy diet score, healthy sleep score, physical activity, systolic blood pressure, diastolic blood pressure, and glycated hemoglobin A1c. *False discovery rate controlled p < 0.05/168. Apo-A1, apolipoprotein A1; Apo-B, apolipoprotein B; Apo-LP, apolipoprotein; BCAA, branched-chain amino acid; BMI, body mass index; CVD, cardiovascular disease; CLD, chronic lung disease; DHA, docosahexaenoic acid; FA, fatty acids; HDL, high-density lipoproteins; HDL-D, high-density lipoprotein particle diameter; IDL, intermediate-density lipoproteins; L, large; LA, linoleic acid; LDL, low-density lipoproteins; LDL-D, low-density lipoprotein particle diameter; LP, lipoprotein; M, medium; MUFA, monounsaturated fatty acids; PUFA, polyunsaturated fatty acids; S, small; SFA, saturated fatty acids; VLDL, very-low-density lipoproteins; VLDL-D, very-low-density lipoprotein particle diameter; XL, very large; XS, very small; XXL, extremely large.
Figure 3
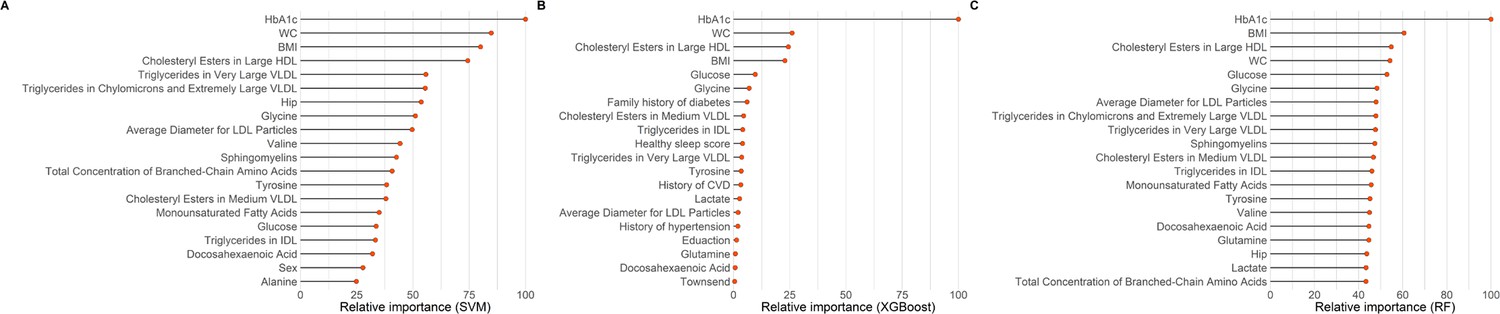
The top 20 important variables selected by three machine-learning models: (A) supporting vector machine (SVM); (B) extreme gradient boosting (XGBoost); (C) random forest (RF).
The models were adjusted for age, sex, ethnicity, education, Townsend Deprivation Index, employment status, household income, family history of diabetes, history of CVD, history of hypertension, history of dyslipidemia, history of CLD, history of cancer, body mass index, waist circumference, hip circumference, smoking status, moderate alcohol, healthy diet score, healthy sleep score, physical activity, systolic blood pressure, diastolic blood pressure, and glycated hemoglobin A1c. CVD, cardiovascular disease; CLD, chronic lung disease; HDL, high-density lipoproteins; IDL, intermediate-density lipoproteins; LDL, low-density lipoproteins; VLDL, very-low-density lipoproteins.
Figure 4
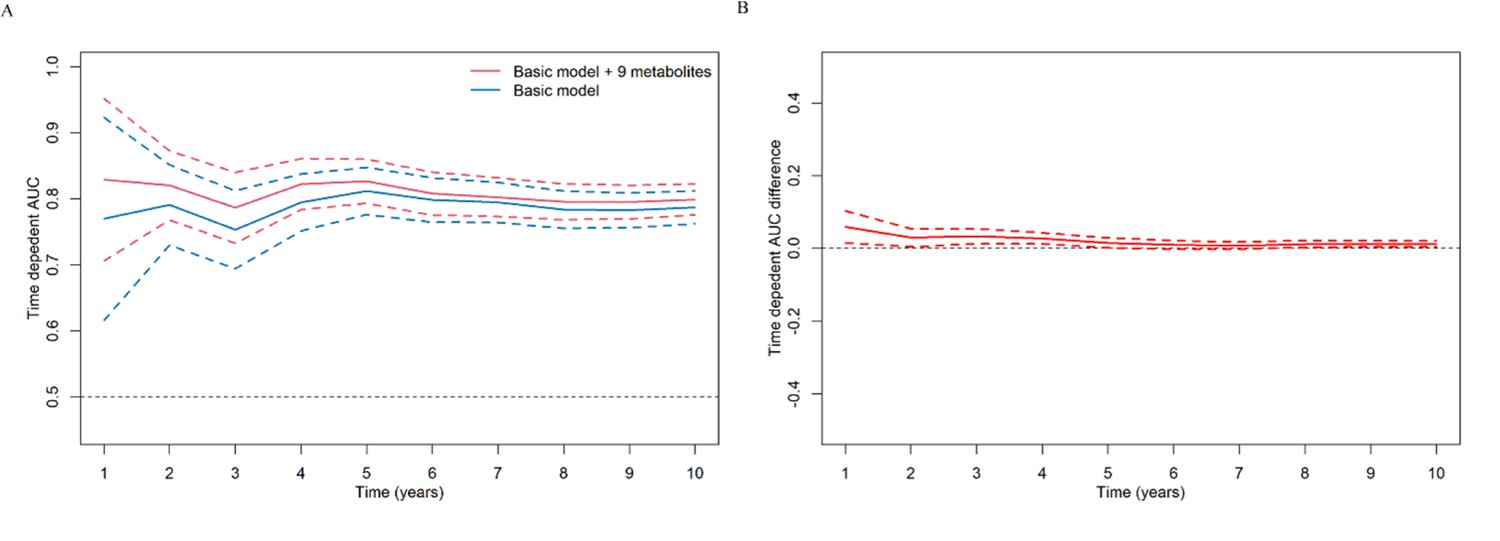
Consecutive area under time-dependent receiver-operating characteristic (AUROC) of basic model and basic model plus nine metabolites (A), and the difference of these two time-dependent AUROCs over time (B).
The basic model used conventional clinical variables including age, sex, Townsend Deprivation Index, family history of diabetes mellitus, body mass index, waist circumference, hip circumference, systolic blood pressure, diastolic blood pressure, and glycated hemoglobin A1c. The selected nine metabolites included cholesteryl esters in large HDL, triglycerides in very large VLDL, glycine, average diameter for LDL particles, tyrosine, cholesteryl esters in medium VLDL, glucose, triglycerides in IDL, and docosahexaenoic acid. HDL, high-density lipoprotein; IDL, intermediate-density lipoprotein; LDL, low-density lipoprotein; VLDL, very-low-density lipoprotein.
Figure 5
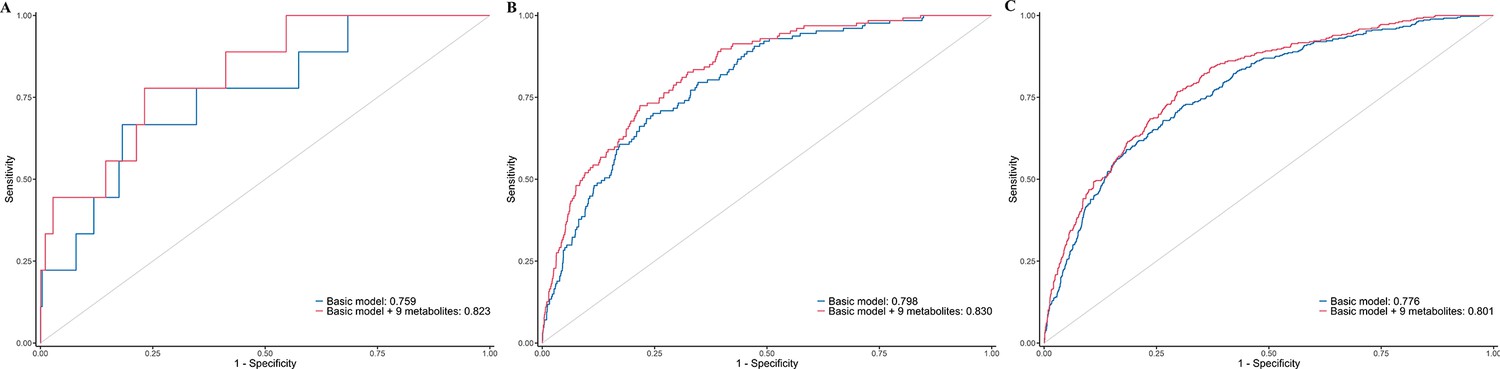
Time-dependent receiver-operating characteristic (ROC) curves of basic model and basic model plus nine metabolites for predicting 1-year (A), 5-year (B), and 10-year (C) risk of developing diabetes in participants with prediabetes.
The basic model used conventional clinical variables including age, sex, Townsend Deprivation Index, family history of diabetes mellitus, body mass index, waist circumference, hip circumference, systolic blood pressure, diastolic blood pressure, and glycated hemoglobin A1c. The selected nine metabolites included cholesteryl esters in large HDL, triglycerides in very large VLDL, glycine, average diameter for LDL particles, tyrosine, cholesteryl esters in medium VLDL, glucose, triglycerides in IDL, and docosahexaenoic acid. HDL, high-density lipoprotein; IDL, intermediate-density lipoprotein; LDL, low-density lipoprotein; VLDL, very-low-density lipoprotein.
Figure 6
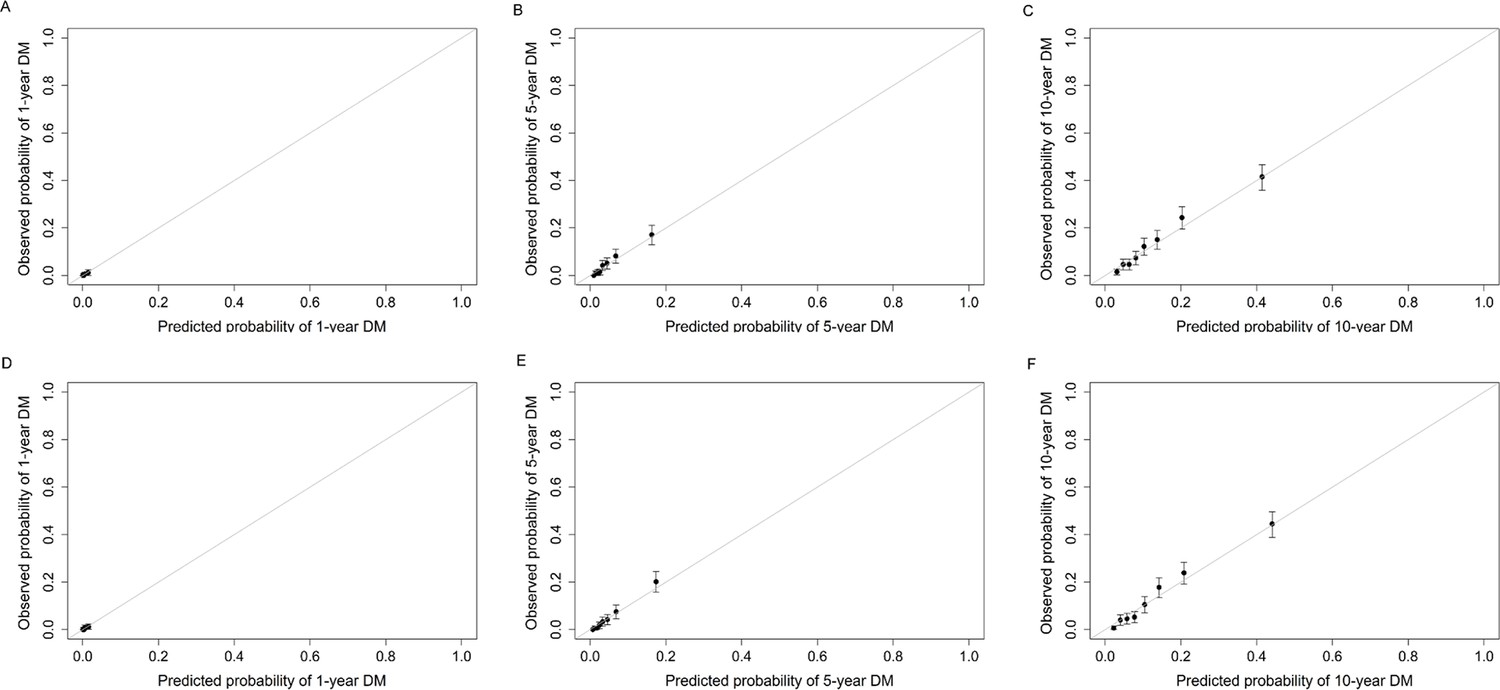
Calibration plots of basic model (A–C) and basic model plus nine metabolites (D–F) for predicting 1-year, 5-year, and 10-year risk of developing diabetes in participants with prediabetes.
The basic model used conventional clinical variables including age, sex, Townsend Deprivation Index, family history of diabetes mellitus, body mass index, waist circumference, hip circumference, systolic blood pressure, diastolic blood pressure, and glycated hemoglobin A1c. The selected nine metabolites included cholesteryl esters in large HDL, triglycerides in very large VLDL, glycine, average diameter for LDL particles, tyrosine, cholesteryl esters in medium VLDL, glucose, triglycerides in IDL, and docosahexaenoic acid. HDL, high-density lipoprotein; IDL, intermediate-density lipoprotein; LDL, low-density lipoprotein; VLDL, very-low-density lipoprotein.
Figure 7
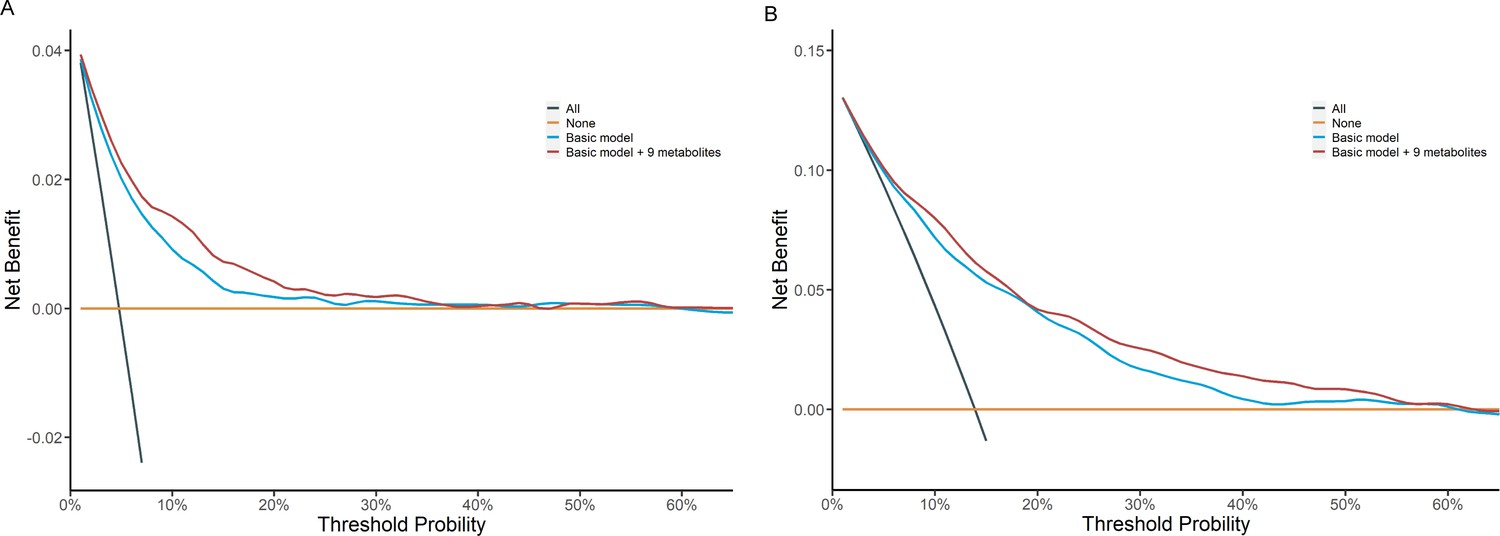
Decision curve analysis of basic model and basic model plus nine metabolites for predicting 5-year (A) and 10-year (B) risk of developing diabetes in participants with prediabetes.
Decision curve analysis was not performed on 1-year prediction considering the relatively small number of prediabetic patients who develop diabetes within a year in the test set and small net benefit from intervention. The basic model used conventional clinical variables including age, sex, Townsend Deprivation Index, family history of diabetes mellitus, body mass index, waist circumference, hip circumference, systolic blood pressure, diastolic blood pressure, and glycated hemoglobin A1c. The selected nine metabolites included cholesteryl esters in large HDL, triglycerides in very large VLDL, glycine, average diameter for LDL particles, tyrosine, cholesteryl esters in medium VLDL, glucose, triglycerides in IDL, and docosahexaenoic acid. HDL, high-density lipoprotein; IDL, intermediate-density lipoprotein; LDL, low-density lipoprotein; VLDL, very-low-density lipoprotein.
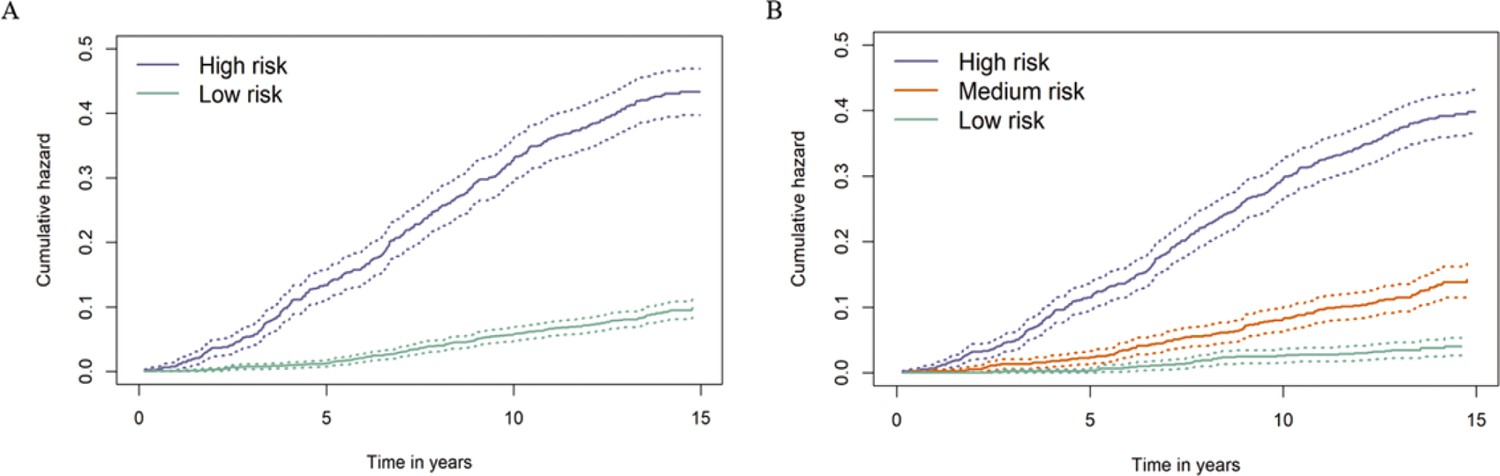
Figure 8 with 1 supplement
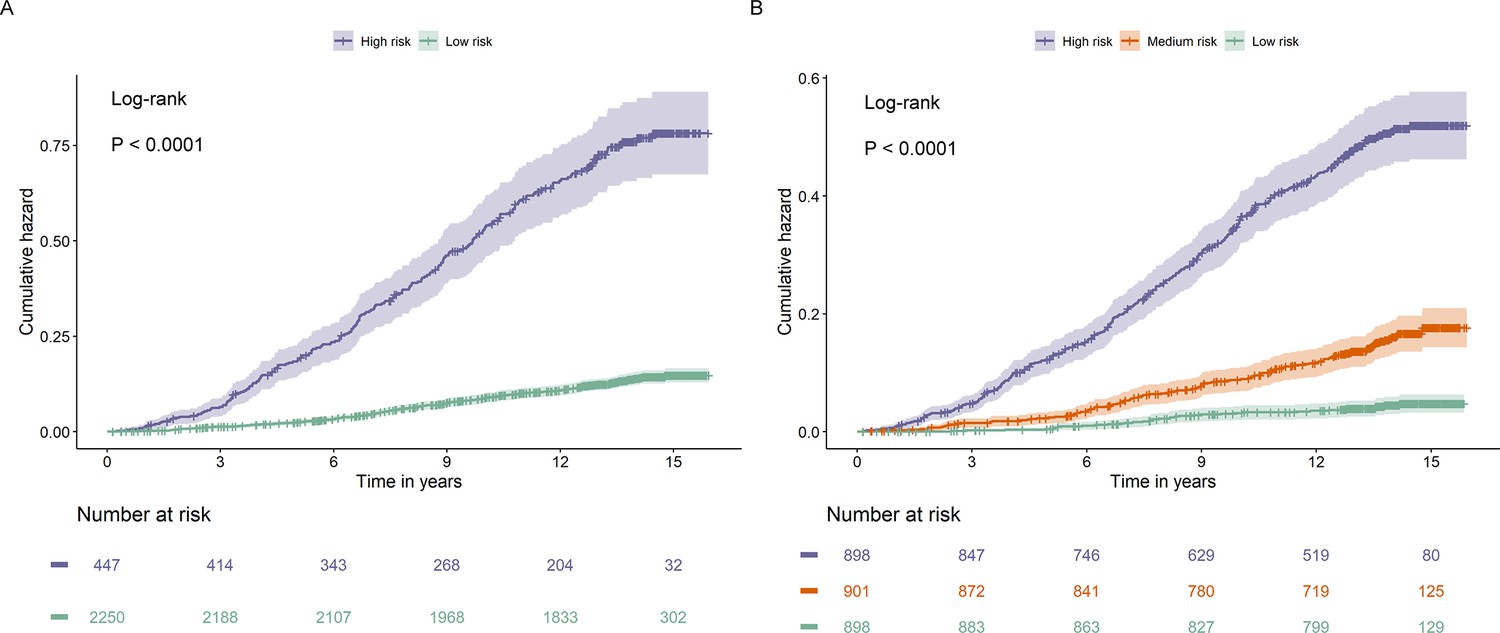
Cumulative hazard curves for participants with prediabetes with different risks stratified by the Cox model based on clinical variables and nine metabolites.
The Cox model divided participants with prediabetes in the test set to two categories (A) and three categories (B) with significant differences in cumulative hazard of diabetes during the follow-up (both p < 0.0001).
Figure 8—figure supplement 1
Cumulative hazard curves for participants with prediabetes with different risks stratified by the Cox model based on clinical variables and nine metabolites when considering competing risk from death.
The Cox model divided participants with prediabetes in the test set to two categories (A) and three categories (B) with significant differences in cumulative hazard of diabetes during the follow-up (both Fine–Gray p < 0.0001).
Figure 9
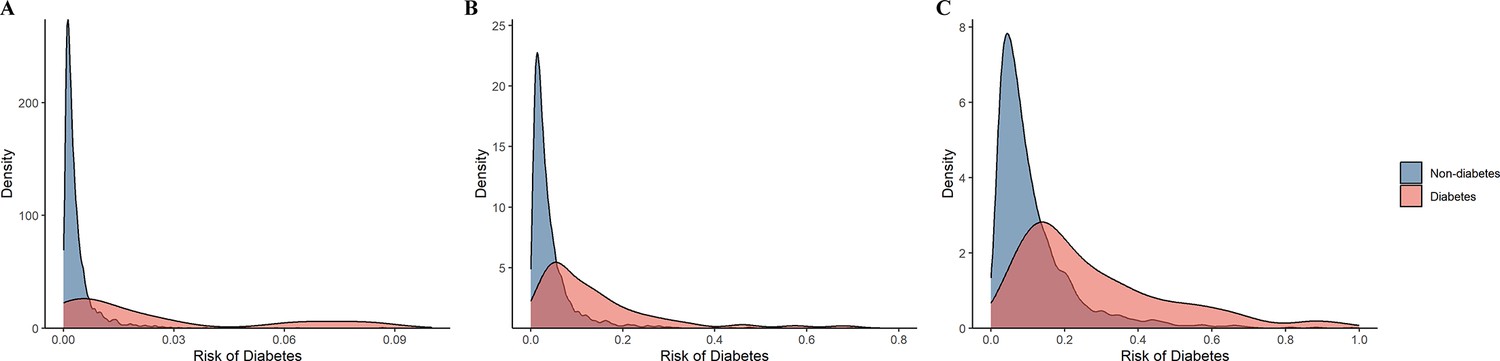
The distribution of the predictive probability of developing diabetes among participants with prediabetes by incident diabetes status within 1 year (A), 5 years (B), and 10 years (C).
Tables
Table 1
Baseline characteristics of participants with prediabetes stratified by incident diabetes status.
| Characteristics | Overall (n = 13489) | Diabetes (n = 2525) | Non-diabetes (n = 10964) | p value |
|---|---|---|---|---|
| Age, years | 59.6 (7.1) | 59.7 (7.1) | 59.6 (7.0) | 0.347 |
| Male | 6166 (45.7) | 1407 (55.7) | 4759 (43.4) | <0.001 |
| Education | <0.001 | |||
| College or university | 3409 (25.3) | 498 (19.7) | 2911 (26.6) | |
| Others | 10056 (74.5) | 2022 (80.1) | 8034 (73.3) | |
| Unknown | 24 (0.2) | 5 (0.2) | 19 (0.2) | |
| Ethnicity | 0.013 | |||
| White | 12172 (90.2) | 2239 (88.7) | 9933 (90.6) | |
| Others | 1293 (9.6) | 281 (11.1) | 1012 (9.2) | |
| Unknown | 24 (0.2) | 5 (0.2) | 19 (0.2) | |
| Employment status | <0.001 | |||
| Working | 6608 (49.0) | 1172 (46.4) | 5436 (49.6) | |
| Retired | 5931 (44.0) | 1114 (44.1) | 4817 (43.9) | |
| Other | 787 (5.8) | 212 (8.4) | 575 (5.2) | |
| Unknown | 163 (1.2) | 27 (1.1) | 136 (1.2) | |
| Household income | <0.001 | |||
| Low | 3529 (26.2) | 2734 (24.9) | 795 (31.5) | |
| Medium | 5659 (42.0) | 4666 (42.6) | 993 (39.3) | |
| High | 1897 (14.1) | 1611 (14.7) | 286 (11.3) | |
| Unknown | 2404 (17.8) | 1953 (17.8) | 451 (17.9) | |
| Townsend Deprivation Index | −1.0 (3.3) | −0.7 (3.4) | −1.1 (3.2) | <0.001 |
| Family history of DM | 3068 (22.7) | 786 (31.1) | 2282 (20.8) | <0.001 |
| History of CVD | 1392 (10.3) | 413 (16.4) | 979 (8.9) | <0.001 |
| History of hypertension | 4217 (31.3) | 985 (39.0) | 3232 (29.5) | <0.001 |
| History of dyslipidemia | 1932 (14.3) | 417 (16.5) | 1515 (13.8) | 0.001 |
| History of CLD | 1847 (13.7) | 413 (16.4) | 1434 (13.1) | <0.001 |
| History of cancer | 0.056 | |||
| Yes | 1315 (9.7) | 215 (8.5) | 1100 (10.0) | |
| No | 12171 (90.2) | 2309 (91.4) | 9862 (89.9) | |
| Unknown | 3 (0.0) | 1 (0.0) | 2 (0.0) | |
| BMI, kg/m2 | 29.0 (5.2) | 31.3 (5.3) | 28.4 (5.0) | <0.001 |
| WC, cm | 94.6 (13.5) | 101.3 (13.1) | 93.1 (13.1) | <0.001 |
| HC, cm | 105.4 (10.0) | 108.6 (10.8) | 104.6 (9.7) | <0.001 |
| Smoking status, % | <0.001 | |||
| Never | 6478 (48.0) | 1104 (43.7) | 5374 (49.0) | |
| Previous | 4843 (35.9) | 1003 (39.7) | 3840 (35.0) | |
| Current | 2074 (15.4) | 397 (15.7) | 1677 (15.3) | |
| Unknown | 94 (0.7) | 21 (0.8) | 73 (0.7) | |
| Moderate alcohol | 0.081 | |||
| Yes | 3888 (28.8) | 689 (27.3) | 3199 (29.2) | |
| No | 9595 (71.1) | 1836 (72.7) | 7759 (70.8) | |
| Unknown | 6 (0.0) | 0 (0.0) | 6 (0.1) | |
| Healthy diet score | 3.3 (1.1) | 3.2 (1.1) | 3.3 (1.1) | <0.001 |
| Healthy sleep score | 3.5 (1.0) | 3.3 (1.1) | 3.6 (1.0) | <0.001 |
| Physical activity, METs | 10.4 (4.9) | 9.7 (5.1) | 10.6 (4.9) | <0.001 |
| SBP, mmHg | 141.3 (18.5) | 143.5 (18.2) | 140.8 (18.5) | <0.001 |
| DBP, mmHg | 83.3 (10.2) | 84.6 (10.4) | 83.0 (10.1) | <0.001 |
| HbA1c, % | 5.9 (0.2) | 6.0 (0.2) | 5.9 (0.2) | <0.001 |
-
Data were presented as means (standard deviations, SDs) for continuous variables and numbers (percentages) for categorical variables.
-
BMI, body mass index; DM, diabetes mellitus; CVD, cardiovascular disease; CLD, chronic lung disease; DBP, diastolic blood pressure; HbA1c, glycated hemoglobin A1c; HC, hip circumference; MET, metabolic equivalent of task; SBP, systolic blood pressure; WC, waist circumference.
Table 2
Performance of Cox proportional hazards regression models in prediction of the progression of prediabetes to diabetes.
| Performance metric | Basic model* | Basic model + nine metabolites† | p value |
|---|---|---|---|
| AUROC | |||
| T = 1 year | 0.759 (0.608, 0.911) | 0.823 (0.702, 0.945) | 0.009 |
| T = 5 years | 0.798 (0.762, 0.834) | 0.830 (0.797, 0.864) | <0.001 |
| T = 10 years | 0.776 (0.750, 0.801) | 0.801 (0.778, 0.825) | <0.001 |
| Continuous NRI | |||
| T = 1 year | Reference | 0.461 (0.134, 0.660) | <0.001 |
| T = 5 years | Reference | 0.400 (0.277, 0.483) | <0.001 |
| T = 10 years | Reference | 0.329 (0.252, 0.405) | <0.001 |
| Absolute IDI | |||
| T = 1 year | Reference | 0.006 (−0.002, 0.020) | 0.132 |
| T = 5 years | Reference | 0.028 (0.017, 0.040) | <0.001 |
| T = 10 years | Reference | 0.040 (0.027, 0.054) | <0.001 |
-
AUROC, area under the receiver-operating characteristic curve; HDL, high-density lipoprotein; IDL, intermediate-density lipoprotein; IDI, absolute integrated discrimination improvement; LDL, low-density lipoprotein; NRI, net reclassification improvement; VLDL, very-low-density lipoprotein.
-
*
Basic model: age, sex, Townsend Deprivation Index, family history of diabetes mellitus, body mass index, waist circumference, hip circumference, systolic blood pressure, diastolic blood pressure, and glycated hemoglobin A1c.
-
†
The selected nine metabolic biomarkers: cholesteryl esters in large HDL, triglycerides in very large VLDL, glycine, average diameter for LDL particles, tyrosine, cholesteryl esters in medium VLDL, glucose, triglycerides in IDL, docosahexaenoic acid.
Additional files
-
Supplementary file 1
List of 168 NMR-based metabolomic biomarkers in the UK Biobank.
HDL, high-density lipoproteins; IDL, intermediate-density lipoproteins; LDL, low-density lipoproteins; VLDL, very-low-density lipoproteins.
- https://cdn.elifesciences.org/articles/98709/elife-98709-supp1-v1.docx
-
Supplementary file 2
Associations of 168 metabolic biomarkers with risk of diabetes among 13,489 participants with prediabetes.
Hazard ratios (HRs) were presented per 1 standard deviation (SD) higher of metabolic biomarker on the natural log scale and were adjusted for age, sex, ethnicity, education, Townsend Deprivation Index, employment status, household income, family history of diabetes, history of CVD, history of hypertension, history of dyslipidemia, history of CLD, history of cancer, body mass index, waist circumference, hip circumference, smoking status, moderate alcohol, healthy diet score, healthy sleep score, physical activity, systolic blood pressure, diastolic blood pressure and glycated hemoglobin A1c. p value <0.05/168 were highlighted in bold. Apo-A1, apolipoprotein A1; Apo-B, apolipoprotein B; Apo-LP, apolipoprotein; BMI, body mass index; CVD, cardiovascular disease; CLD, chronic lung disease; DHA, docosahexaenoic acid; FA, fatty acids; HDL, high-density lipoproteins; HDL-D, high-density lipoprotein particle diameter; IDL, intermediate-density lipoproteins; L, large; LA, linoleic acid; LDL, low-density lipoproteins; LDL-D, low-density lipoprotein particle diameter; LP, lipoprotein; M, medium; MUFA, monounsaturated fatty acids; PUFA, polyunsaturated fatty acids; S, small; SFA, saturated fatty acids; VLDL, very-low-density lipoproteins; VLDL-D, very-low-density lipoprotein particle diameter; XL, very large; XS, very small; XXL, extremely large.
- https://cdn.elifesciences.org/articles/98709/elife-98709-supp2-v1.docx
-
Supplementary file 3
Coefficients of the selected 17 metabolites by priority-Lasso.
HDL, high-density lipoproteins; IDL, intermediate-density lipoproteins; LDL, low-density lipoproteins; VLDL, very-low-density lipoproteins.
- https://cdn.elifesciences.org/articles/98709/elife-98709-supp3-v1.docx
-
Supplementary file 4
Associations of the selected nine metabolites with risk of diabetes among 13,489 participants with prediabetes after adjusting for conventional clinical variables.
Hazard ratios (HRs) were presented per 1 standard deviation (SD) higher of metabolic biomarker on the natural log scale and were adjusted for age, sex, Townsend Deprivation Index, family history of diabetes, body mass index, waist circumference, hip circumference, systolic blood pressure, diastolic blood pressure, and glycated hemoglobin A1c. HDL, high-density lipoproteins; IDL, intermediate-density lipoproteins; LDL, low-density lipoproteins; VLDL, very-low-density lipoproteins.
- https://cdn.elifesciences.org/articles/98709/elife-98709-supp4-v1.docx
-
Supplementary file 5
Performance of Cox proportional hazards prediction models for the risk of diabetes among participants with normoglycemia.
(a) Basic model: age, sex, Townsend Deprivation Index, family history of diabetes mellitus, body mass index, waist circumference, hip circumference, systolic blood pressure, diastolic blood pressure, and glycated hemoglobin A1c. (b) The selected nine metabolic biomarkers: cholesteryl esters in large HDL, triglycerides in very large VLDL, glycine, average diameter for LDL particles, tyrosine, cholesteryl esters in medium VLDL, glucose, triglycerides in IDL, docosahexaenoic acid. AUROC, area under the receiver-operating characteristic curve; HDL, high-density lipoprotein; IDL, intermediate-density lipoprotein; IDI, absolute integrated discrimination improvement; LDL, low-density lipoprotein; NRI, net reclassification improvement; VLDL, very-low-density lipoprotein.
- https://cdn.elifesciences.org/articles/98709/elife-98709-supp5-v1.docx
-
MDAR checklist
- https://cdn.elifesciences.org/articles/98709/elife-98709-mdarchecklist1-v1.docx
Download links
A two-part list of links to download the article, or parts of the article, in various formats.
Downloads (link to download the article as PDF)
Open citations (links to open the citations from this article in various online reference manager services)
Cite this article (links to download the citations from this article in formats compatible with various reference manager tools)
Nuclear magnetic resonance-based metabolomics with machine learning for predicting progression from prediabetes to diabetes
eLife 13:RP98709.
https://doi.org/10.7554/eLife.98709.3


