Microbiota from young mice counteracts susceptibility to age-related gout through modulating butyric acid levels in aged mice
- Department of Clinical Veterinary Medicine, College of Veterinary Medicine, Jilin University, China
- Department of Bone and Joint Surgery, No 1 Hospital of Jilin University, China
- Department of Gastrointestinal Nutrition and Hernia Surgery, The Second Hospital of Jilin University, China
Figures
Figure 1
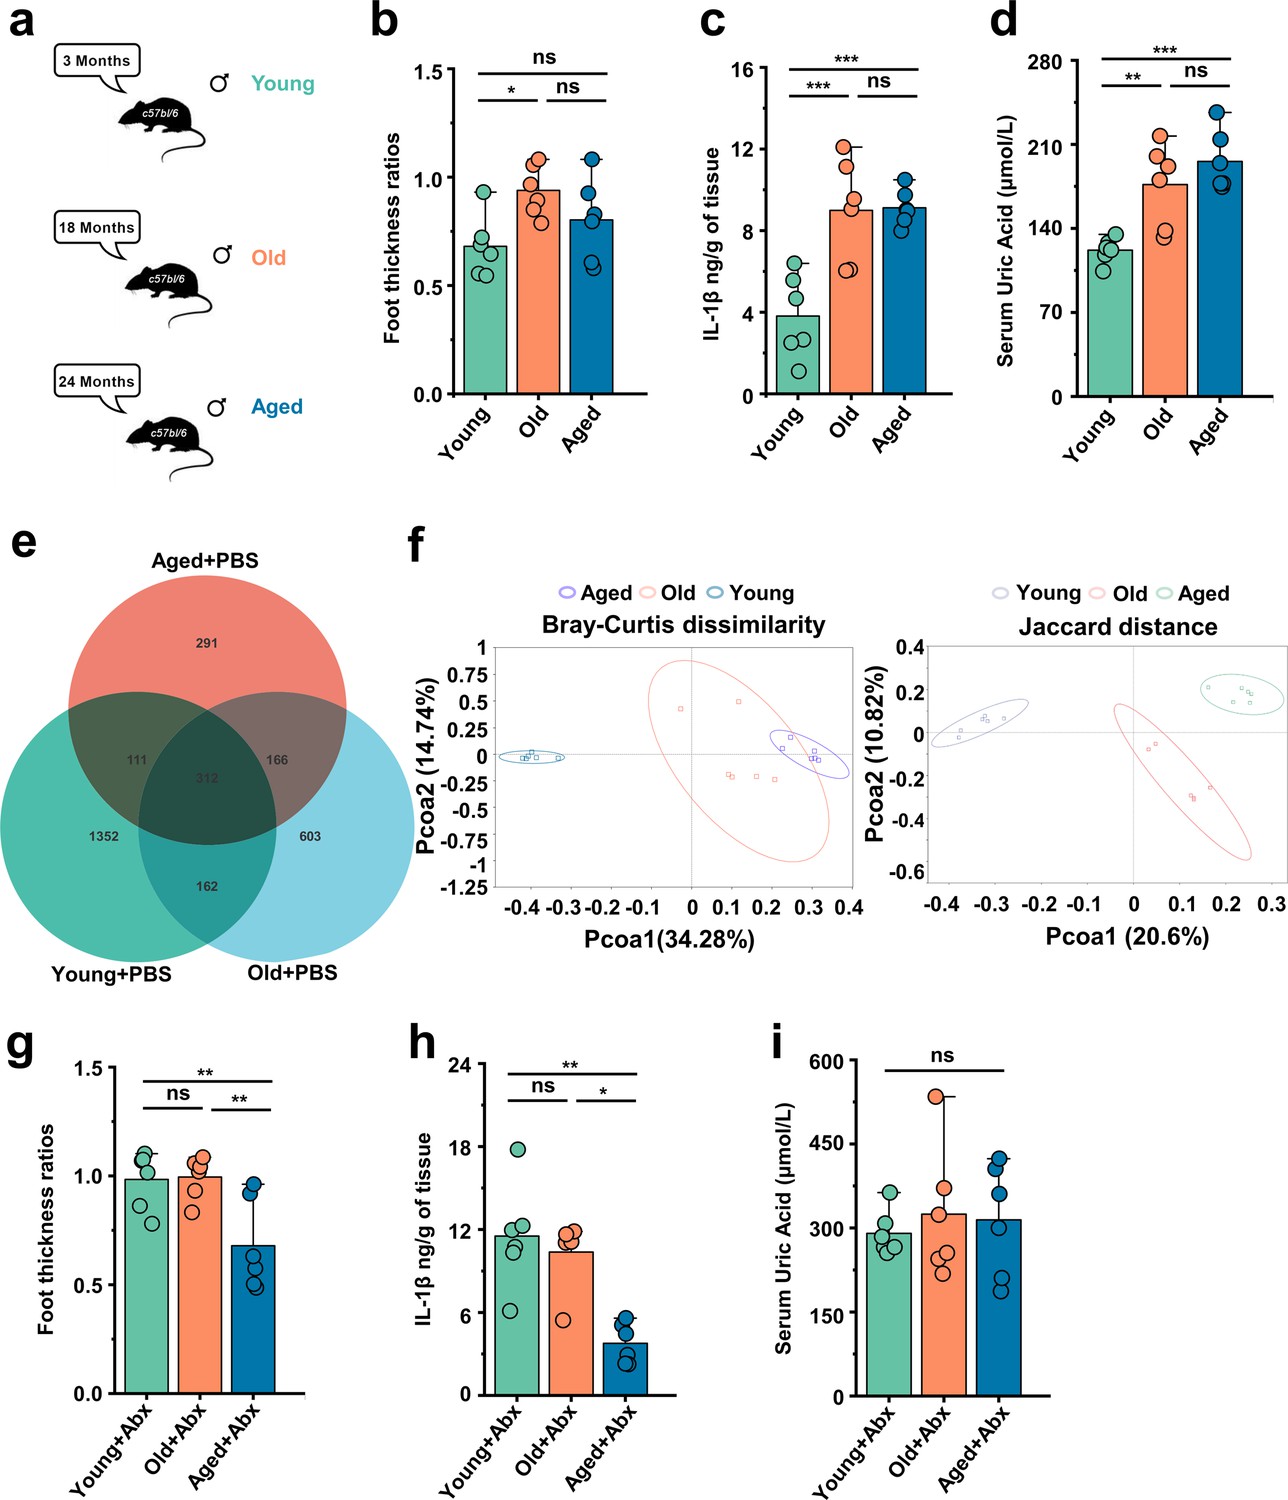
Gout susceptibility increases with age, related to gut microbiota.
(a) Mice of different ages. (b–d) The foot thickness ratios (b), foot tissue’s IL-1β concentrations (c), and serum concentrations of uric acid of three different age ranges groups (d) were tested after monosodium urate (MSU) administration (n = 6). (e, f) The three different age ranges groups’ amplicon sequence variants (ASVs) (e) and principal coordinates analysis (PCoA) (using Bray–Curtis dissimilarity and Jaccard distance) (f). (g–i) The foot thickness ratios (g), foot tissue’s IL-1β concentrations (h), and serum concentrations of uric acid of three different age ranges groups (i) (treated with antibiotics [ABX] cocktail) were tested after MSU administration (n = 6). Values are presented as the mean ± SEM. Differences were assessed by one-way ANOVA and denoted as follows: *p<0.05, **p<0.01, and ***p<0.001, 'ns' indicates no significant difference between groups.
Figure 2 with 1 supplement
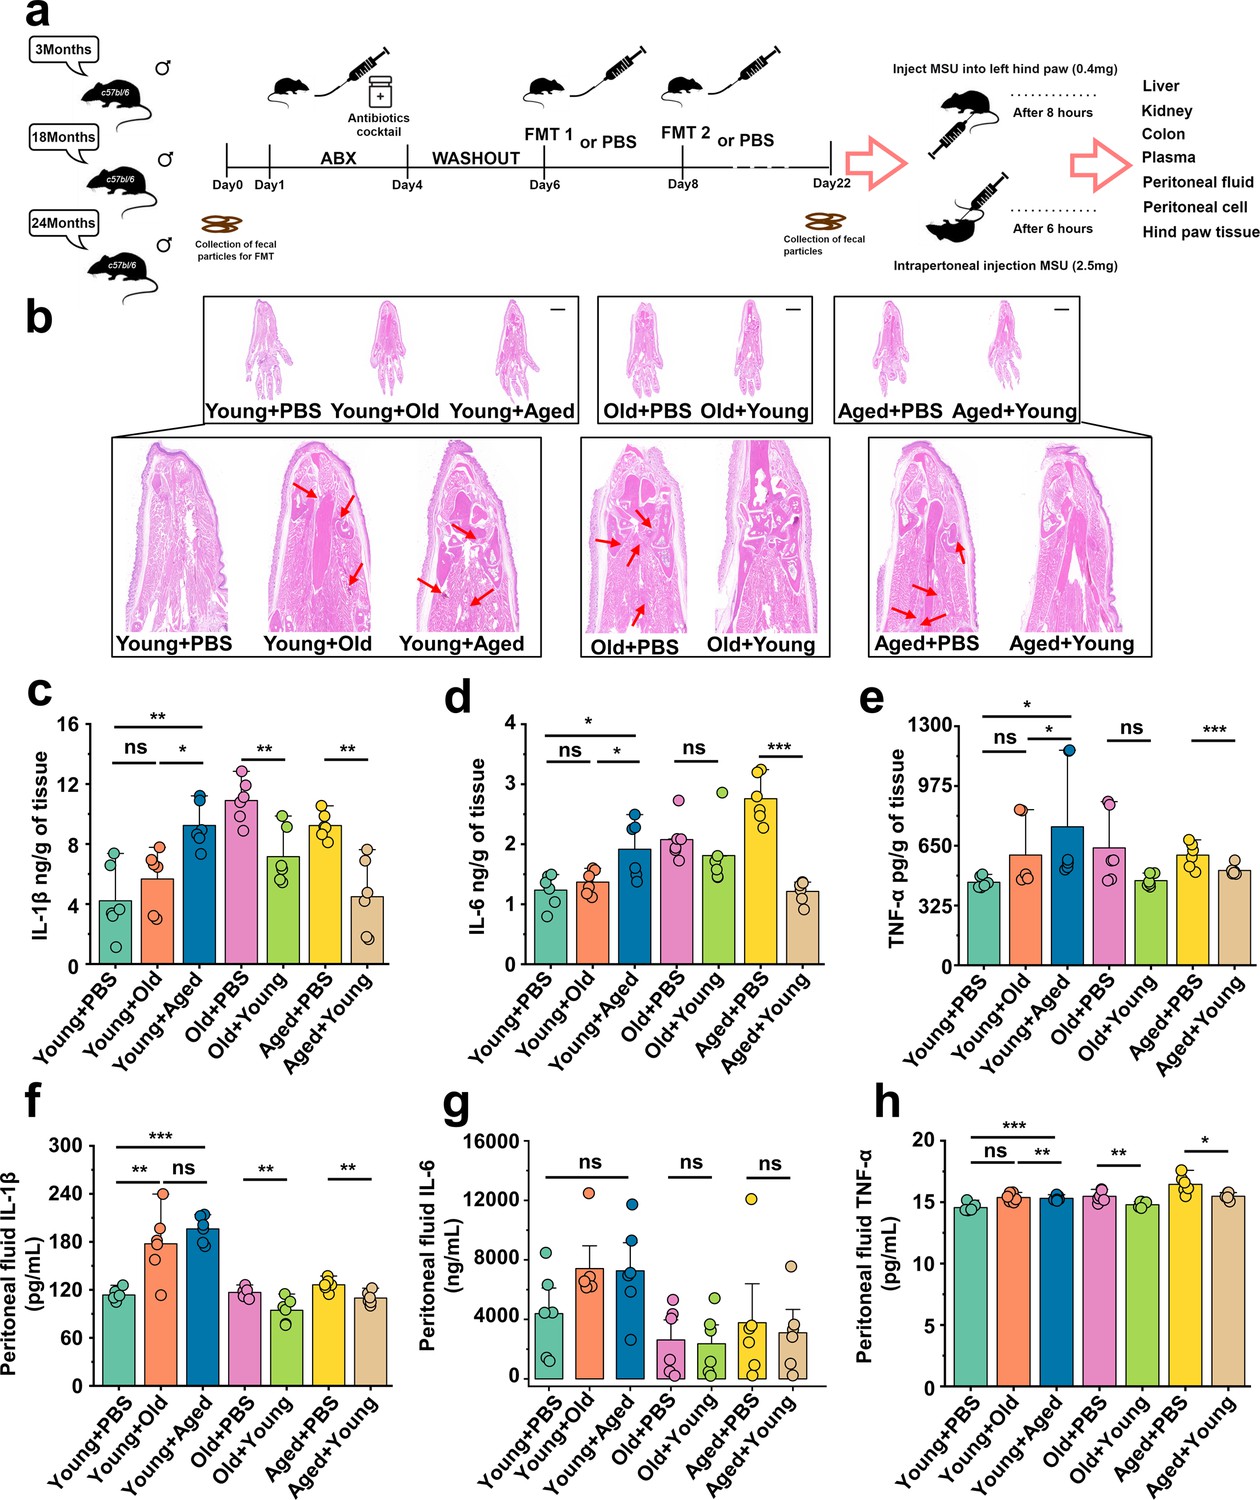
Aged-to-young fecal microbiota transplantation (FMT) worsens acute gout, whereas young-to-aged FMT reduced this disease.
(a) Overall experimental design and timeline for experiments. (b) Representative H&E-stained images of left foot tissues. Scale bars 1000 μm and ×3× magnification. (c–e) Foot tissue inflammatory parameters, including IL-1β (c), IL-6 (d), and TNF-α (e) concentrations, from the indicated mice are shown (n = 6). (f–h) The peritoneal fluid concentrations of IL-1β (f), IL-6 (g), and TNF-α (h) inflammatory parameters were measured in the indicated mice (n = 6). Values are presented as the mean ± SEM. Differences were assessed by t-test or one-way ANOVA and denoted as follows: *p<0.05, **p<0.01, and ***p<0.001, 'ns' indicates no significant difference between groups.
Figure 2—figure supplement 1
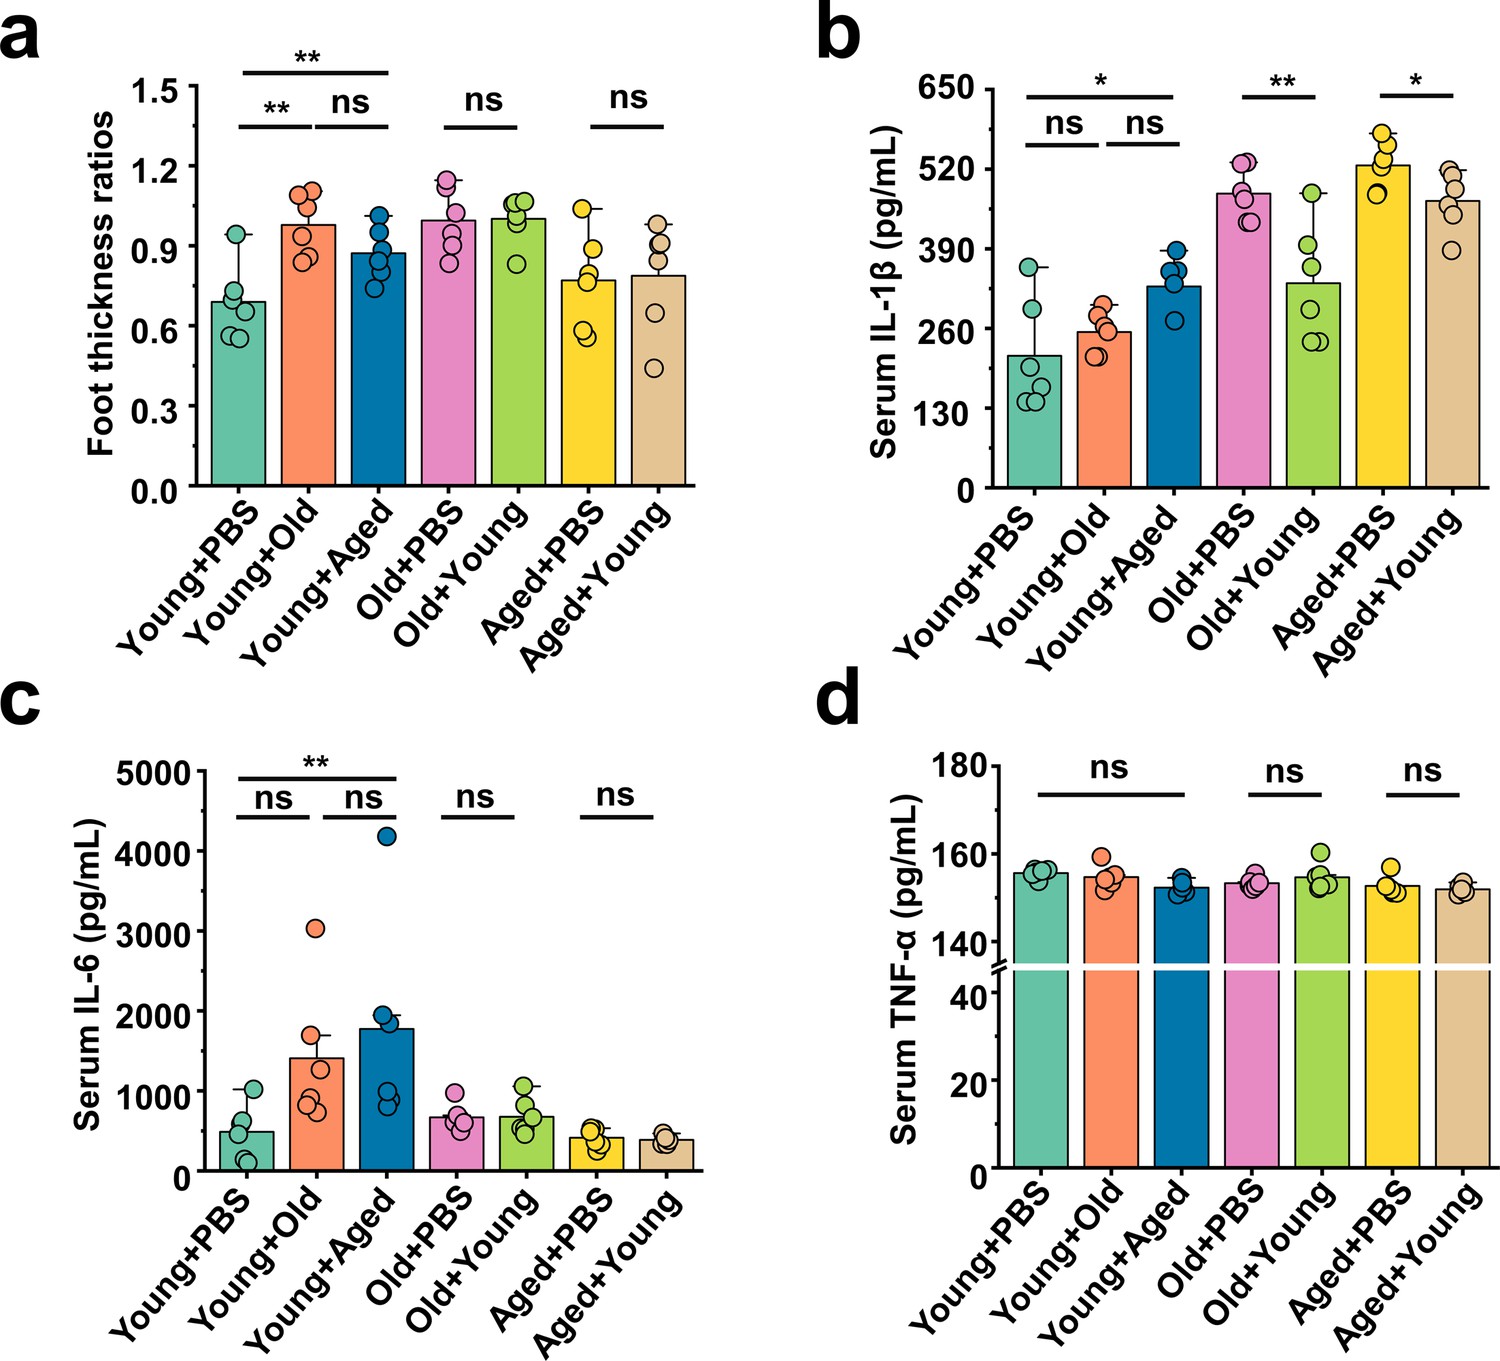
Young-to-aged FMT reduced the production of blood inflammatory factors stimulated by MSU.
(a) All groups’ foot thickness ratios were tested after monosodium urate (MSU) administration (n = 6). (b–d) The serum concentrations of IL-1β (b), IL-6 (c), and TNF-α (d) inflammatory parameters were measured in the indicated mice (n = 6). Values are presented as the mean ± SEM. Differences were assessed by t-test or one-way ANOVA and denoted as follows: *p<0.05, **p<0.01, and ***p<0.001, 'ns' indicates no significant difference between groups.
Figure 3 with 1 supplement
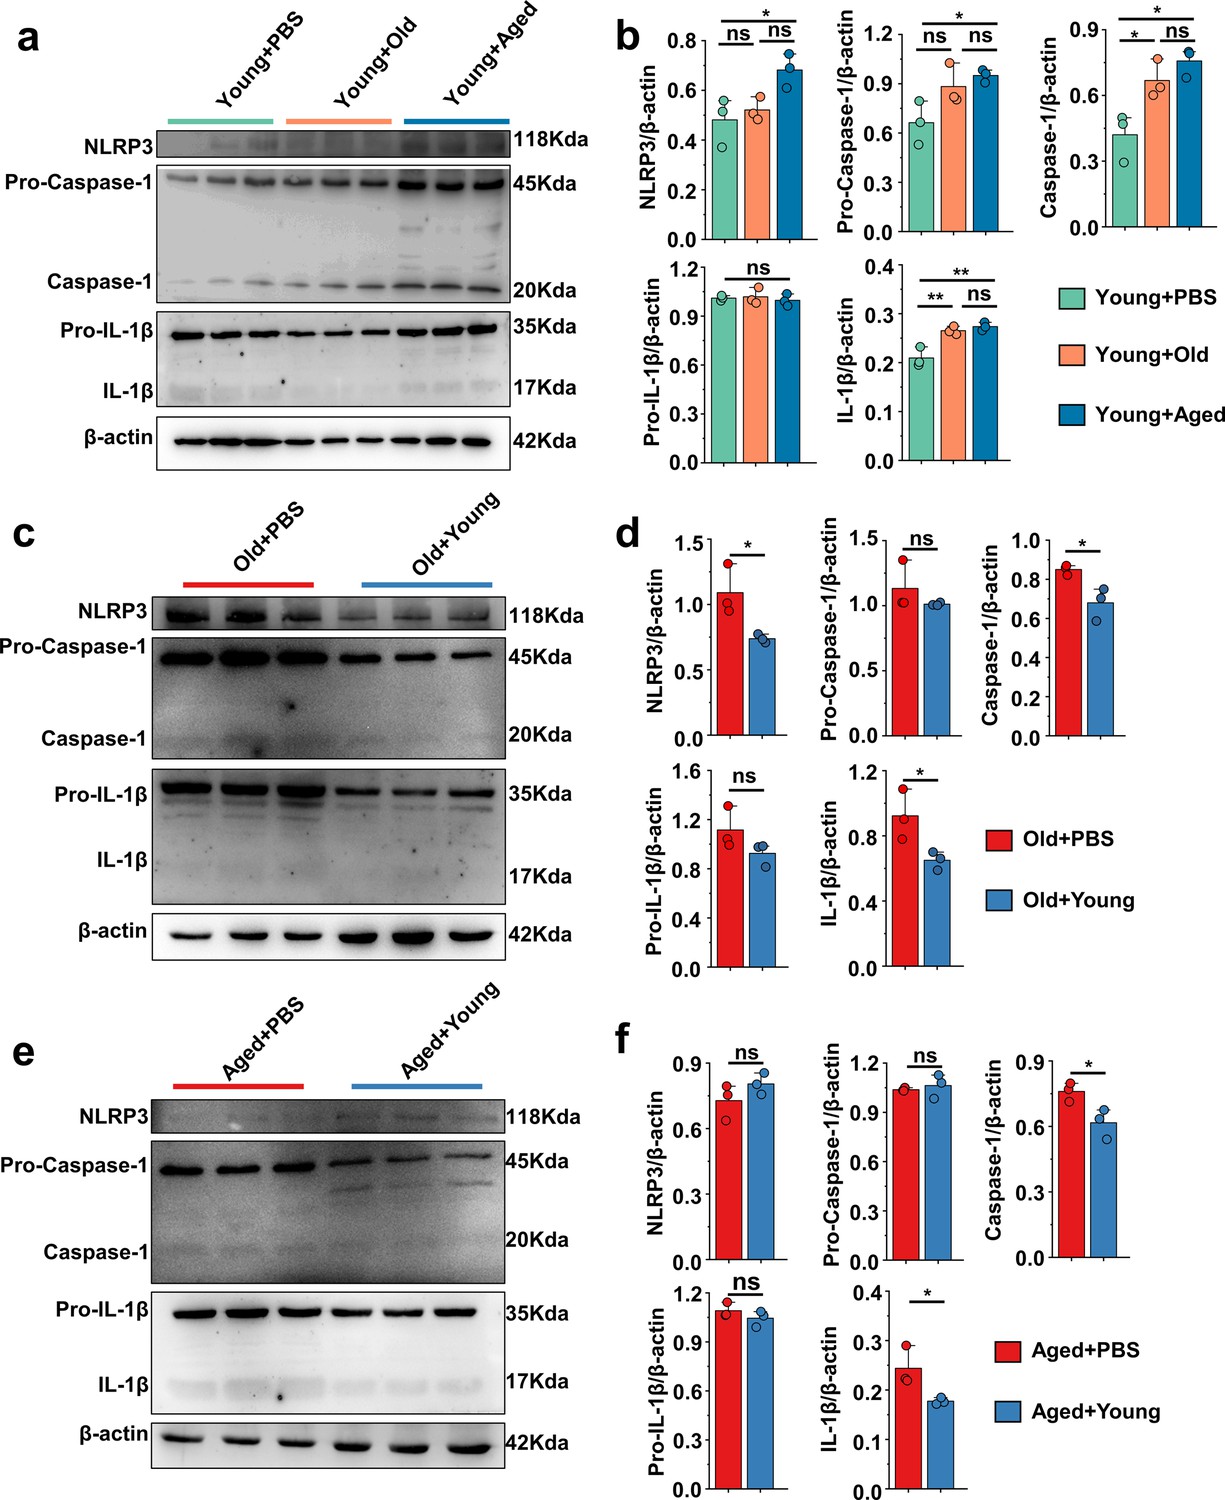
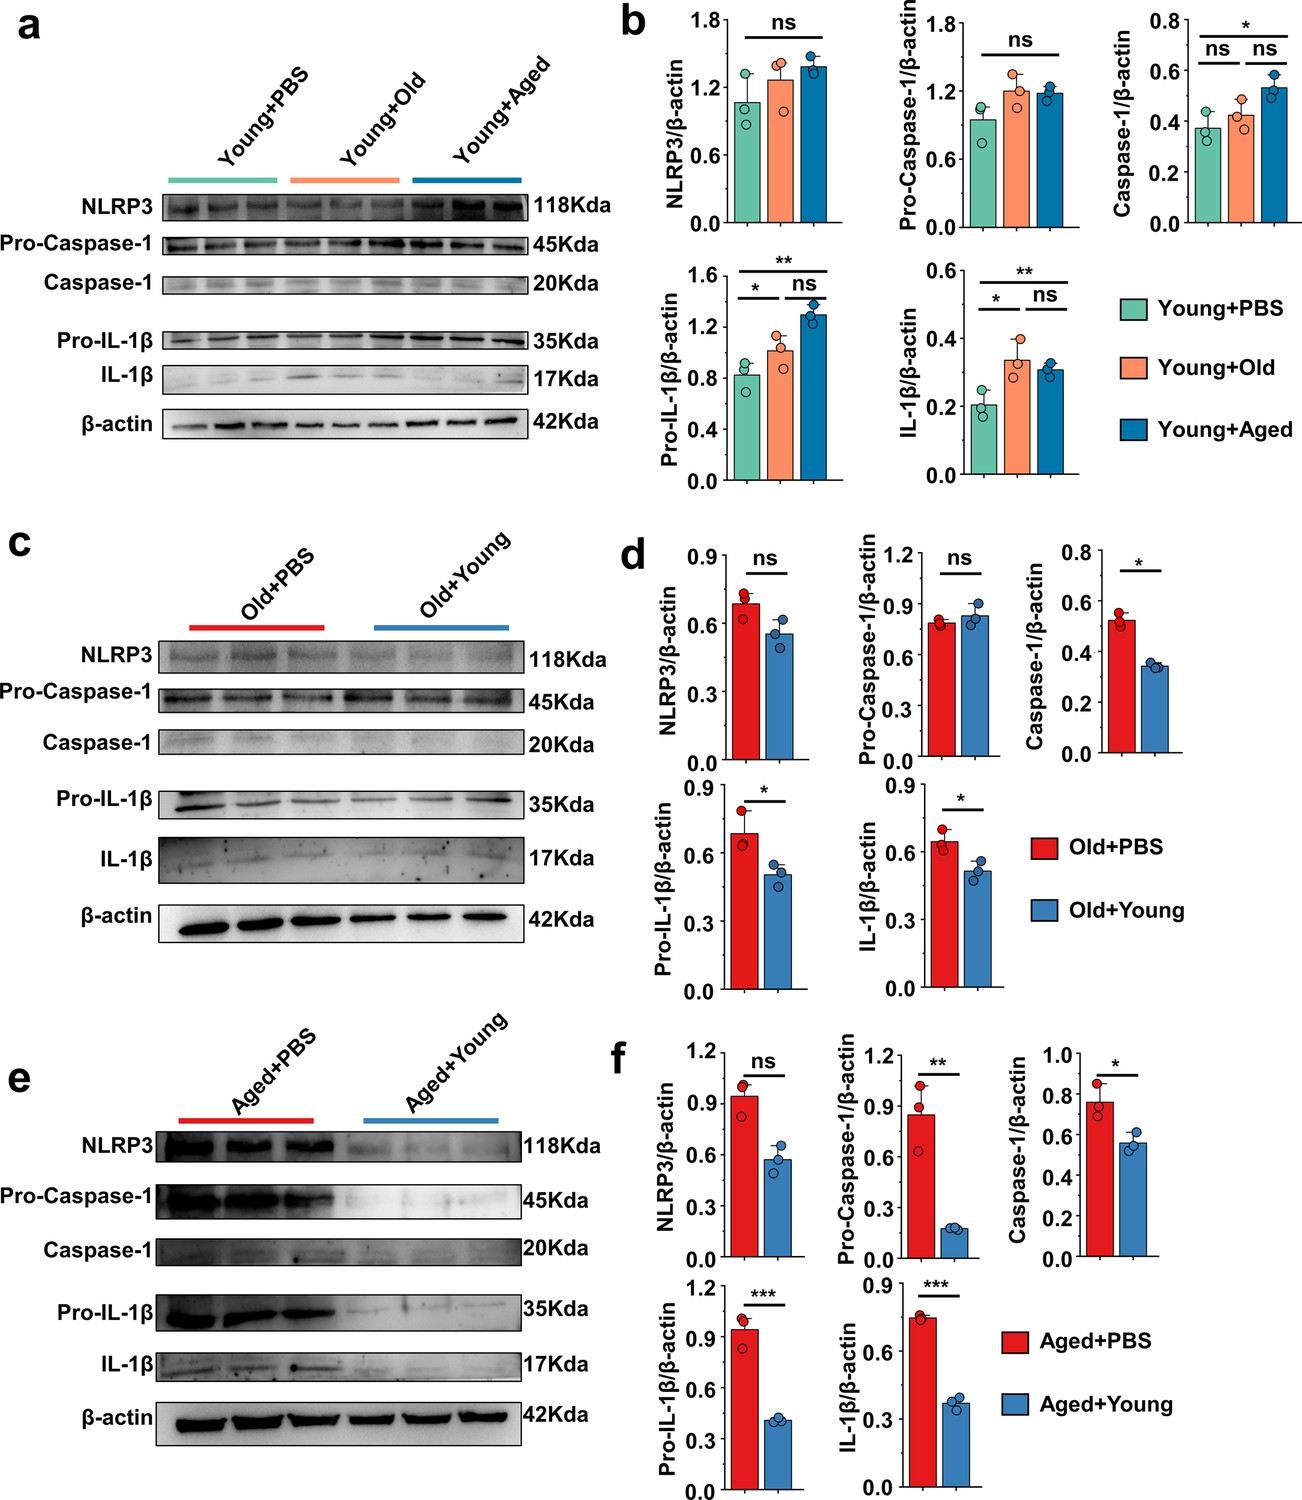
'Younger’ gut microbiota suppresses NLRP3 inflammasome pathway, ‘aging’ gut microbiota promotes.
(a, b) Representative western blot images and band density (Young + PBS, Young + Old, and Young + Aged) of foot tissue NLRP3 pathways proteins (n = 3). (c, d) Representative western blot images and band density (Old + PBS and Old +Young) of foot tissue NLRP3 pathways proteins (n = 3). (e, f) Representative western blot images and band density (Aged + PBS and Aged + Young) of foot tissue NLRP3 pathways proteins (n = 3). Values are presented as the mean ± SEM. Differences were assessed by t-test or one-way ANOVA and denoted as follows: *p<0.05, **p<0.01, and ***p<0.001, 'ns' indicates no significant difference between groups.
-
Figure 3—source data 1
Original Western blot image of the NLRP3 inflammasome pathway in foot tissue.
- https://cdn.elifesciences.org/articles/98714/elife-98714-fig3-data1-v1.pdf
-
Figure 3—source data 2
Original Western blot image of the NLRP3 inflammasome pathway in foot tissue.
- https://cdn.elifesciences.org/articles/98714/elife-98714-fig3-data2-v1.zip
Figure 3—figure supplement 1
Young gut microbiota suppresses the NLRP3 inflammasome pathway in peritoneal cells, whereas aging gut microbiota activates it.
(a, b) Representative western blot images and band density (Young+ PBS, Young + Old, and Young + Aged) of peritoneal cells NLRP3 pathways proteins (n = 3). (c, d) Representative western blot images and band density (Old + PBS and Old + Young) of peritoneal cells NLRP3 pathways proteins (n = 3). (e, f) Representative western blot images and band density (Aged + PBS and Aged + Young) of peritoneal cells NLRP3 pathways proteins (n = 3). Values are presented as the mean ± SEM. Differences were assessed by t-test or one-way ANOVA and denoted as follows: *p<0.05, **p<0.01, and ***p<0.001, 'ns' indicates no significant difference between groups.
-
Figure 3—figure supplement 1—source data 1
Original Western blot image of the NLRP3 inflammasome pathway in peritoneal cells.
- https://cdn.elifesciences.org/articles/98714/elife-98714-fig3-figsupp1-data1-v1.pdf
-
Figure 3—figure supplement 1—source data 2
Original Western blot image of the NLRP3 inflammasome pathway in peritoneal cells.
- https://cdn.elifesciences.org/articles/98714/elife-98714-fig3-figsupp1-data2-v1.zip
Figure 4 with 1 supplement
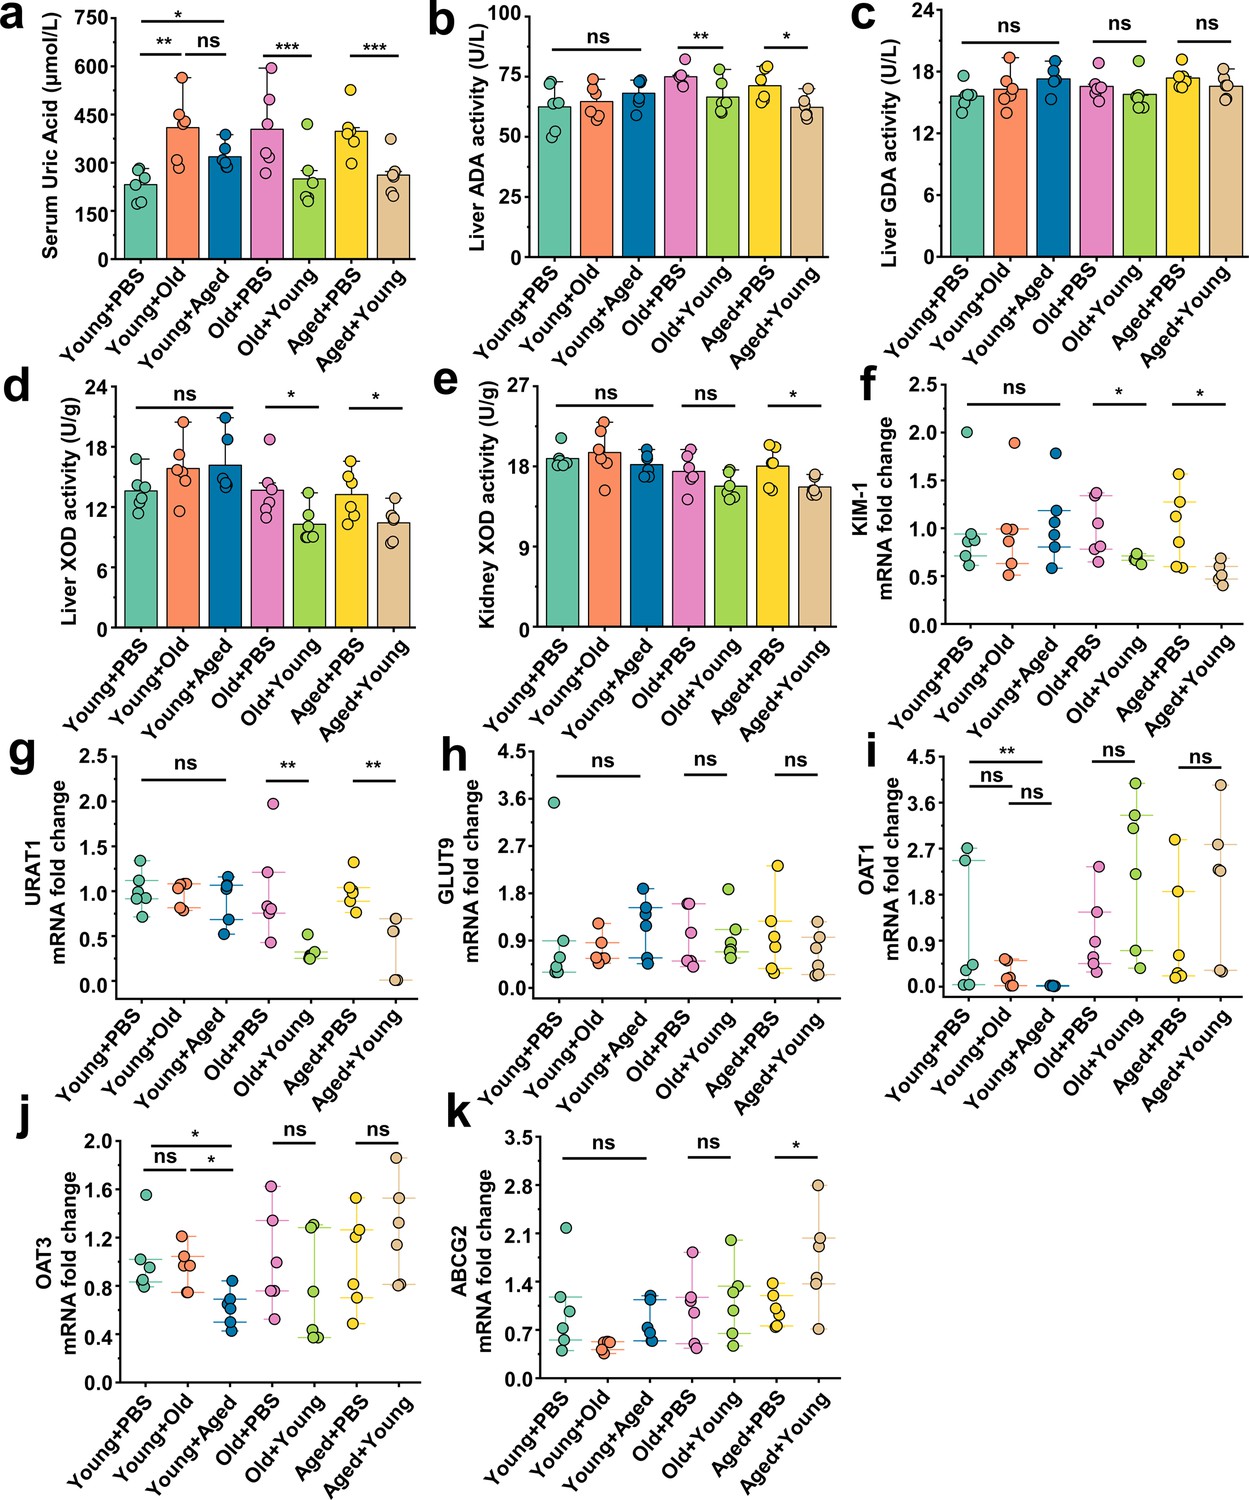
Beneficial effects of fecal microbiota transplantation (FMT) from young to aged mice on uric acid metabolism.
(a) All groups’ serum concentrations of uric acid (n = 6). (b–d) The activity of uric acid-producing enzymes of liver in the cross-age FMT group and its control group (n = 6), including adenosine deaminase (ADA) (b), guanine deaminase (GDA) (c), and xanthine dehydrogenase (XOD) (d). (e) The activity of XOD of kidney in the cross-age FMT group and its control group (n = 6). (f) Relative kidney injury molecule-1 (KIM-1) expression in the indicated groups by qPCR (n = 6). (g, h) Relative renal genes for uric acid reabsorption expression in the indicated groups by qPCR (n = 6), including URAT1 (g) and GLUT9 (h). (i–k) Relative renal genes for uric acid excretion expression in the indicated groups by qPCR (n = 6), including OAT1 (i), OAT3 (j), and ABCG2 (k). Values are presented as the mean ± SEM. Differences were assessed by t-test or one-way ANOVA and denoted as follows: *p<0.05, **p<0.01, and ***p<0.001, 'ns' indicates no significant difference between groups.
Figure 4—figure supplement 1
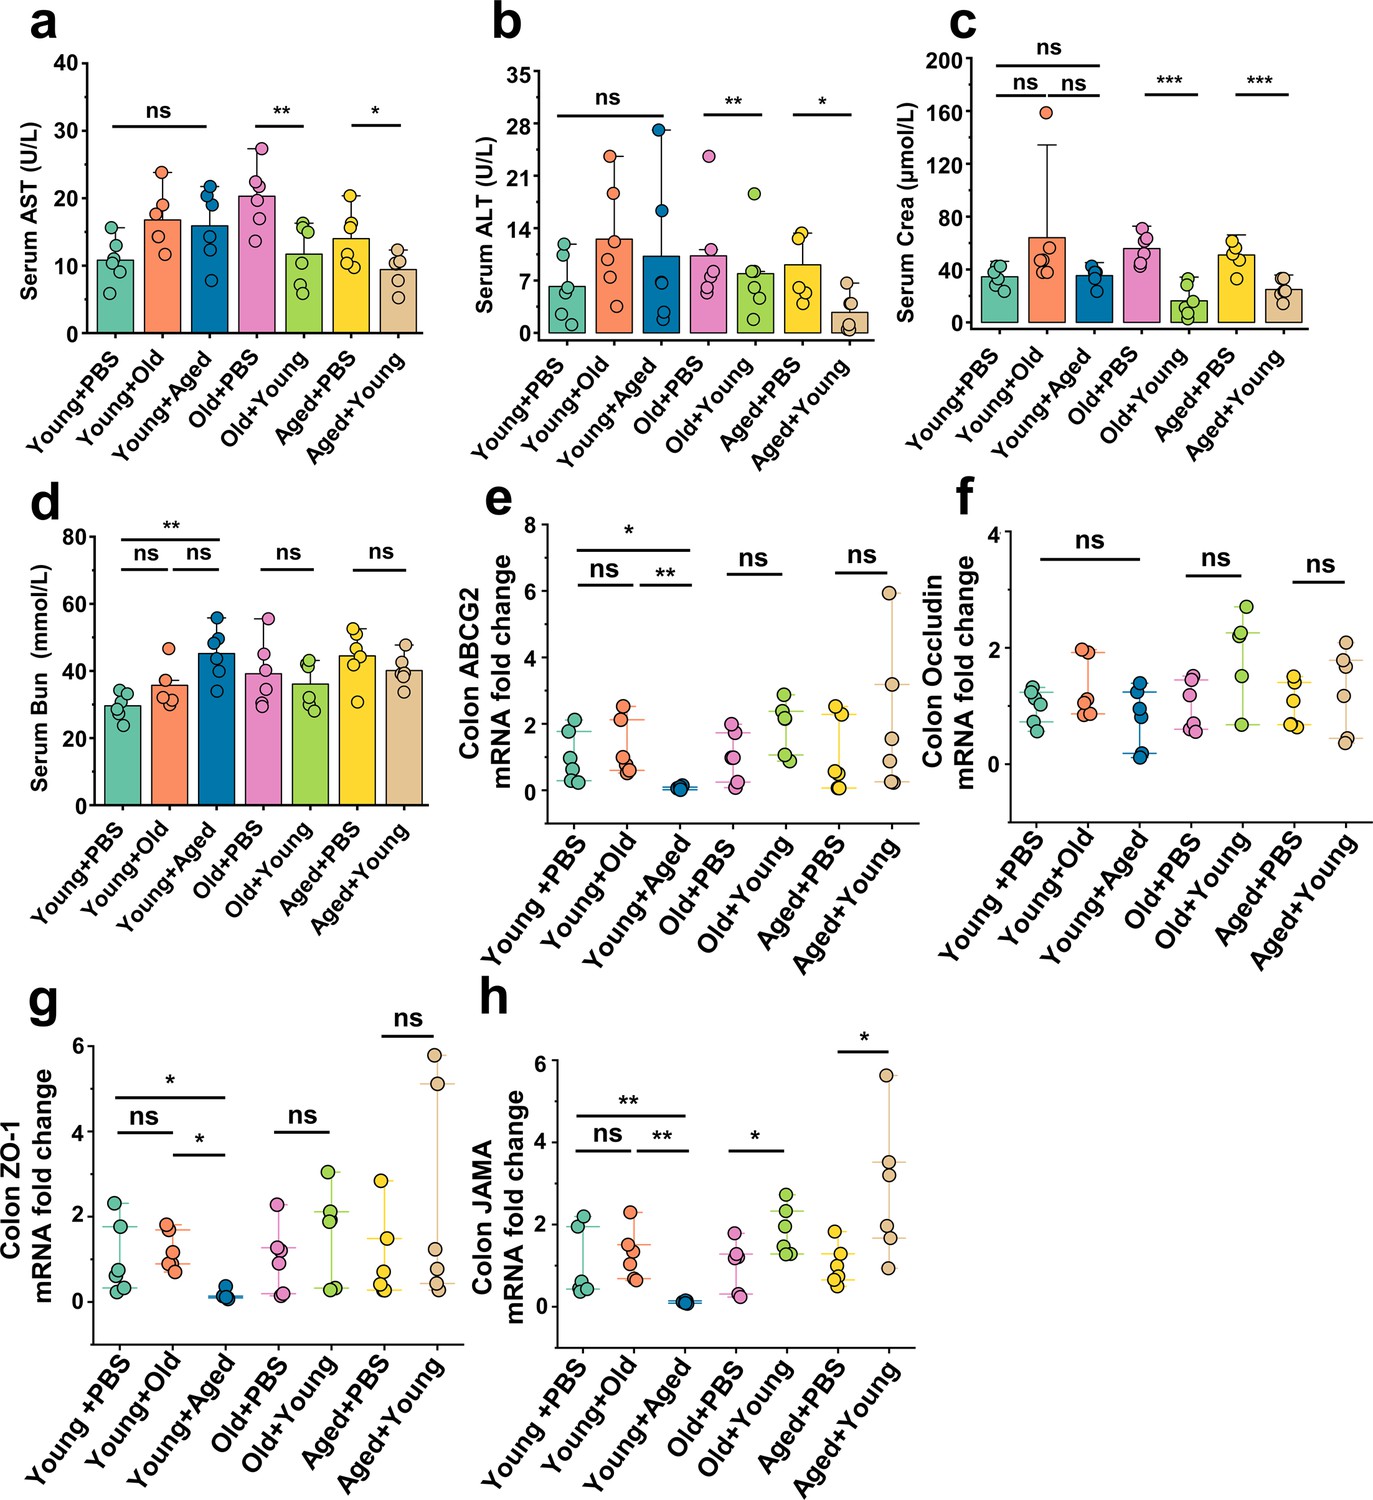
Young gut microbiota improves hepatic, renal, and intestinal functions in aged mice.
(a, b) Serum aspartate aminotransferase (AST) (a) and alanine aminotransferase (ALT) (b) concentrations in the cross-age fecal microbiota transplantation group and its control group (n = 6). (c, d) Serum Crea (c) and BUN (d) concentrations in the cross-age fecal microbiota transplantation group and its control group (n = 6). (e–h) Relative colonic gene expression in the indicated groups by qPCR (n = 6), including ABCG2 (e), Occludin (f), ZO-1 (g), and JAMA (h). Values are presented as the mean ± SEM. Differences were assessed by t-test or one-way ANOVA and denoted as follows: *p<0.05, **p<0.01, and ***p<0.001, 'ns' indicates no significant difference between groups.
Figure 5 with 1 supplement
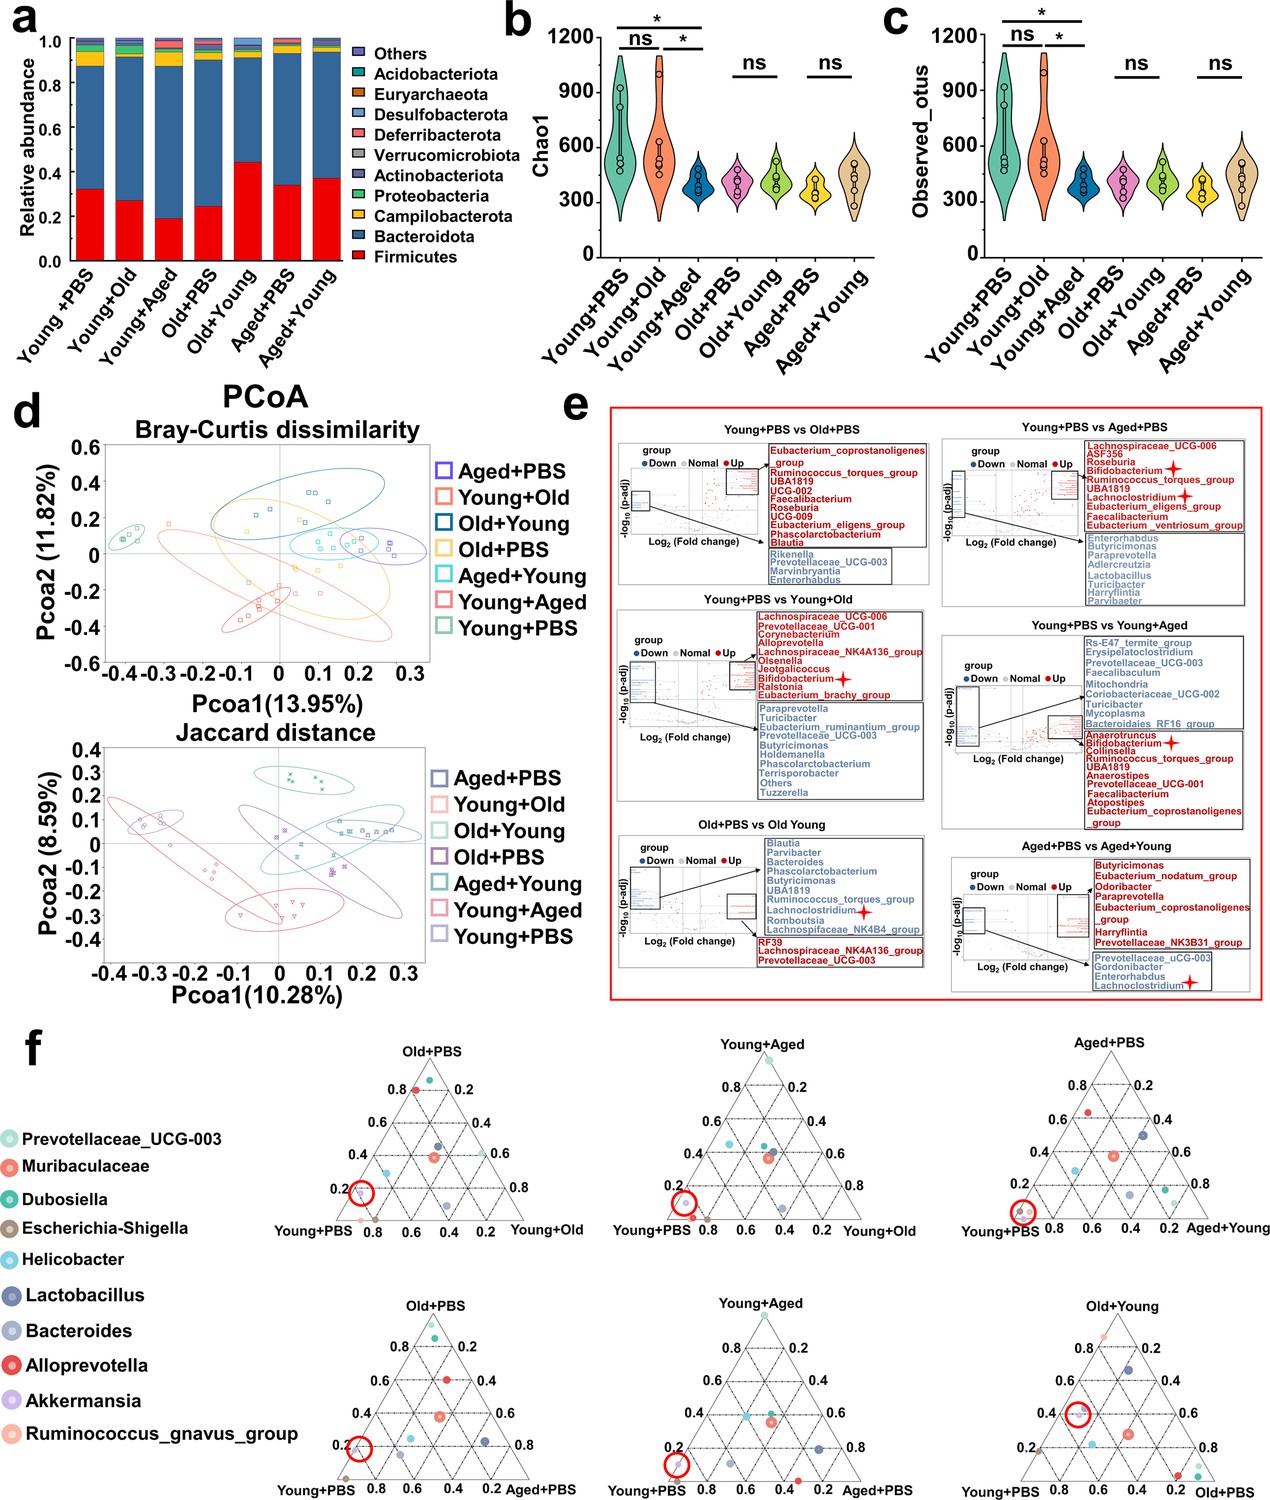
Modifications in the gut microbiota composition following cross-age fecal microbiota transplantation (FMT).
(a) Bacterial composition at the phylum levels (top 10) of the indicated groups (n = 6). (b, c) Alpha diversity indices including Chao1 (b) and observed_otus (c) index in the indicated groups (n = 6). (d) β-diversity difference among the seven groups analyzed by the principal coordinates analysis (PCoA) using Bray–Curtis dissimilarity and Jaccard distance. (e) Volcano plot of inter-group significance analysis using metastat (t-test, p<0.05). (f) The ternary plot of three different groups among the seven groups at genus levels (top 10).
Figure 5—figure supplement 1
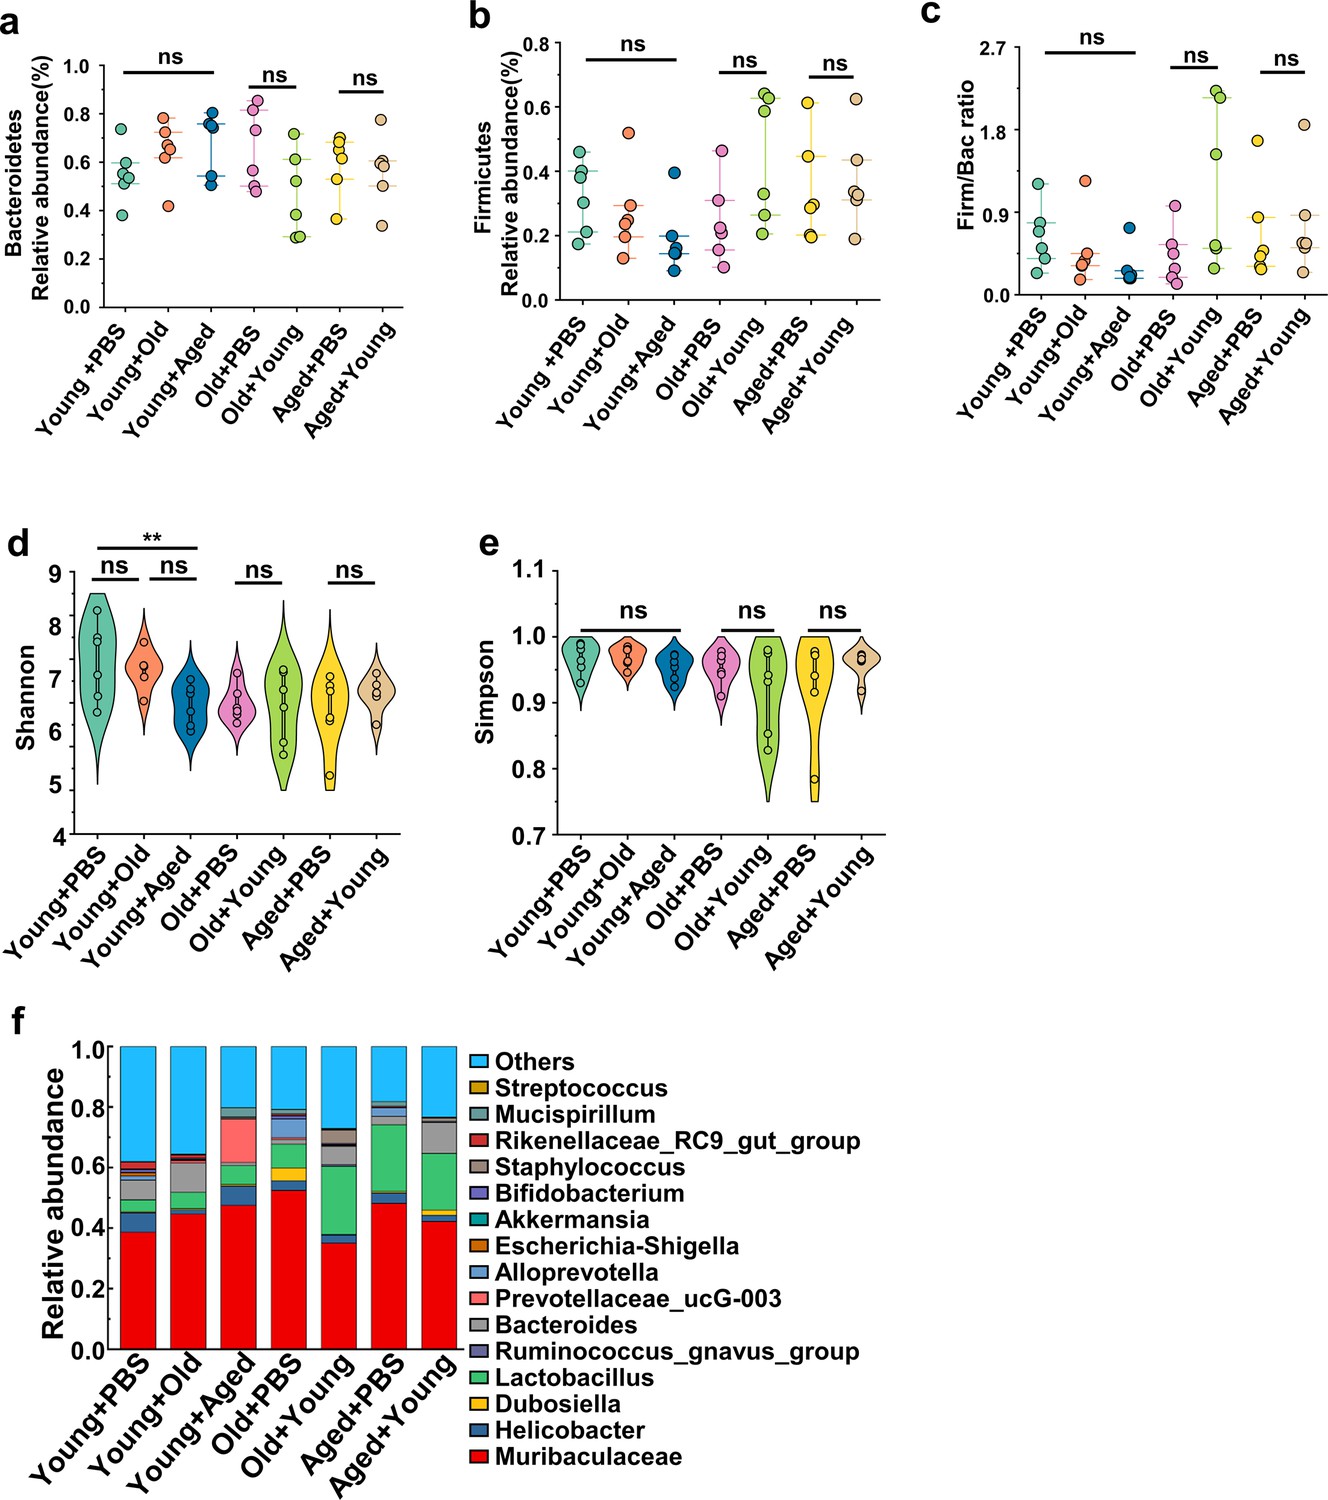
Cross-age fecal microbiota transplantation (FMT) dynamically alters gut microbiota architecture.
(a) Bacteroidetes relative abundance of the indicated groups (n = 6). (b) Firmicutes relative abundance of the indicated groups (n = 6). (c) The Firm/Bac ratio in the different groups (n = 6). (d, e) Alpha diversity indices including Shannon (d) and Simpson (e) index in the indicated groups (n = 6). (f) Bacterial composition at the genus levels (top 15) of the indicated groups (n = 6). Values are presented as the mean ± SEM. Differences were assessed by t-test or one-way ANOVA and denoted as follows: *p<0.05, **p<0.01, and ***p<0.001, 'ns' indicates no significant difference between groups.
Figure 6 with 2 supplements
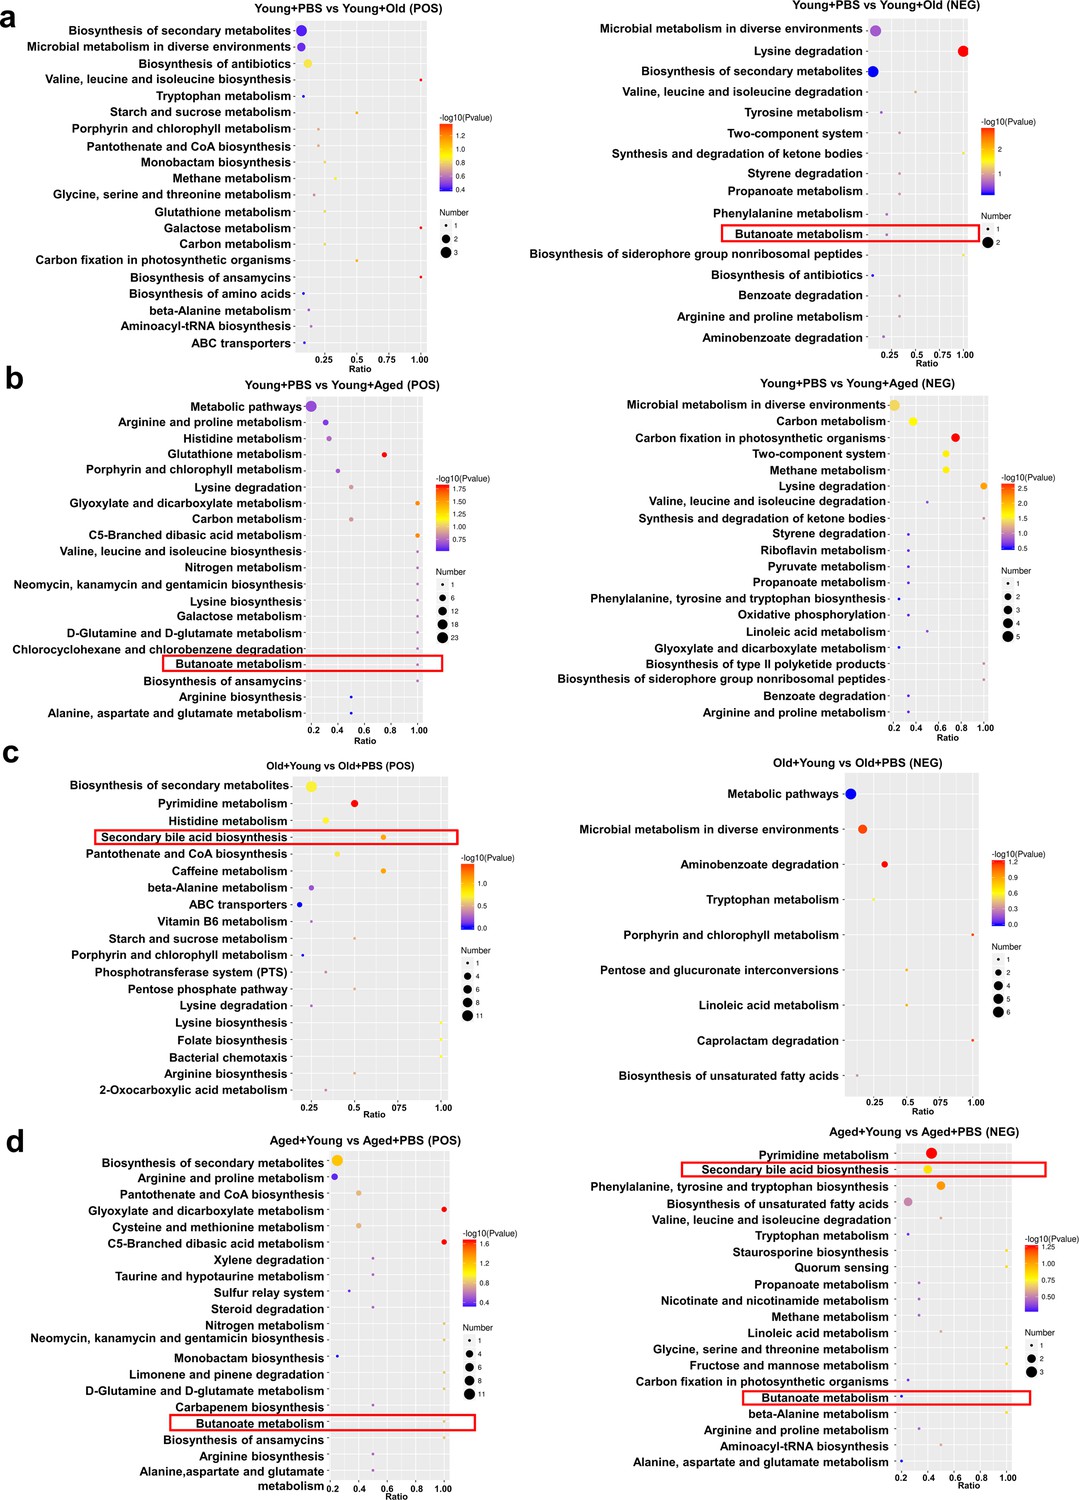
Changes in fecal microbiota metabolism and pathways after cross-age fecal microbiota transplantation (FMT).
(a) Comparison of differential KEGG enrichment bubble plots between Young + PBS and Young + Old. (b) Comparison of differential KEGG enrichment bubble plots between Young + PBS and Young + Aged. (c) Comparison of differential KEGG enrichment bubble plots between Old + PBS and Old + Young. (d) Comparison of differential KEGG enrichment bubble plots between Aged + PBS and Aged + Young. The enrichment analysis was performed at the KEGG pathway level using a hypergeometric test, as shown in the figure below. The pathways that were significantly enriched in the differential metabolites compared to the background of all identified metabolites. Pathway enrichment analysis enables us to determine the major biochemical metabolic pathways and signaling transduction pathways that are implicated by the differential metabolites.
Figure 6—figure supplement 1
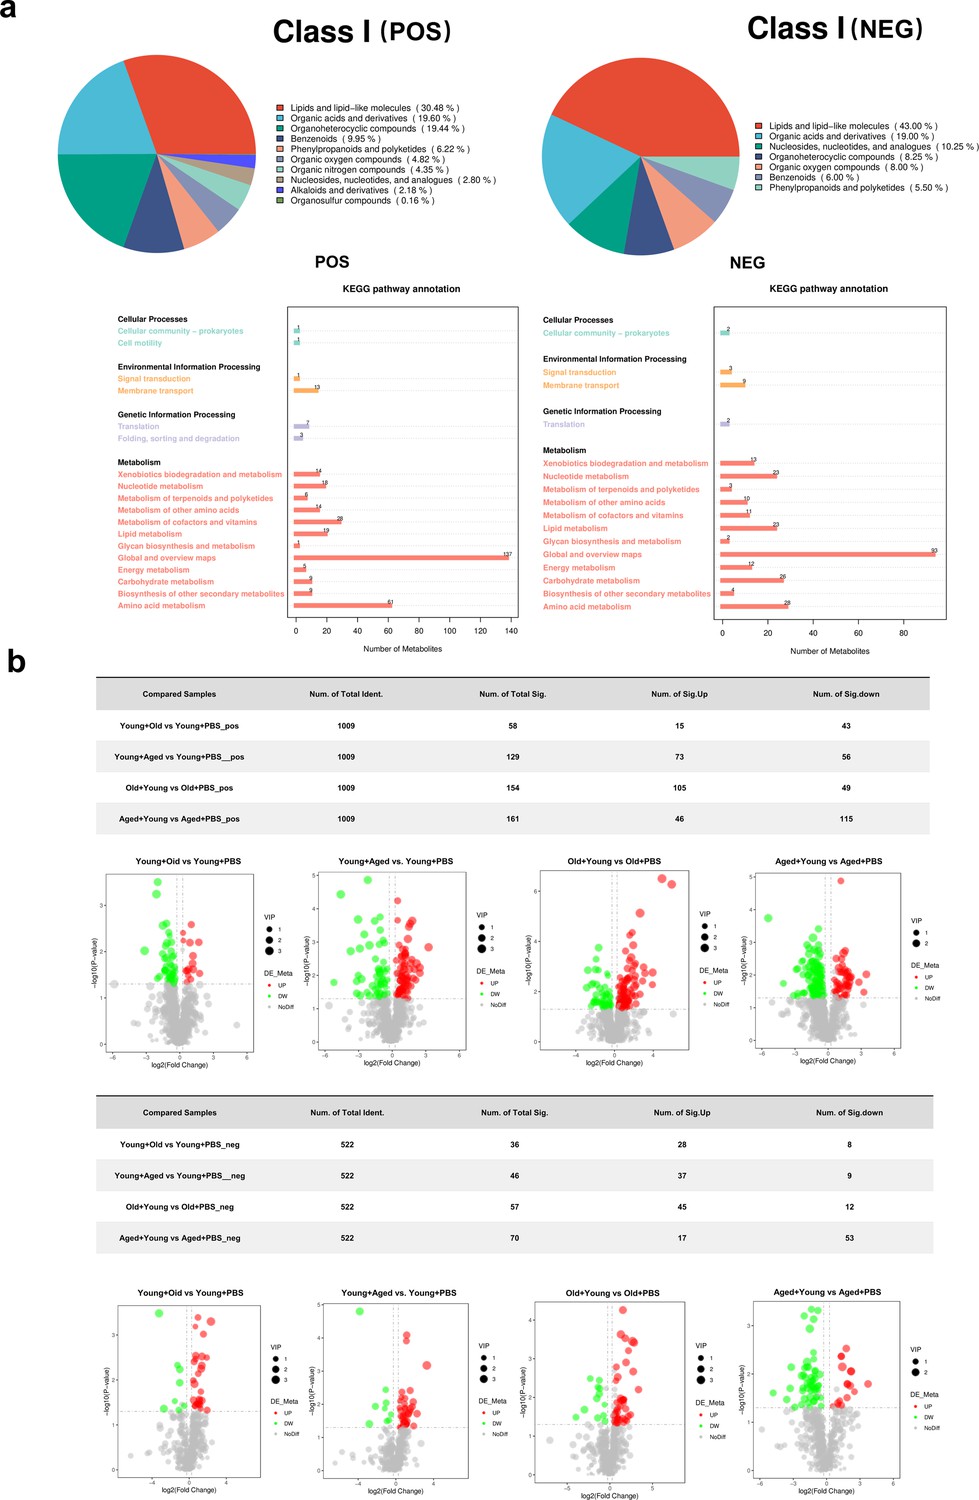
Metabolite classification and differential metabolites in each group.
(a) Metabolite classification of various groups. (b) Volcano plots of differential metabolites in each group. The horizontal axis of volcano plot represents the log2 (Fold Change) in metabolite abundance between different groups, while the vertical axis of volcano plot represents the significance level (-log10 (p-value)) of the differences. Each point on the volcano plot represents a metabolite, with significantly upregulated metabolites depicted as red points and significantly downregulated metabolites depicted as green points. The size of the circles corresponds to the variable importance in projection (VIP) value.
Figure 6—figure supplement 2

Comparison of KEGG enrichment bubble plots between different age groups.
(a) Comparison of KEGG enrichment bubble plots between Young + PBS and Old + PBS. (b) Comparison of KEGG enrichment bubble plots between Young + PBS and Aged + PBS. To visualize the differential metabolites resulting from pairwise comparisons, we generated volcano plots that provide a clear representation of the upregulation and downregulation of metabolites, especially those with significant fold change differences. The enrichment analysis was performed at the KEGG pathway level using a hypergeometric test, as shown in the figure below. The pathways that were significantly enriched in the differential metabolites compared to the background of all identified metabolites. Pathway enrichment analysis enables us to determine the major biochemical metabolic pathways and signaling transduction pathways that are implicated by the differential metabolites.
Figure 7 with 1 supplement
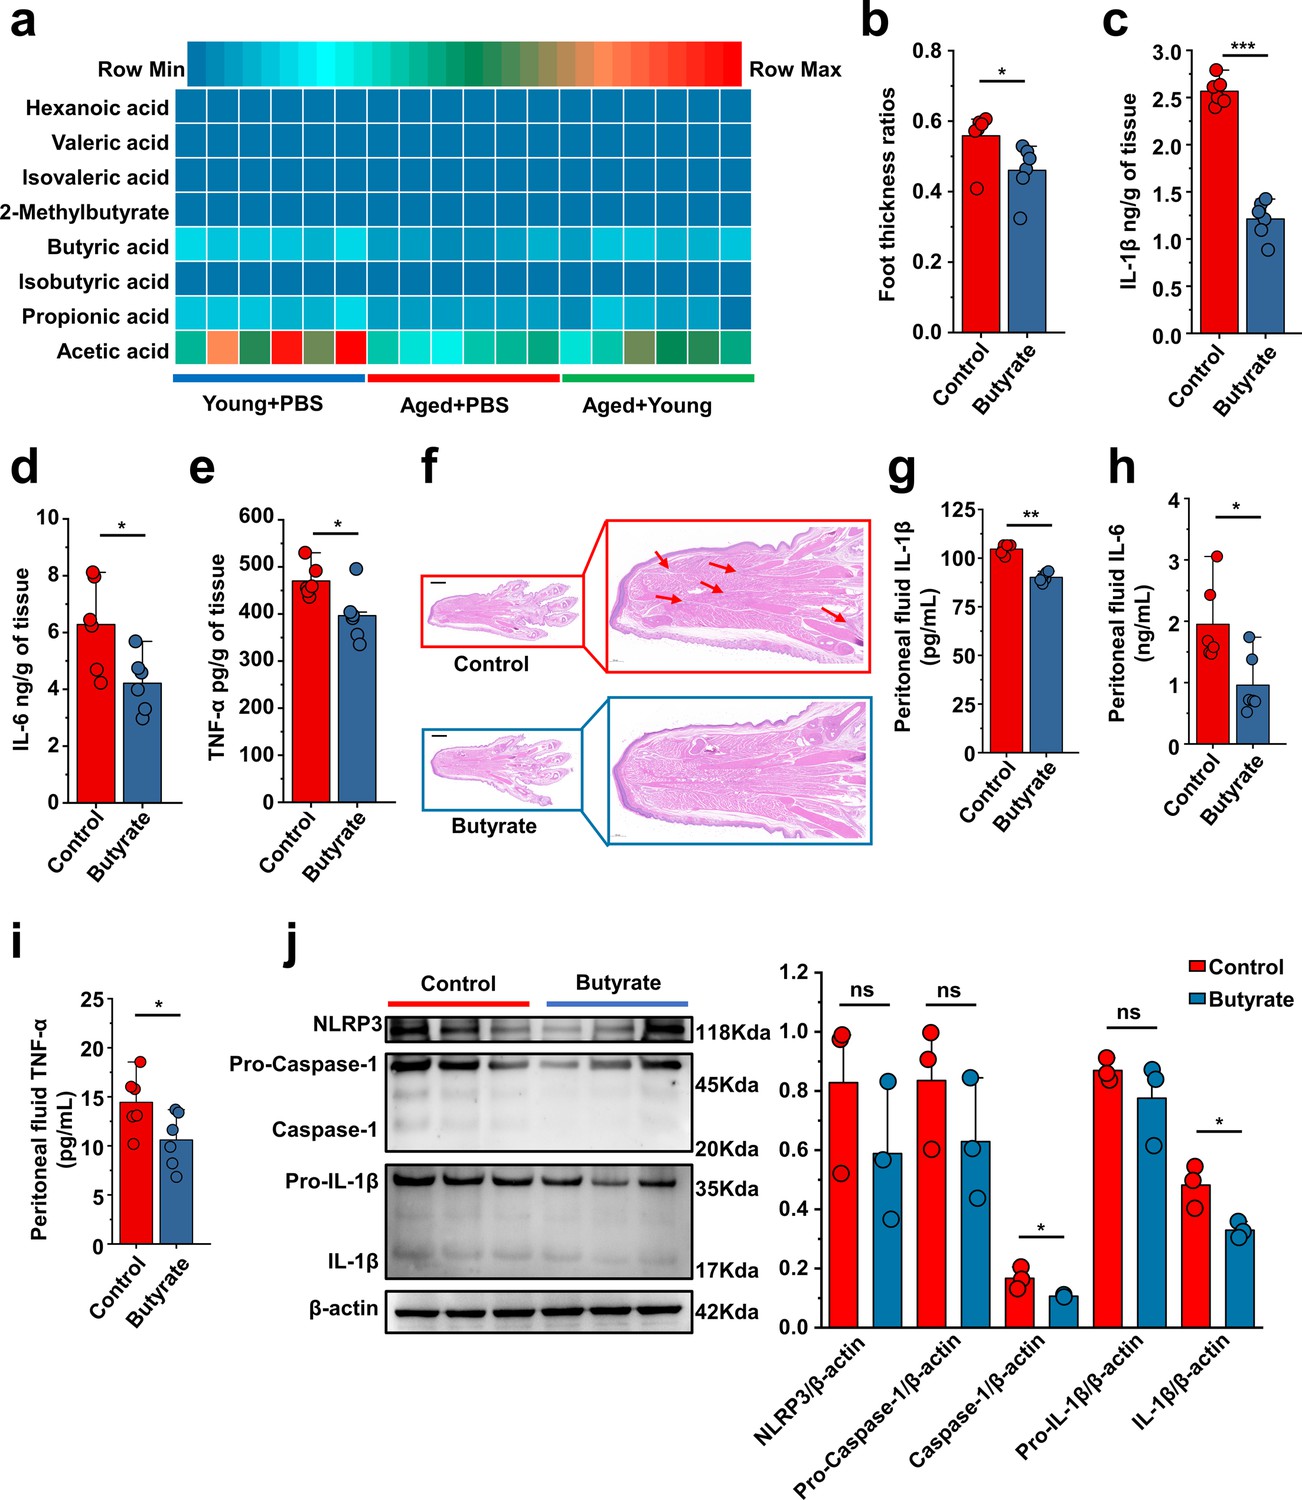
Butyrate supplementation inhibits gout and monosodium urate (MSU)-induced peritonitis.
(a) The concentration of primary short-chain fatty acids (SCFAs) in fecal samples from both young (3 months), aged (24 months) mice, and Aged + Young (fecal microbiota transplantation [FMT] from young to aged). Graphs were generated to illustrate the changes in individual SCFAs, with a sample size of 6 in the Young + PBS, Aged + PBS, and Aged + Young group (n = 6). (b–e) The foot thickness ratios (b) were tested after MSU administration, foot tissue inflammatory parameters, including IL-1β (c), IL-6 (d), and TNF-α (e) concentrations, from the indicated mice are shown (n = 6). (f) Representative H&E-stained images of left foot tissues. Scale bars 1000 μm and ×3 magnification. (g–i) The peritoneal fluid concentrations of IL-1β (g), IL-6 (h), and TNF-α (i) inflammatory parameters were measured in the indicated mice (n = 6). (j) Representative western blot images of foot tissue NLRP3 pathways proteins and band density (n = 3). Values are presented as the mean ± SEM. Differences were assessed by t-test or one-way ANOVA and denoted as follows: *p<0.05, **p<0.01, and ***p<0.001, 'ns' indicates no significant difference between groups.
-
Figure 7—source data 1
Original Western blot image of the NLRP3 inflammasome pathway in foot tissue under butyrate.
- https://cdn.elifesciences.org/articles/98714/elife-98714-fig7-data1-v1.pdf
-
Figure 7—source data 2
Original Western blot image of the NLRP3 inflammasome pathway in foot tissue under butyrate.
- https://cdn.elifesciences.org/articles/98714/elife-98714-fig7-data2-v1.zip
Figure 7—figure supplement 1
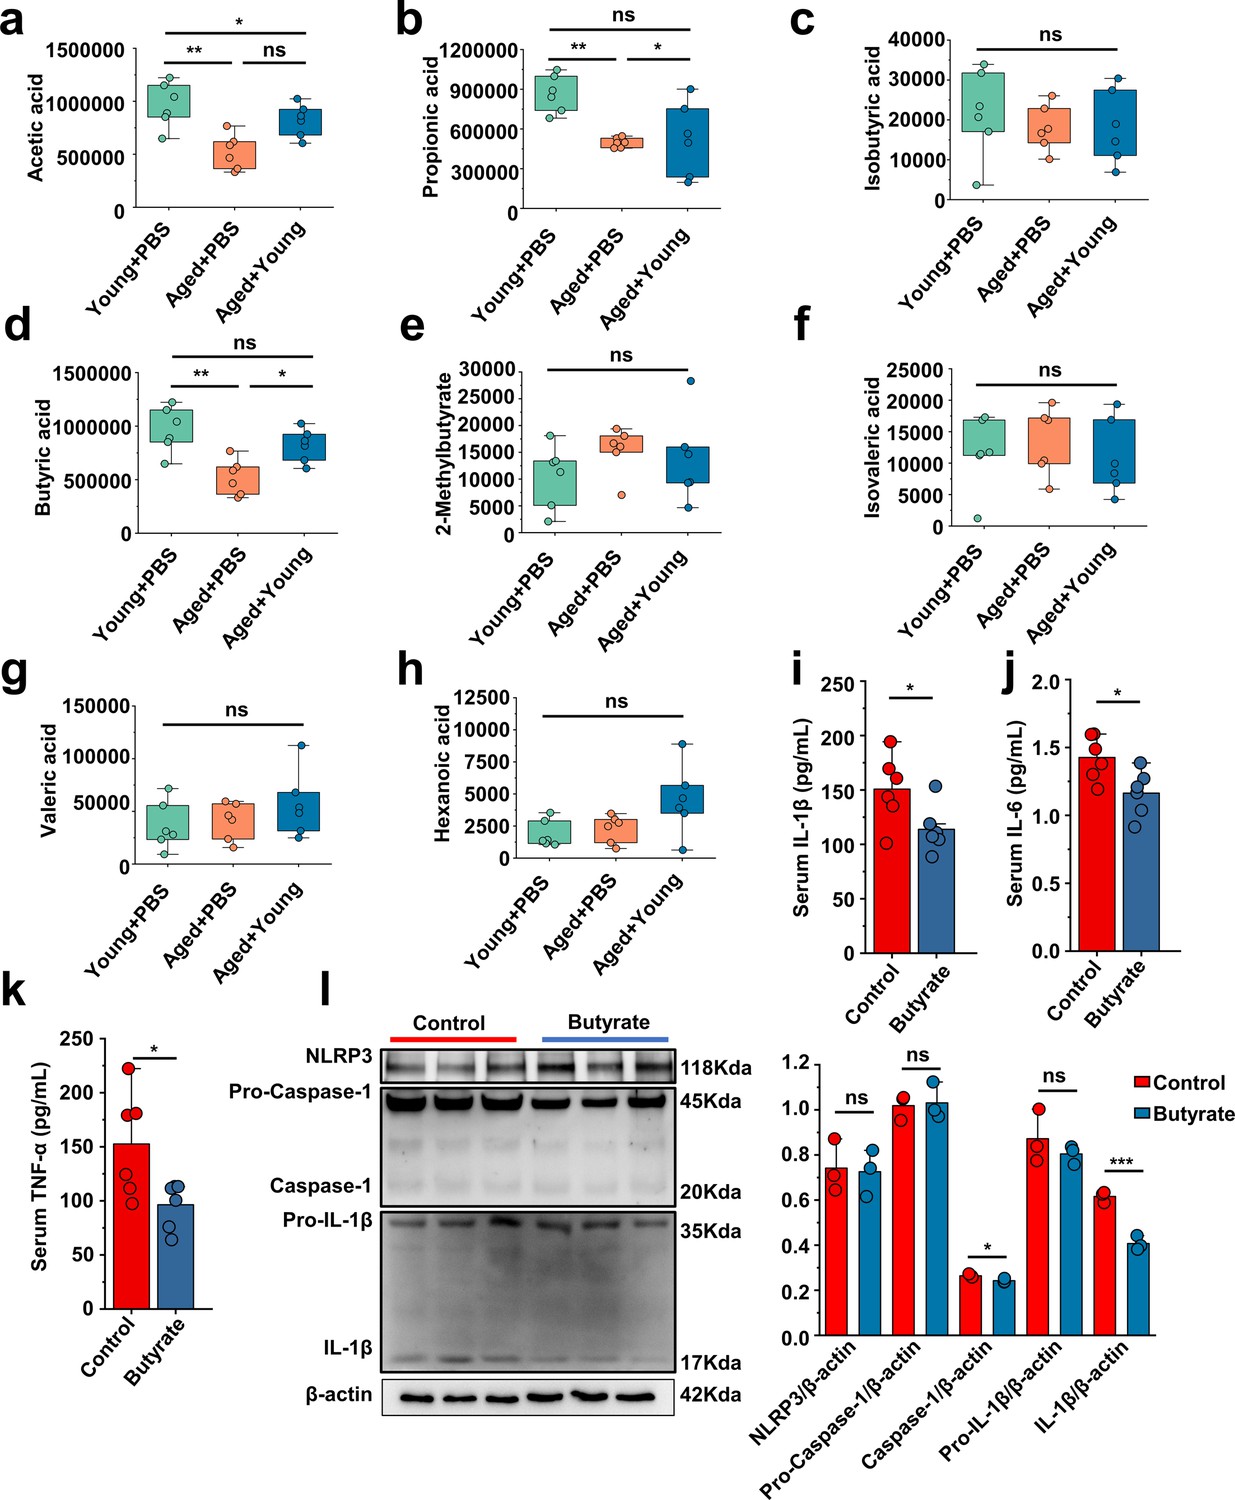
The difference analysis of the detected short-chain fatty acids and the western blot images and band density of peritoneal cells NLRP3 pathways proteins.
(a–h) The difference analysis of the detected short-chain fatty acids, including acetic acid (a), propionic acid (b), isobutyric acid (c), butyric acid (d), 2-merhylbutyrate (e), isovaleric acid (f), valeric acid (g), and hexanoic acid (h). (i–k) The serum concentrations of IL-1β (i), IL-6 (j), and TNF-α (k) inflammatory parameters were measured in the indicated mice (n = 6). (l) Representative western blot images and band density of peritoneal cells NLRP3 pathways proteins (n = 3). Values are presented as the mean ± SEM. Differences were assessed by t-test or one-way ANOVA and denoted as follows: *p<0.05, **p<0.01, and ***p<0.001, 'ns' indicates no significant difference between groups.
-
Figure 7—figure supplement 1—source data 1
Original Western blot image of the NLRP3 inflammasome pathway in peritoneal cells under butyrate.
- https://cdn.elifesciences.org/articles/98714/elife-98714-fig7-figsupp1-data1-v1.pdf
-
Figure 7—figure supplement 1—source data 2
Original Western blot image of the NLRP3 inflammasome pathway in peritoneal cells under butyrate.
- https://cdn.elifesciences.org/articles/98714/elife-98714-fig7-figsupp1-data2-v1.zip
Figure 8 with 1 supplement
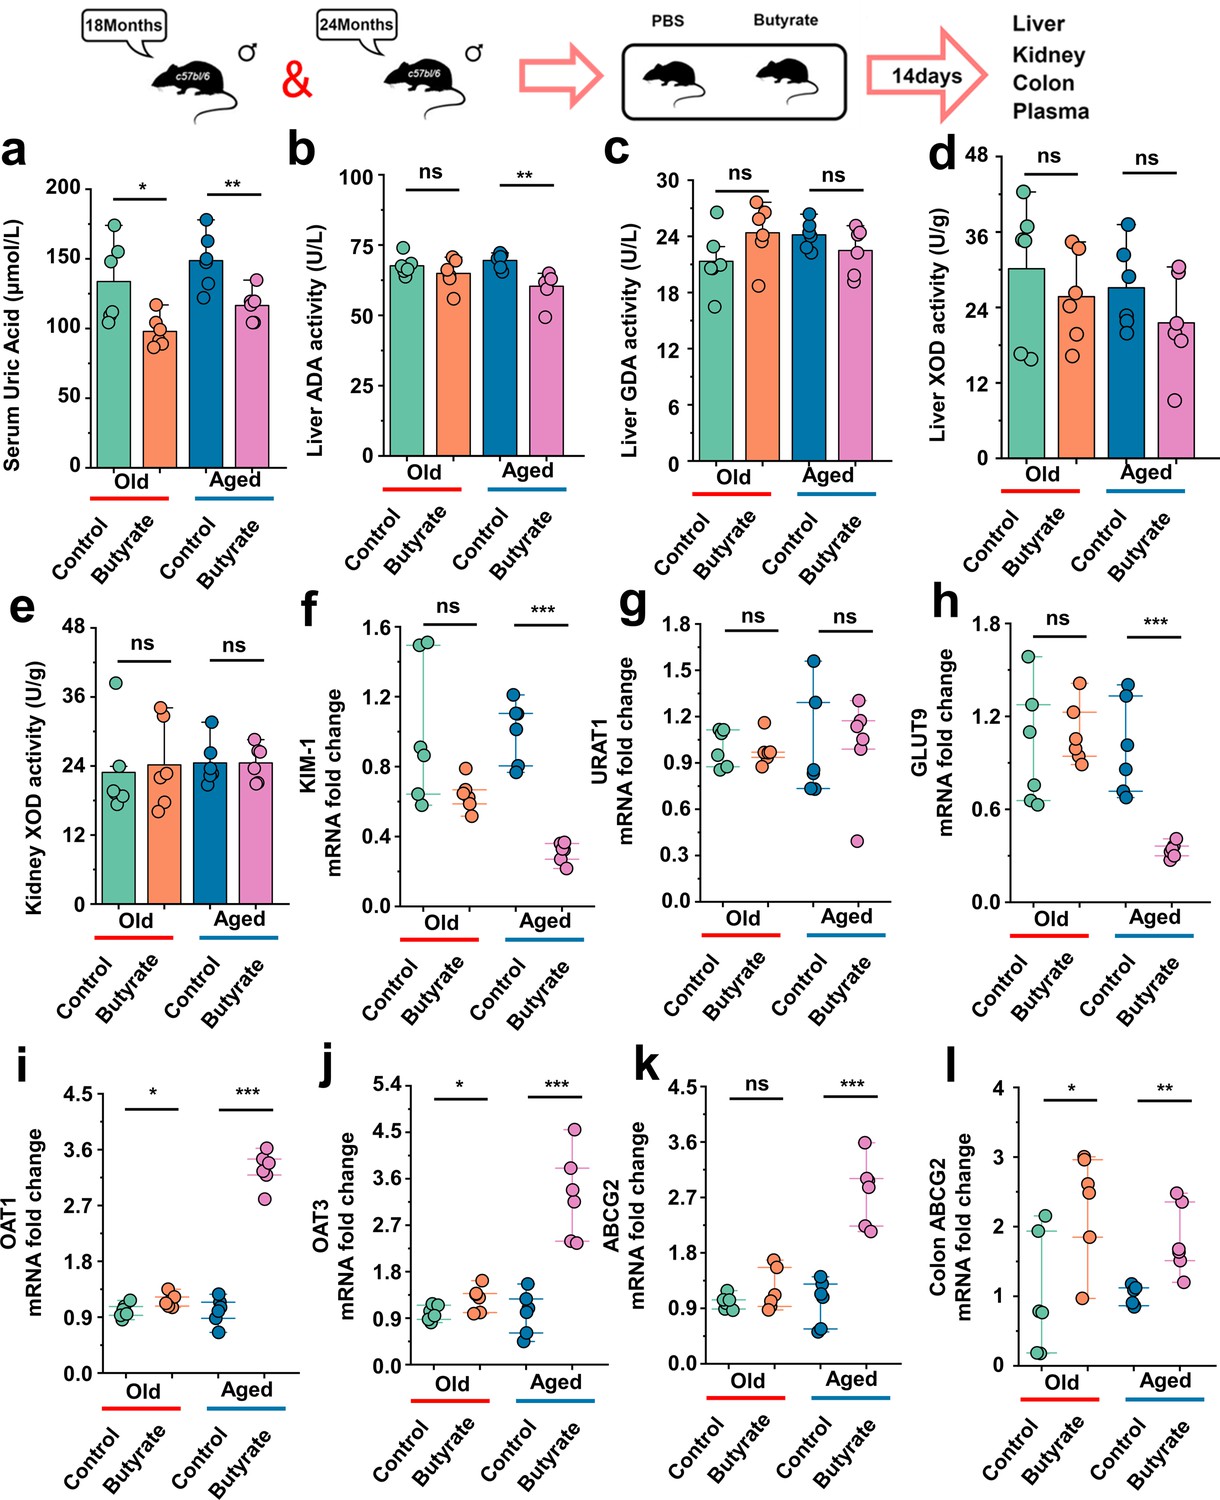
Serum uric acid-lowering effect of butyrate in old or aged mice.
(a) The serum uric acid concentrations in Old + PBS and Old + Butyrate, Aged + PBS, and Aged + Butyrate (n = 6). (b–d) The activity of uric acid-producing enzymes of liver in the Old or Aged control group and the old or aged group supplemented with butyrate (n = 6), including adenosine deaminase (ADA) (b), guanine deaminase (GDA) (c), and xanthine dehydrogenase (XOD) (d). (e) The activity of XOD of kidney in the Old or Aged control group and the old or aged group supplemented with butyrate (n = 6). (f) Relative kidney injury molecule-1 (KIM-1) expression in the indicated groups by qPCR (n = 6). (g, h) Relative renal genes for uric acid reabsorption expression in the indicated groups by qPCR (n = 6), including URAT1 (g) and GLUT9 (h). (i–k) Relative renal genes for uric acid excretion expression in the indicated groups by qPCR (n = 6), including OAT1 (i), OAT3 (j), and ABCG2 (k). (l) Relative colonic genes for uric acid expression in the indicated groups by qPCR, including ABCG2 (n = 6). Values are presented as the mean ± SEM. Differences were assessed by t-test or one-way ANOVA and denoted as follows: *p<0.05, **p<0.01, and ***p<0.001, 'ns' indicates no significant difference between groups.
Figure 8—figure supplement 1

Butyrate exhibits beneficial effects on the colonic of old or aged mice.
(a–c) Relative colonic gene expression in the indicated groups by qPCR (n = 6), including Occludin (a), ZO-1 (b), and JAMA (c). Values are presented as the mean ± SEM. Differences were assessed by t-test or one-way ANOVA and denoted as follows: *p<0.05, **p<0.01, and ***p<0.001, 'ns' indicates no significant difference between groups.
Additional files
-
Supplementary file 1
The specific primers used in this study.
- https://cdn.elifesciences.org/articles/98714/elife-98714-supp1-v1.docx
-
Supplementary file 2
Enhancement of butanoate metabolism contributes to the prevention of elderly gout.
- https://cdn.elifesciences.org/articles/98714/elife-98714-supp2-v1.docx
-
MDAR checklist
- https://cdn.elifesciences.org/articles/98714/elife-98714-mdarchecklist1-v1.docx
Download links
A two-part list of links to download the article, or parts of the article, in various formats.
Downloads (link to download the article as PDF)
Open citations (links to open the citations from this article in various online reference manager services)
Cite this article (links to download the citations from this article in formats compatible with various reference manager tools)
Microbiota from young mice counteracts susceptibility to age-related gout through modulating butyric acid levels in aged mice
eLife 13:RP98714.
https://doi.org/10.7554/eLife.98714.4


