Reproducible, data-driven characterization of sleep based on brain dynamics and transitions from whole-night fMRI
- Advanced MRI Section, Laboratory of Functional and Molecular Imaging, National Institute of Neurological Disorders and Stroke, National Institutes of Health, United States
Figures
Figure 1 with 1 supplement
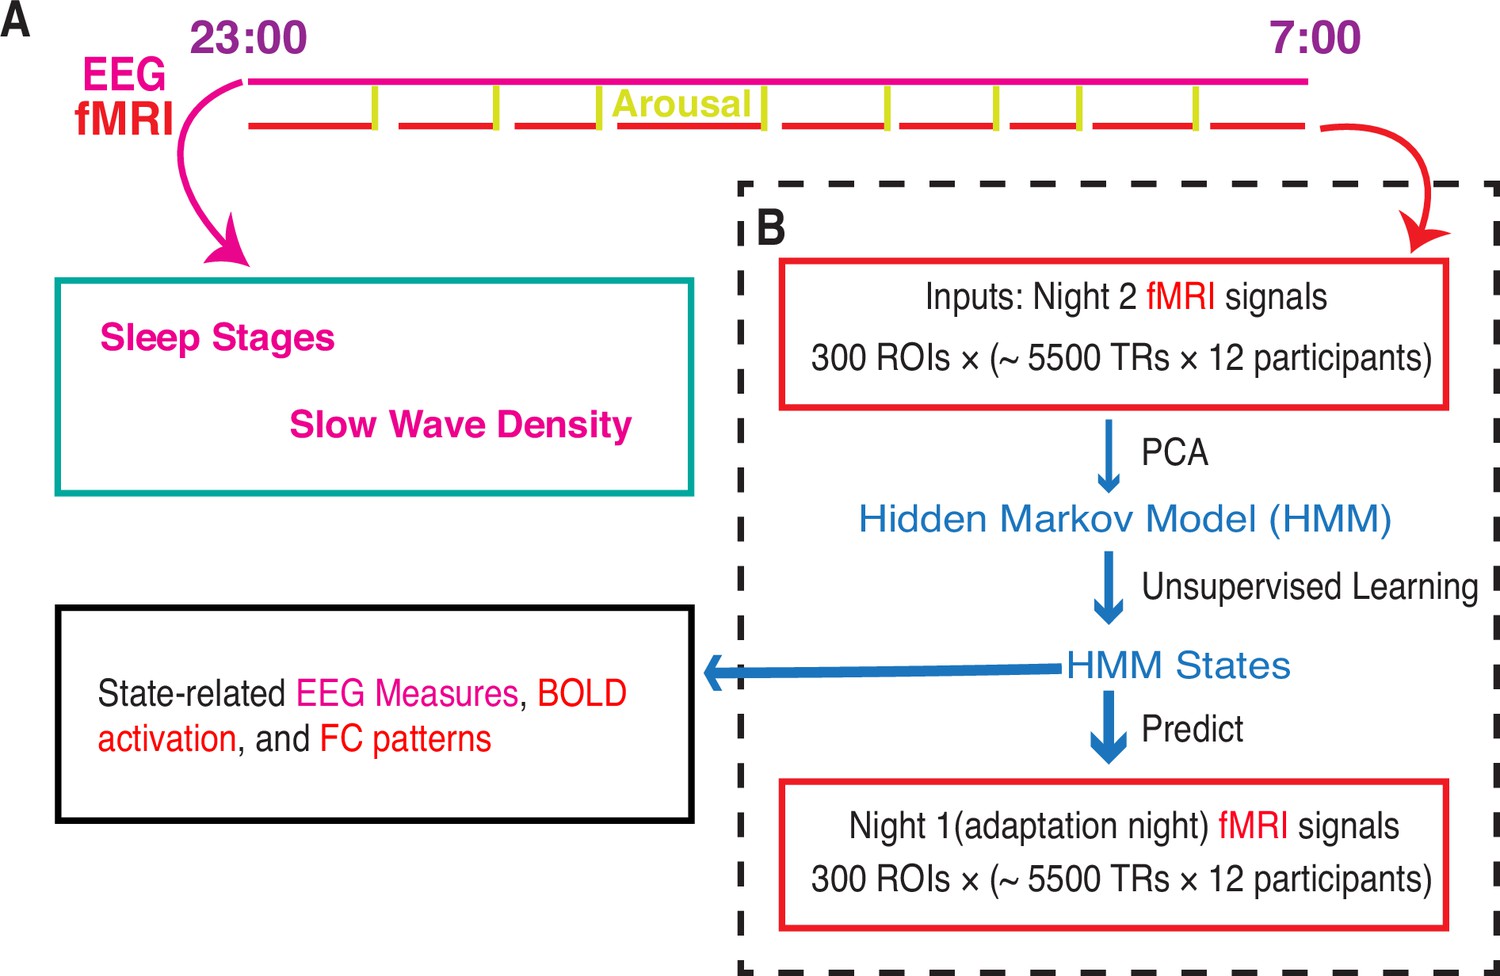
Whole-brain activity dynamic identified from functional MRI (fMRI) sleep recording using a Hidden Markov Model.
(A) Participants slept inside a scanner from ~23:00 to ~07:00 for two consecutive nights, with concurrent EEG-fMRI recording. During each night, the fMRI experiments were intermittently disrupted by either acoustical arousals (eight random arousals) or spontaneous awakenings. Sleep stages and slow wave density were derived from EEG signals alone. (B) Hidden Markov model (HMM) was trained on the principal components of fMRI signals of night 2. Then the identified HMM states were generalized to night 1 fMRI signals. Finally, we studied the state-related variations in fMRI activation, FC patterns, and EEG measures. Notes: EEG, electroencephalographic; TR: repetition time; FC, functional connectivity; ROI, region of interest; PCA, principal component analysis.
Figure 1—figure supplement 1
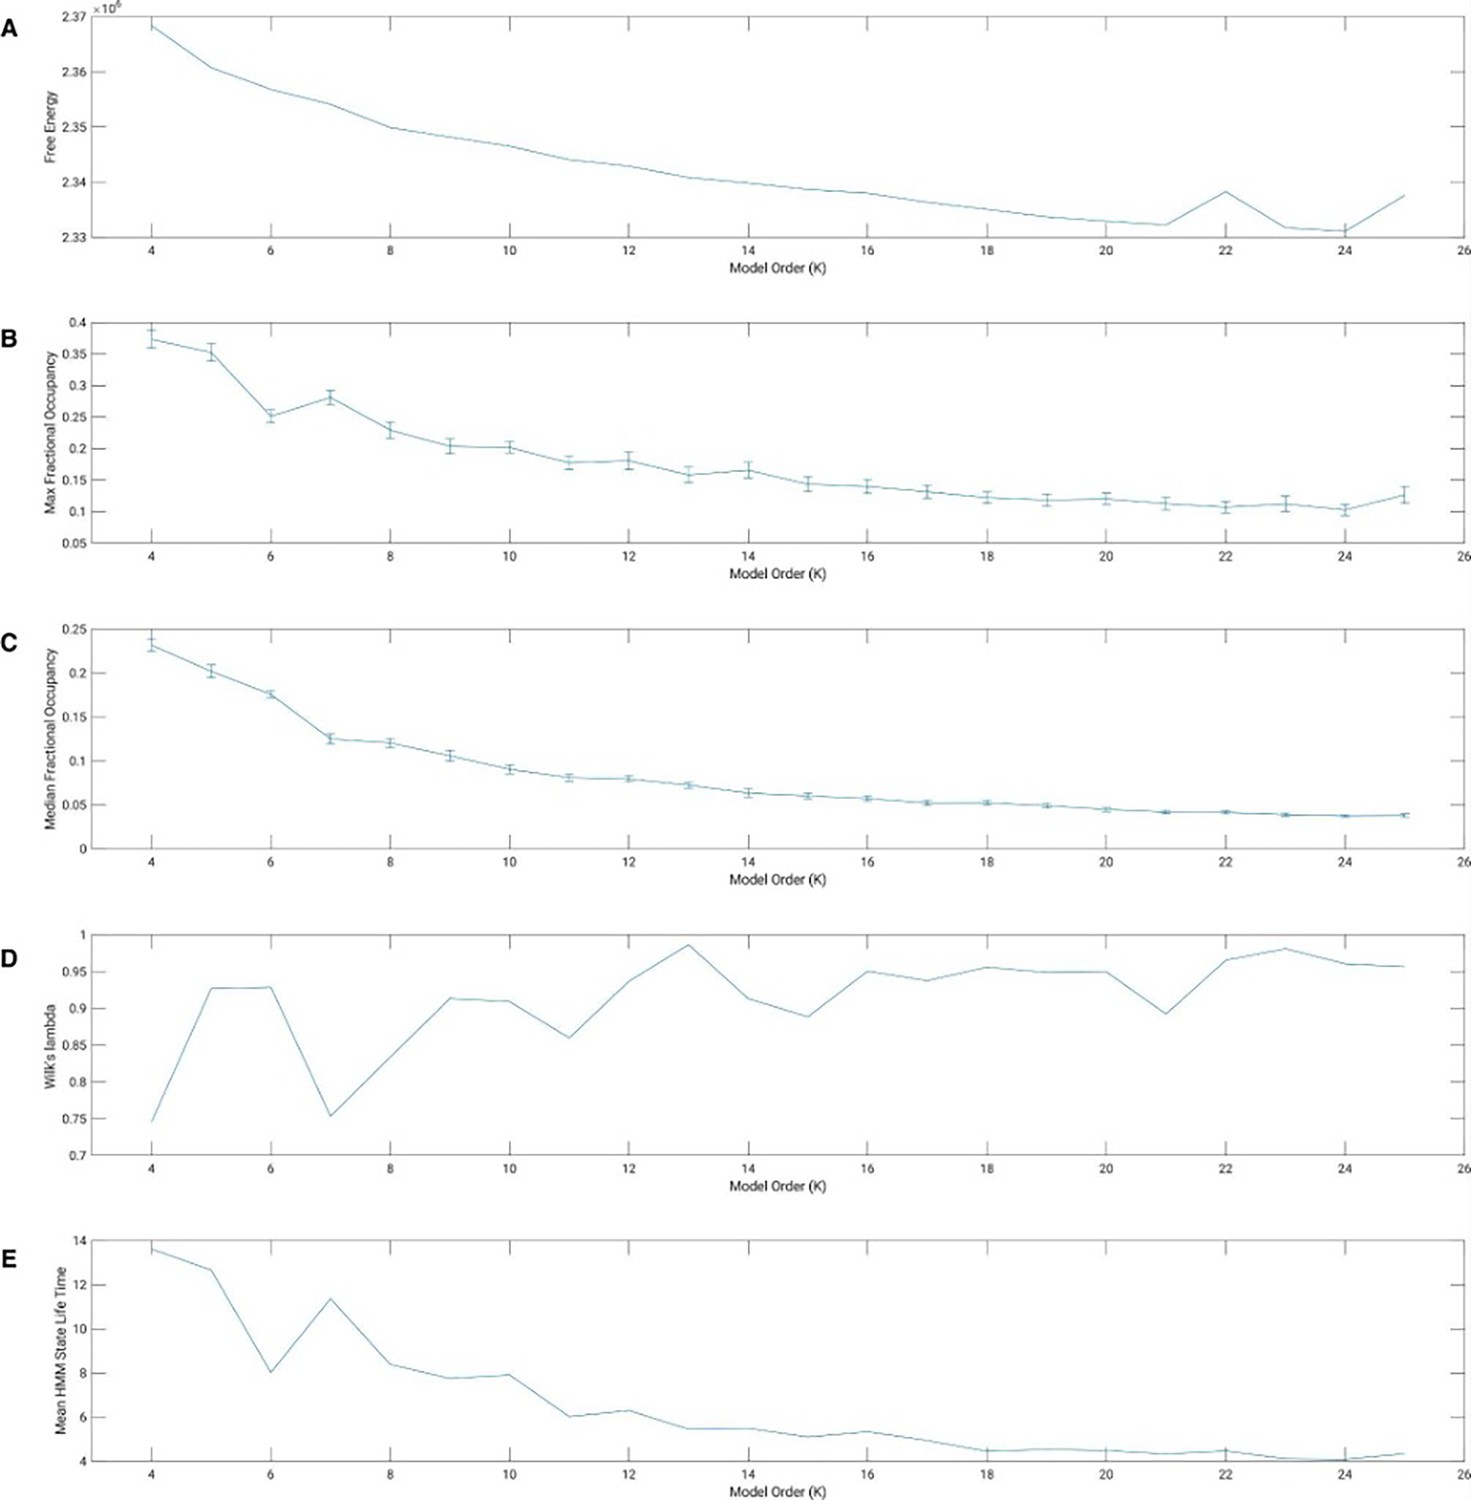
Model evaluation parameters.
The error bars represent the standard error of the mean. Panel (A) free energy; Panel (B) maximum Occupancy (percentage); Panel (C) median Occupancy (percentage); Panel (D) Wilk’s Λ; Panel (E) mean Hidden Markov model (HMM) state Lifetime (TR, 3 s).
Figure 2 with 4 supplements
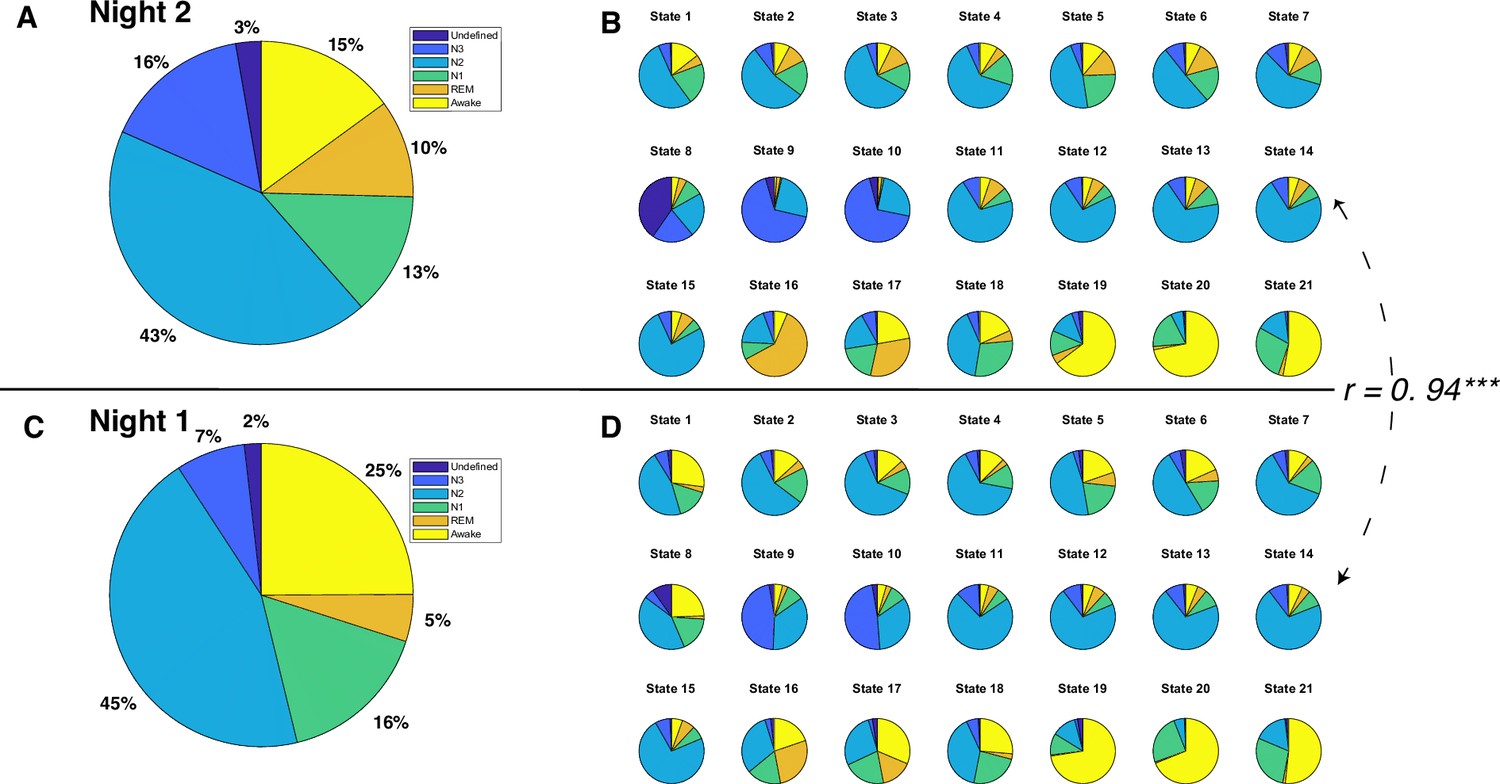
Polysomnography (PSG)-based sleep stages and Hidden Markov model (HMM) states for each night.
(A) Distribution of sleep stages for all 12 participants during night 2. (B) Distribution of sleep stages for 21 HMM states during night 2. (C) Distribution of sleep stages for all 12 participants during night 1. (D) Distribution of sleep stages for 21 HMM states during night 1. The Pearson correlation coefficient between sleep stage distributions of HMM states during night 2 and those during night 1 is 0.94, p<0.0001.
Figure 2—figure supplement 1
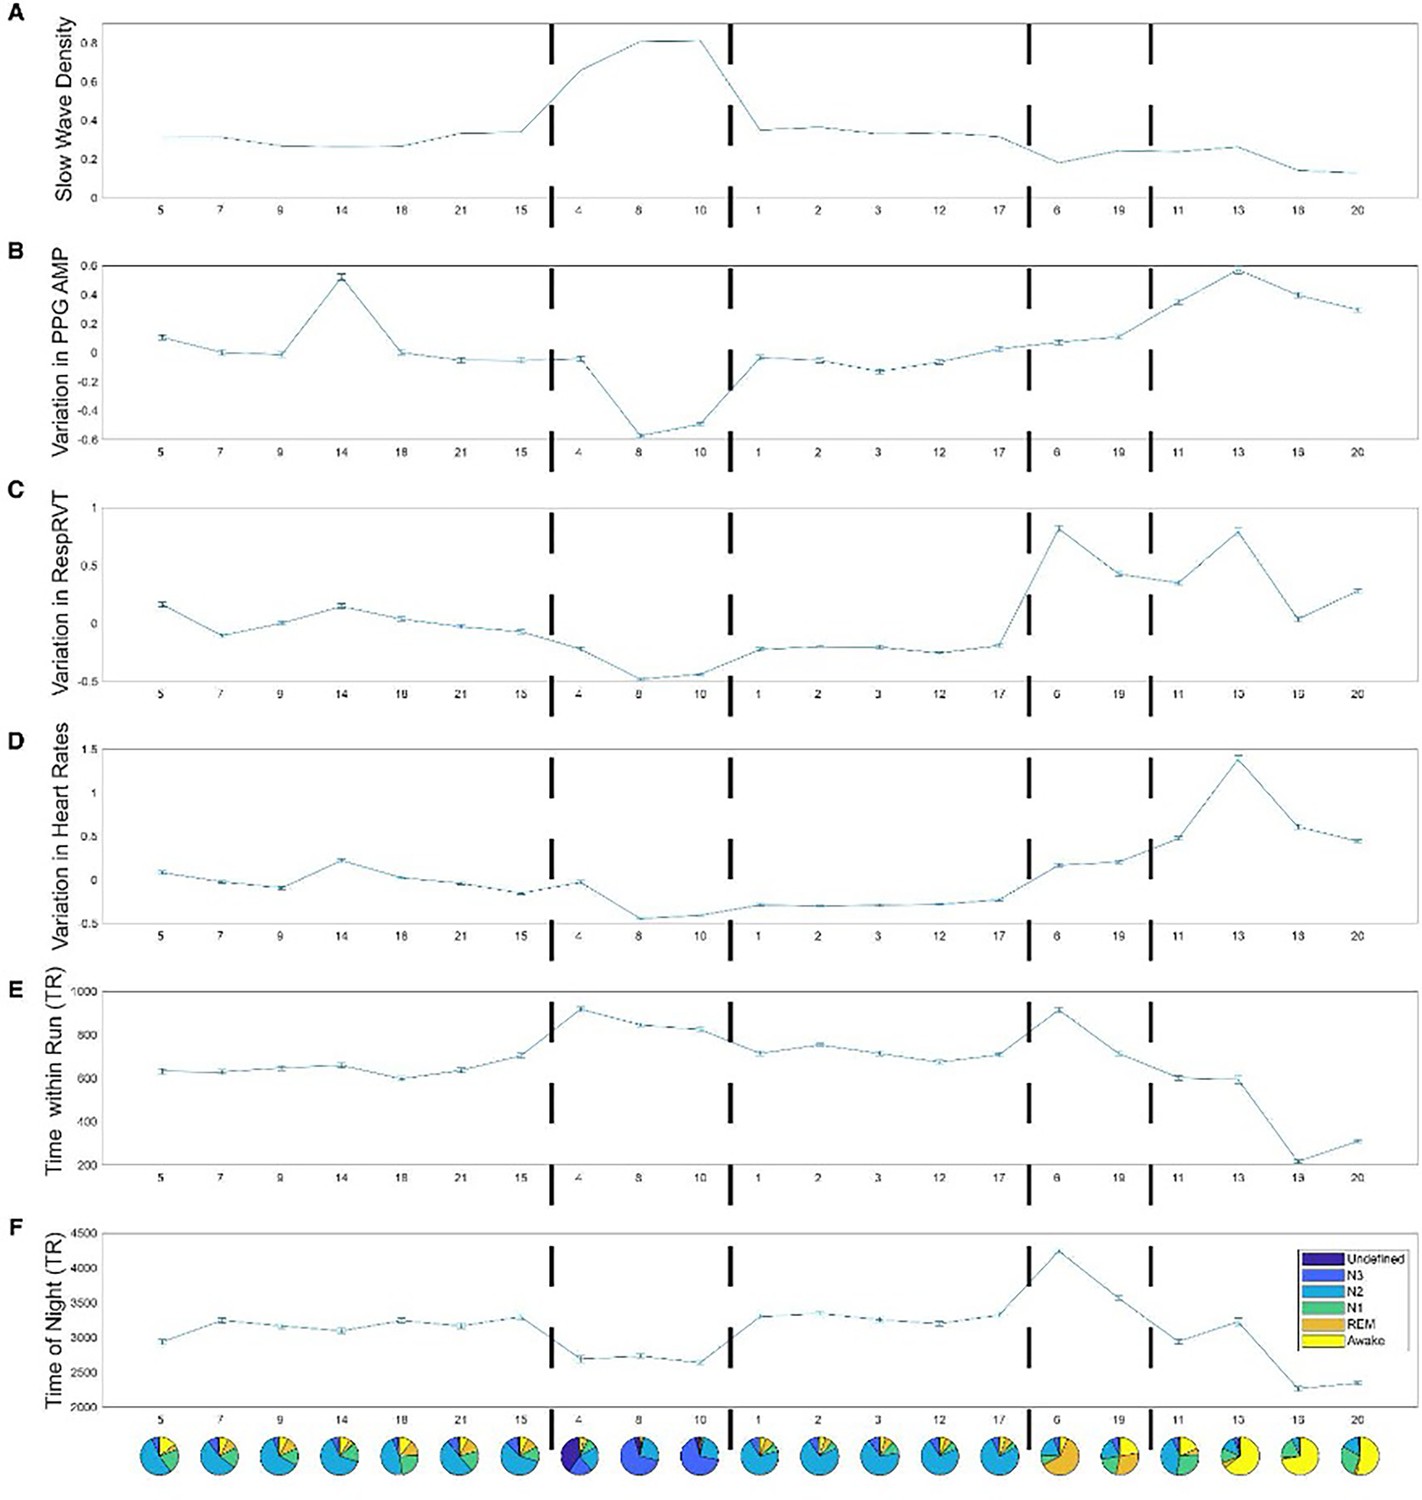
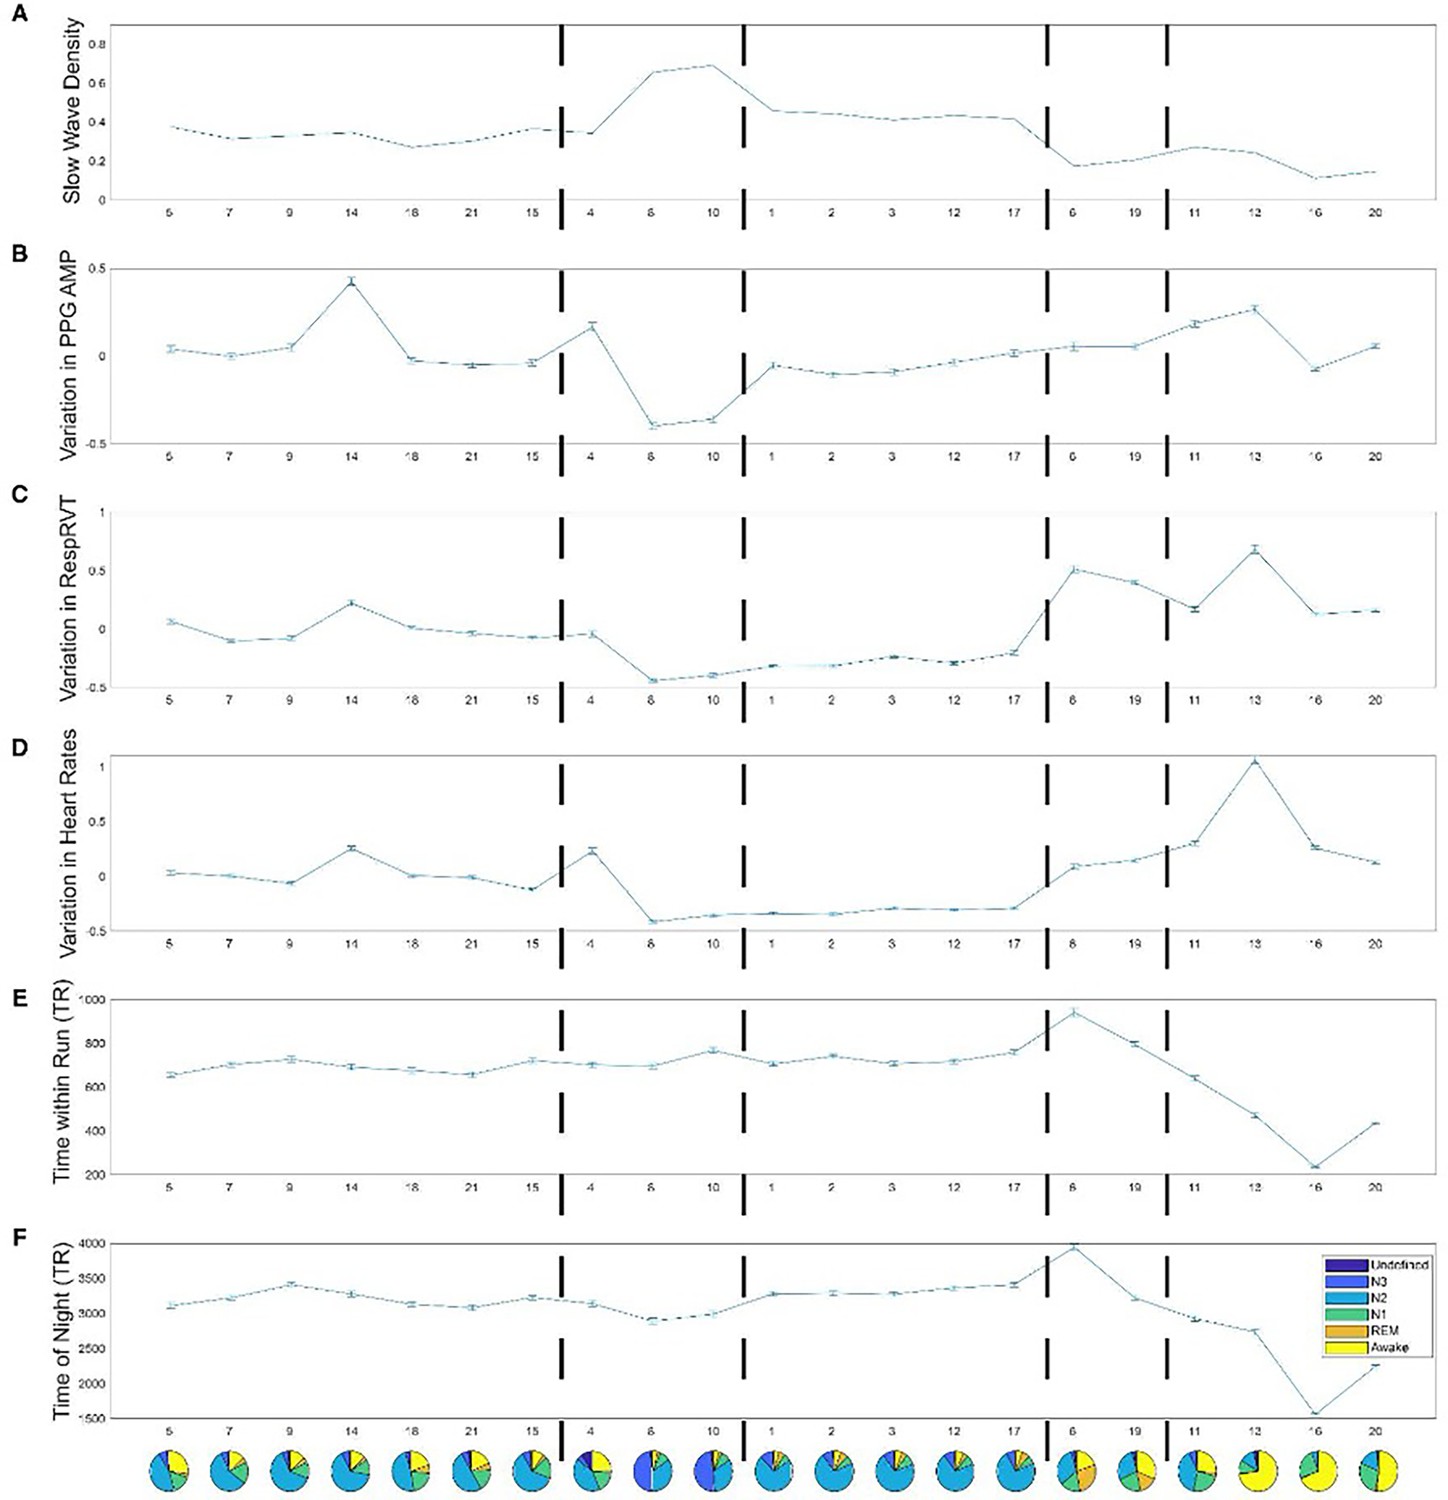
Physiological variables associated with each Hidden Markov model (HMM) state during night 2.
The error bars represent the standard error of the mean. Panel (A) slow wave density (the percentage of repetition time (TR) that had slow waves); Panel (B) variation in photoplethysmography (PPG) amplitude (z-score); Panel (C) variation in Respiratory Volume per Time (z-score); Panel (D) variation in Heart Rates; Panel (E) time within a functional MRI (fMRI) Run (TR, 3 s); Panel (F) time since experiment start (TR, 3 s).
Figure 2—figure supplement 2
Physiological variables associated with each Hidden Markov model (HMM) state during night 1.
The error bars represent the standard error of the mean. Panel (A) slow wave density (the percentage of repetition time (TR) that had slow waves); Panel (B) variation in photoplethysmography (PPG) amplitude (z-score); Panel (C) variation in respiratory volume per time (z-score); Panel (D) variation in heart rates; Panel (E) time within a functional MRI (fMRI) Run (TR, 3 s); Panel (F) time since experiment start (TR, 3 s).
Figure 2—figure supplement 3
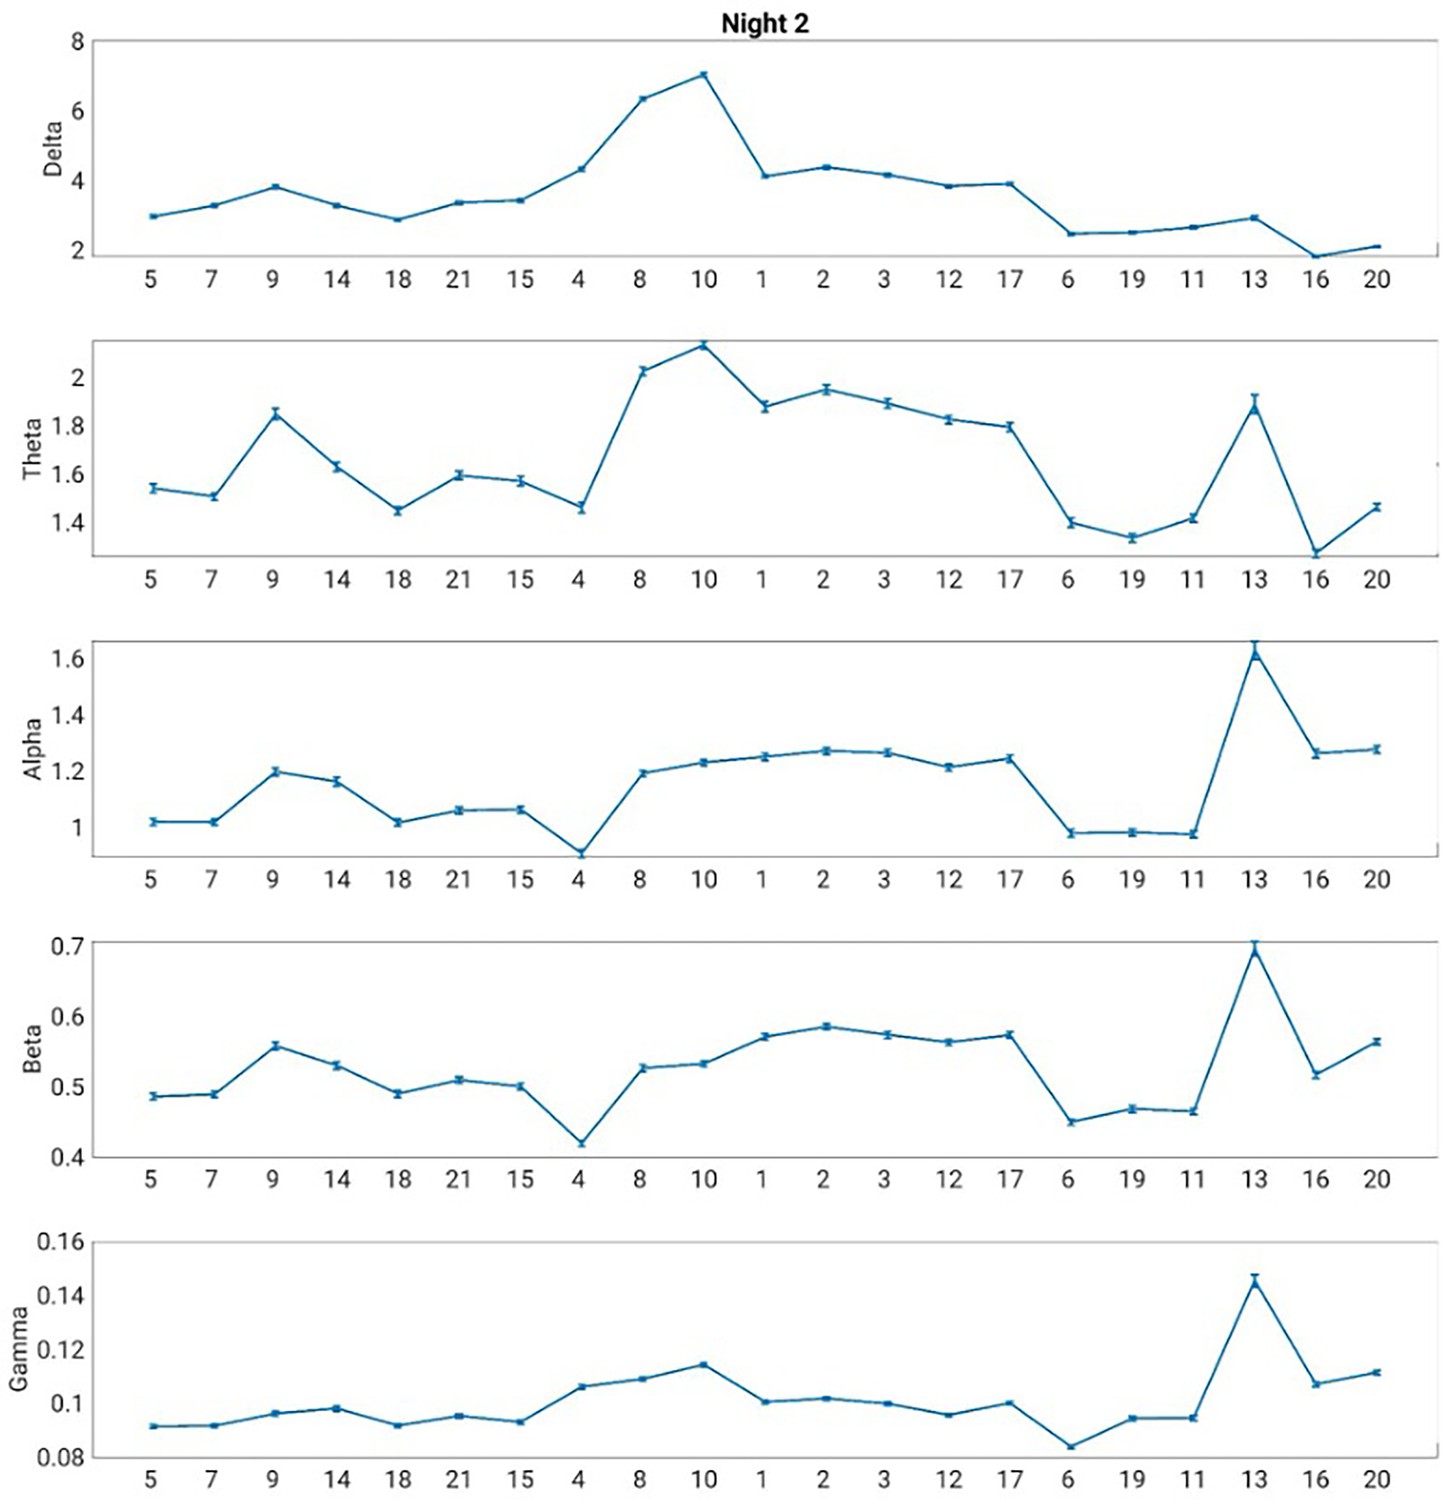
Electroencephalography (EEG) power spectrum associated with each Hidden Markov model (HMM) state during night 2.
The error bars represent the standard error of the mean.
Figure 2—figure supplement 4
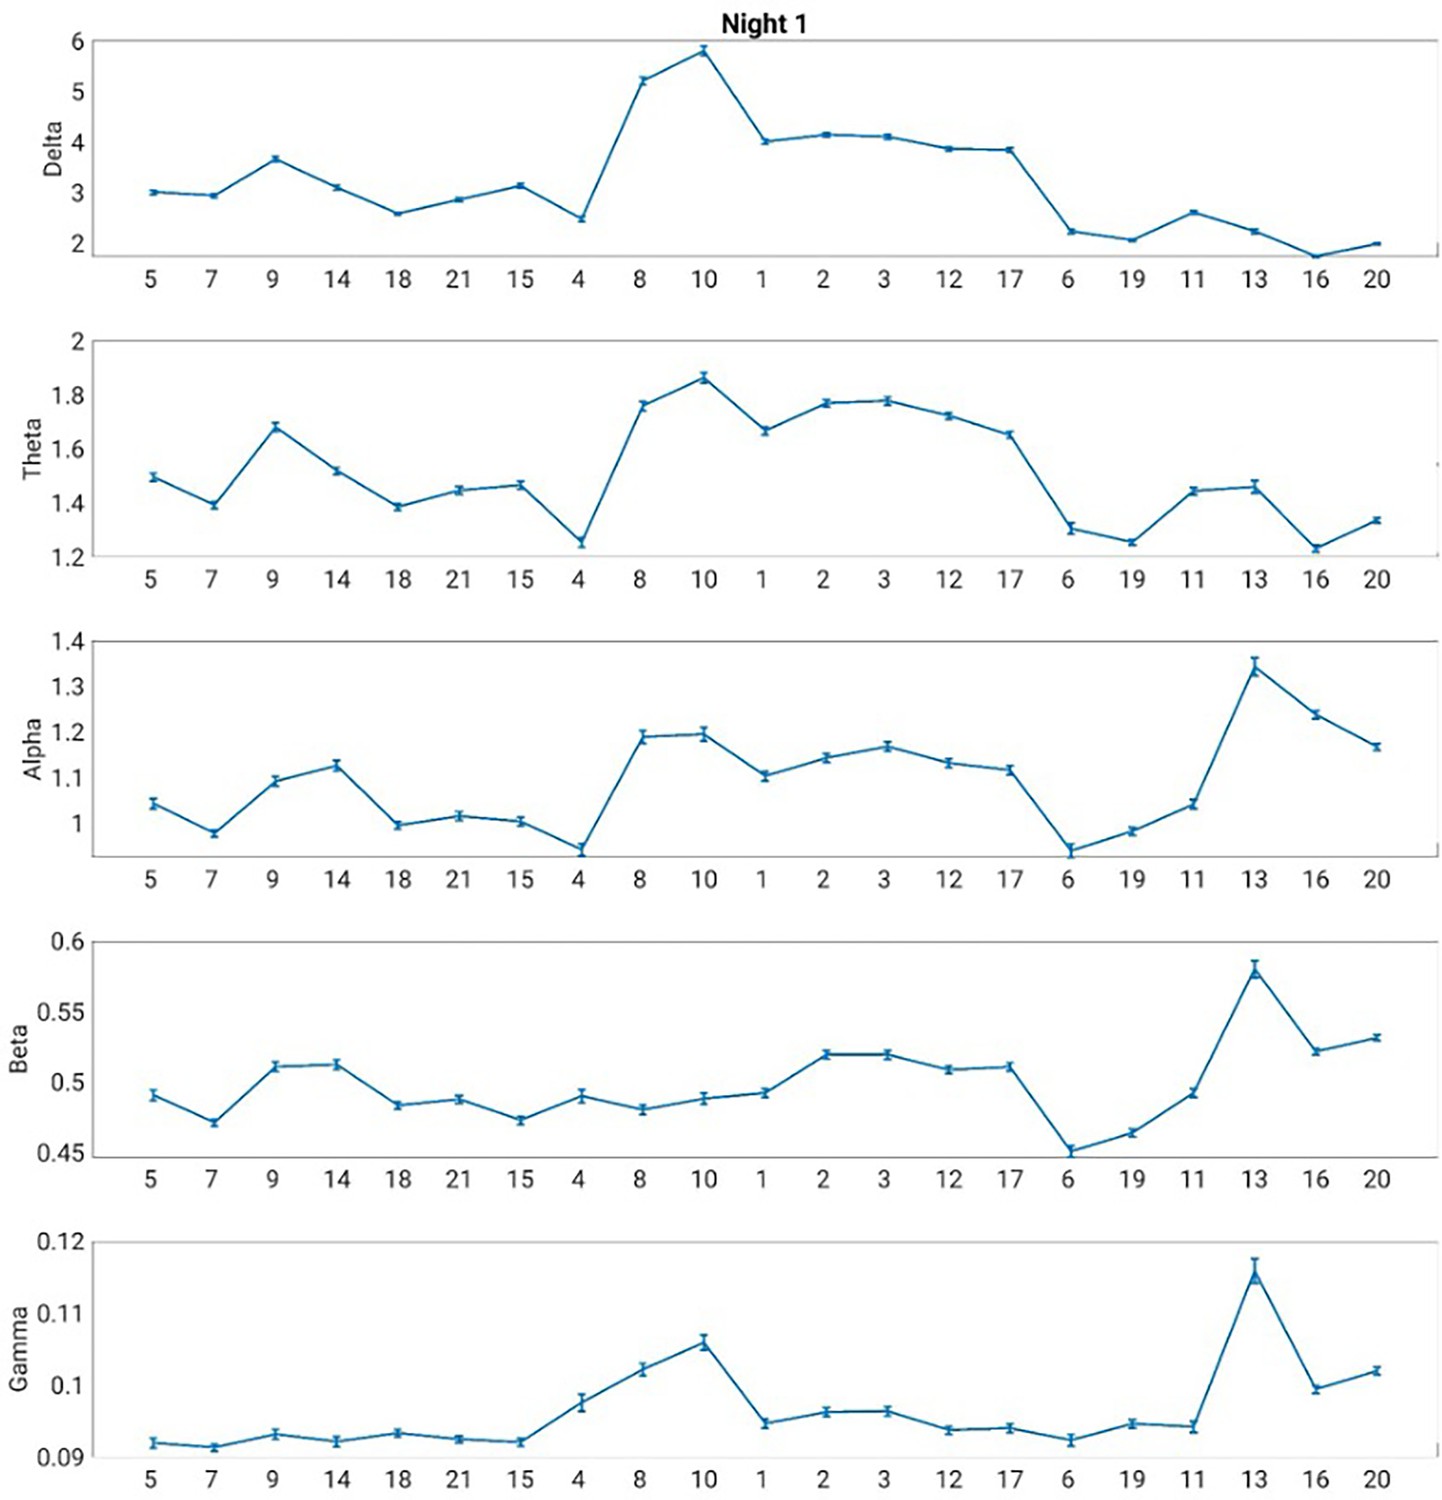
Electroencephalography (EEG) power spectrum associated with each Hidden Markov model (HMM) state during night 1.
The error bars represent the standard error of the mean.
Figure 3 with 3 supplements
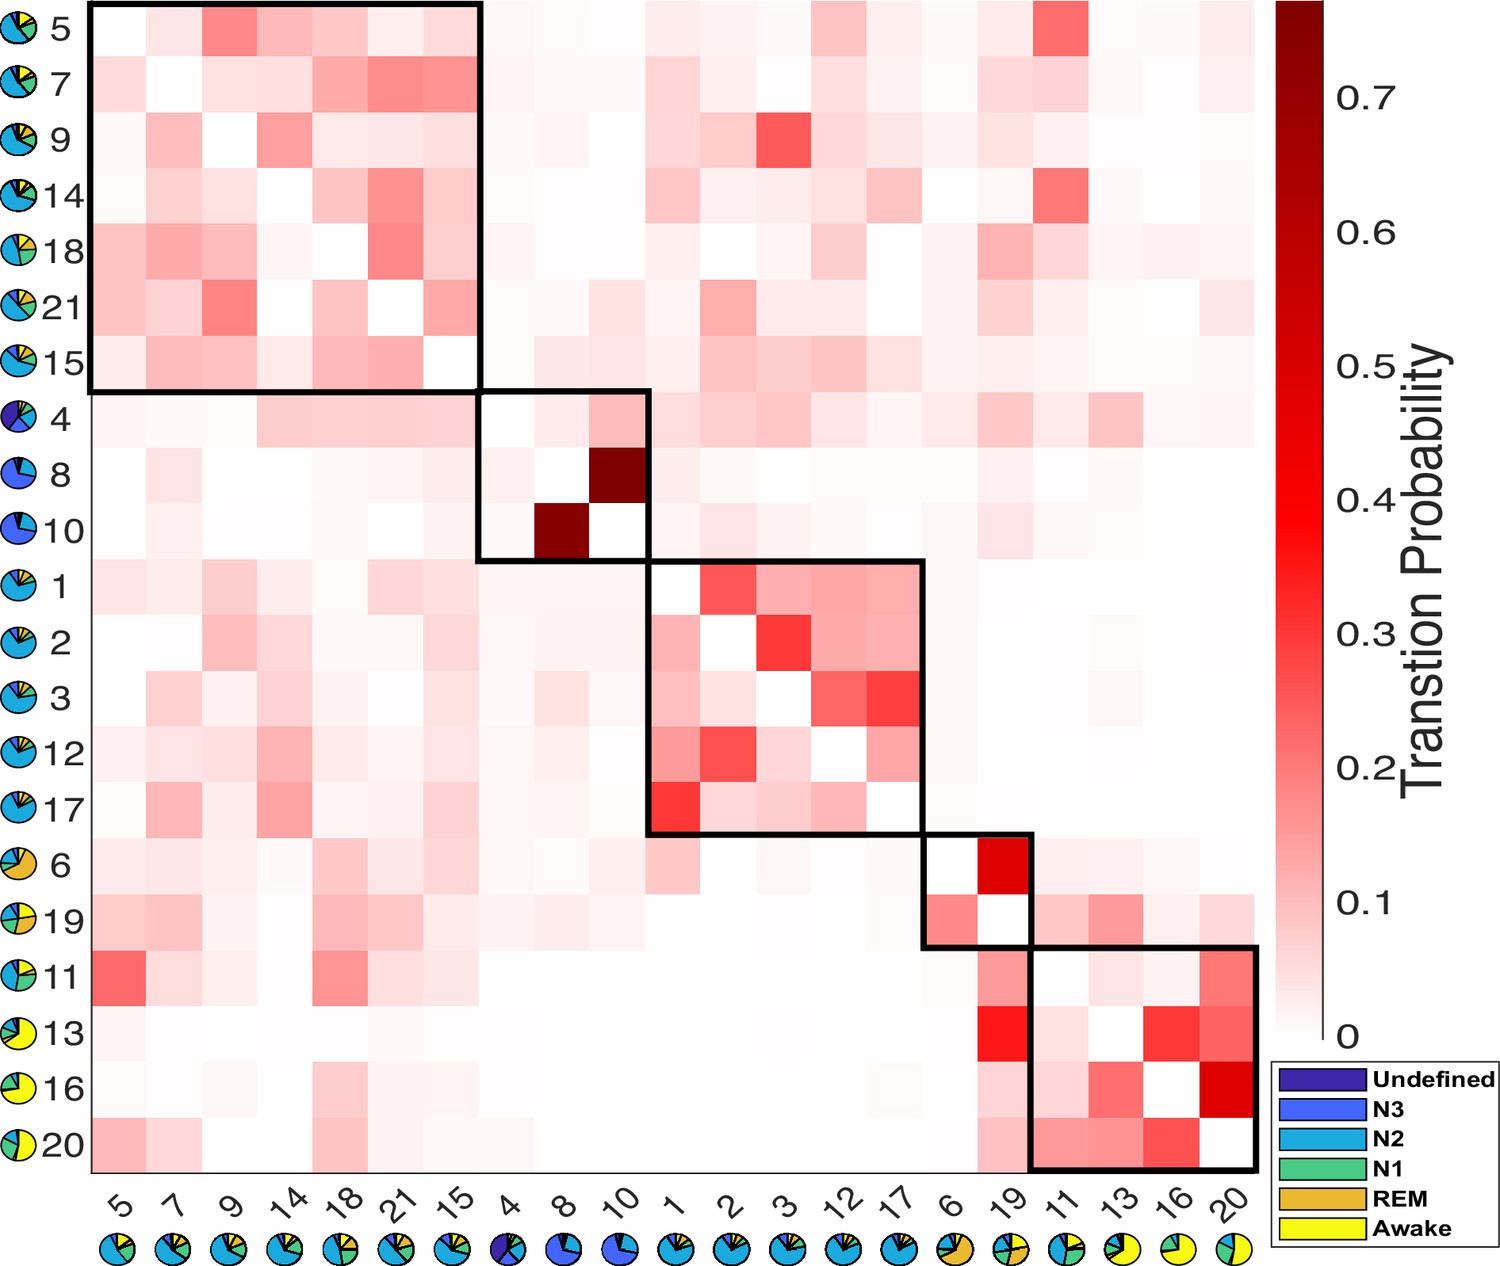
Results of the modular analysis are based solely on transition probability between Hidden Markov model (HMM) states.
Each row represents the transition probability of the current HMM state (y-axis) to other states (x-axis). Twenty-one HMM states were categorized into five modules (black boxes): from left to right, light-N2 module (states 5, 7, 9, 14, 15, 18, 21), N3 module (states 4, 8, 10), deep-N2 module (states 1, 2, 3, 12, 17), rapid eye movement (REM) module (states 6 and 19), and Wake module (states 11, 13, 16, 20). The pie chart under each state represents the sleep stage distribution for the state.
Figure 3—figure supplement 1
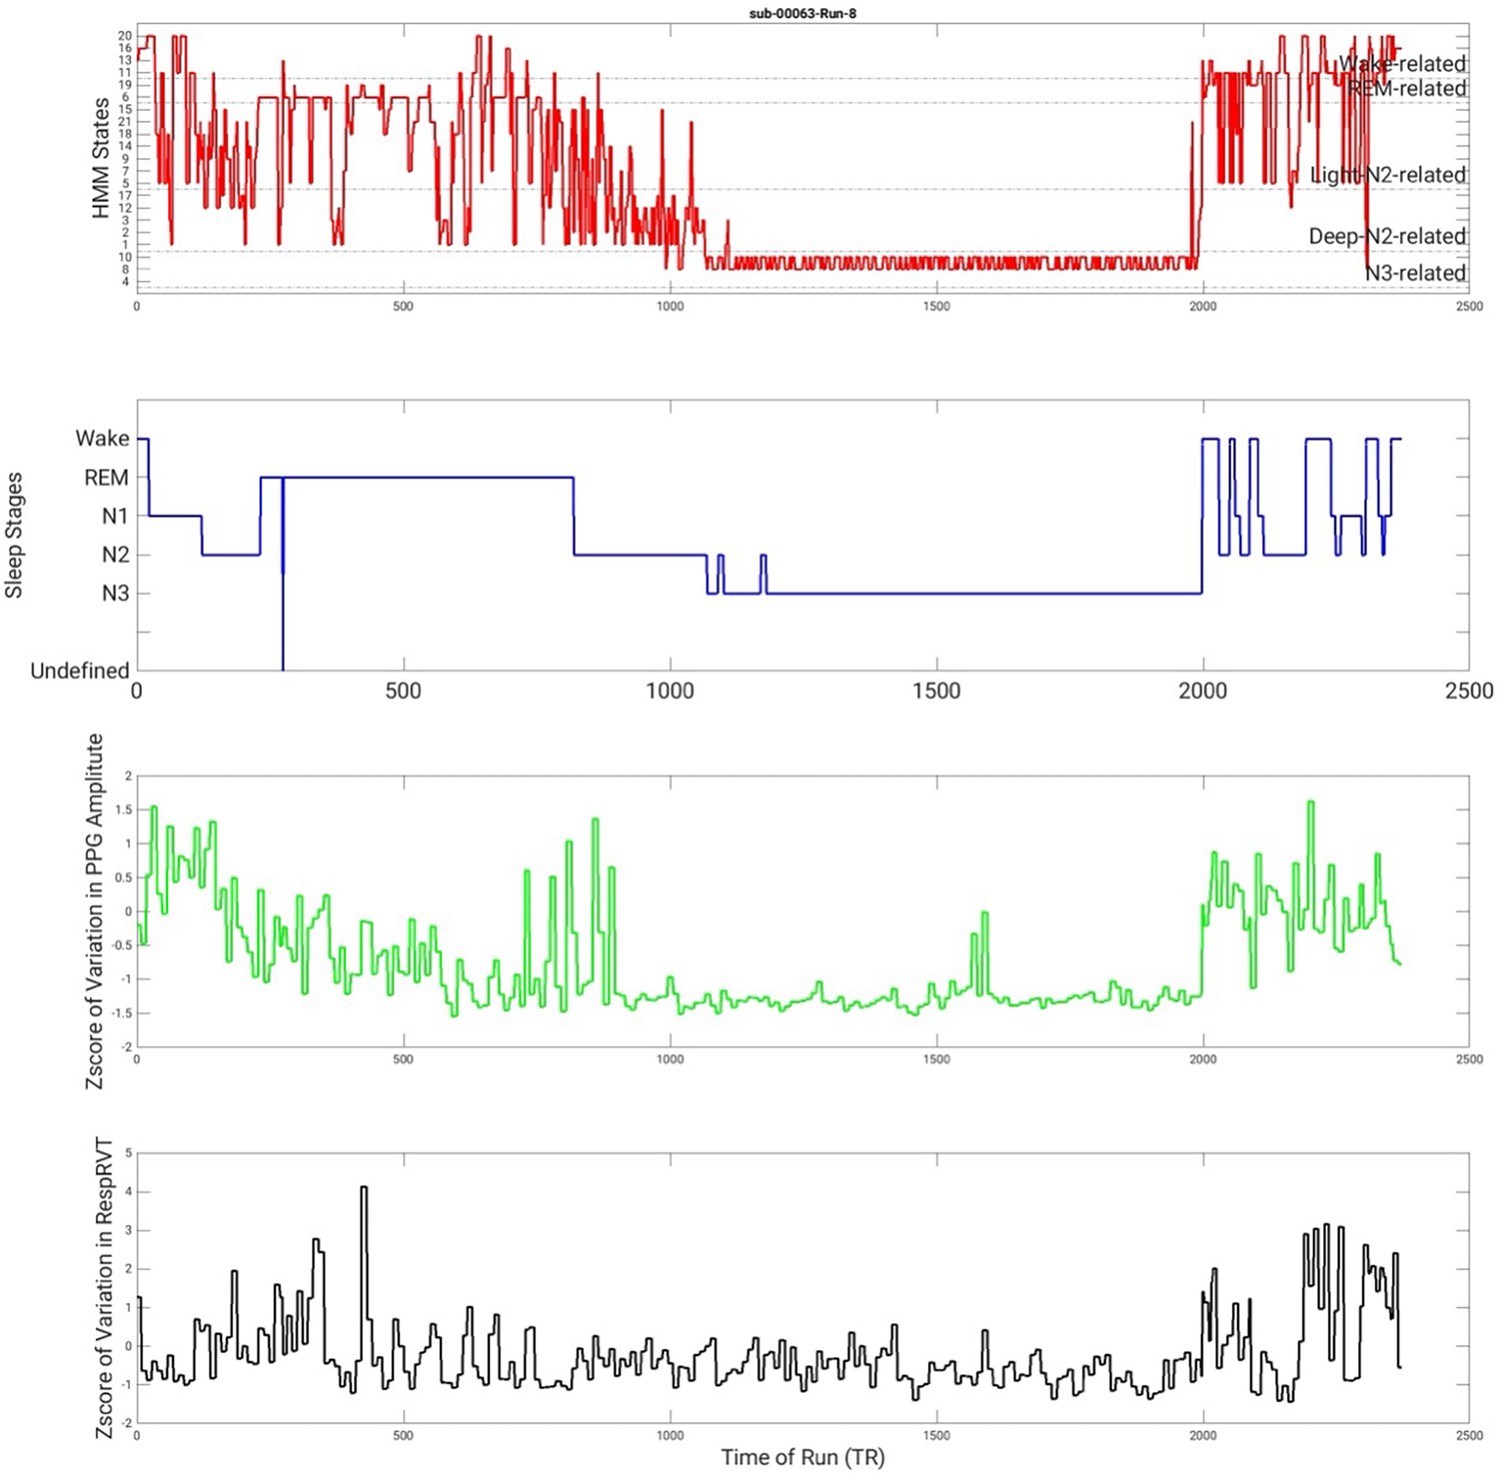
State timecourse of Hidden Markov model (HMM) states and its associations with polysomnography (PSG) stages, variation in photoplethysmography (PPG) amplitude, and variations in RespRVT signals of an example run.
Figure 3—figure supplement 2
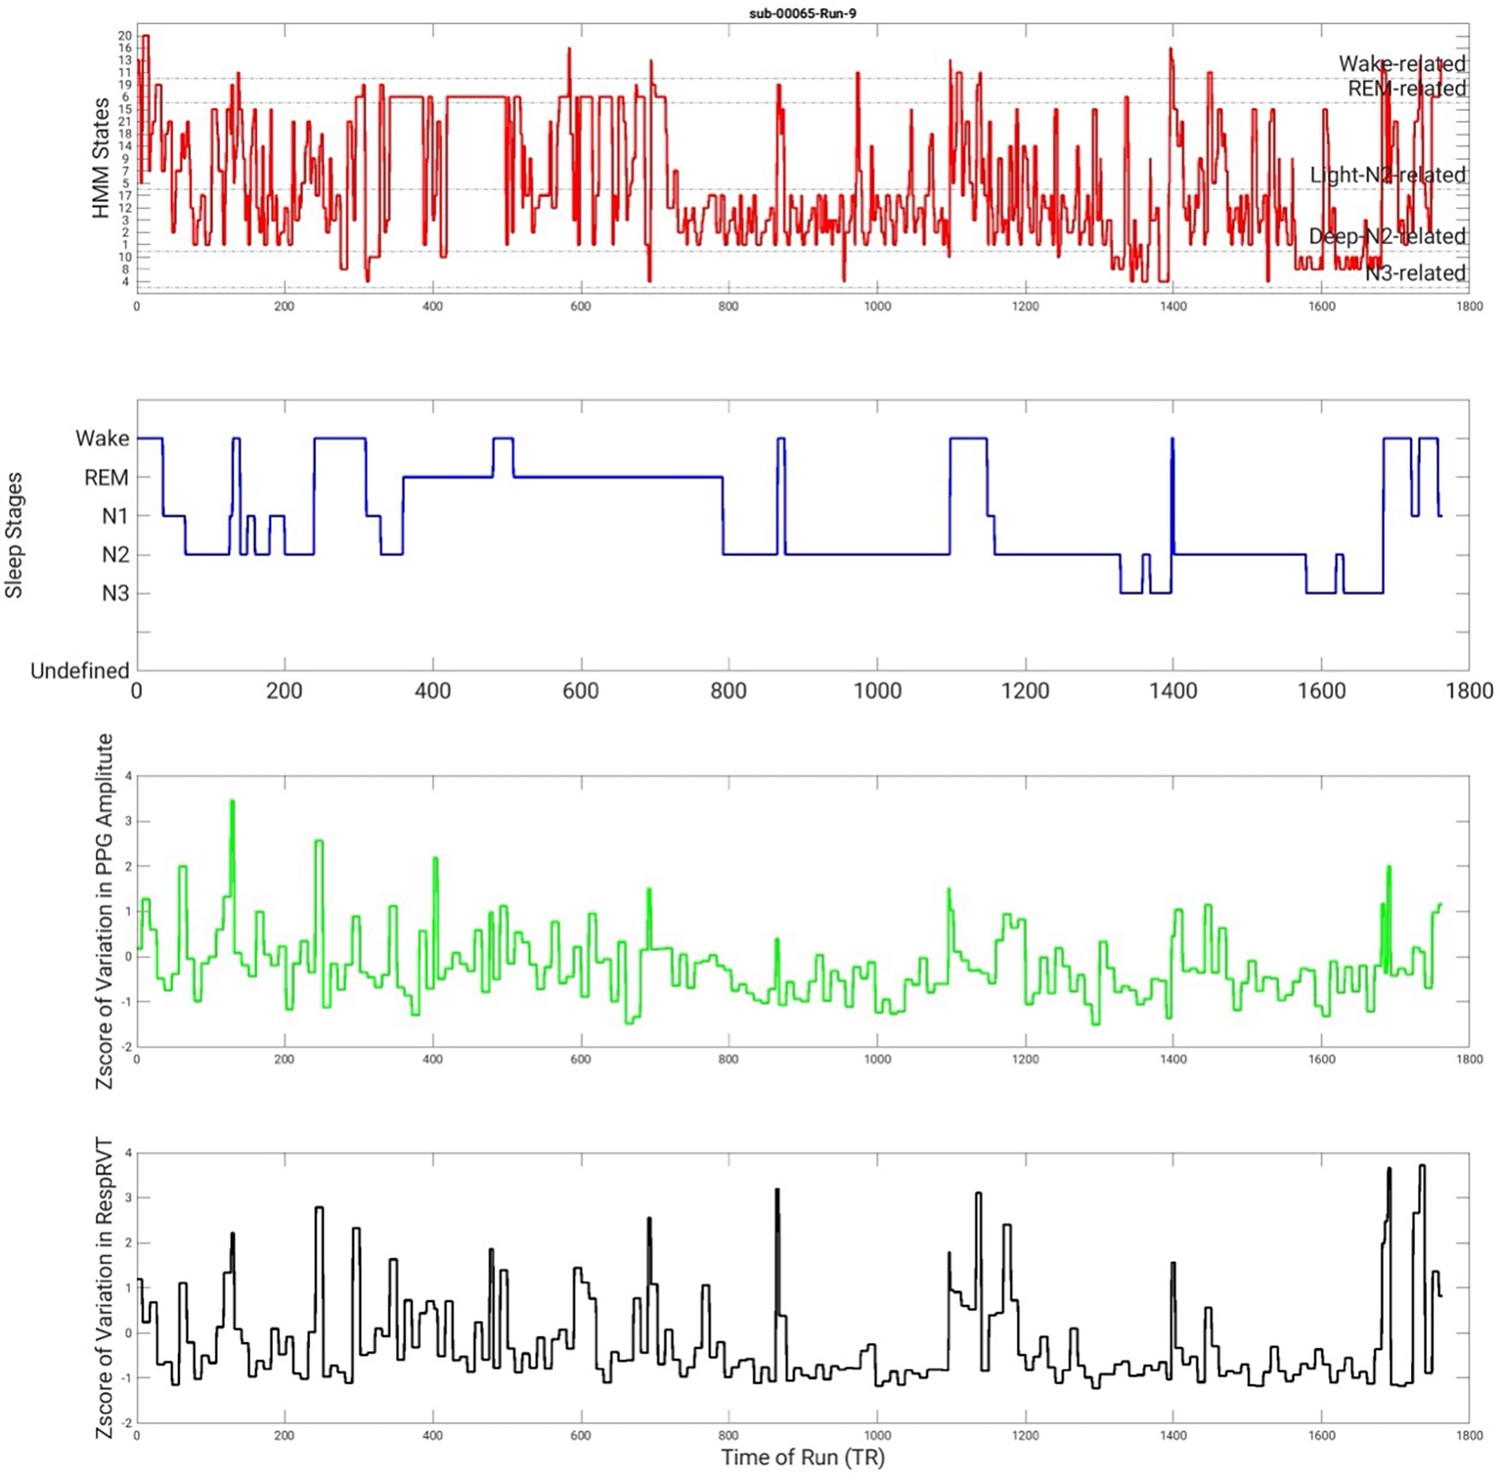
State timecourse of Hidden Markov model (HMM) states and its associations with polysomnography (PSG) stages, variation in photoplethysmography (PPG) amplitude, and variations in RespRVT signals of a second example run.
Figure 3—figure supplement 3
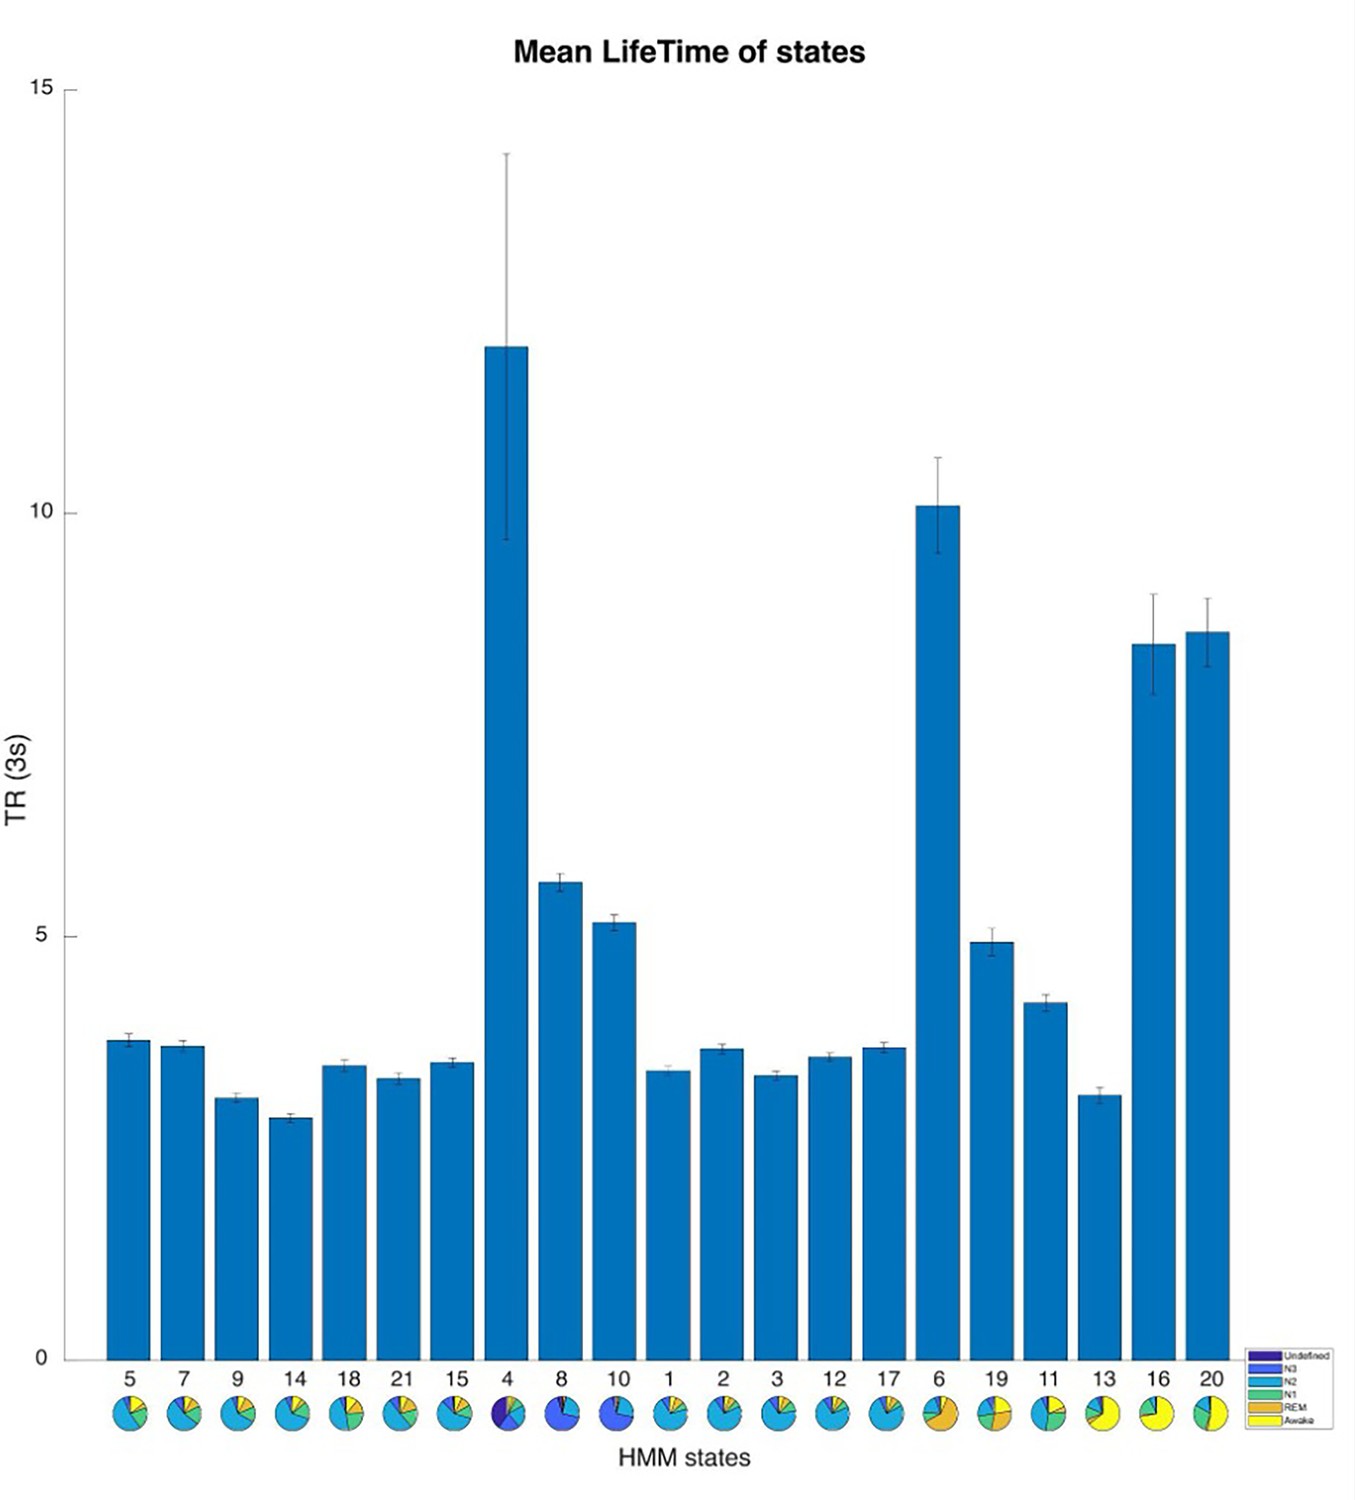
The mean Lifetime of 21 Hidden Markov model (HMM) states.
The HMM states are organized based on the results of modular analysis. The error bars represent the standard error of the mean.
Figure 4 with 3 supplements
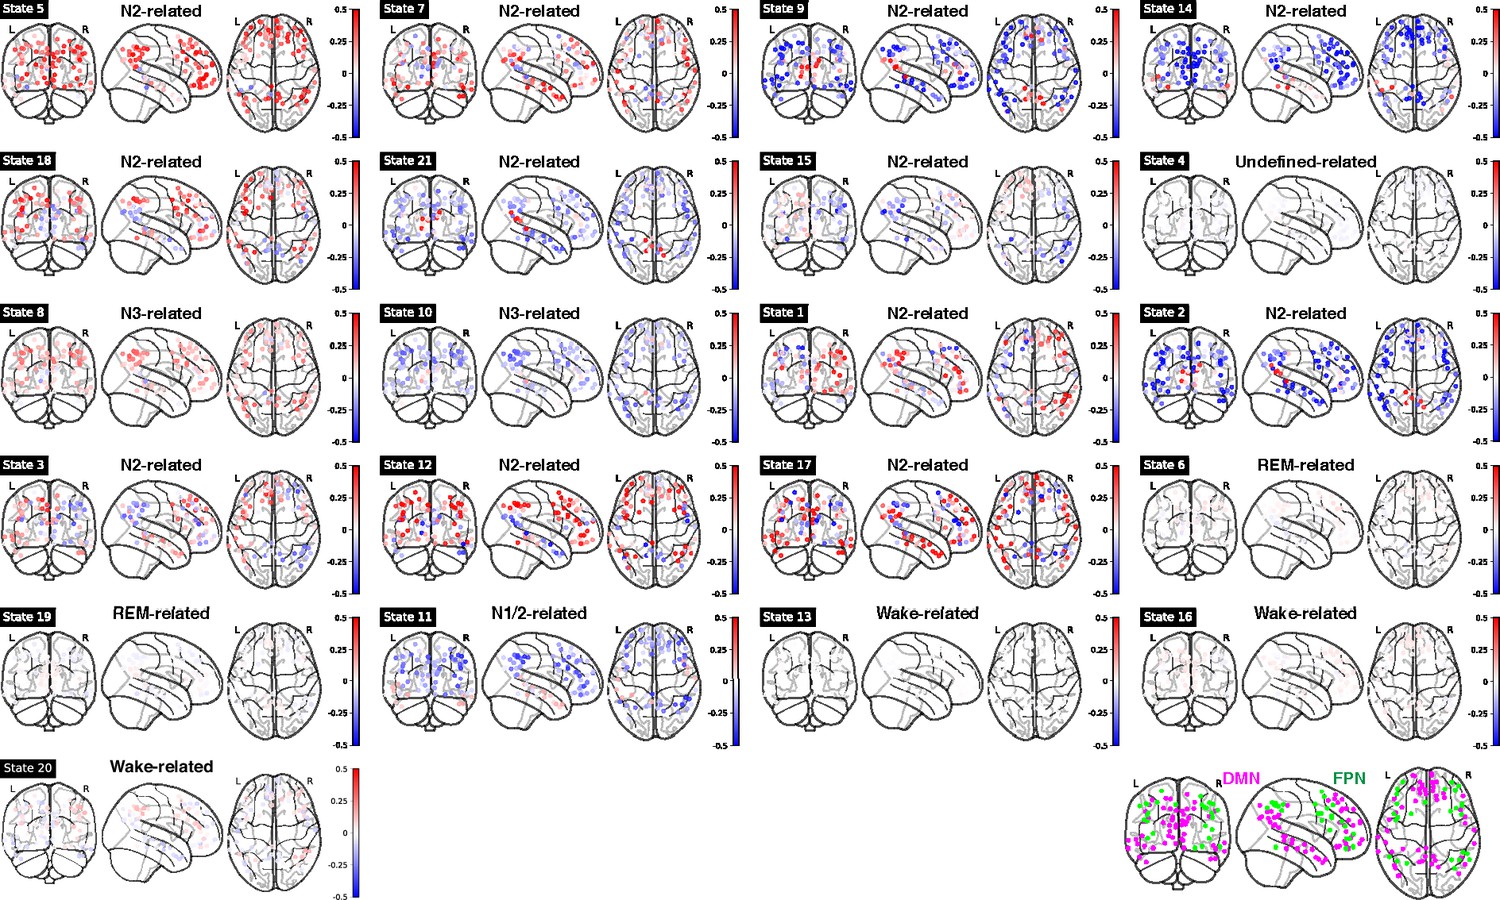
Mean functional MRI (fMRI) activation in ROIs within DMN and FPN for each Hidden Markov model (HMM) state.
Bottom right panel: illustration of DMN (purple) and FPN (green) nodes. Note: DMN: Default Mode Network; FPN: Frontoparietal Network.
Figure 4—figure supplement 1
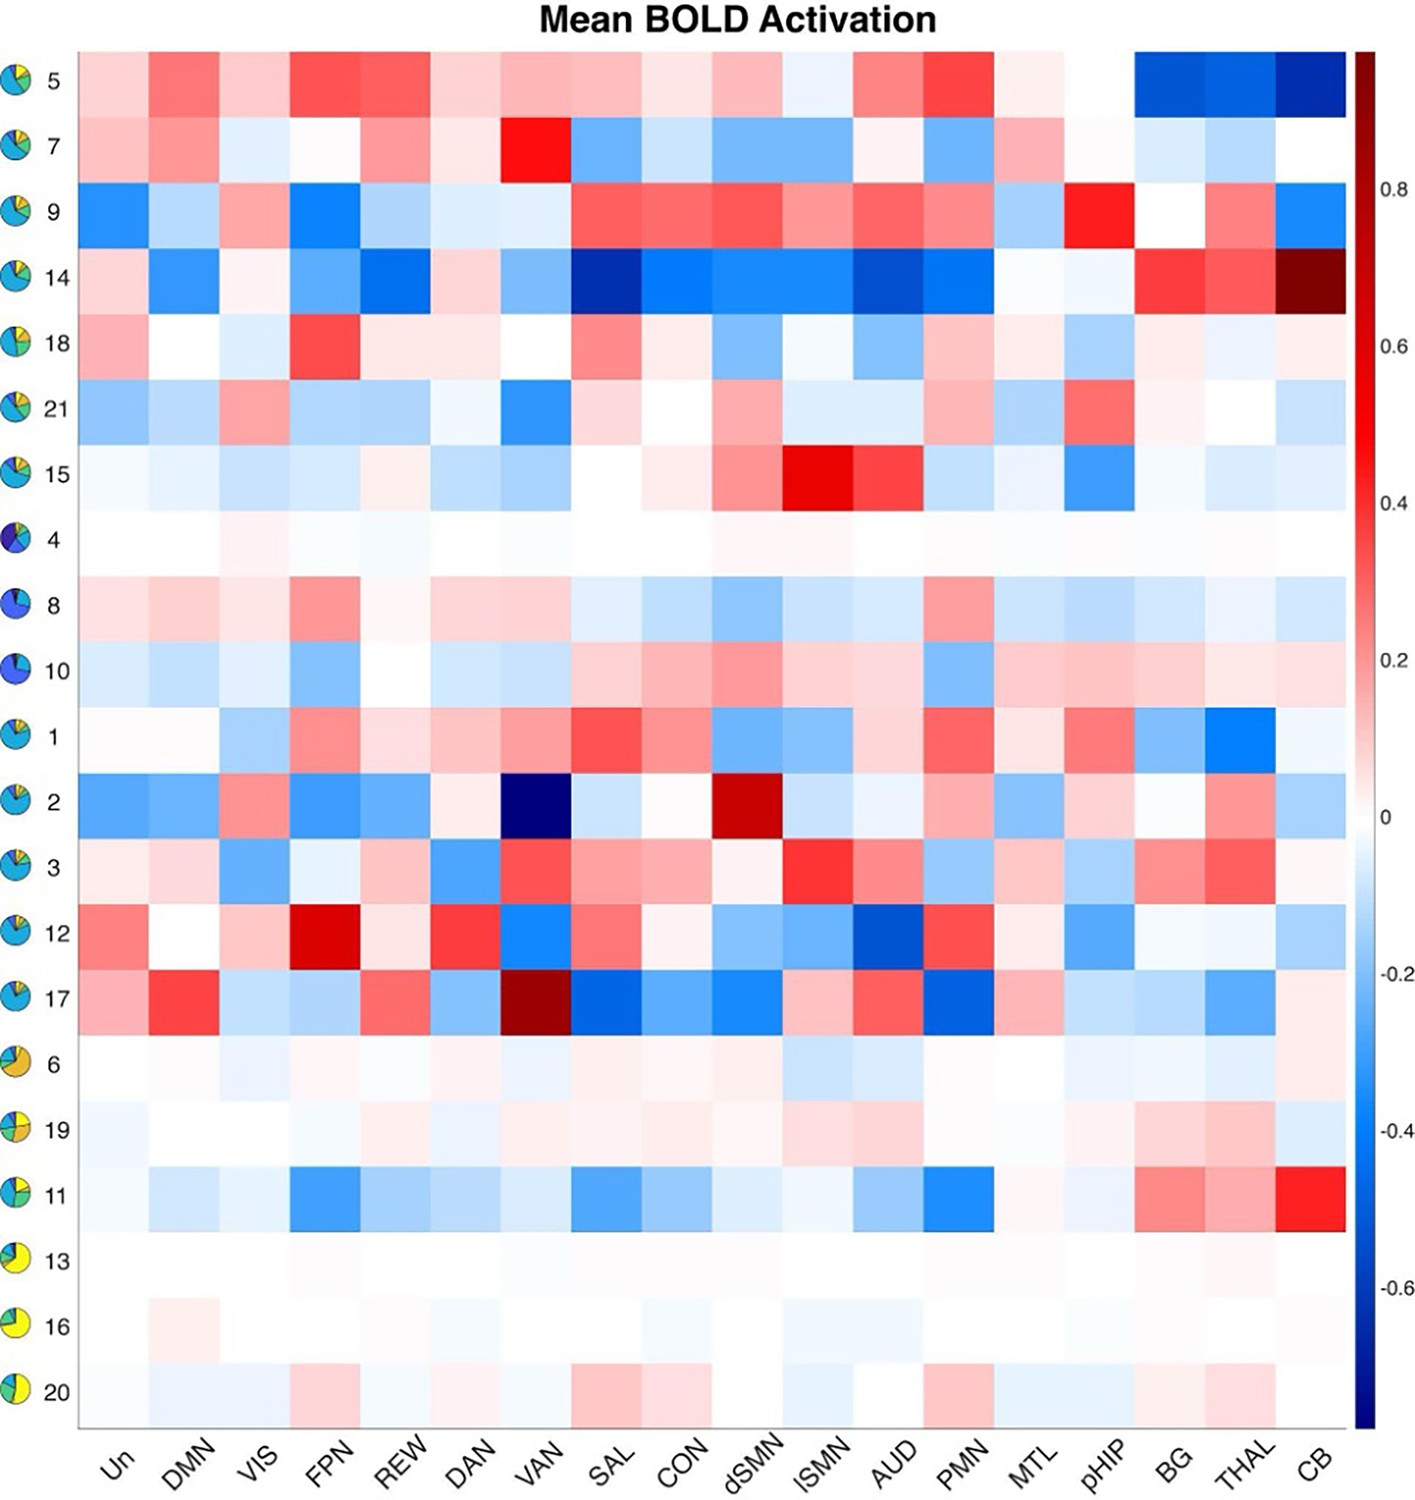
Mean functional MRI (fMRI) activation (percent signal change) for each state relative to baseline averaged over all Hidden Markov model (HMM) states.
Notes: Un: Undefined Network; DMN: Default Mode Network; VIS: Visual Network; FPN: Frontoparietal Network; REW: Reward Network; DAN: Dorsal Attention Network; VAN: Ventral Attention Network; SAL: Salience Network; CON: Cingulo-Opercular Network; dSMN: Somatomotor Dorsal Network; lSMN: Somatomotor Lateral Network; AUD: Auditory Network; PMN: ParietoMedial Network; MTL: Medial Temporal Network; pHIP: Posterior Hippocampus; BG: Basal Ganglia; THAL: Thalamus; CB: Cerebellar Cortex.
Figure 4—figure supplement 2
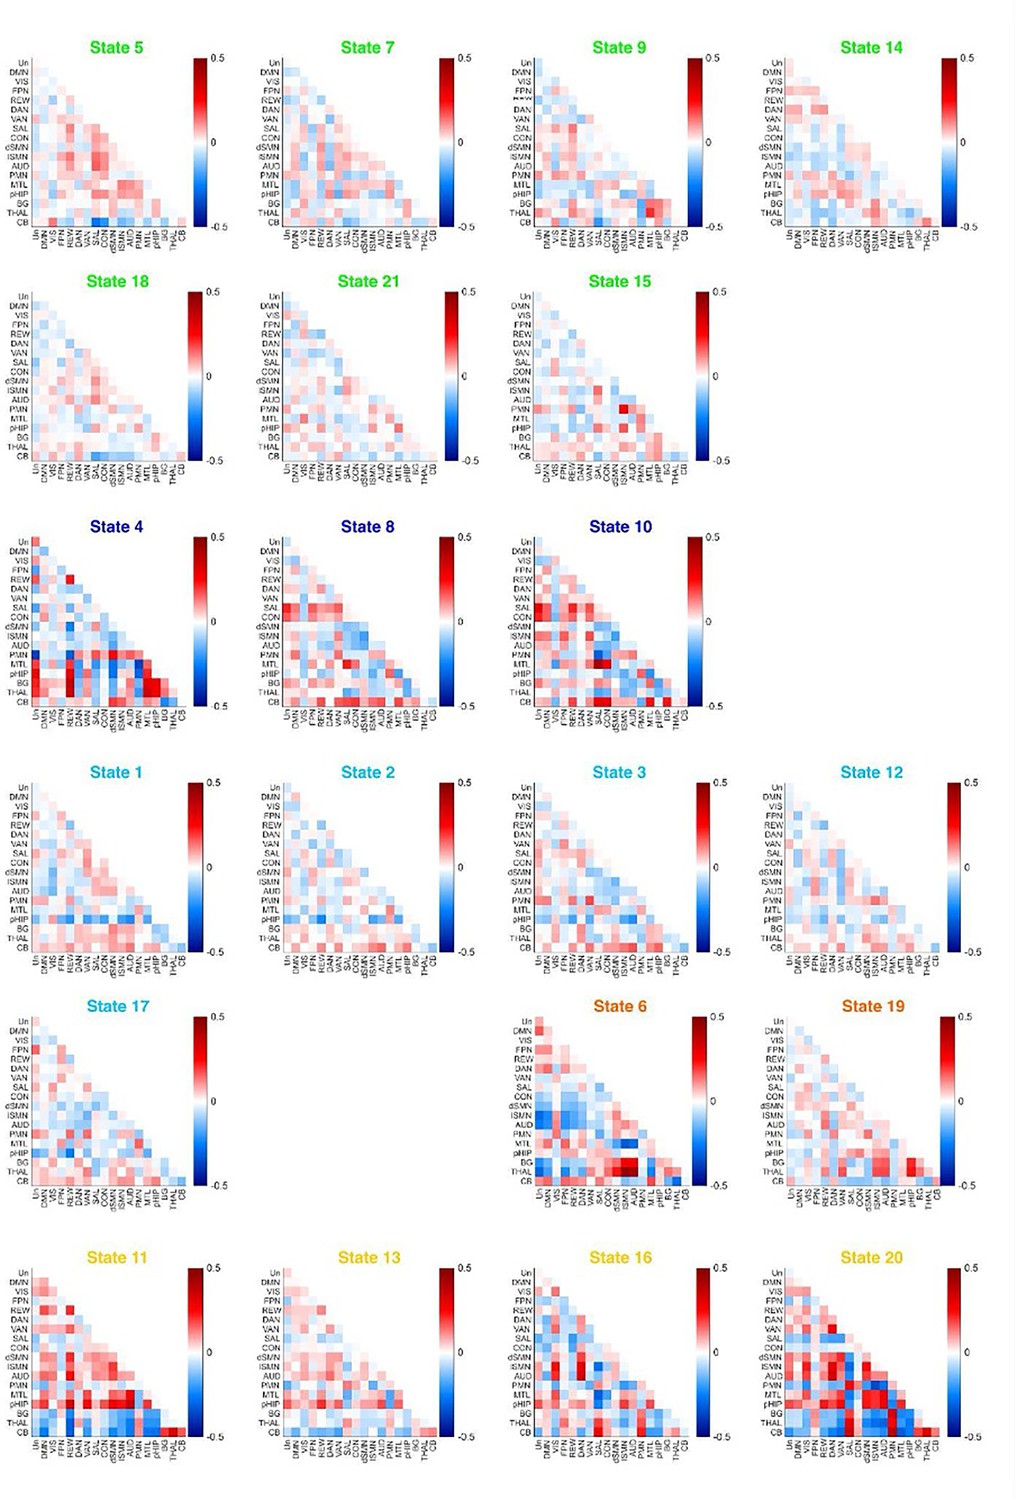
Functional connectivity (FC) patterns for each state relative to baseline averaged over all Hidden Markov model (HMM) states.
HMM states were color-coded based on modules (Green: light N2 module; Dark Blue: N3 module; Light Blue: deep N2 module; Orange: rapid eye movement (REM) module; Yellow: Wake Module). Notes: Y-axis from top to bottom or X-axis from left to right: Un: Undefined Network; DMN: Default Mode Network; VIS: Visual Network; FPN: Frontoparietal Network; REW: Reward Network; DAN: Dorsal Attention Network; VAN: Ventral Attention Network; SAL: Salience Network; CON: Cingulo-Opercular Network; dSMN: Somatomotor Dorsal Network; lSMN: Somatomotor Lateral Network; AUD: Auditory Network; PMN: ParietoMedial Network; MTL: Medial Temporal Network; pHIP: Posterior Hippocampus; BG: Basal Ganglia; THAL: Thalamus; CB: Cerebellar Cortex.
Figure 4—figure supplement 3
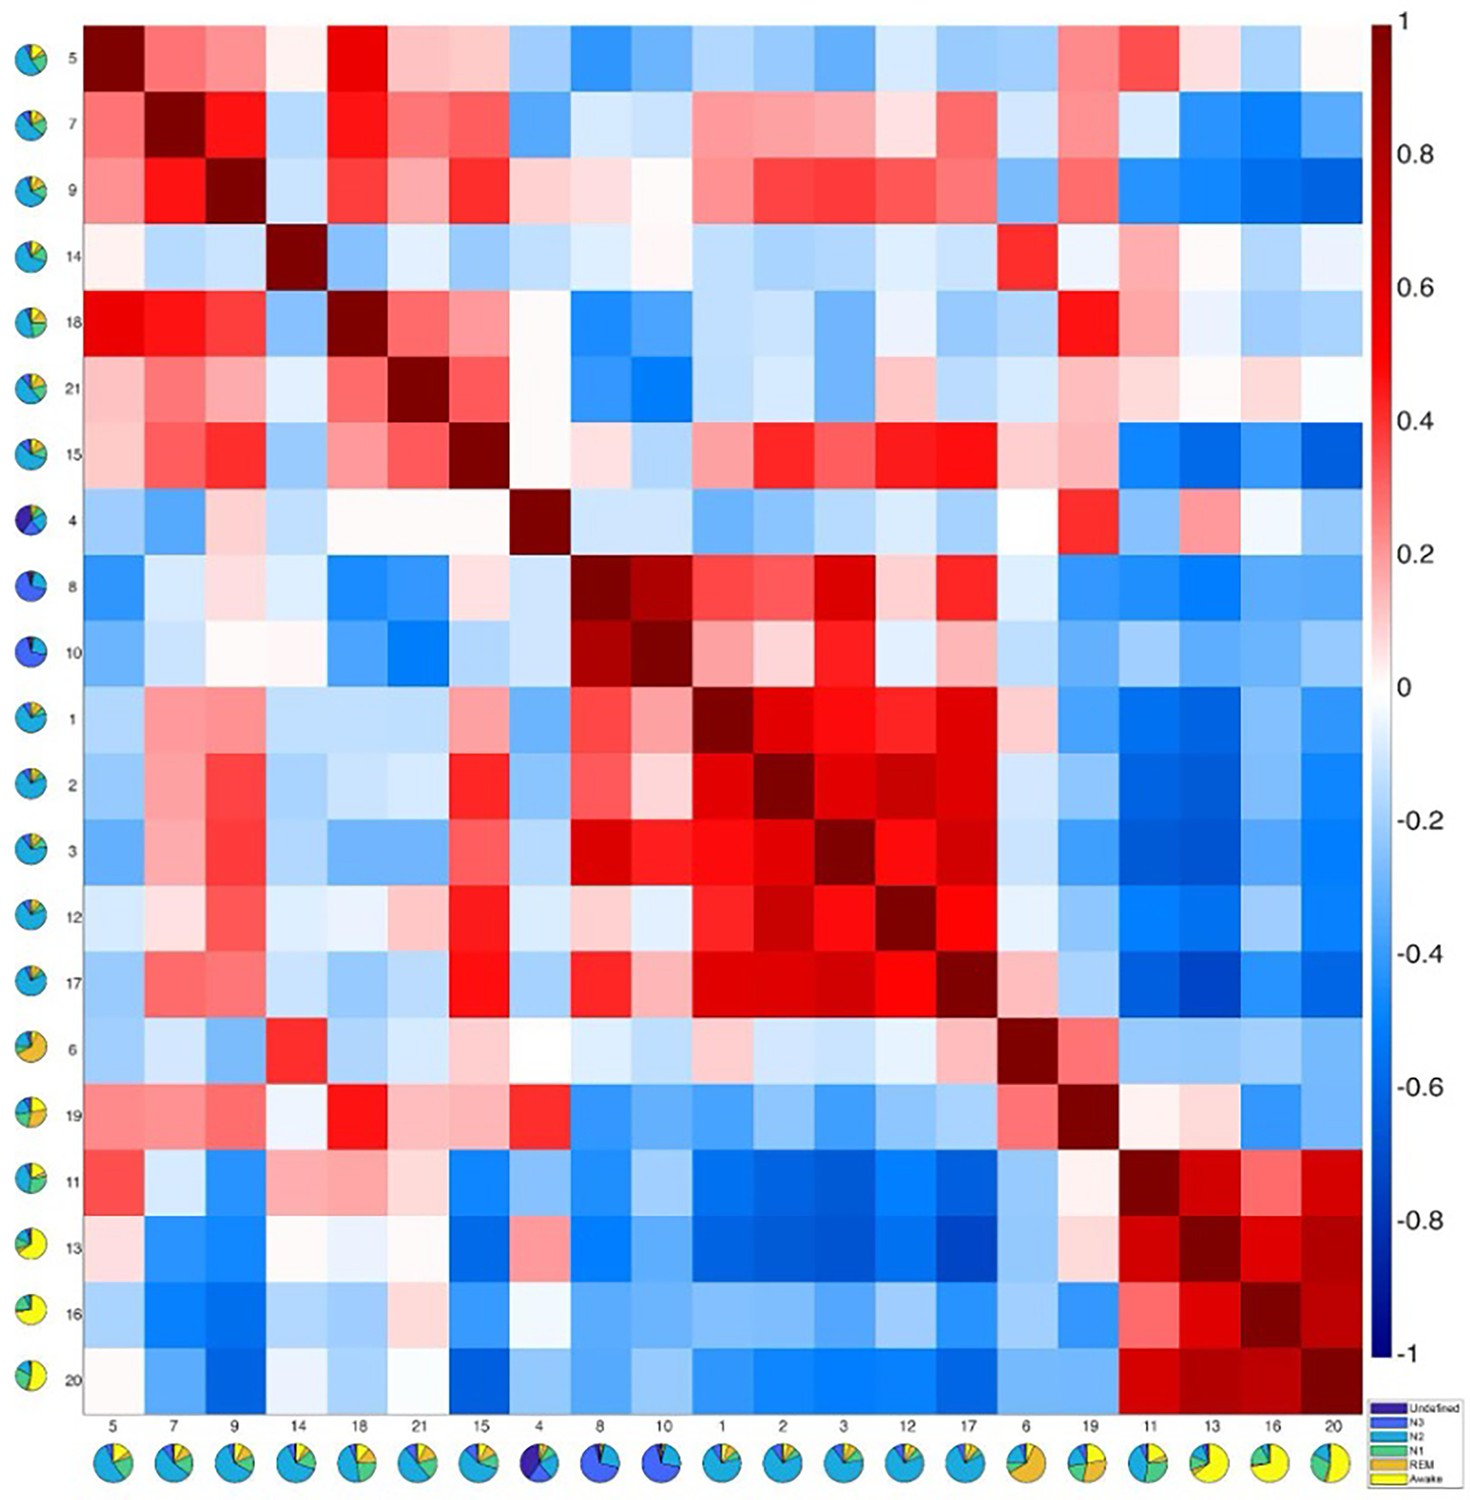
Correlation matrix between functional connectivity (FC) patterns of each pair of Hidden Markov model (HMM) states.
The color bar represents Pearson correlation coefficients. The figure depicts similar modules as the results of the modular analysis in Figure 3. For example, states within the Deep-N2 module (states 1, 2, 3, 12, and 17) are highly correlated to each other. These states also show a higher similarity with the N3 module compared to the states within the Light-N2 module (states 5, 7, 9, 18, 21, and 15, except for state 14, which might be due to high physiological variation associated with state 14, see Figure 2—figure supplements 1 and 2). Rapid eye movement (REM) states 6 and 19 correlated with each other. States within the Wake module (11, 13, 16, and 20) highly correlated with each other.
Additional files
Download links
A two-part list of links to download the article, or parts of the article, in various formats.
Downloads (link to download the article as PDF)
Open citations (links to open the citations from this article in various online reference manager services)
Cite this article (links to download the citations from this article in formats compatible with various reference manager tools)
Reproducible, data-driven characterization of sleep based on brain dynamics and transitions from whole-night fMRI
eLife 13:RP98739.
https://doi.org/10.7554/eLife.98739.3


