Nitric oxide modulates contrast suppression in a subset of mouse retinal ganglion cells
- Werner Reichardt Centre for Integrative Neuroscience, University of Tübingen, Germany
- Institute for Ophthalmic Research, University of Tübingen, Germany
- GRK 2381 ’cGMP: From Bedside to Bench’, University of Tübingen, Germany
- Institut de la Vision, Sorbonne Université, INSERM, CNRS, France
- Hertie Institute for AI in Brain Health, Tübingen AI Center, University of Tübingen, Germany
- Bernstein Center for Computational Neuroscience, University of Tübingen, Germany
Figures
Figure 1
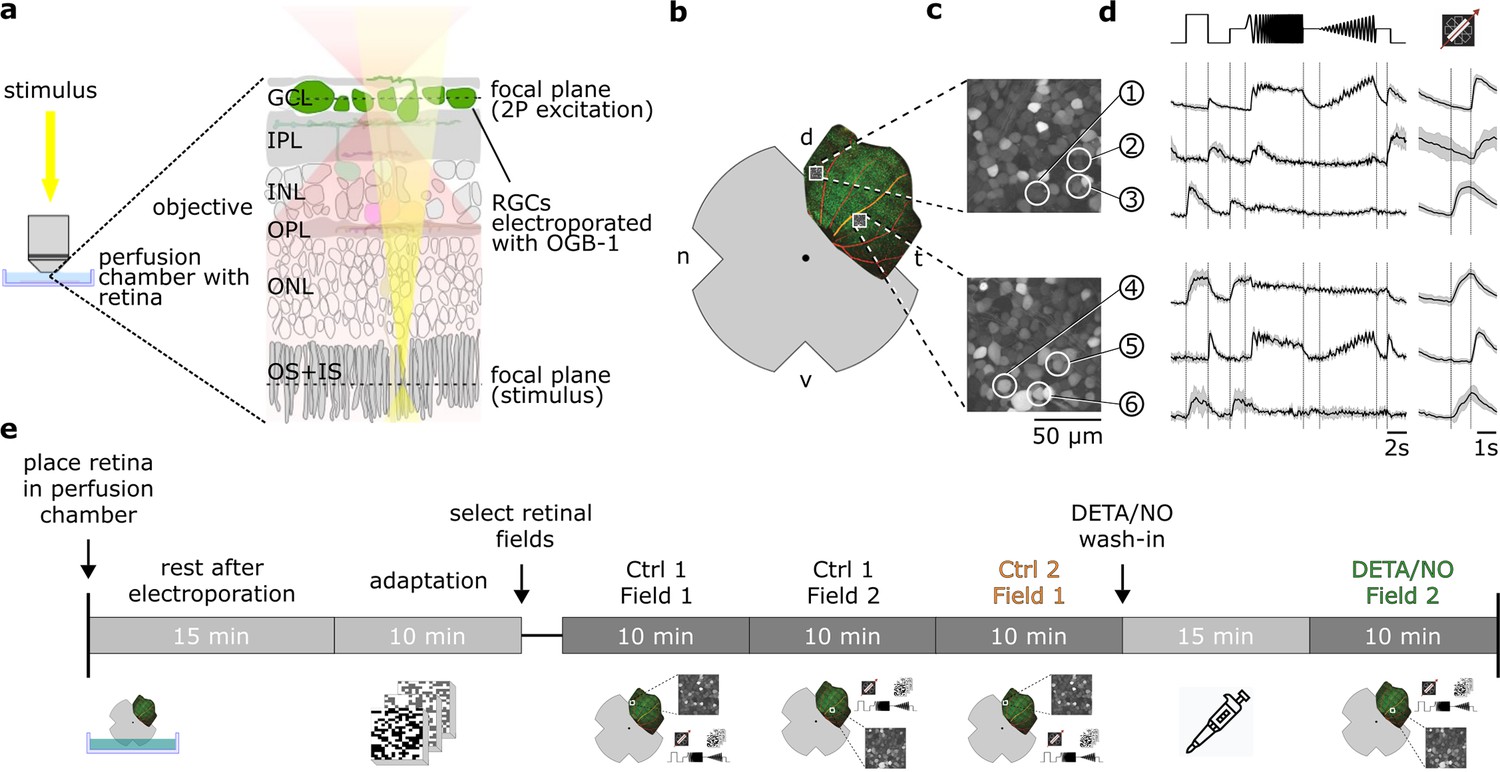
Overview of the experimental setup and recording procedure.
(a) Two-photon imaging of ganglion cell layer (GCL) somata in the whole-mounted ex vivo mouse retina. (b) Schematic ex vivo whole-mounted retina (dot marks optic disc; d, dorsal; t, temporal; v, ventral; n, nasal). (c) Two representative recording fields from (b) showing GCL somata loaded with Ca2+ indicator OGB-1 (Methods). (d) Representative Ca2+ activity from cells in the GCL (white circles in (c)) in response to chirp (left) and moving bar stimulus (right) (black, mean; gray, s.d.). (e) Timeline of experimental procedure; for details, see text. IPL, inner plexiform layer; INL, inner nuclear layer; OPL, outer plexiform layer; ONL, outer nuclear layer; OS + IS, outer and inner segments; DETA/NO, nitric oxide (NO) donor.
Figure 2 with 1 supplement
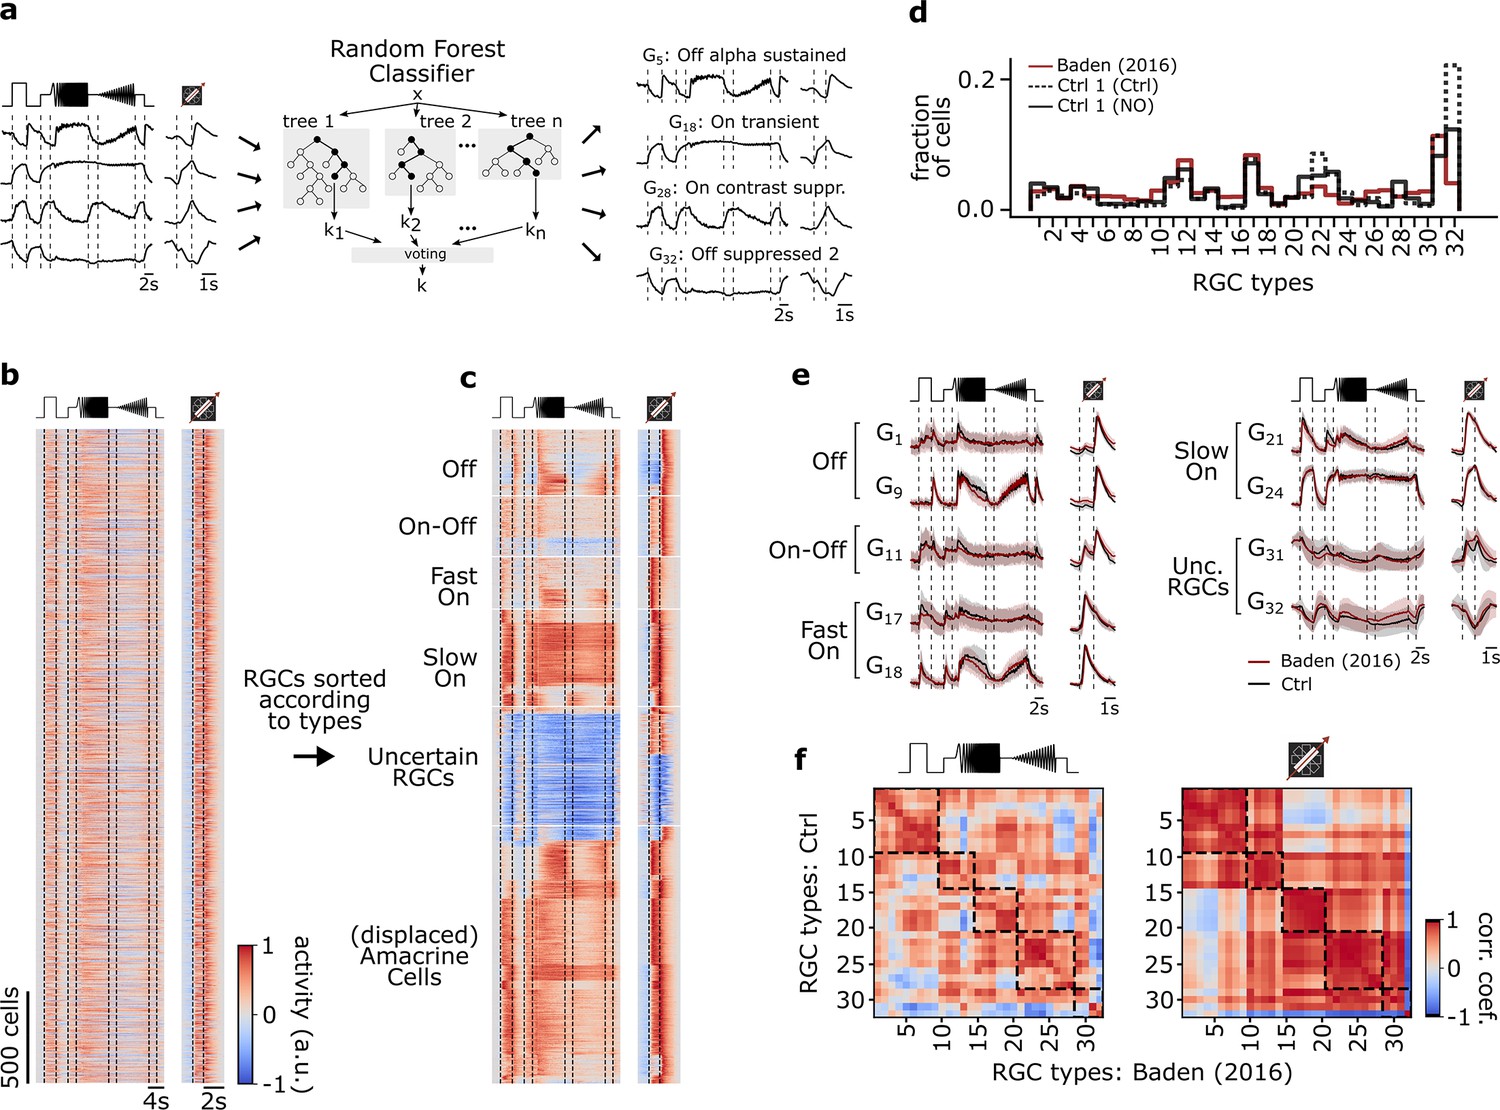
Functional classification of mouse retinal ganglion cell (RGC) types.
(a) Illustration of the random forest classifier (RFC) to predict cell-type labels for Ctrl 1 of both datasets. For each cell, Ca2+ responses to chirp and moving bar, soma size, and p-value of permutation test for direction selectivity (left) constitute the input to the RFC (center) to predict a cell-type label, i.e., a type GX (right). For details, see Methods and Qiu et al., 2022. (b) Pooled heat map of unsorted cell responses to chirp and moving bar stimulus from both Ctrl 1 datasets after quality filtering (QIMB>0.6 or QIchirp>0.45, and classifier confidence score ≥ 0.25). The color bar indicates normalized response activity. (c) Heat map from (b), but sorted according to their assigned type. (d) Distribution of RGC types predicted by the RFC classifier for both Ctrl 1 of the control- (Ctrl 1 (Ctrl); solid black), of DETA/NO-dataset (Ctrl 1 (NO); dotted black), and for the dataset from Baden et al., 2016 (red). (e) Representative RGC type response averages to chirp and moving bar (Ctrl, black; training dataset, red). (f) Correlation matrix of type mean responses per RGC type between Ctrl and Baden et al., 2016, dataset for chirp (left) and moving bar (right). Dashed boxes indicate functional groups (Off, On-Off, Fast On, Slow On, and Uncertain RGCs; see Baden et al., 2016). The color bar indicates the Pearson correlation coefficient.
Figure 2—figure supplement 1
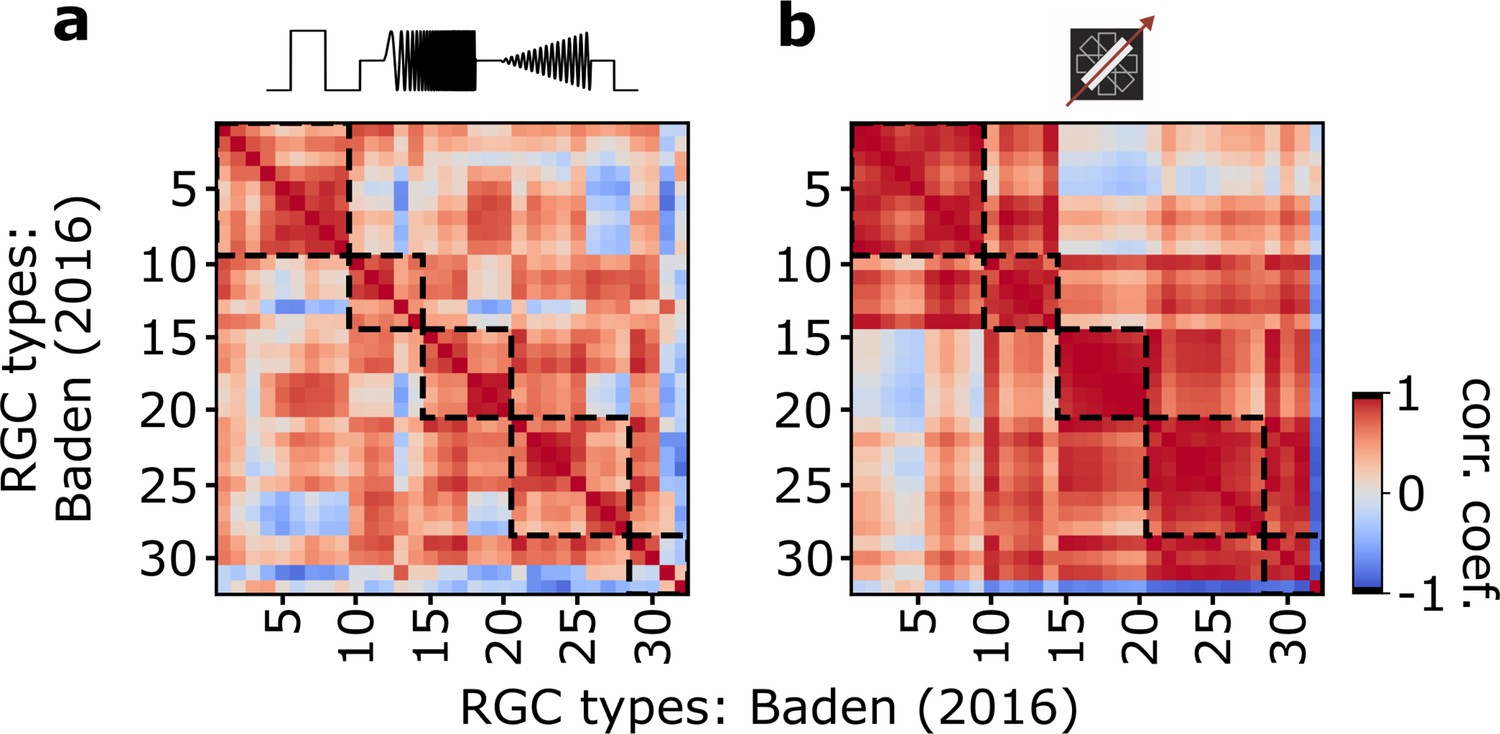
Autocorrelation matrix of Baden et al., 2016, dataset.
(a) Autocorrelation matrix of average type responses per retinal ganglion cell (RGC) types of the Baden et al., 2016, dataset for responses to the chirp stimulus. Dashed boxes indicate functional groups (Off, On-Off, Fast On, Slow On, and Uncertain RGCs). Color bar indicates Pearson correlation coefficient. (b) As (a), but in response to the moving bar stimulus.
Figure 3 with 2 supplements
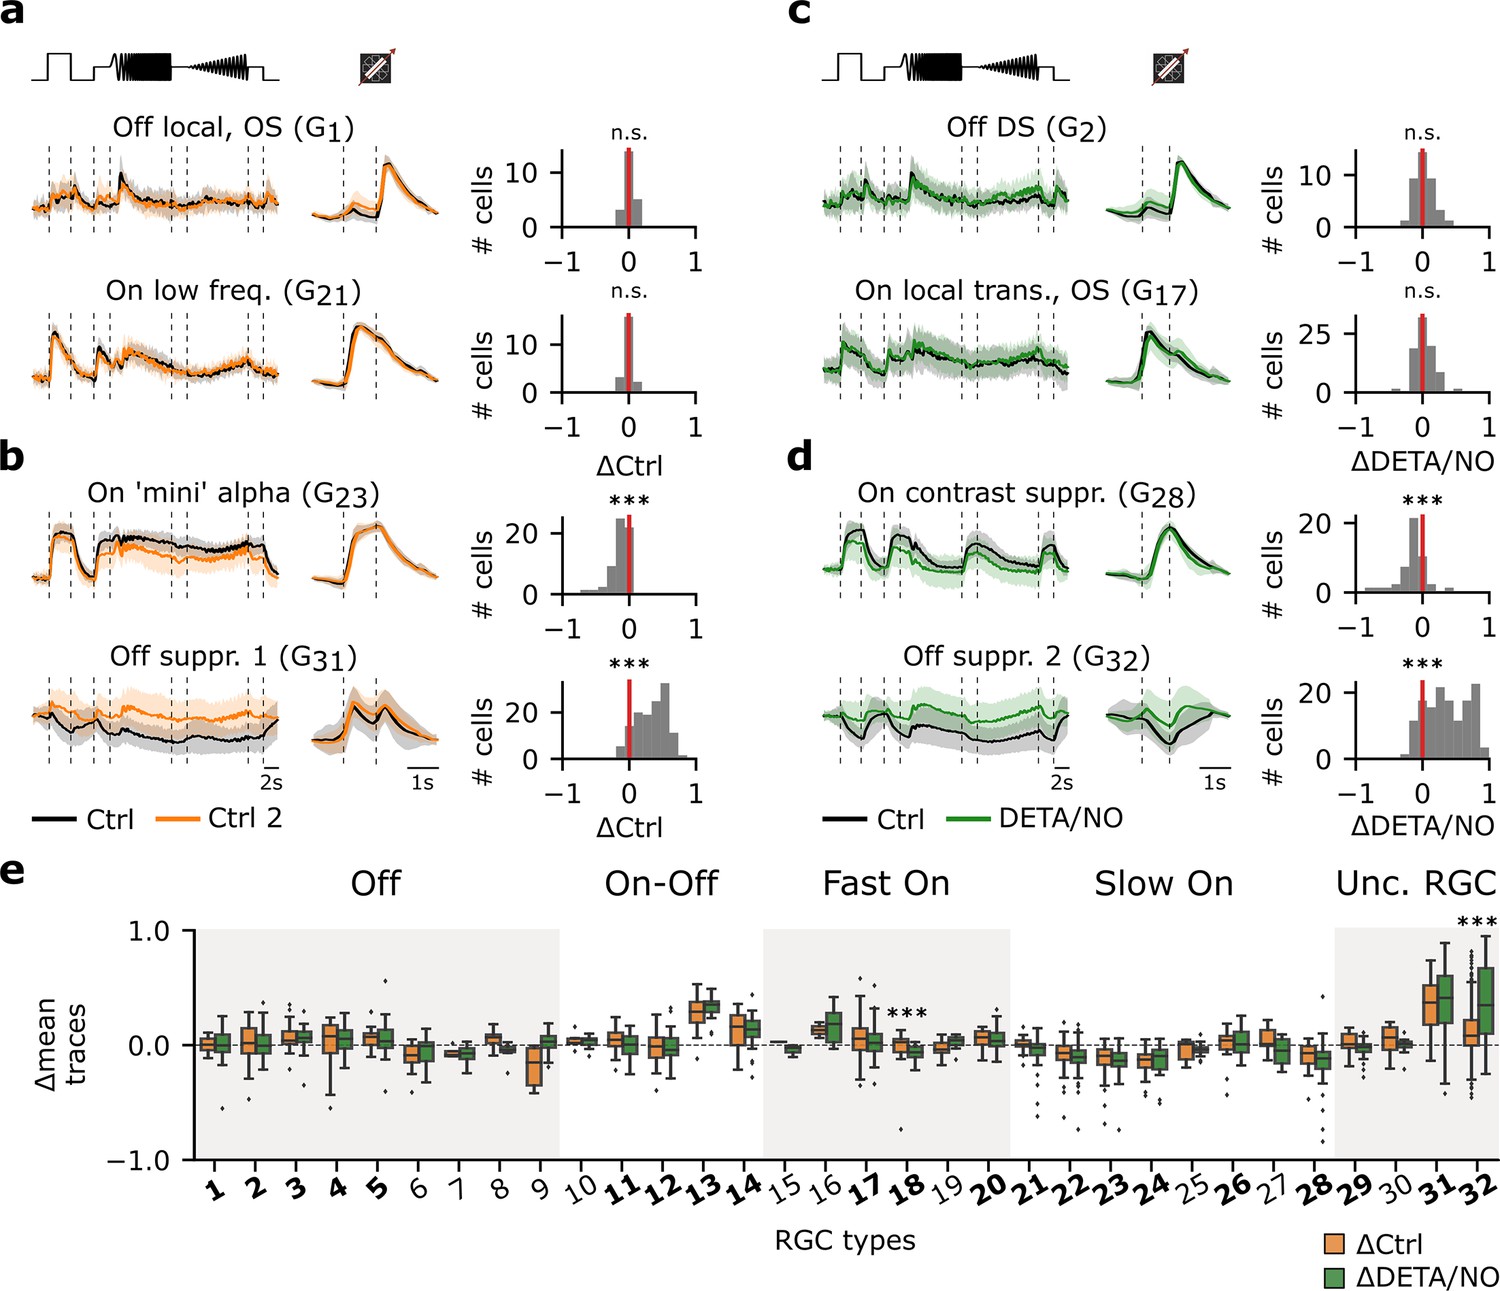
Certain retinal ganglion cell (RGC) types are affected by adaptational and/or nitric oxide (NO)-induced effects, while others are unaffected.
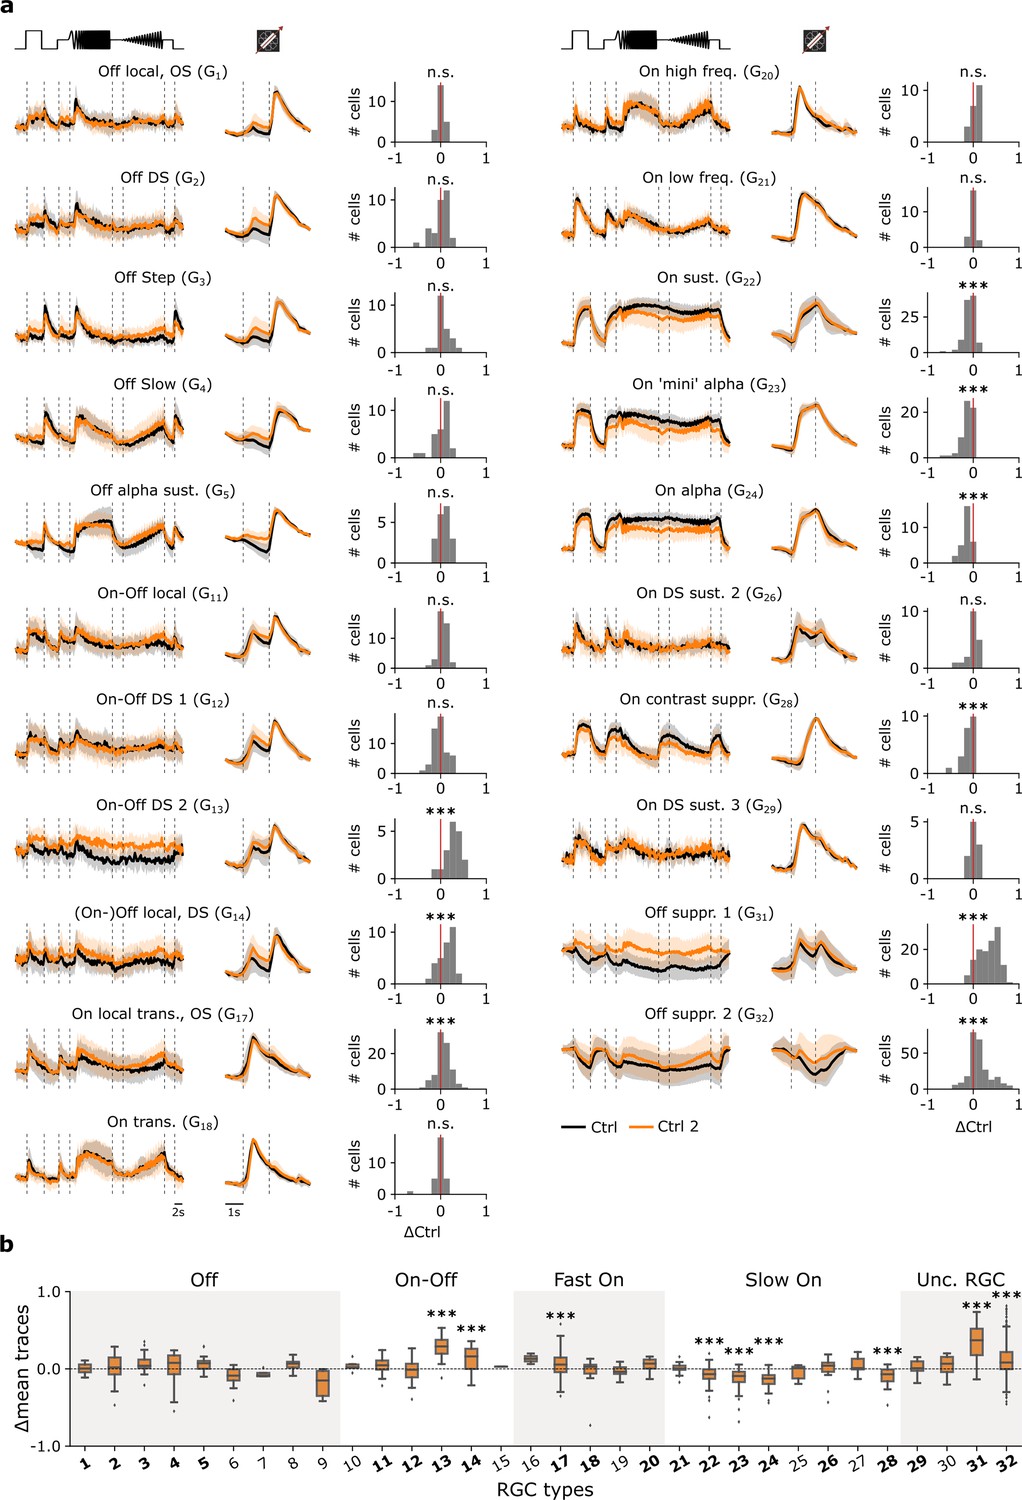
(a) Left: Two representative mean Ca2+ responses of sequentially recorded RGC types showing no differences between Ctrl 1 (black) and Ctrl 2 (orange) (top: G1; bottom: G21). Right: Corresponding histograms displaying the differences between the average traces of the sequentially recorded cell of the respective cell types. Zero indicates no difference between the response of the same cell across both recordings, whereas negative values indicate a decreased and positive values an increased activity. n.s.: not significant; ***: p<0.001; one-sample t-test. (b) Two representative RGC types that show decreased (top: G23) and increased (bottom: G31) response activity during Ctrl 2. n.s.: not significant; ***: p<0.001; one-sample t-test. (c) As in (a), but between sequentially recorded Ctrl 1 (black) and DETA/NO (green) (top: G2; bottom: G17). n.s.: not significant; ***: p<0.001; one-sample t-test. (d) As (c), but showing two cell types that display a decreased (top: G28) and increased (bottom: G32) activity when perfused with DETA/NO. n.s.: not significant; ***: p<0.001; one-sample t-test. (e) Box plots of trace differences of all sequentially recorded cells of all RGC types from control- (ΔCtrl: ΔRCtrl2-Ctrl1; orange) and NO-dataset (ΔDETA/NO: ΔRNO-Ctrl1; green). Bold numbers indicate RGC types with >10 sequentially recorded cells per dataset and condition. Dashed line shows zero baselines, i.e., no difference between traces. Diamond symbols represent outliers. Gray and white background blocks summarize the larger functional groups for better visualization (Off, On-Off, Fast On, Slow On, Uncertain RGCs). ***: p<0.001; Mann-Whitney U-test.
Figure 3—figure supplement 1
Adaptational, cell type-specific response changes without pharmacological perturbation.
(a) Mean Ca2+ responses of sequentially recorded retinal ganglion cell (RGC) types to the chirp (left) and moving bar (middle) to the Ctrl 1 (black) and Ctrl 2 (orange) conditions showing their trace differences (right). ***: p<0.001; one-sample t-test. (b) Box plots of trace differences of all sequentially recorded cells of all RGC types from control-dataset (Ctrl 1 and Ctrl 2; orange). Bold numbers indicate RGC types with n>10 sequentially recorded cells per condition. Dashed line shows zero baselines, i.e., no difference between traces. Gray and white background blocks summarize the larger functional groups for better visualization (Off, On-Off, Fast On, Slow On, Uncertain RGCs). ***: p<0.001; one-sample t-test.
Figure 3—figure supplement 2
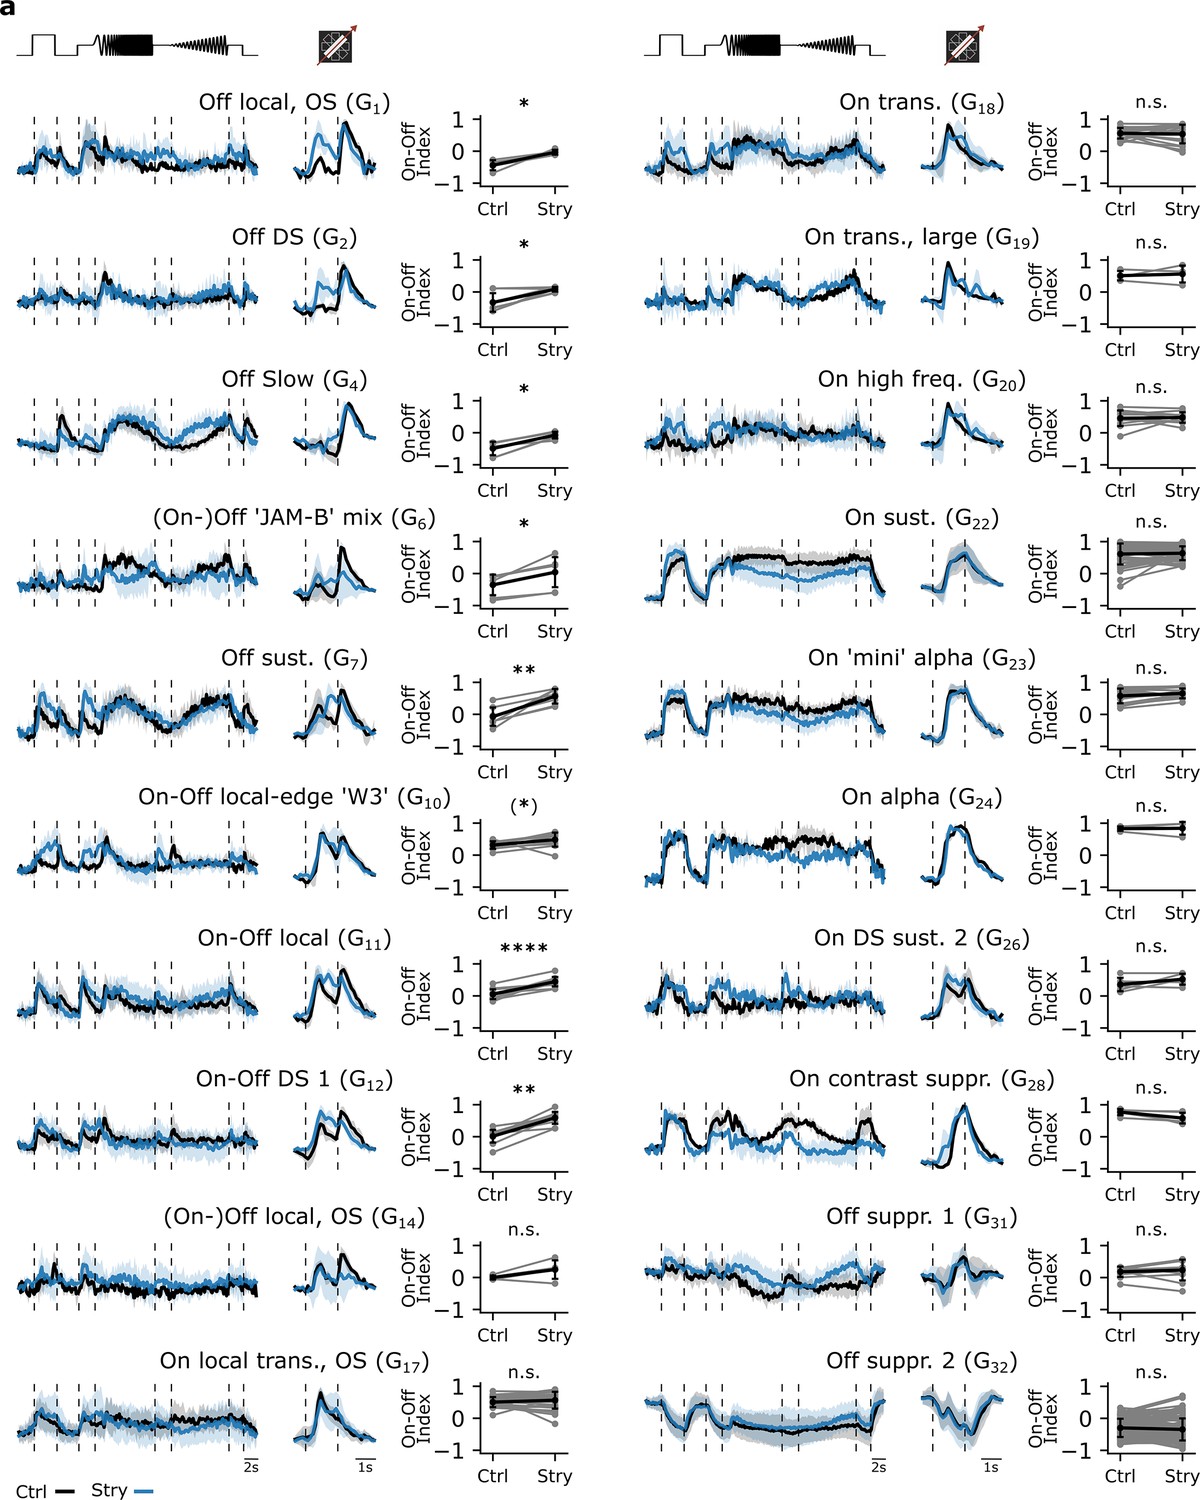
Testing the effects of strychnine on different retinal ganglion cell (RGC) type responses.
(a) Mean Ca2+ responses of sequentially recorded RGC types to the chirp (left) and moving bar (middle) to the Ctrl (black) and Strychnine (blue) conditions showing their corresponding On-Off indices for the Ctrl and Strychnine condition (right). RGC types with n>3 sequentially recorded cells per condition were included. ****: p<0.0001, ***: p<0.001, **: p<0.01, *: p<0.05, (*): p∼0.05; paired t-test.
Figure 4
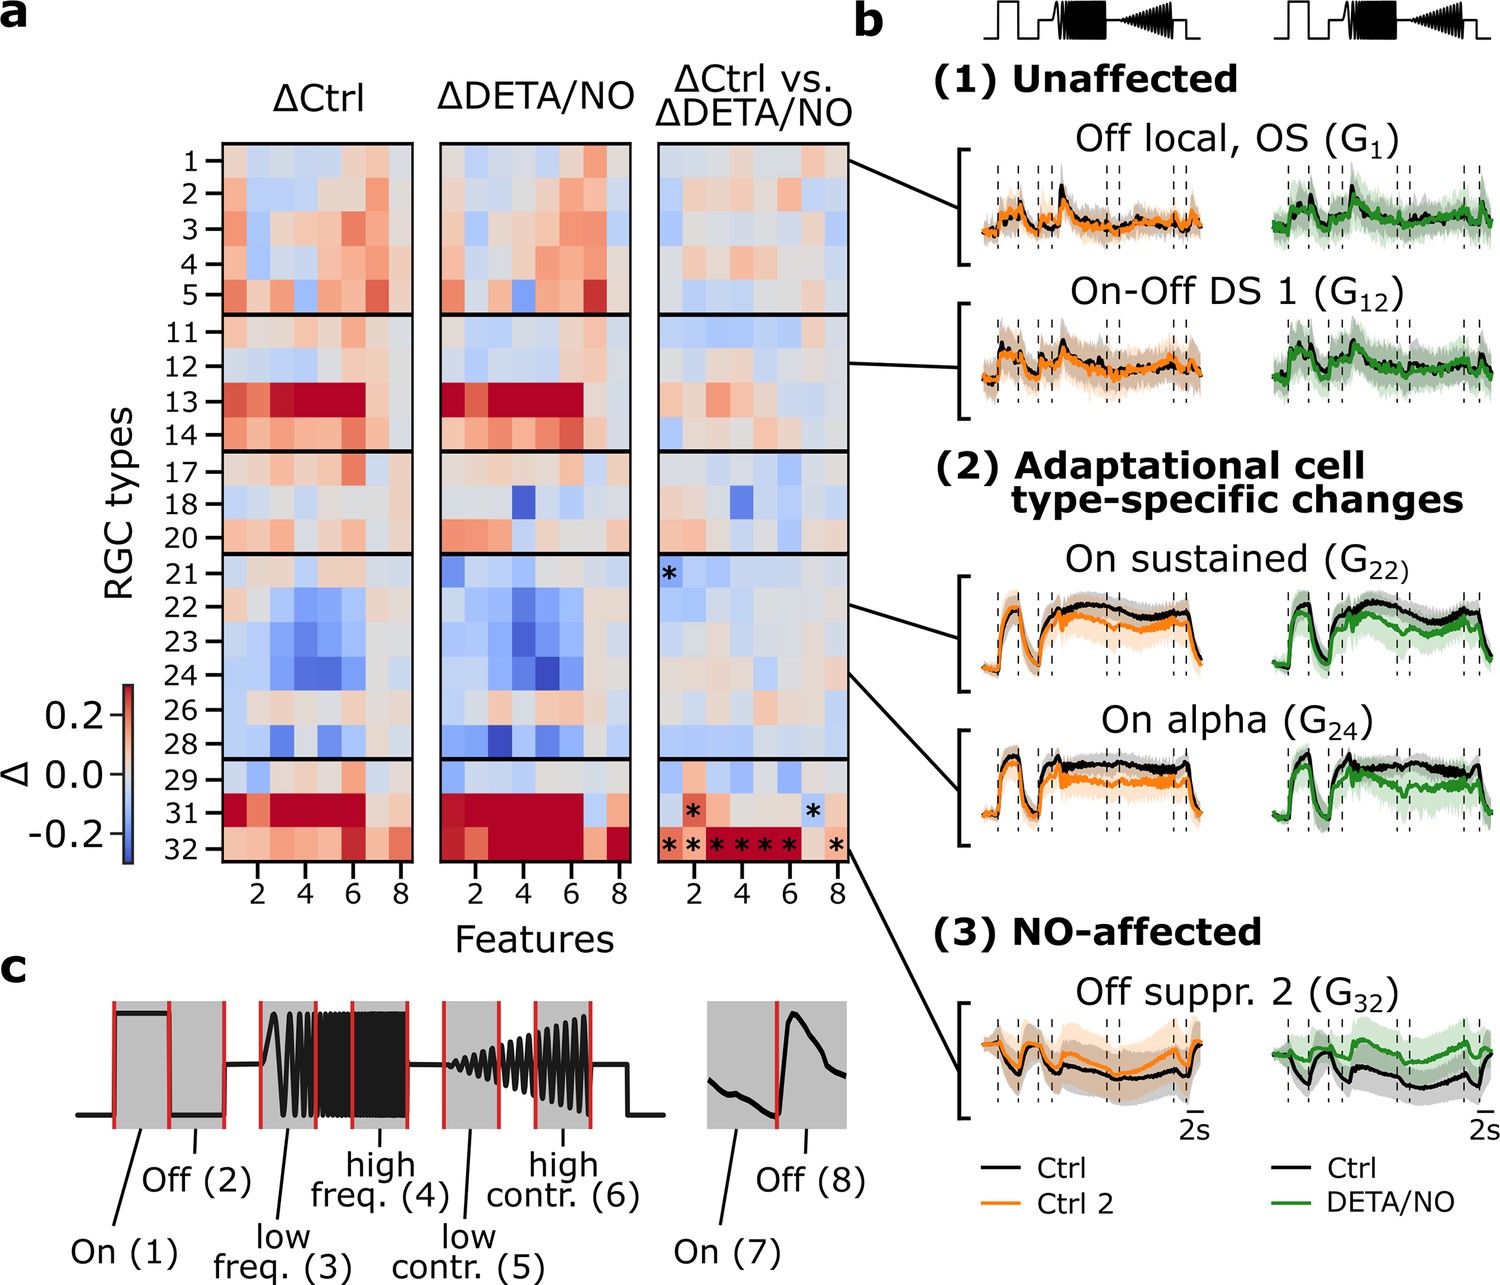
Disentangling nitric oxide (NO)-induced effects from adaptational response changes reveals type-specific NO modulation.
(a) Left: Difference between sequentially recorded Ctrl 2 and Ctrl 1 retinal ganglion cell (RGC) traces per type subdivided into eight features (ΔCtrl: ΔRCtrl2-Ctrl1). Color code indicates response increase (red), no change (white), and decrease (blue) for Ctrl 2. Middle: Difference between DETA/NO and Ctrl (ΔDETA/NO: ΔRNO-Ctrl1). Right: Difference between the two heat maps (ΔRNO-Ctrl1 - ΔRCtrl2-Ctrl1). Asterisks indicate significant differences of the trace differences of all cells per feature and per cell type between ΔCtrl and ΔDETA/NO using independent two-sided t-test and Bonferroni correction for multiple tests; *: p<0.0003. (b) Example chirp traces are categorized into unaffected (top two types: G1, G12), adaptational (two middle types: G22, G24), and NO-affected (bottom: G32). Left traces show exemplary responses per type from the control-dataset (black: Ctrl; orange: Ctrl 2) and NO-dataset (black: Ctrl; green: DETA/NO). (c) Subdividing the chirp (left) and moving bar (right) stimuli into eight features for detailed feature analysis. The chirp is subdivided into six features ((1) on, (2) off, (3) low frequency, (4) high frequency, (5) low contrast, and (6) high contrast); the moving bar into two ((7) on and (8) off).
Figure 5 with 1 supplement
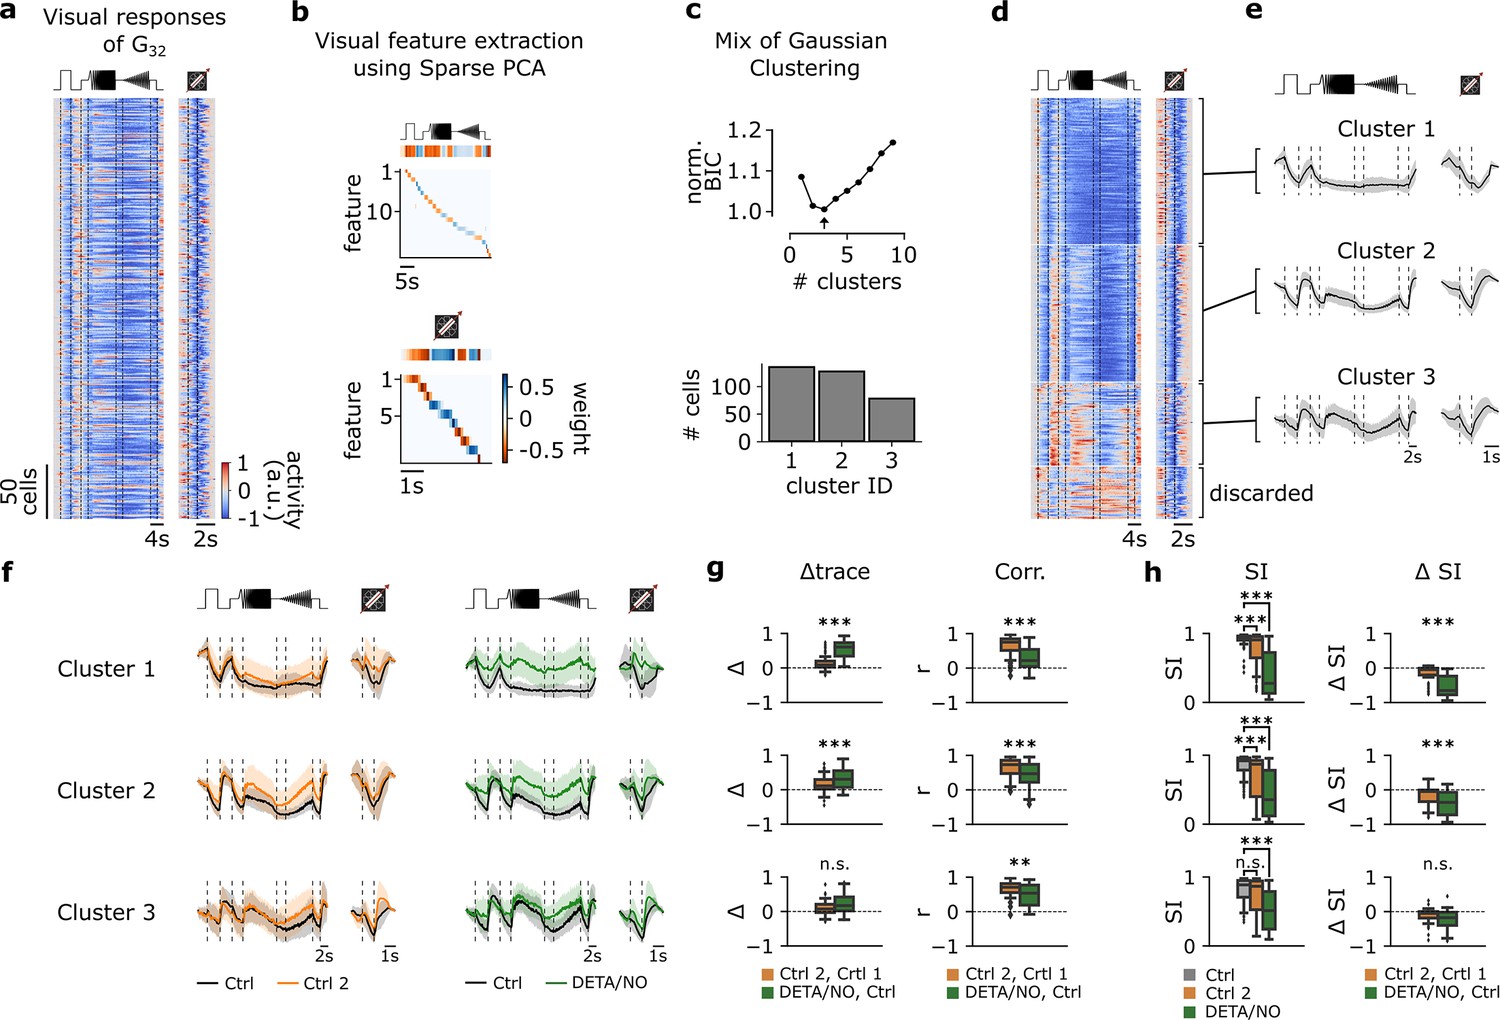
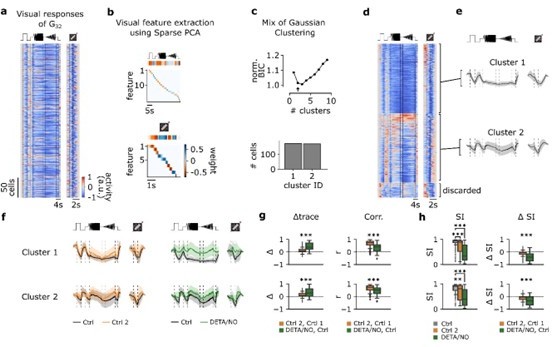
Functional clustering of the G32 reveals three distinct types that are differently affected by nitric oxide (NO).
(a) Visual responses of G32 cells recorded from several experiments in response to the full-field chirp (left) and moving bar (right) stimuli. (b) Visual features extracted from chirp (top) and moving bar (bottom) stimuli using sparse principal component analysis (PCA) on the responses. Color indicates the weight of each feature. (c) Top: Bayesian information criterion (BIC) as function of number of clusters. Arrow indicates the lowest BIC and the number of clusters to choose. Bottom: Number of cells per predicted cluster. (d) Cells sorted according to their assigned cluster. Cells at the bottom were discarded. (e) Mean responses of the three corresponding clusters for the chirp (left) and moving bar (right). (f) Left: Sequentially recorded mean responses of the three clusters to Ctrl 1 (black) and Ctrl 2 (orange). Right: Cluster mean responses to Ctrl 1 (black) and DETA/NO (green). (g) Left: Trace difference between Ctrl 2 and Ctrl 1 (orange) and DETA/NO and Ctrl (green) for the three clusters (clusters 1–3 from top to bottom). Right: Correlation coefficient between Ctrl 2 and Ctrl 1 (orange) and DETA/NO and Ctrl 1 (green) for the three clusters. n.s.: not significant; **: p<0.01, ***: p<0.001; independent t-test and Mann-Whitney U-test. (h) Left: Suppression index (SI) computed for Ctrl 1 (gray), Ctrl 2 (orange), and DETA/NO (green) for the three clusters. n.s.: not significant; **: p<0.01, ***: p<0.001; Kruskal-Wallis test and Dunnett’s test. Right: Difference of SI between Ctrl 2 and Ctrl 1 (orange) and DETA/NO and Ctrl 1 (green). n.s.: not significant; **: p<0.01, ***: p<0.001; independent t-test and Mann-Whitney U-test.
Figure 5—figure supplement 1
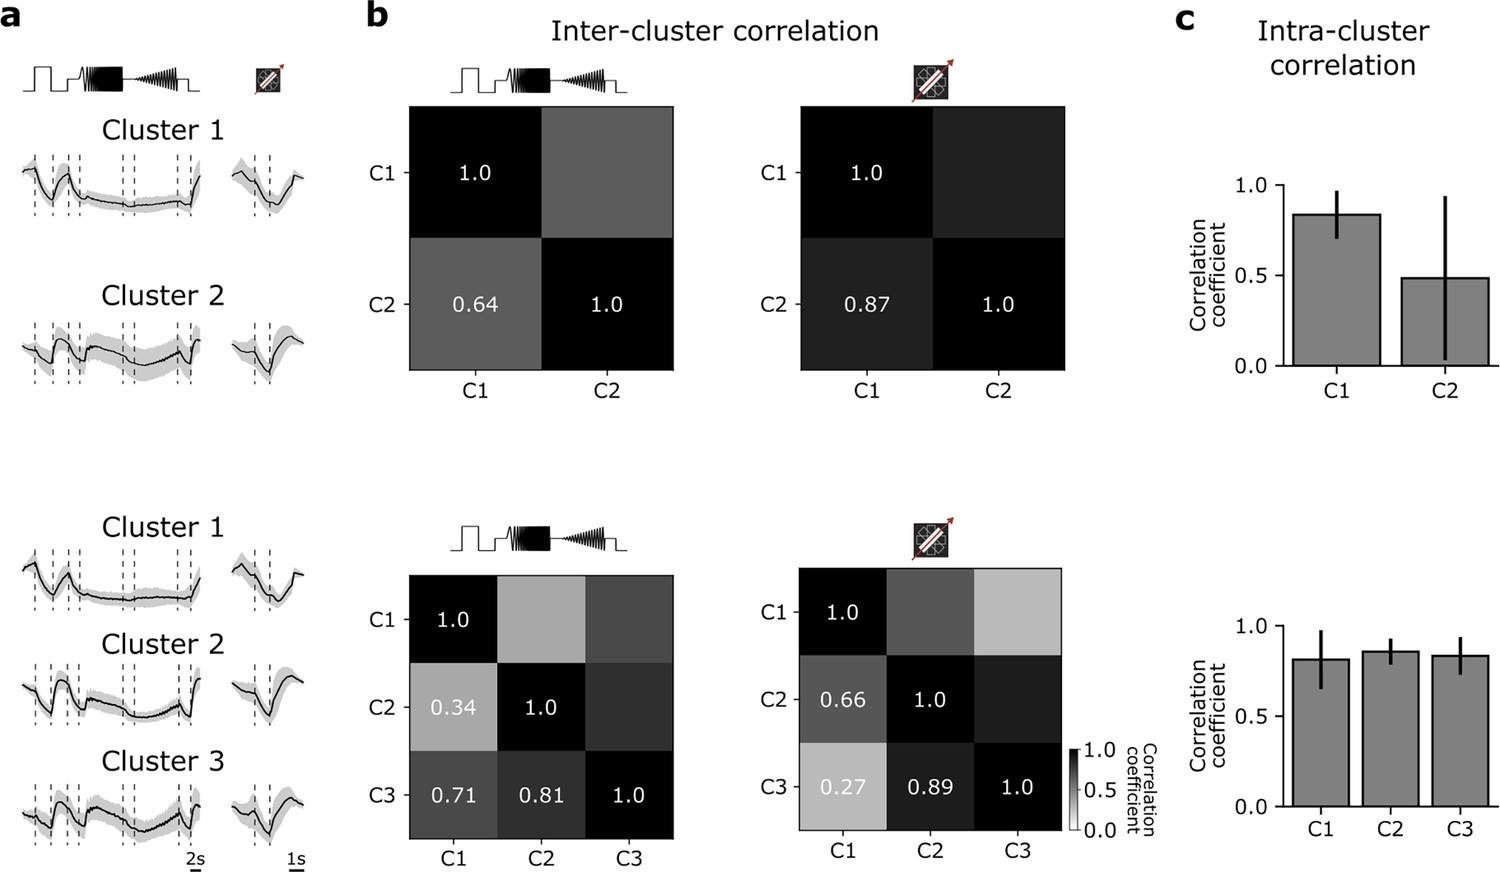
Further evaluation of the G32 functional clustering.
(a) Top: Mean response to the chirp (left) and moving bar (right) using n=2 clusters for the functional clustering. Bottom: Mean response to the chirp (left) and moving bar (right) using n=3 clusters for the functional clustering. (b) Top: Inter-cluster correlation matrix between the mean responses of cluster 1 and cluster 2 of the chirp (left) and moving bar (right) responses. Bottom: Same as ‘Top’, but for n=3 clusters. (c) Top: Mean intra-cluster correlation for n=2 clusters with s.d. Bottom: Mean intra-cluster correlation for n=3 clusters with s.d.
Figure 6
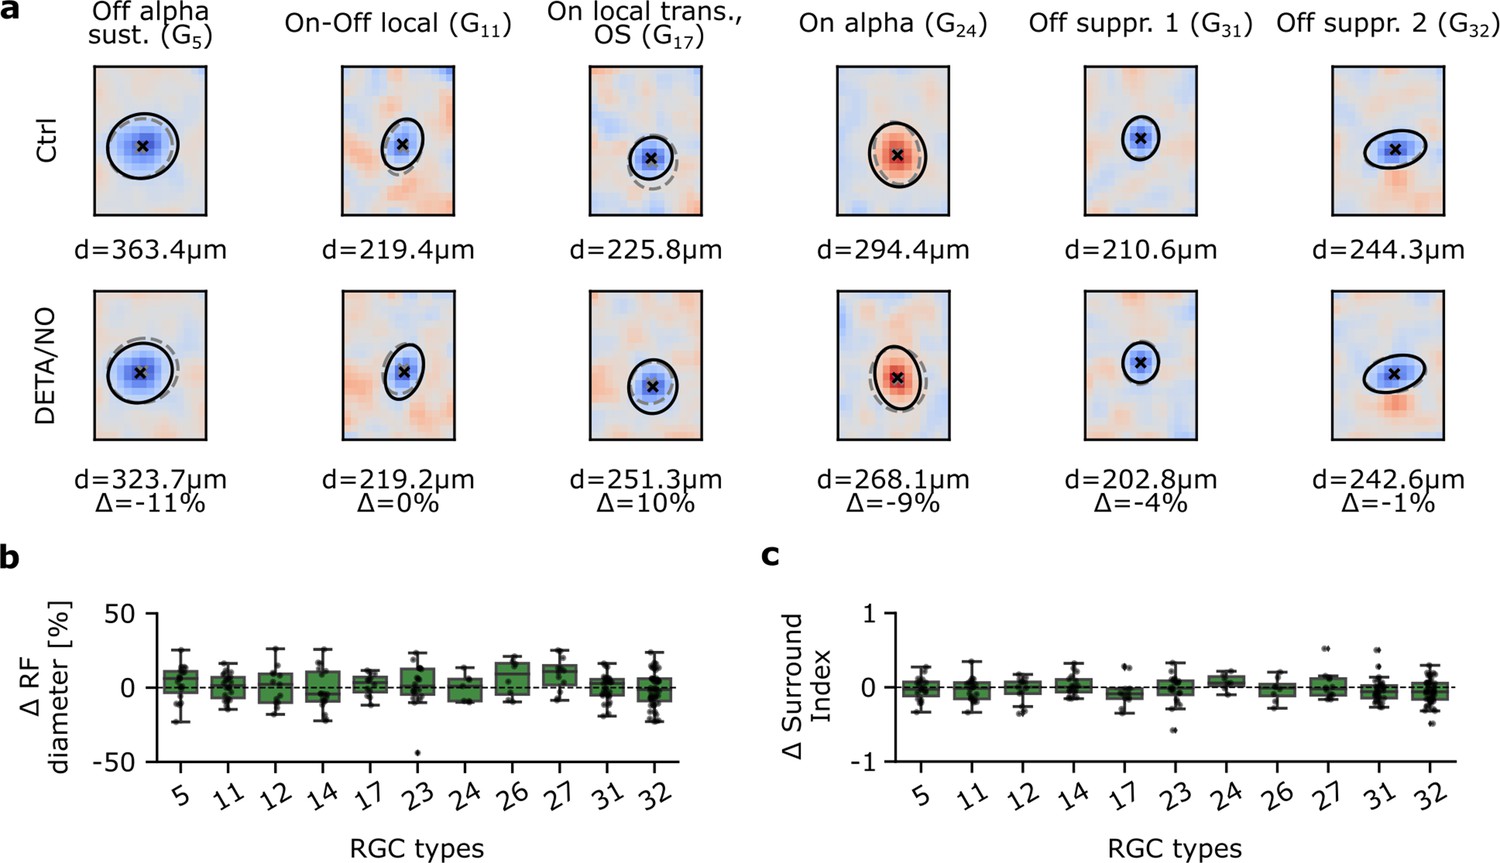
Spatial receptive fields (sRFs) are not affected by nitric oxide (NO) across various retinal ganglion cell (RGC) types.
(a) Representative estimated sRFs of six RGC types. Top: Estimated sRFs to Ctrl 1. Cross indicates RF center; solid line indicates outline of the Gaussian fit of the RF center; dashed outline indicates corresponding Gaussian fit of the same cell to DETA/NO. Bottom: Same as top, but of DETA/NO condition. (b) RF diameter difference in percentage between DETA/NO and Ctrl 1. Only types with more than five sequentially recorded cells were included. One-sample t-test. (c) Surround index difference between DETA/NO and Ctrl 1. Only types with more than five sequentially recorded cells were included. One-sample t-test.
Figure 7
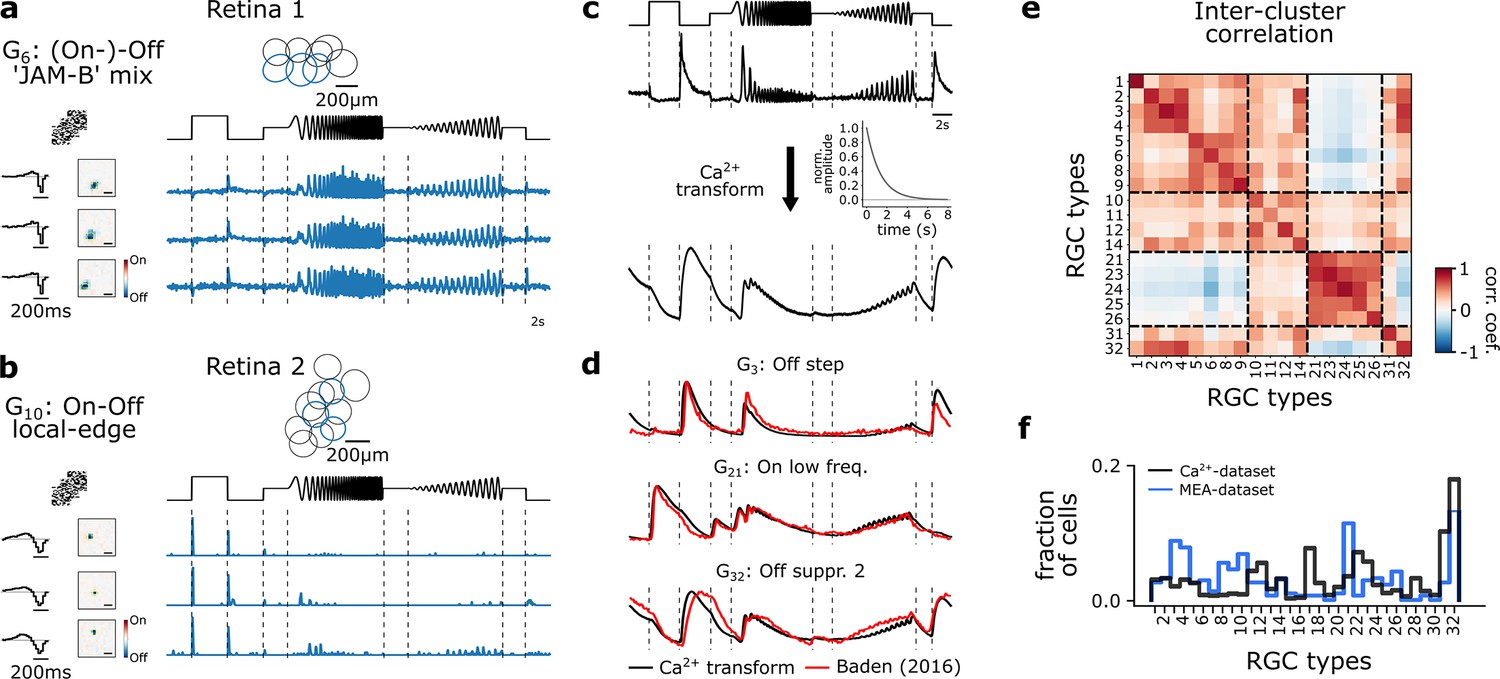
Multi-electrode recordings and pseudo-calcium transformation.
(a) Representative retinal ganglion cell (RGC) type, G6 ‘(On-)Off ’JAM-B’ mix, recorded from one retina forming a mosaic. Three exemplary response traces of the same type. Cells are indicated in the mosaic as blue. Left: tSTAs and sSTAs computed from their responses to a checkerboard stimulus. Right: peristimulus time histograms (PSTHs) to the chirp stimulus. (b) As (a), but displaying another type, G10 ‘On-Off local edge’. (c) Illustration of the transformation of PSTHs to pseudo-calcium traces using an OGB-1 filter described in Baden et al., 2016, to match and identify RGC types. (d) Overlay of representative mean responses of three RGC types of the Baden et al., 2016, dataset (red) and the assigned Ca2+-transformed (black) traces to the chirp stimulus. (e) Inter-cluster correlation matrix of PSTHs of each assigned RGC type within a group with its group mean. Only types with n>5 cells per type were included. Dashed boxes indicate functional groups (Off, On-Off, Slow On, and Uncertain RGCs; see Baden et al., 2016). Color bar indicates Pearson correlation coefficient. (f) Comparison of the distribution of predicted RGC types between the MEA- (blue) and Ca2+-datasets (black).
Figure 8 with 3 supplements
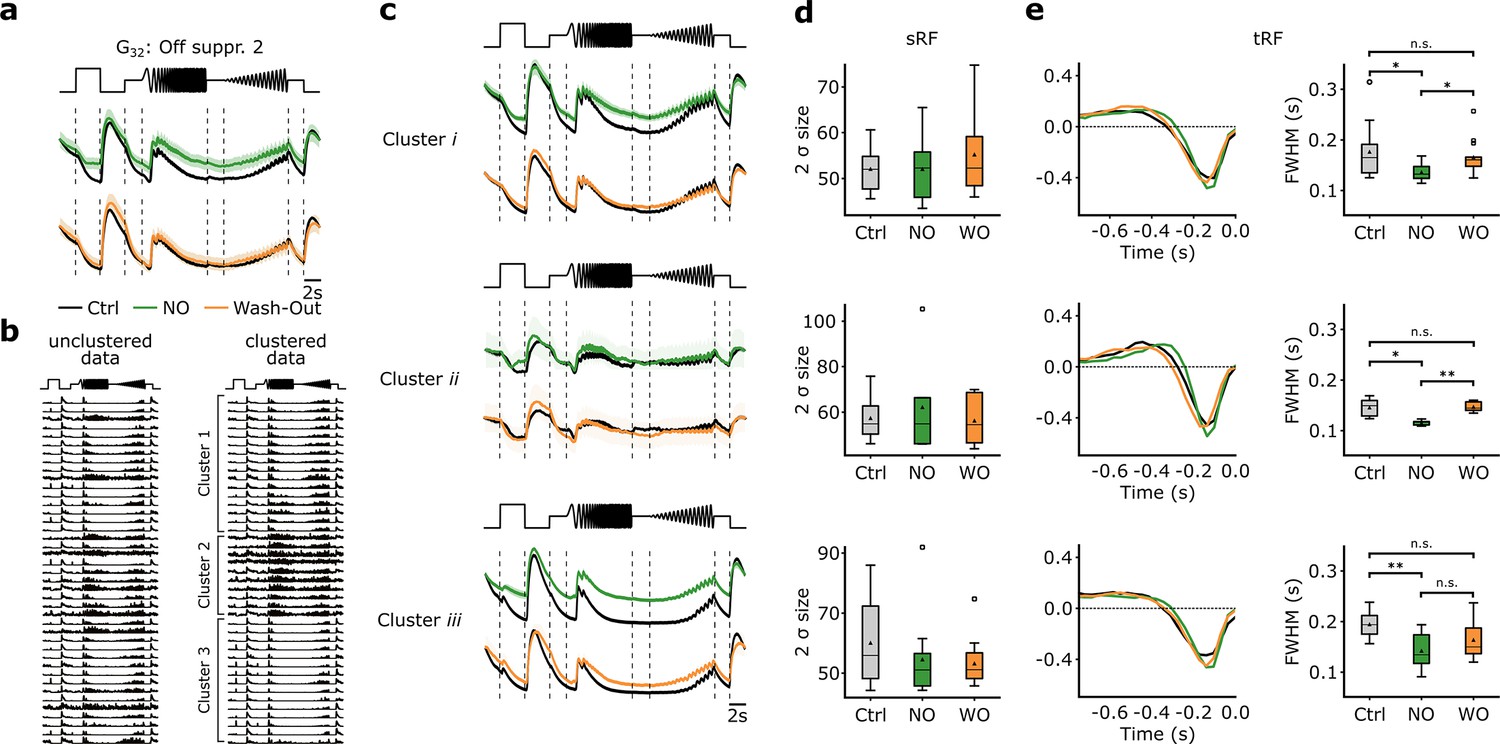
Nitric oxide (NO) only affects temporal features of three distinct clusters of G32.
(a) Mean Ca2+-transformed responses to the chirp of the retinal ganglion cell (RGC) type G32. Top: Sequentially recorded RGC responses to the Ctrl (black) and DETA/NO (green) conditions. Bottom: Sequentially recorded RGC responses to the Ctrl (black) and Wash-Out (orange) conditions after DETA/NO application. (b) Left: Unclustered peristimulus time histograms (PSTHs) of cells assigned to type G32. Right: Cell’s PSTHs were clustered and sorted into three distinct clusters. (c) Sequentially recorded mean responses of three clusters to Ctrl (black), DETA/NO (green), and Wash-Out (orange). (d) Ellipse size of the fitted Gaussian of the spatial receptive field (sRF) of the three conditions (Ctrl: black; DETA/NO: green; Wash-Out: orange) for the three clusters (clusters i–iii; top to bottom). All tested conditions were not significant; two-sided t-test. (e) Left: temporal receptive field (tRF) kernels of the three conditions (Ctrl: black; DETA/NO: green; Wash-Out: orange) for three clusters (clusters i–iii; top to bottom). Right: Full width at half minimum (FWHM) of the temporal RF kernels of the three conditions (Ctrl: black; DETA/NO: green; Wash-Out: orange) for the three clusters. *: p<0.05; **: p<0.01, repeated measures ANOVA and Dunnett’s test.
Figure 8—figure supplement 1
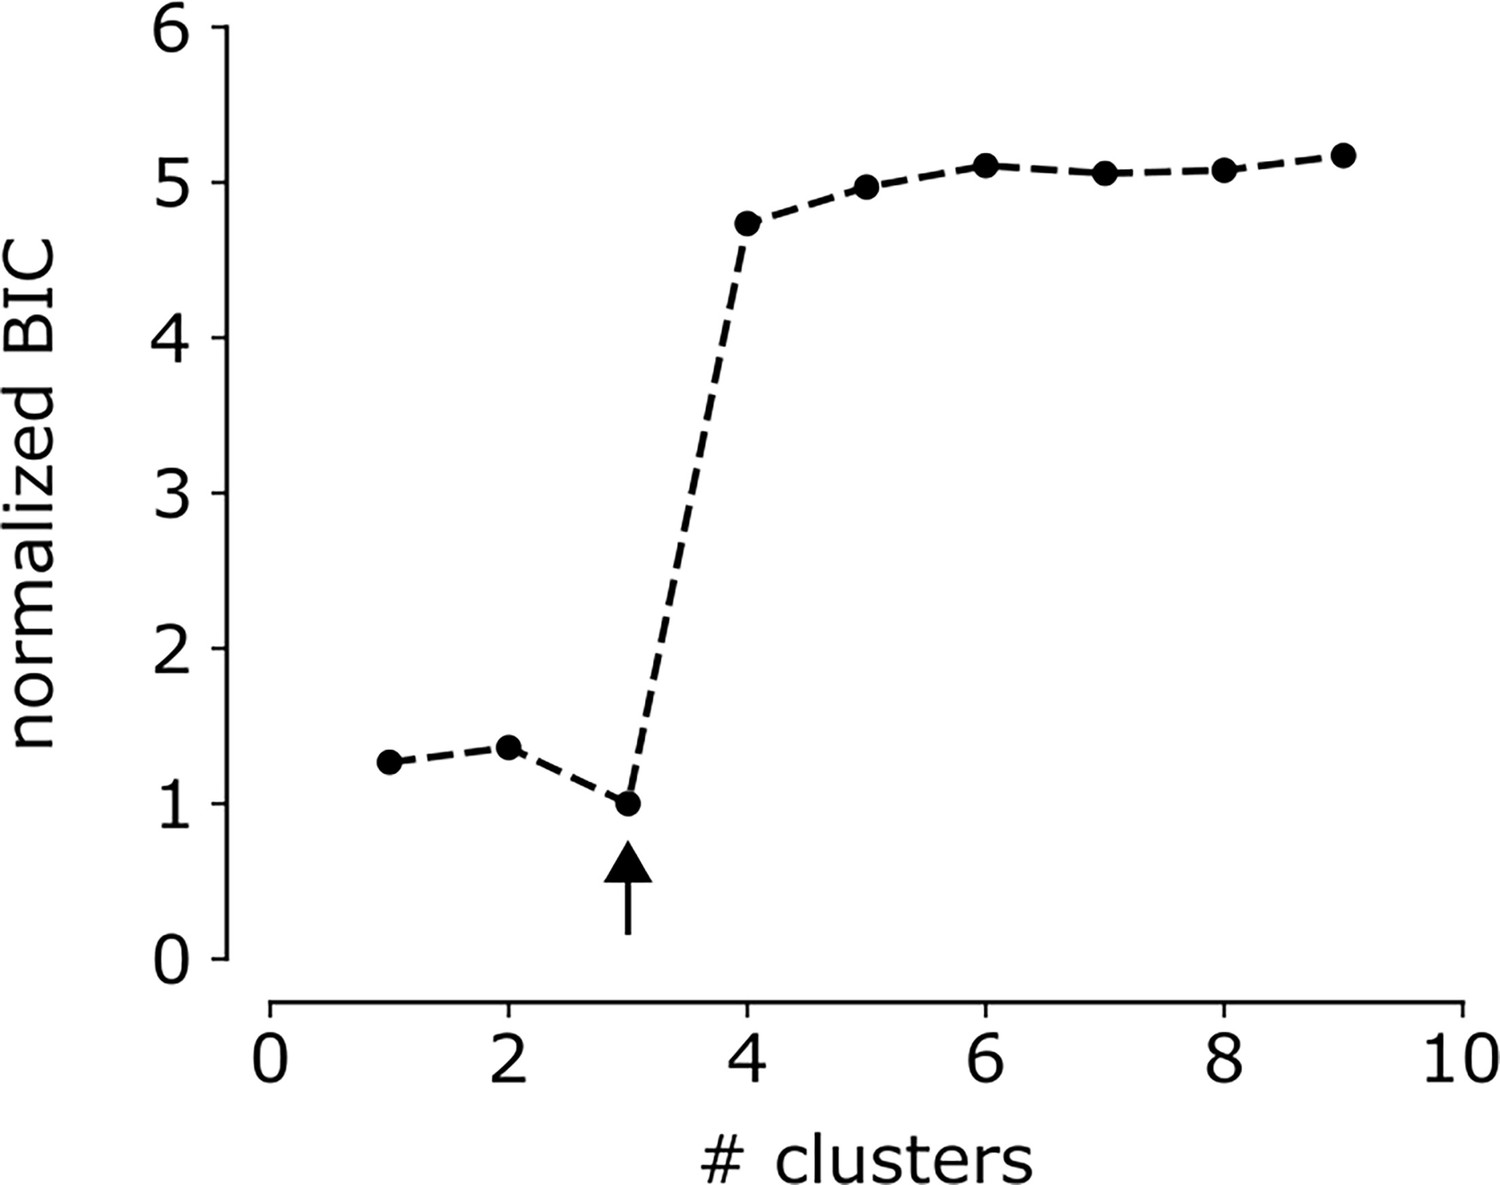
Bayesian information criterion (BIC) as a function of number of clusters for G32 in the multi-electrode array (MEA)-dataset.
BIC as function of number of clusters for the G32 identified in the MEA-dataset. Arrow indicates the lowest BIC and the number of clusters to choose.
Figure 8—figure supplement 2
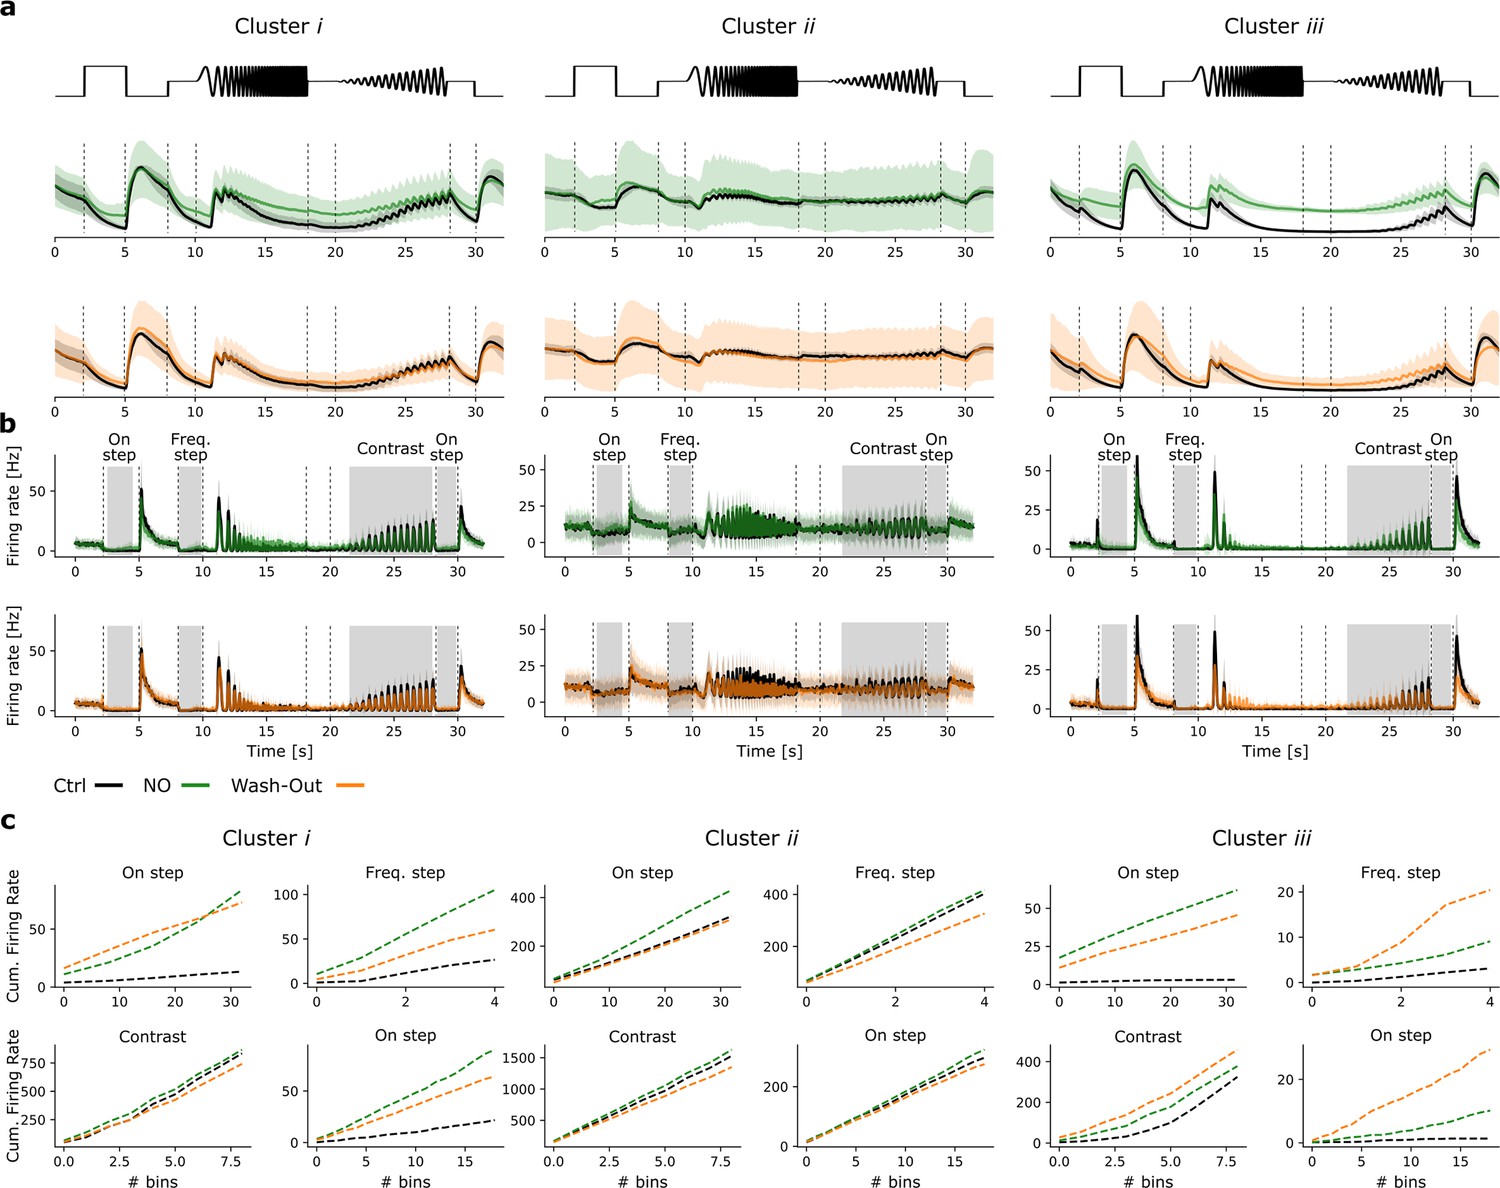
Pseudo-calcium and peristimulus time histograms of G32 clusters.
(a) Pseudo-calcium traces of clusters i–iii (left to right) in response to the chirp under Ctrl (black) and nitric oxide (NO) (green; top) as well as Ctrl and Wash-Out (orange; bottom) conditions. (b) Same clusters and conditions as (a), but peristimulus time histograms. (c) Cumulative firing rates of clusters i–iii (left to right) for the three conditions for four features (On step, Freq. step, Contrast, last On step).
Figure 8—figure supplement 3
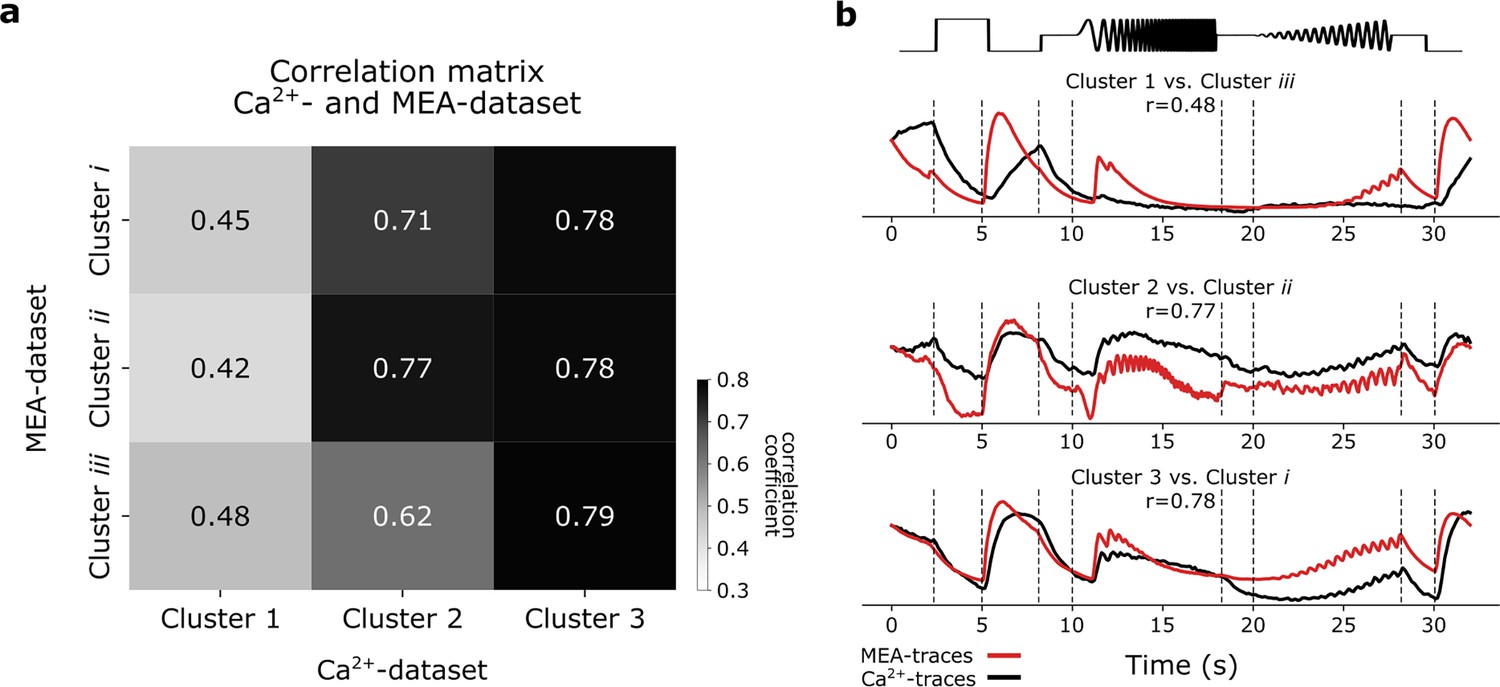
Correlating G32 clusters of the Ca2+-dataset and multi-electrode array (MEA)-dataset.
(a) Correlation matrix showing the correlation coefficients between the pseudo-calcium G32 cluster responses to the chirp and the Ca2+-dataset G32 clusters. Color bar indicates Pearson correlation coefficients. (b) Pseudo-calcium traces of G32 clusters (red) overlaid with the correlated Ca2+ G32 cluster traces (black).
Author response image 1
Additional files
Download links
A two-part list of links to download the article, or parts of the article, in various formats.
Downloads (link to download the article as PDF)
Open citations (links to open the citations from this article in various online reference manager services)
Cite this article (links to download the citations from this article in formats compatible with various reference manager tools)
Nitric oxide modulates contrast suppression in a subset of mouse retinal ganglion cells
eLife 13:RP98742.
https://doi.org/10.7554/eLife.98742.3


