The Jag2/Notch1 signaling axis promotes sebaceous gland differentiation and controls progenitor proliferation
- Department of Discovery Oncology, Genentech, United States
- Department of Research Pathology, Genentech, United States
Figures
Figure 1 with 1 supplement
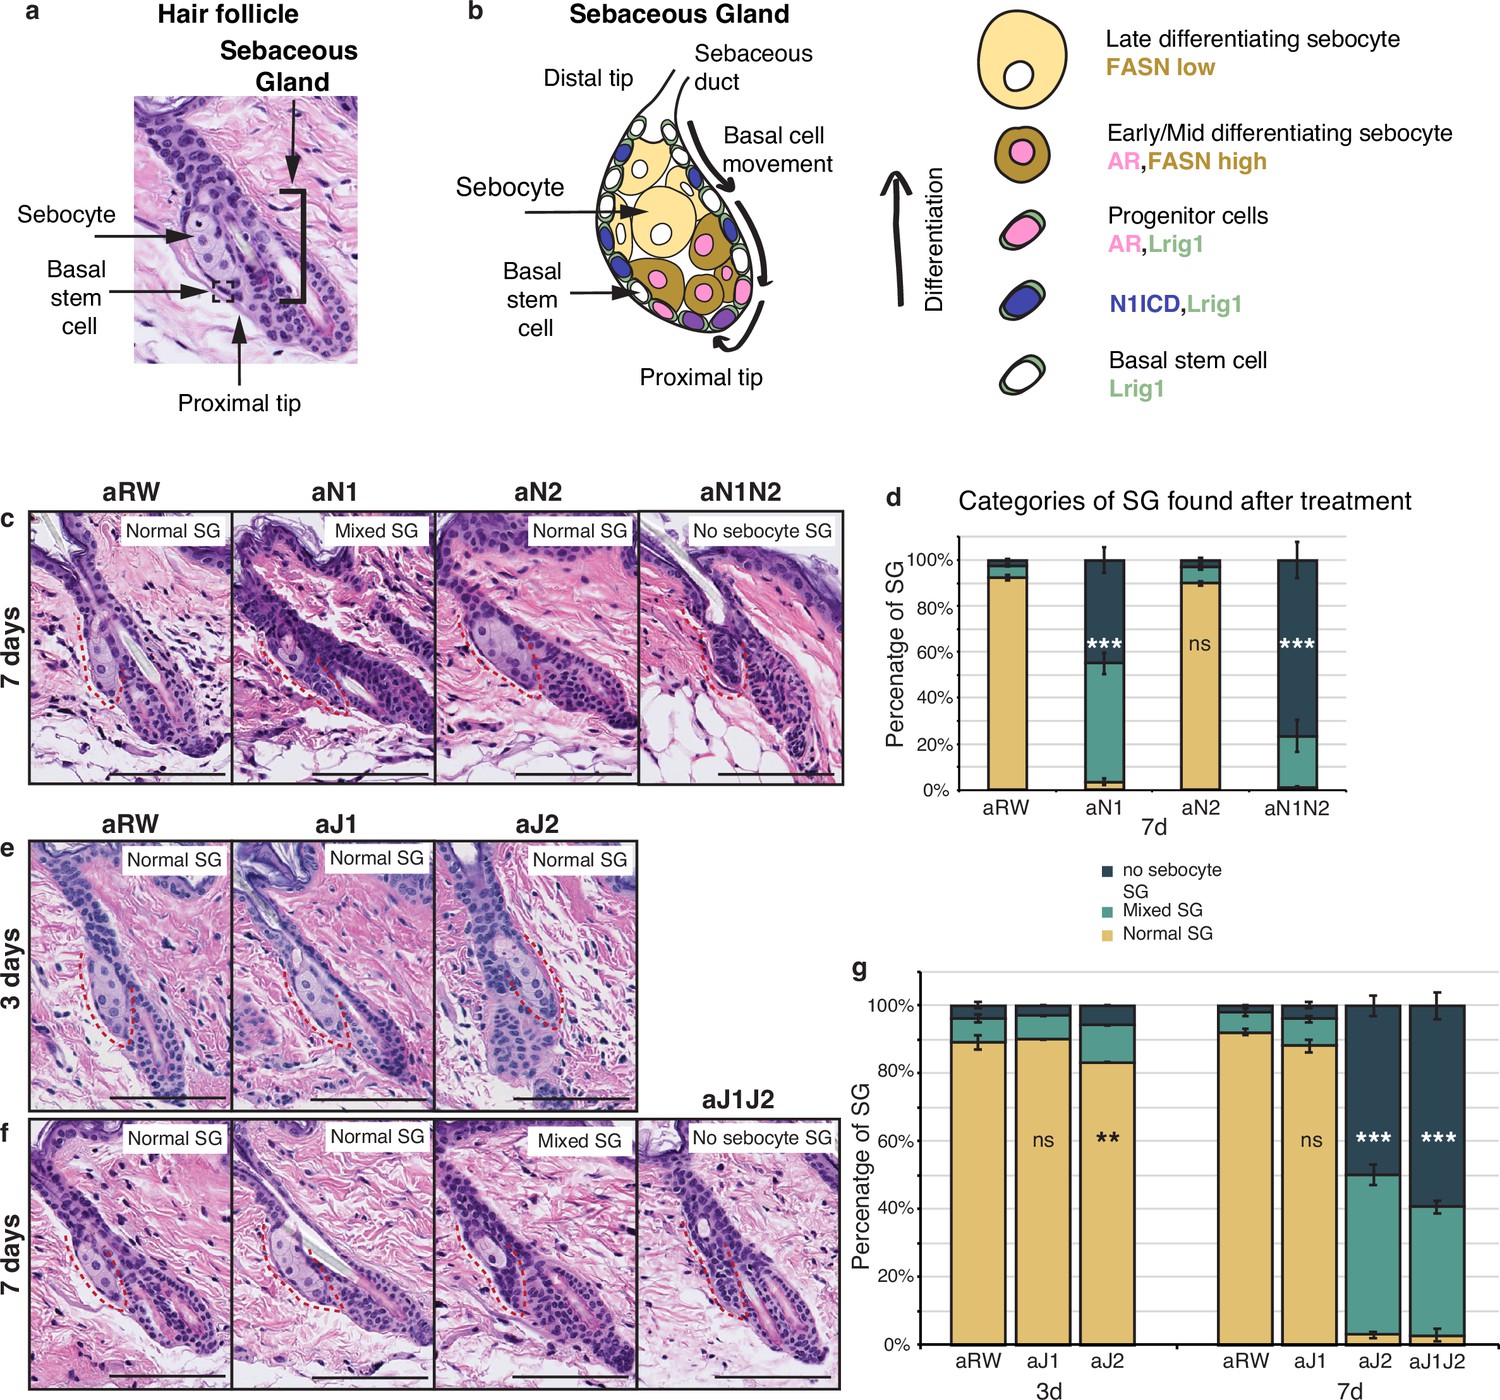
Jag2 is the dominant ligand involved in regulating sebocyte differentiation.
(a) A representative image of the homeostatic hair follicle, including its associated sebaceous gland (SG). (b) A detailed schematic of the SG showing the outer basal stem cell layer encasing the differentiated sebocytes. The schematic also shows the gene expression in different regions of the SG. (c) Representative hematoxylin and eosin (H&E) images of SGs from mice (n=5 each) treated with aRW, aN1, aN2, and aN1N2, 7 d post-treatment. (d) Quantification of type of SG found after each treatment. The SGs were divided into three categories: normal SGs containing a characteristic number of sebocytes (normal SG), SGs containing a mix of sebocytes and basal-like cells (mixed SG), and SGs containing no sebocytes and only basal-like cells (no sebocyte SG). For (c), (e), and (f), each SG panel is labeled with where the SG is normal, mixed, or no sebocyte SG. p-values: aN1=2.02E-123, aN2=0.426, aN1N2=3.85E-114. Total n of SGs quantified per treatment: aRW = 425, aN1=298, aN2=343, aN1N2=217. (e) Representative H&E images of SGs from mice (n=5 each) treated with aRW, aJ1, and aJ2, 3 d post-treatment. (f) Representative H&E images of SGs from mice (n=5 each) treated with aRW, aJ1, aJ2 and aJ1J2, 7 d post-treatment. (g) Quantification of type of SG found after each treatment. 3 d: p-values: aJ1=0.409, aJ2=0.004. 7 d: p-values: aJ1=0.057, aJ2=7.61E-151, aJ1J2=6.23E-169. Total n of SGs quantified per treatment: 3 d, aRW = 851, aJ1=944, aJ2=760, 7 d, aRW = 491, aJ1=499, aJ2=388, aJ1J2=461. Chi-square test used for statistical analysis. All treatments were compared against aRW. Error bars represent SEM. Scale bars are 100 μm.
-
Figure 1—source data 1
Source data for Figure 1.
- https://cdn.elifesciences.org/articles/98747/elife-98747-fig1-data1-v1.xlsx
Figure 1—figure supplement 1

Sebaceous ducts remain unaffected after Notch inhibition.
(Related to Figure 1). (a) Quantification of the percentage of sebaceous glands (SGs) consisting of bursting sebocytes after each treatment at 7 d. p-values: aJ1=0.662, aJ2=0.782, aJ1J2=0.219. (b) Representative hematoxylin and eosin (H&E) images of SGs from mice (n=5 each) treated with aRW, aJ1, aJ2, and aJ1J2, 7 d post-treatment. Total n of SGs quantified per treatment: aRW = 66, aJ1=66, aJ2=68, aJ1J2=47. Student’s T-test used for statistical analysis. Error bars represent SEM. Scale bars are 100 μm.
-
Figure 1—figure supplement 1—source data 1
Source data for Figure 1—figure supplement 1.
- https://cdn.elifesciences.org/articles/98747/elife-98747-fig1-figsupp1-data1-v1.xlsx
Figure 2 with 1 supplement
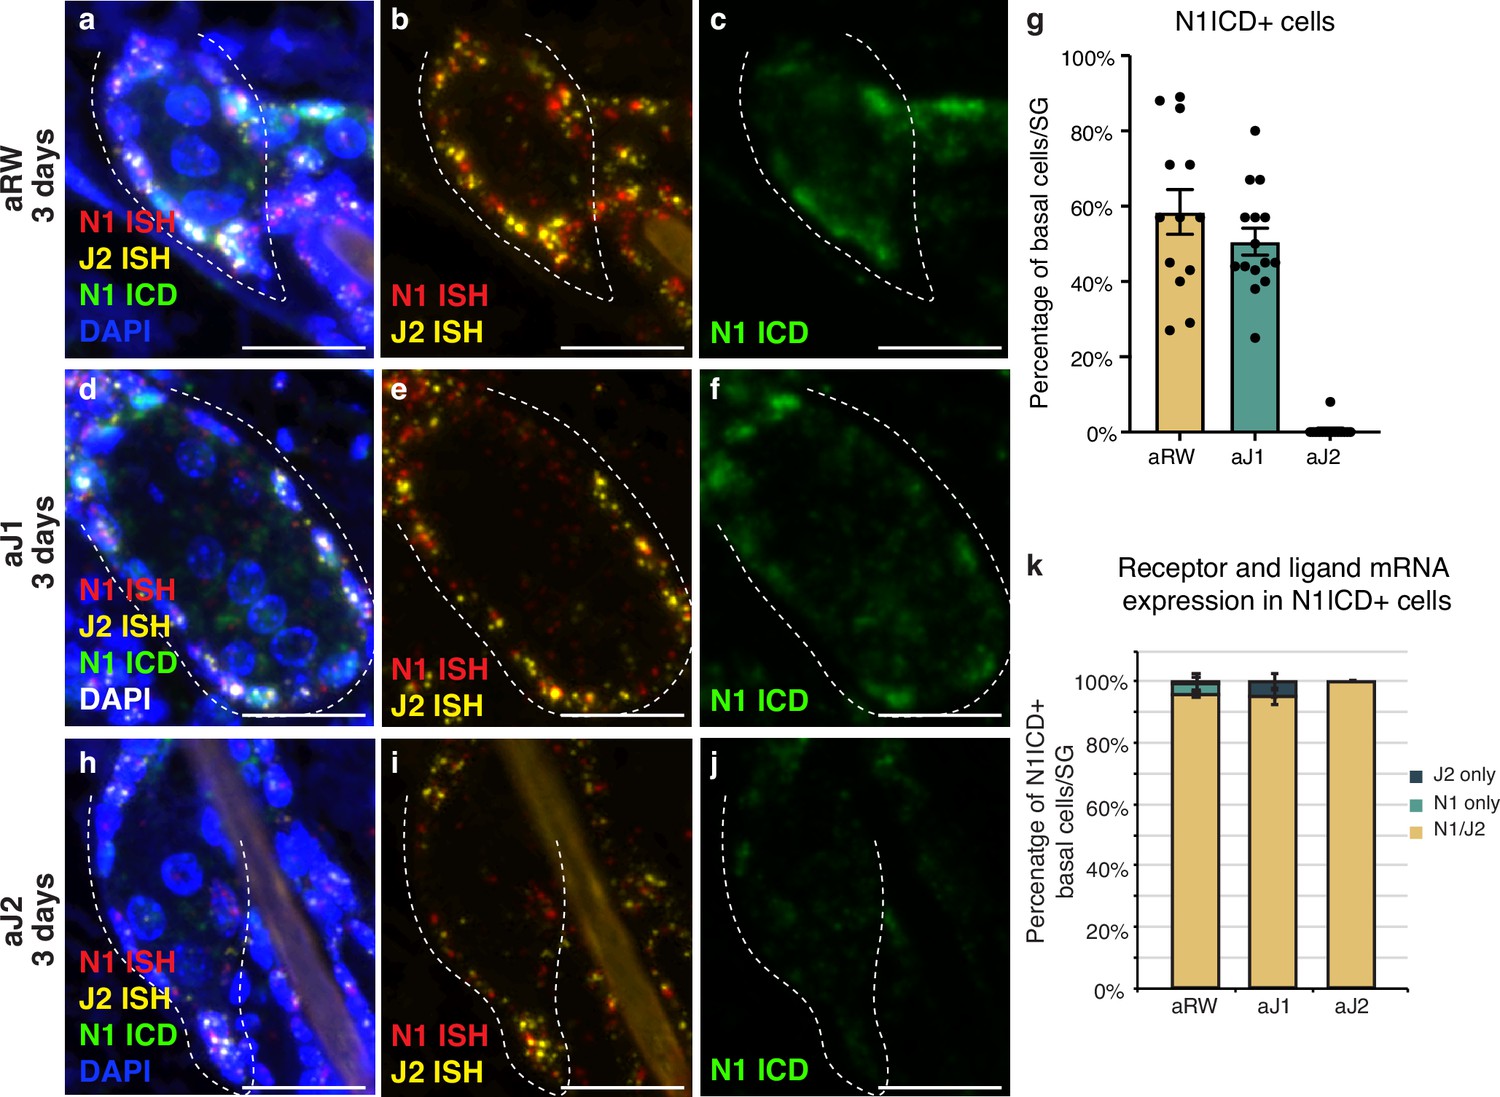
Notch is active in the sebaceous gland stem cells.
(a–c) Representative triple stain images for N1ICD, Notch1, and Jag2 mRNA in sebaceous glands (SGs) from mice (n=5 each) treated with aRW, 3 d post-treatment. (a) Four channels showing N1ICD, N1 ISH, J2 ISH, and DAPI. (b) Two channels showing N1 ISH and J2 ISH. (c) One channel showing N1ICD. (d-f) Representative triple stain images for N1ICD, Notch1, and Jag2 mRNA in SGs from mice (n=5 each) treated with aJ1, 3 d post-treatment. (d) Four channels showing N1ICD, N1 ISH, J2 ISH, and DAPI. (e) Two channels showing N1 ISH and J2 ISH. (f) One channel showing N1ICD. (g) Quantification of the percentage of N1ICD positive (N1ICD+) basal stem cells in SGs from mice (n=5 each) treated with aRW, aJ1, and aJ2, 3 d post-treatment. Percentage was calculated by dividing the number of N1ICD+ basal stem cells by the total number of basal stem cells in each SG. (h–j) Representative triple stain images for N1ICD, Notch1, and Jag2 mRNA in SGs from mice (n=5 each) treated with aJ2, 3 d post-treatment. (h) Four channels showing N1ICD, N1 ISH, J2 ISH, and DAPI. (i) Two channels showing N1 ISH and J2 ISH. (j) One channel showing N1ICD. (k) Quantification of what percentage of the N1ICD+ basal stem cells express both N1 ISH and J2 ISH, only N1 ISH, or only J2 ISH. (g and k) Total n of SGs quantified per treatment: aRW=13, aJ1=15, aJ2=15. Error bars represent SEM. Scale bars are 25 μm.
-
Figure 2—source data 1
Source data for Figure 2.
- https://cdn.elifesciences.org/articles/98747/elife-98747-fig2-data1-v1.xlsx
Figure 2—figure supplement 1
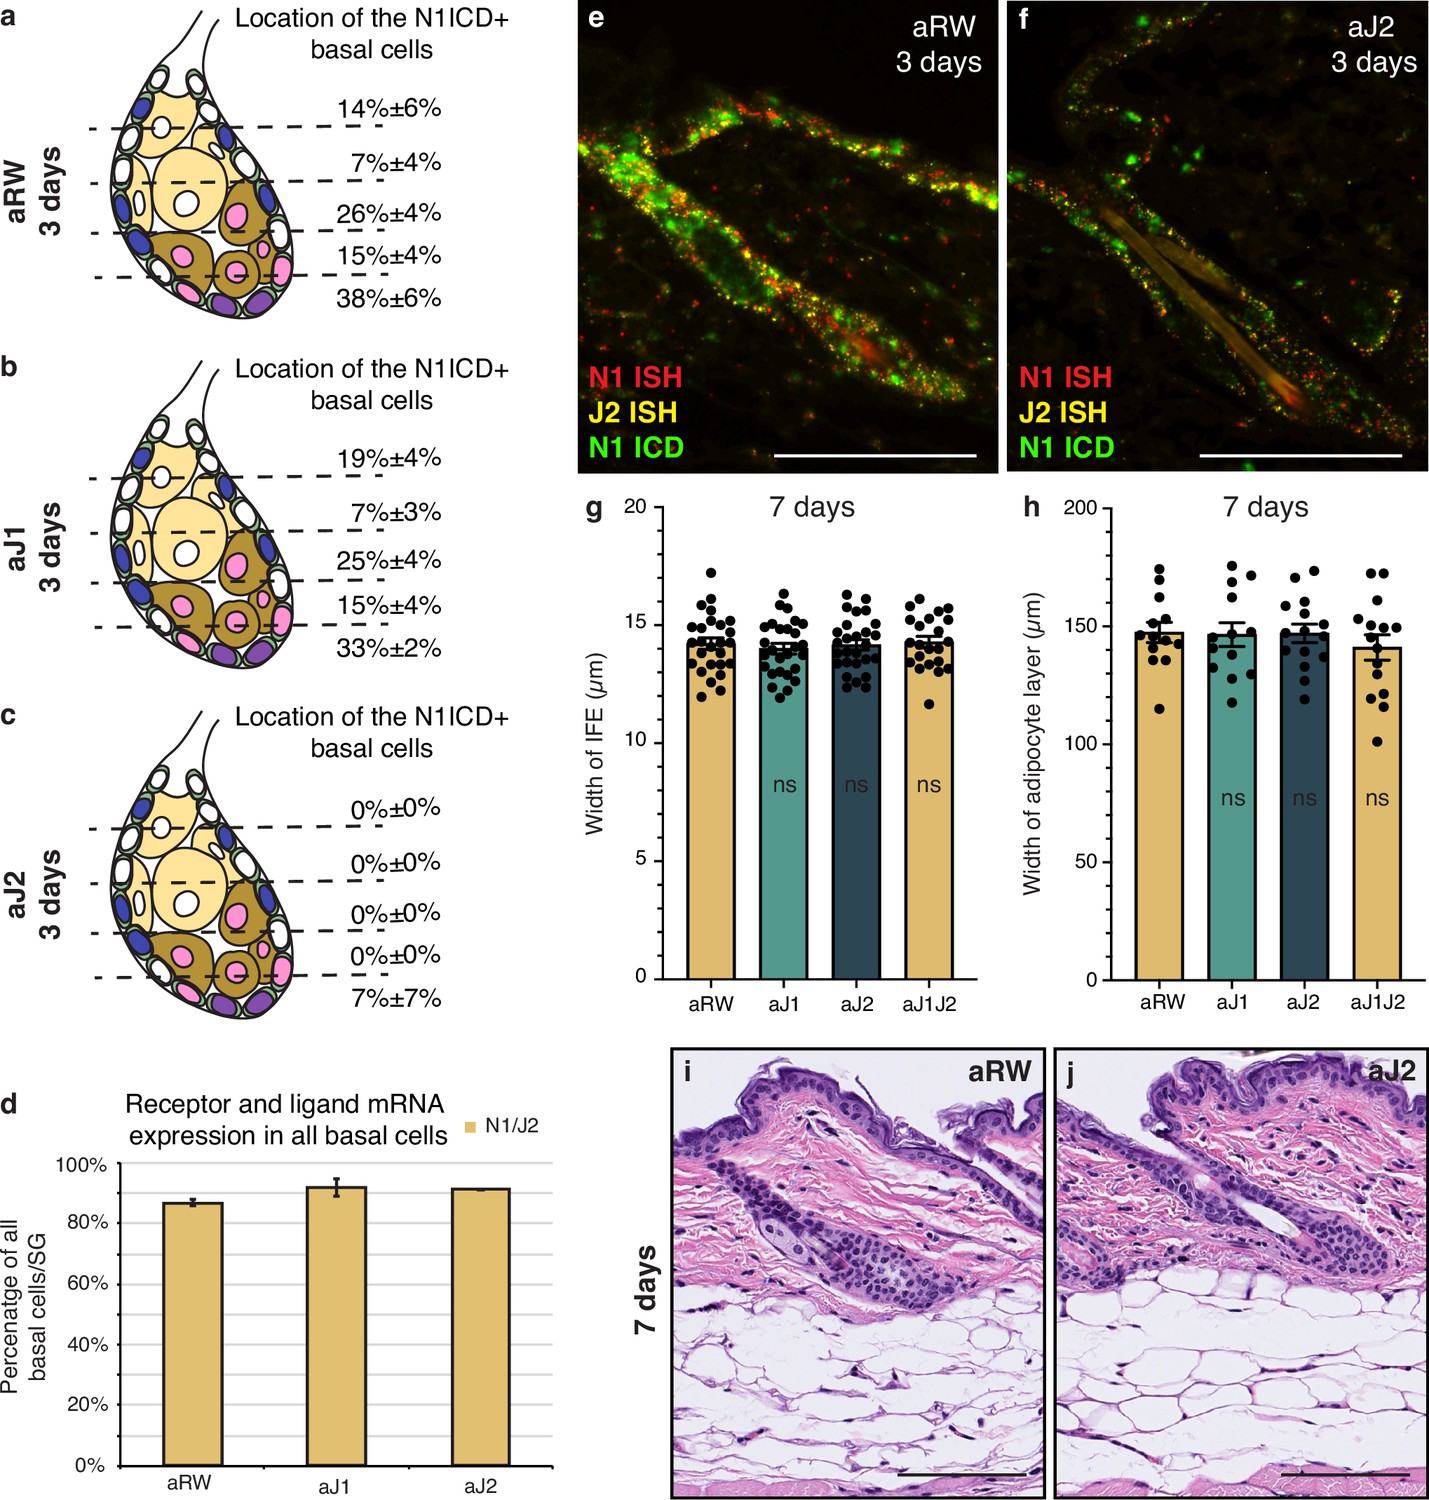
Notch is active in the sebaceous gland stem cells.
(Related to Figure 2). (a–c) Quantification of the location of N1ICD+ basal stem cells in sebaceous glands (SGs) from mice (n=5 each) treated with aRW (a), aJ1 (b), and aJ2 (c), 3 d post-treatment. The SG was divided into five sections along the proximal-distal axis. The number of N1ICD+ basal stem cells in each section was divided by the total number of N1ICD+ basal stem cells in each SG. Total n of SGs quantified per treatment: aRW=13, aJ1=15, aJ2=15. (d) Quantification of what percentage of the total basal stem cells (N1ICD+ and N1ICD-) express both N1 ISH and J2 ISH. Total n of SGs quantified per treatment: aRW=13, aJ1=15, aJ2=15. (e,f) Representative triple stain images for N1ICD, Notch1, and Jag2 mRNA in SGs from mice (n=5 each) treated with (e) aRW and (f) aJ2, 3 d post-treatment. (g) Quantification of the width of the interfollicular epidermis (IFE), 7 d after treatment with aRW, aJ1, aJ2, and aJ1J2. p-values: aJ1=0.528, aJ2=0.885, aJ1J2=0.840. Total n of SGs quantified per treatment: aRW=26, aJ1=27, aJ2=27, aJ1J2=22. (h) Quantification of the width of the adipocyte layer, 7 d after treatment with aRW, aJ1, aJ2, and aJ1J2. p-values: aJ1=0.890, aJ2=0.948, aJ1J2=0.374. Total n of SGs quantified per treatment: aRW=13, aJ1=13, aJ2=15, aJ1J2=15. (i,j) Representative hematoxylin and eosin (H&E) images of SGs from mice (n=5 each) treated with aRW (i) and aJ2 (j), 7 d post-treatment. Student’s t-test used for statistical analysis. Error bars represent SEM. Scale bars are 100 μm.
-
Figure 2—figure supplement 1—source data 1
Source data for Figure 2—figure supplement 1.
- https://cdn.elifesciences.org/articles/98747/elife-98747-fig2-figsupp1-data1-v1.xlsx
Figure 3 with 1 supplement
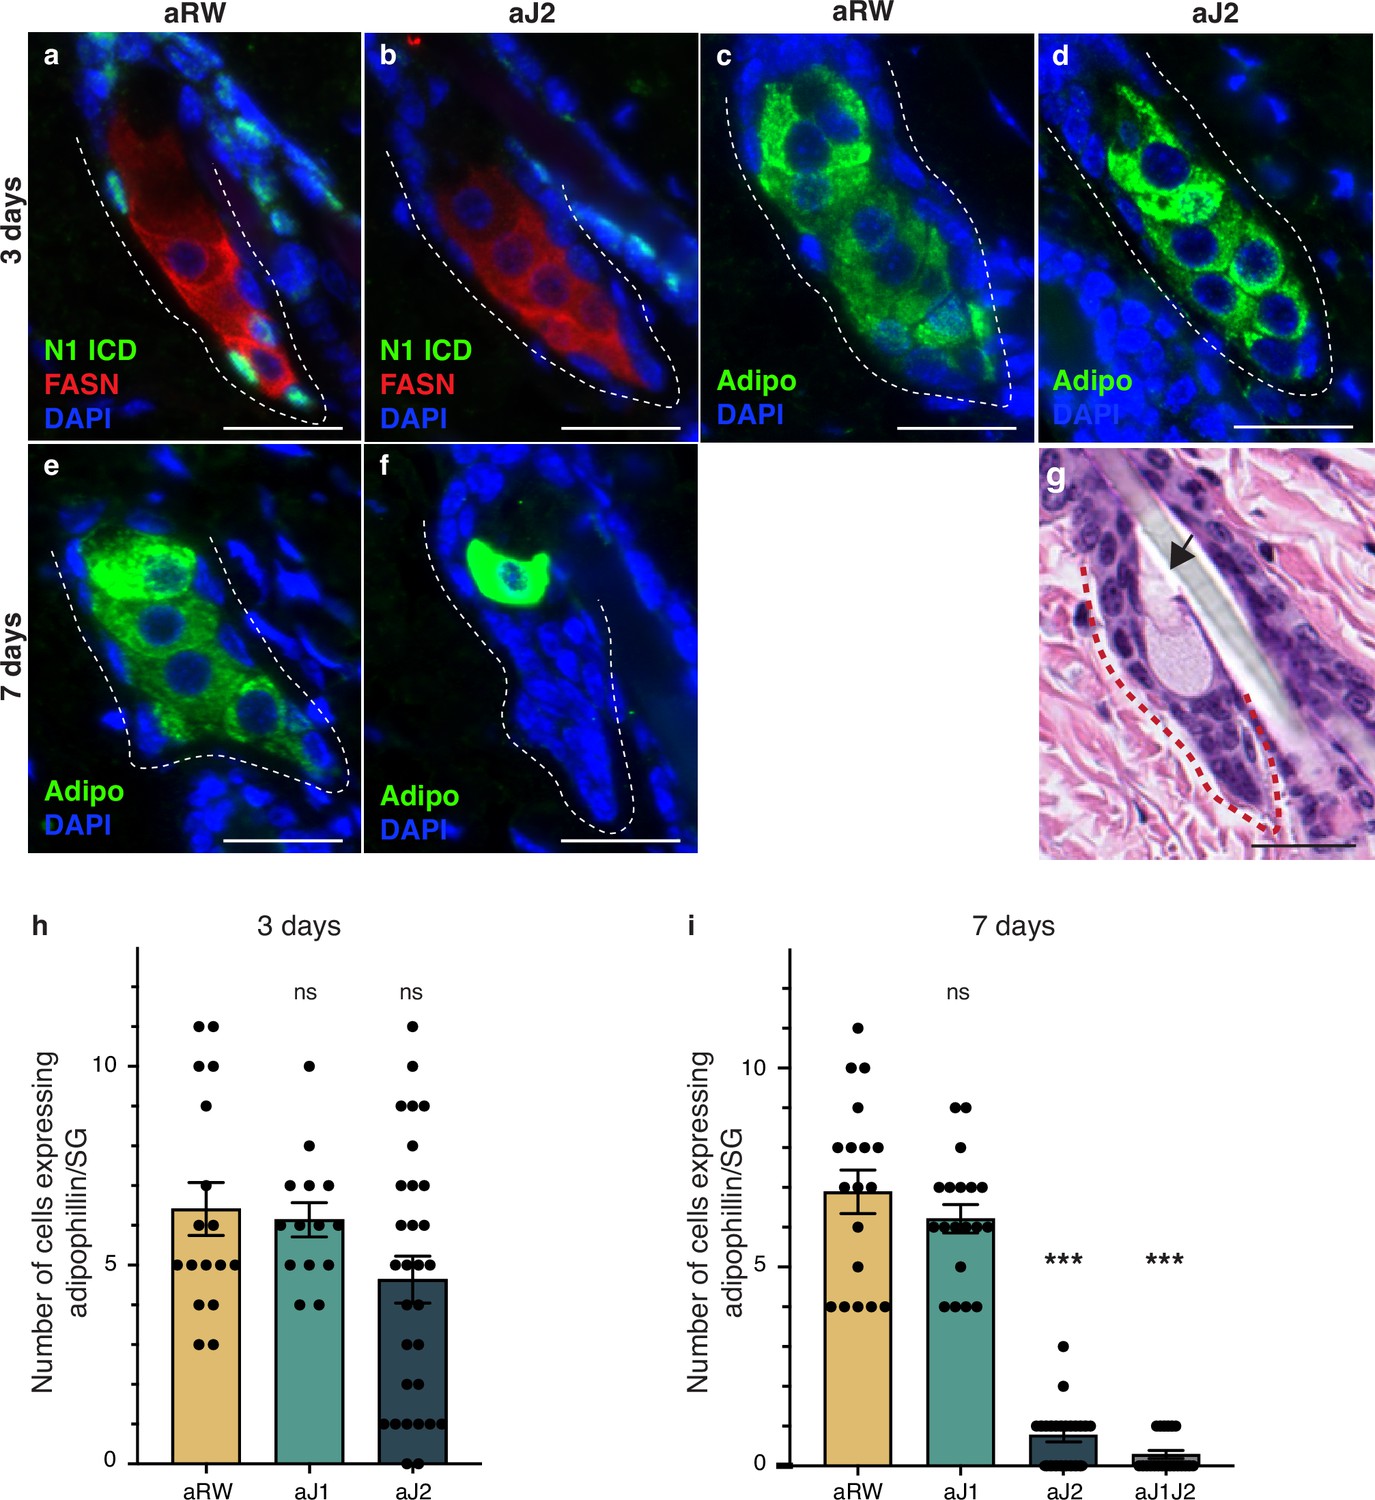
Loss of Notch activity in the sebaceous gland (SG) stem cells inhibits sebocyte differentiation.
(a, b) Representative co-stain images for N1ICD and fatty acid synthase (FASN) in SGs from mice (n=5 each) treated with aRW (a) and aJ2 (b), 3 d post-treatment. (c, d) Representative adipophiin staining in SGs from mice (n=5 each) treated with aRW (c) and aJ2 (d), 3 d post-treatment. (e, f) Representative adipophilin staining in SGs from mice (n=5 each) treated with aRW (e) and aJ2 (f), 7 d post-treatment. (g) A representative hematoxylin and eosin (H&E) image of an SG from mice (n=5 each) treated with aJ2, 7 d post-treatment. Arrow points to a bursting sebocyte releasing sebum into the sebaceous duct. (h) Quantification of the number of cells expressing adipophilin in each SG, 3 d post-treatment with aRW, aJ1, and aJ2. p-values: aJ1=0.749, aJ2=0.062. Total n of SGs quantified per treatment: aRW = 17, aJ1=14, aJ2=30. (i) Quantification of the number of cells expressing adipophilin in each SG, 7 d post-treatment with aRW, aJ1, aJ2, and aJ1J2. p-values: aJ1=0.301, aJ2=4.13E-14, aJ1J2=4.06E-14. Total n of SGs quantified per treatment: aRW = 18, aJ1=19, aJ2=22, aJ1J2=21. Student’s t-test used for statistical analysis. All treatments were compared against aRW. Error bars represent SEM. Scale bars are 25 μm.
-
Figure 3—source data 1
Source data for Figure 3.
- https://cdn.elifesciences.org/articles/98747/elife-98747-fig3-data1-v1.xlsx
Figure 3—figure supplement 1
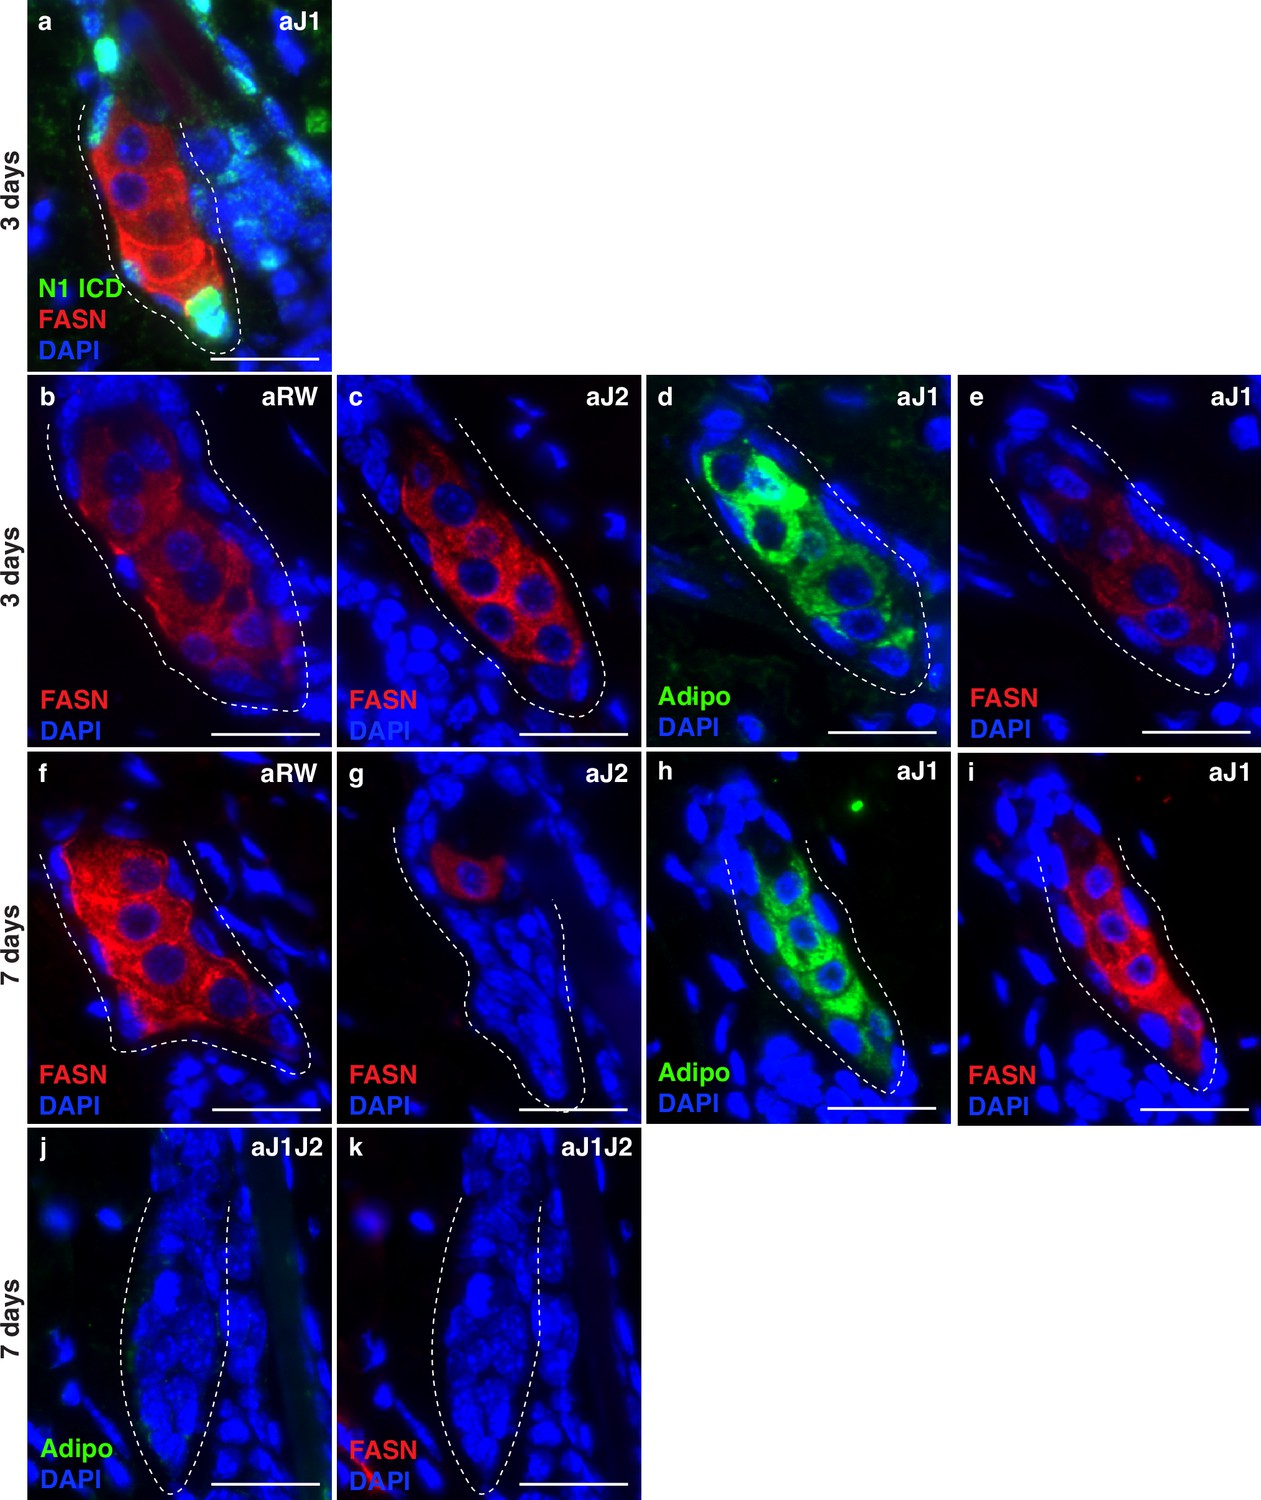
Loss of Notch activity in the sebaceous gland (SG) stem cells inhibits sebocyte differentiation.
(Related to Figure 3). (a) A representative co-stain image for N1ICD and Fatty acid synthase (FASN) in an SG from mice (n=5 each) treated with aJ1, 3 d post-treatment. (b,c) Representative FASN staining in SGs from mice (n=5 each) treated with aRW (b) and aJ2 (c), 3 d post treatment. (d) A representative adipophilin staining in an SG from mice (n=5 each) treated with aJ1, 3 d post-treatment. (e) A representative FASN staining in an SG from mice (n=5 each) treated with aJ1, 3 d post-treatment. (f,g) Representative FASN staining in SGs from mice (n=5 each) treated with aRW (f) and aJ2 (g), 7 d post-treatment. (h) A representative adipophilin staining in an SG from mice (n=5 each) treated with aJ1, 7 d post-treatment. (i) A representative FASN staining in an SG from mice (n=5 each) treated with aJ1, 7 d post-treatment. (j) A representative adipophilin staining in an SG from mice (n=5 each) treated with aJ1J2, 7 d post treatment. (i) A representative FASN staining in an SG from mice (n=5 each) treated with aJ1J2, 7 d post treatment. Scale bars are 25 μm.
Figure 4 with 1 supplement
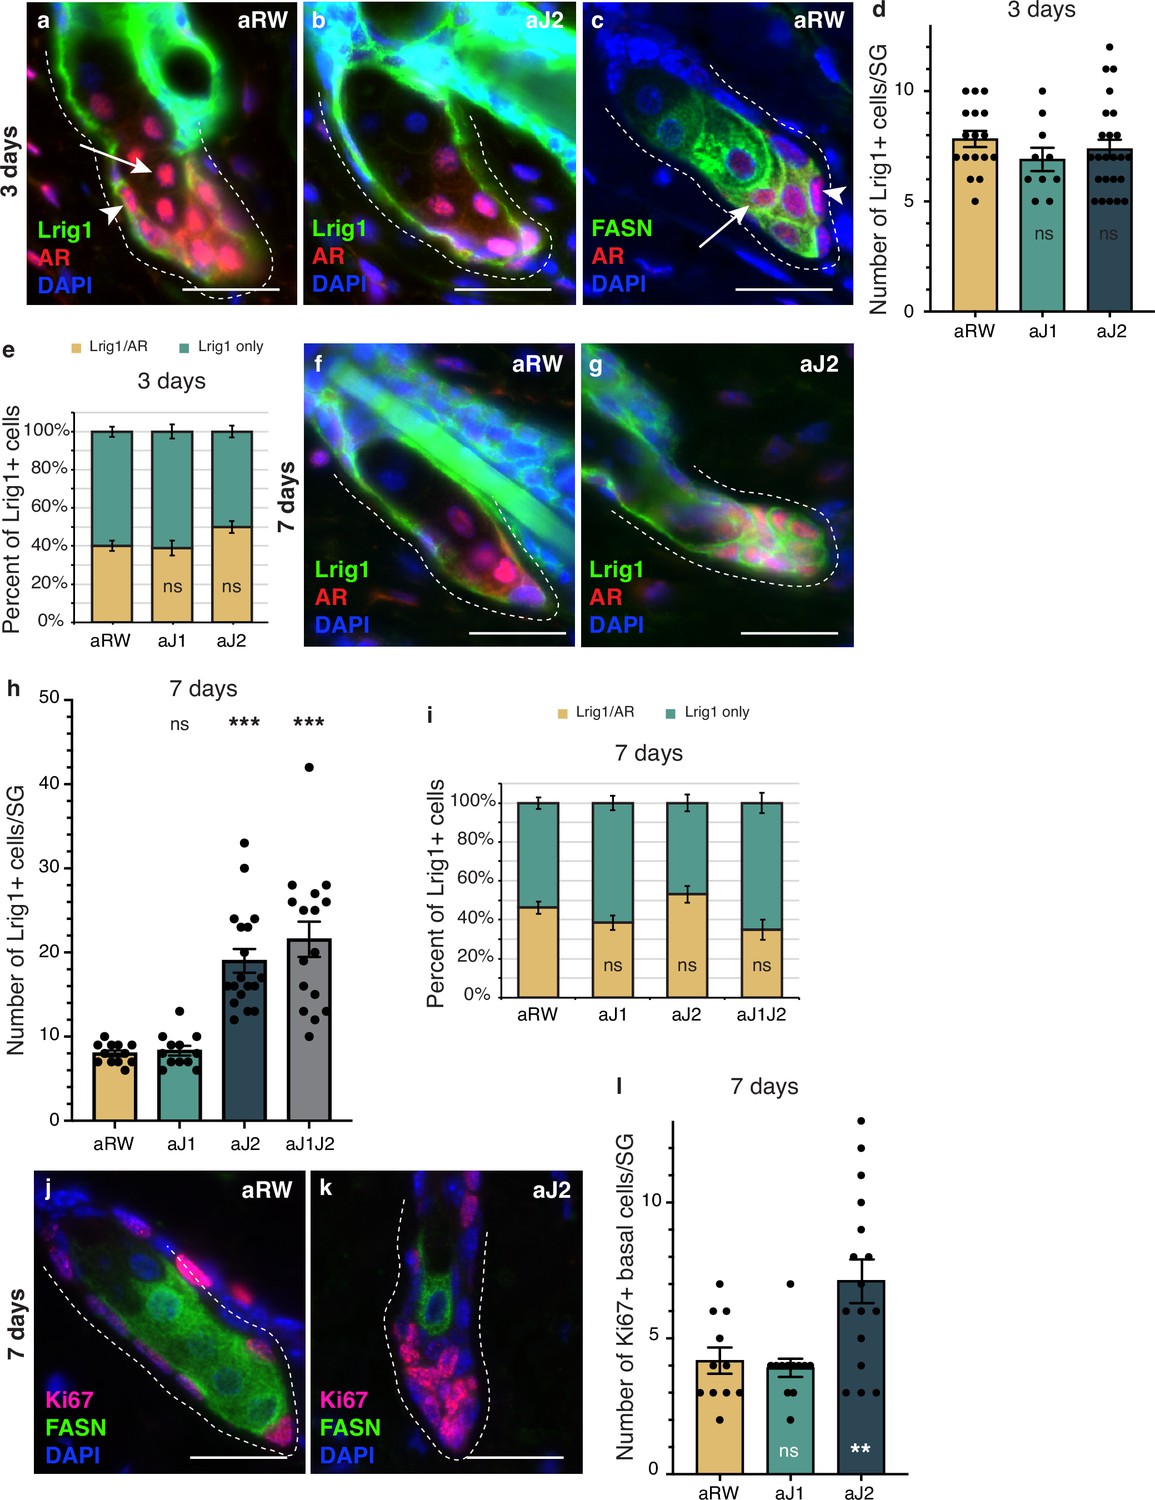
Notch activity in the sebaceous gland (SG) stem cells is required to prevent unregulated progenitor proliferation.
(a,b) Representative co-stain images for Lrig1 and androgen receptor (AR) in SGs from mice (n=5 each) treated with aRW (a) and aJ2 (b), 3 d post-treatment. (c) A representative co-stain image for fatty acid synthase (FASN) and AR in an SG from mice (n=5 each) treated with aRW, 3 d post-treatment. Arrows point to sebocytes, and arrowheads point to progenitor cells. (d) Quantification of the number of cells expressing Lrig1 in each SG, 3 d post-treatment with aRW, aJ1. and aJ2. p-values: aJ1=0.152, aJ2=0.450. (e) Quantification of what percentage of the Lrig1 + cells express AR, 3 d post-treatment with aRW, aJ1, and aJ2. p-values: aJ1=0.789, aJ2=0.028. (d and e) Total n of SGs quantified per treatment: aRW = 17, aJ1=10, aJ2=24. (f,g) Representative co-stain images for Lrig1 and AR in SGs from mice (n=5 each) treated with aRW (f) and aJ2 (g), 7 d post-treatment. (h) Quantification of the number of cells expressing Lrig1 in each SG, 7 d after treatment with aRW, aJ1, aJ2, and aJ1J2. p-values: aJ1=0.628, aJ2=9.06E-07, aJ1J2=7.88E-06. (i) Quantification of what percentage of the Lrig1 + cells express AR, 7 d after treatment with aRW, aJ1, aJ2, and aJ1J2. p-values: aJ1=0.117, aJ2=0.248, aJ1J2=0.091. (h and i) Total n of SGs quantified per treatment: aRW = 12, aJ1=12, aJ2=18, aJ1J2=16. (j,k) Representative co-stain images for Ki67 and FASN in SGs from mice (n=5 each) treated with aRW (j) and aJ2 (k), 7 d post-treatment. (l) Quantification of the number of cells expressing Ki67 in each SG, 7 d after treatment with aRW, aJ1, and aJ2. p-values: aJ1=0.652, aJ2=0.009. Total n of SGs quantified per treatment: aRW = 11, aJ1=12, aJ2=16. Student’s t-test used for statistical analysis. All treatments were compared against aRW. Error bars represent SEM. Scale bars are 25 μm.
-
Figure 4—source data 1
Source data for Figure 4.
- https://cdn.elifesciences.org/articles/98747/elife-98747-fig4-data1-v1.xlsx
Figure 4—figure supplement 1
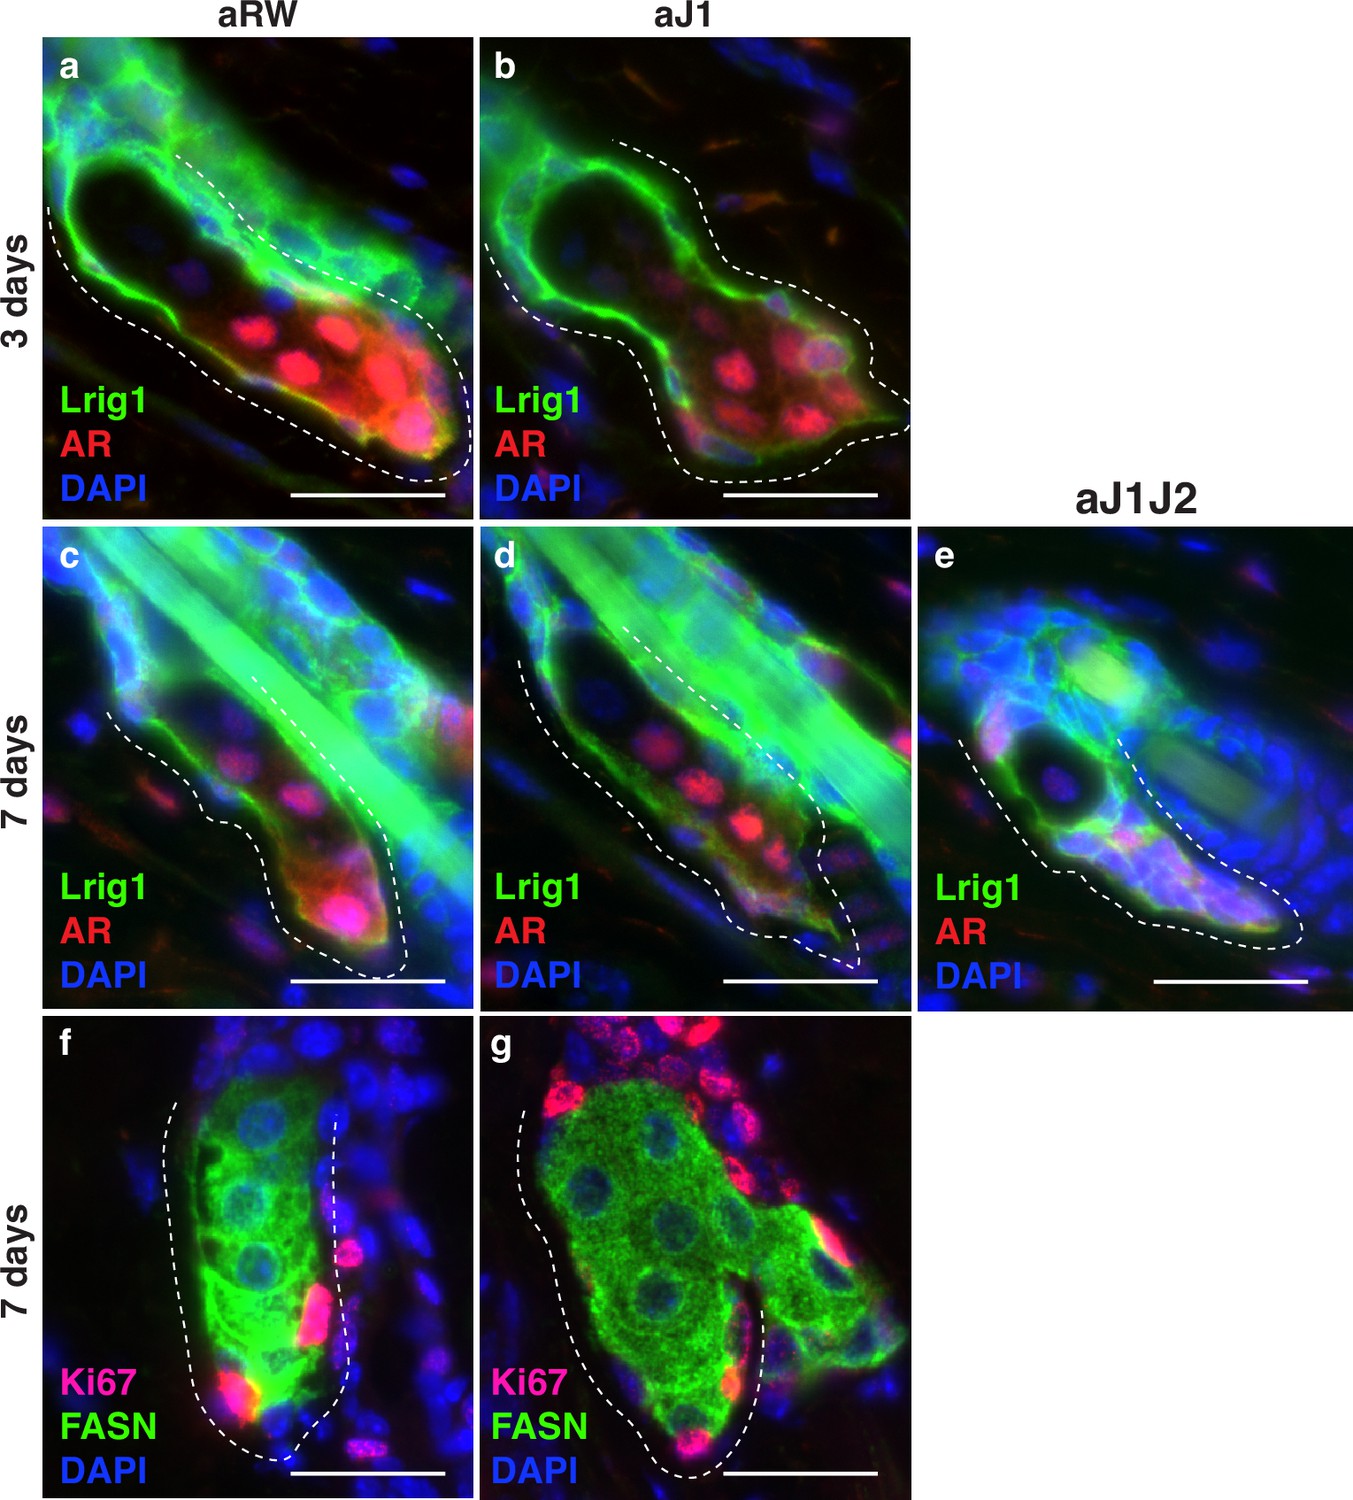
Notch activity in the sebaceous gland (SG) stem cells is required to prevent unregulated progenitor proliferation.
(Related to Figure 4). (a,b) Representative co-stain images for Lrig1 and androgen receptor (AR) in SGs from mice (n=5 each) treated with aRW (a) and aJ1 (b), 3 d post-treatment. (c–e) Representative co-stain images for Lrig1 and AR in SGs from mice (n=5 each) treated with aRW (c), aJ1 (d), and aJ1J2 (e), 7 d post-treatment. (f,g) Representative co-stain images for Ki67 and fatty acid synthase (FASN) in SGs from mice (n=5 each) treated with aRW (f) and aJ1 (g), 7 d post-treatment. Scale bars are 25 μm.
Figure 5 with 1 supplement
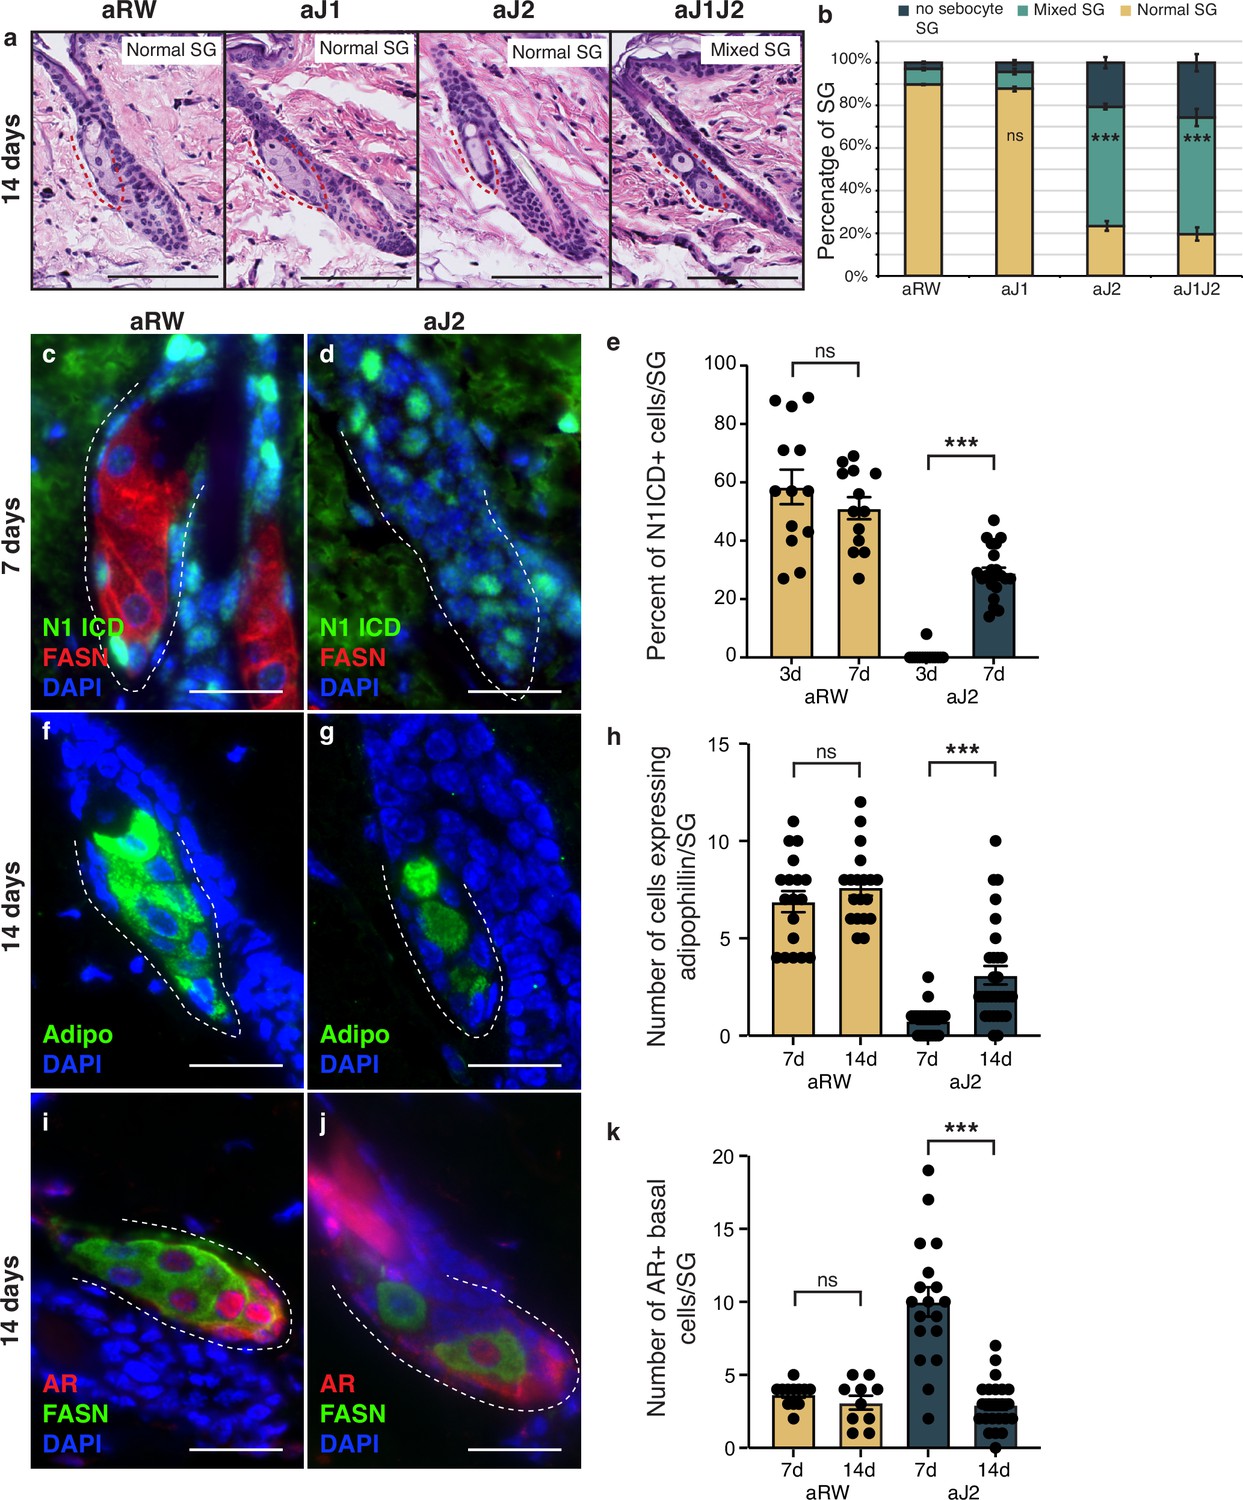
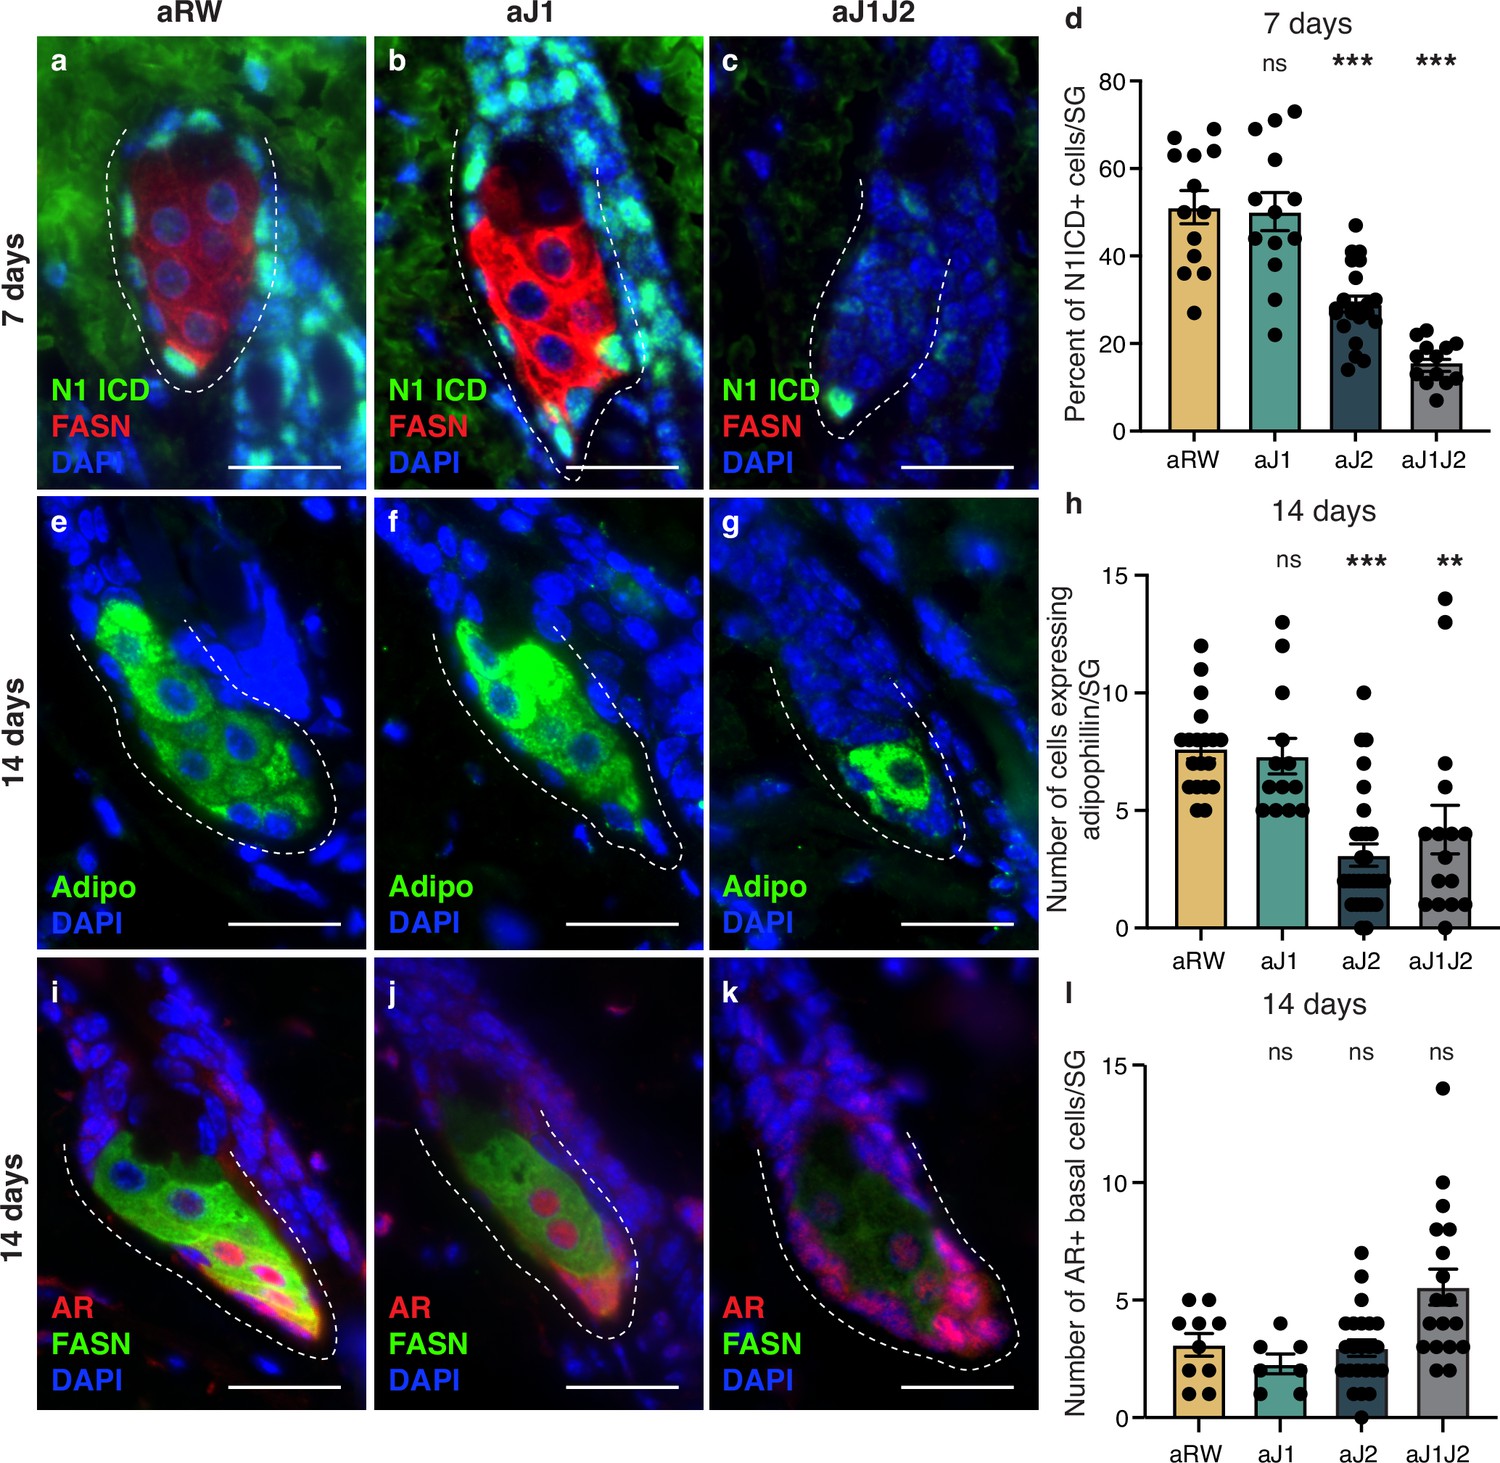
The block in sebocyte differentiation is lifted upon recovery of Notch activity.
(a) Representative hematoxylin and eosin (H&E) images of sebaceous glands (SGs) from mice (n=5 each) treated with aRW, aJ1, aJ2, and aJ1J2, 14 d post treatment. (b) Quantification of type of SG found after each treatment. The SGs were divided into three categories: normal SGs containing a characteristic number of sebocytes (normal SG), SGs containing a mix of sebocytes and basal-like cells (mixed SG), and SGs containing no sebocytes and only basal-like cells (no sebocyte SG). p-values: aJ1=0.535, aJ2=2.90E-87, aJ1J2=1.73E-92. Chi-square test used for statistical analysis. All treatments were compared against aRW. Total n of SGs quantified per treatment: aRW = 485, aJ1=430, aJ2=394, aJ1J2=364. Scale bars are 100 μm. (c,d) Representative co-stain images for N1ICD and fatty acid synthase (FASN) in SGs from mice (n=5 each) treated with aRW (c) and aJ2 (d), 7 d post-treatment. (e) Quantification of the percentage of N1ICD + cells in SGs from mice (n=5 each) treated with aRW and aJ2, 3 and 7 d post-treatment. Percentage was calculated by dividing the number of N1ICD+ cells by the total number of basal-like cells in each SG. p-values: for comparison between day 3 and day 7 for aRW treatment = 0.297, for comparison between day 3 and day 7 for aJ2 treatment = 1.00E-14. Total n of SGs quantified per treatment: aRW at 3 d = 13, aRW at 7 d = 13, aJ2 at 3 d = 15, aJ2 at 7 d=22. (f,g) Representative adipophilin staining in SGs from mice (n=5 each) treated with aRW (f) and aJ2 (g), 14 d post treatment. (h) Quantification of the number of cells expressing adipophiln in each SG, 7 and 14 d after treatment with aRW, and aJ2. p-values: for comparison between day 7 and day 14 for aRW treatment = 0.292, for comparison between day 7 and day 14 for aJ2 treatment = 1.38E-4. Total n of SGs quantified per treatment: aRW at 7 d = 18, aRW at 14 d = 19, aJ2 at 7 d = 22, aJ2 at 14 d=29. (i,j) Representative co-stain images for androgen receptor (AR) and FASN in SGs from mice (n=5 each) treated with aRW (i) and aJ2 (j), 14 d post-treatment. (k) Quantification of the number of cells expressing AR in each SG, 7 and 14 d after treatment with aRW and aJ2. p-values: for comparison between day 7 and day 14 for aRW treatment = 0.273, for comparison between day 7 and day 14 for aJ2 treatment=9.53E-09. Total n of SGs quantified per treatment: aRW at 7 d=12, aRW at 14 d=10, aJ2 at 7 d=18, aJ2 at 14 d=23. Student’s t-test used for statistical analysis. Error bars represent SEM. Scale bars are 25 μm.
-
Figure 5—source data 1
Source data for Figure 5.
- https://cdn.elifesciences.org/articles/98747/elife-98747-fig5-data1-v1.xlsx
Figure 5—figure supplement 1
The block in sebocyte differentiation is lifted upon recovery of Notch activity.
(Related to Figure 5). (a–c) Representative co-stain images for N1ICD and fatty acid synthase (FASN) in sebaceous glands (SGs) from mice (n=5 each) treated with aRW (a), aJ1 (b), and aJ1J2 (c), 7 d post-treatment. (d) Quantification of the percentage of N1ICD+ cells in SGs from mice (n=5 each) treated with aRW, aJ1, aJ2, and aJ1J2, 7 d post-treatment. Percentage was calculated by dividing the number of N1ICD+ cells by the total number of basal-like cells in each SG. p-values: aJ1=0.878, aJ2=3.42E-21, aJ1J2=5.60E-09. Total n of SGs quantified per treatment: aRW = 13, aJ1=13, aJ2=22, aJ1J2=13. (e–g) Representative adipophilin staining in SGs from mice (n=5 each) treated with aRW (e), aJ1 (f), and aJ1J2 (g), 14 d post-treatment. (h) Quantification of the number of cells expressing adipophilin in each SG, 14 d after treatment with aRW, aJ1, aJ2, and aJ1J2. p-values: aJ1=0.693, aJ2=3.40E-08, aJ1J2=0.003. Total n of SGs quantified per treatment: aRW = 19, aJ1=13, aJ2=29, aJ1J2=16. (i–k) Representative co-stain images for androgen receptor (AR) and FASN in SGs from mice (n=5 each) treated with aRW (i), aJ1 (j), and a1J2 (k), 14 d post-treatment. (l) Quantification of the number of cells expressing AR in each SG, 14 d after treatment with aRW, aJ1, aJ2. and aJ1J2. p-values: aJ1=0.248, aJ2=0.817, aJ1J2=0.032. Total n of SGs quantified per treatment: aRW=10, aJ1=7, aJ2=23, aJ1J2=18. Student’s t-test used for statistical analysis. Error bars represent SEM. Scale bars are 25 μm.
-
Figure 5—figure supplement 1—source data 1
Source data for Figure 5—figure supplement 1.
- https://cdn.elifesciences.org/articles/98747/elife-98747-fig5-figsupp1-data1-v1.xlsx
Tables
Key resources table
| Reagent type (species) or resource | Designation | Source or reference | Identifiers | Additional information |
|---|---|---|---|---|
| Biological sample (Mus musculus) | Dorsal skin tissue | Charles River-Hollister | Females | |
| Antibody | Anti-Jag1 (Mouse monoclonal) | Genentech | Inhibiting antibody (20 mg/kg) | |
| Antibody | Anti-Jag2 (Mouse monoclonal) | Genentech | Inhibiting antibody (20 mg/kg) | |
| Antibody | Anti-Notch1 (Human monoclonal) | Genentech | Inhibiting antibody (5 mg/kg) | |
| Antibody | Anti-Notch2 (Mouse monoclonal) | Genentech | Inhibiting antibody (10 mg/kg) | |
| Antibody | Anti-Ragweed (Mouse monoclonal) | Genentech | Isotype control antibody – concentrations match the maximum dose of inhibiting antibodies | |
| Antibody | Anti-N1ICD (Rabbit monoclonal) | Cell Signaling | Cat#: 4147 | Triple stain (20 ug/ml) IF (1:500) |
| Antibody | Anti-FASN (Mouse monoclonal) | BD | Cat#: 610963 | IF (1:100) |
| Antibody | Anti-Adipophilin (Guinea pig polyclonal) | Fitzgerald | Cat#: 20R-AP002 | IF (1:500) |
| Antibody | Anti-Ki67 (Rabbit monoclonal) | Thermo Fisher Scientific | Cat#: SP6 RM-9106-SO | IF (1:100) |
| Antibody | Anti-Lrig1 (Goat polyclonal) | R&D Systems | Cat#: AF3688-SP | IF (1:200) |
| Antibody | Anti-AR (Rabbit monoclonal) | Abcam | Cat#: ab133273 [EPR1535(2)] | IF (1:250) |
| Antibody | PowerVision poly-HRP anti-rabbit (Goat polyclonal) | Leica | Cat#: PV6119 | ready to use |
| Sequence-based reagent | RNAScope LS 2.5 Murine-Jag2_C1 | ACD | Cat#: 417518 | nucleotides spanning from nt 552–1480 of reference sequence NM_010588.2 |
| Sequence-based reagent | RNAScope LS 2.5 Murine-Notch1_C2 | ACD | Cat#: 404648-C2 | nucleotides spanning from nt 1153–1960 of reference sequence NM_008714.3 |
| Sequence-based reagent | RNAScope LS 2.0 Murine-PPIB probe | ACD | Cat#: 313917 | nucleotides spanning from nt 98~856 of reference sequence NM_011149.2 |
| Sequence-based reagent | RNAScope LS 2.0 DapB probe | ACD | Cat#: 312038 | nucleotides spanning from nt 414~862 reference sequence EF191515 |
| Commercial assay or kit | RNAscope LS Multiplex Reagent Kit | ACD | Cat#: 322800 | |
| Commercial assay or kit | Bond Epitope Retrieval Solution 2 | Leica | Cat#: AR9640 | |
| Commercial assay or kit | Opal Polaris 7 Auto Detection Kit | Akoya | Cat#: NEL811001KT |
Additional files
Download links
A two-part list of links to download the article, or parts of the article, in various formats.
Downloads (link to download the article as PDF)
Open citations (links to open the citations from this article in various online reference manager services)
Cite this article (links to download the citations from this article in formats compatible with various reference manager tools)
The Jag2/Notch1 signaling axis promotes sebaceous gland differentiation and controls progenitor proliferation
eLife 13:RP98747.
https://doi.org/10.7554/eLife.98747.3


