Oxidized low-density lipoprotein potentiates angiotensin II-induced Gq activation through the AT1-LOX1 receptor complex
- Department of Geriatric and General Medicine, Osaka University Graduate School of Medicine, Japan
- Center for Pulmonary and Vascular Biology, Department of Pediatrics, University of Texas Southwestern Medical Center, United States
- Department of Medicine, University of Toronto, Canada
- Department of Molecular Pathophysiology, Shinshu University Graduate School of Medicine, Japan
- Department of Nephrology, Osaka University Graduate School of Medicine, Japan
Figures
Figure 1
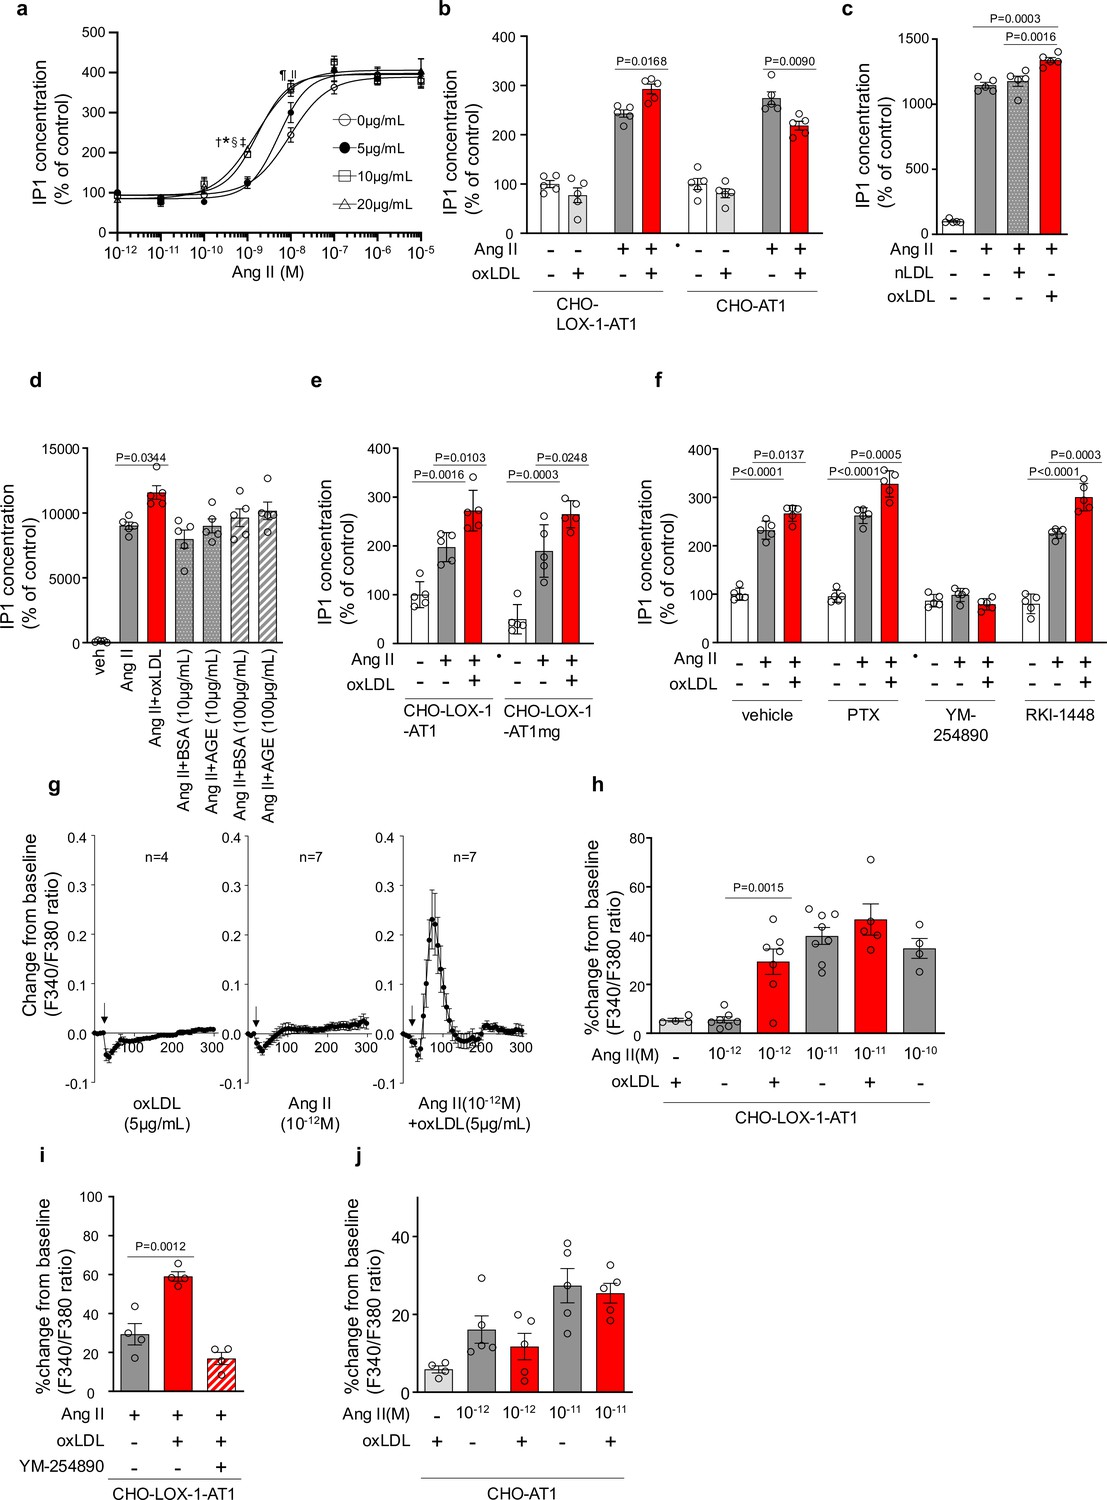
Oxidized low-density lipoprotein (LDL) potentiates angiotensin II (Ang II)-induced G protein αq subunit (Gq) signaling and calcium influx in a LOX-1-dependent manner.
(a) Dose-dependent response of IP1 concentration by the activation of Gq signaling in response to oxLDL and Ang II in CHO-LOX-1-AT1 cells. Cells were treated with oxLDL and Ang II at the concentrations described in the Figure (n=4 for each oxLDL concentration). *p=0.0004 for 0 μg/mL vs 20 μg/mL, †p=0.0003 for 5 g/mL vs 20 μg/mL, ‡p=0.0020 for 0 μg/mL vs 10 μg/mL, and §p=0.0015 for 5 μg/mL vs 10 μg/mL at 10–9 M Ang II; ||p=0.0051 for 0 μg/mL vs 10 μg/mL, ¶p=0.0004 for 0 μg/mL vs 20 μg/mL at 10–8 M Ang II. Biological replicates were performed using two independent cell cultures. (b) IP1 concentration in response to vehicle, native LDL (nLDL 10 μg/mL), and oxLDL (10 μg/mL) in the combination of Ang II (10–8 M) in CHO-LOX-1-AT1 cells (n=5 for each group) biological replicates were performed using two independent cell cultures. (c) IP1 concentration in response to vehicle, oxLDL (10 μg/mL) in the combination of Ang II (10–8M) in CHO-LOX-1-AT1 and CHO-AT1 cells (n=5 for each group). (d) IP1 concentration in response to vehicle, oxLDL (10 μg/mL), BSA (10 or 100 μg/mL), BSA-conjugated AGE (10 or 100 μg/mL) in the combination of Ang ll (10–8 M) in CHO-LOX-1-AT1 cells. (e) IP1 concentration in response to vehicle, oxLDL (10 μg/mL) in the combination of Ang II (10–8 M) in genetically engineered Chinese hamster ovary (CHO) cells with or without intact β-arrestin binding domain (n=5 for each group). AT1mg indicates AT1 a mutant AT1 lacking a functional β-arrestin binding domain but retaining G-protein-biased signaling capability. (f) IP1 concentration in response to oxLDL (10 μg/mL) in the combination of Ang II (10–8 M) and additional effect of PTX, a Gi inhibitor, YM-254890, a Gq inhibitor, and RKI-1448, a downstream Rho kinase inhibitor targeting G12/13 signaling, in CHO-LOX-1-AT1 cells (n=5 for each group). (g) Intracellular calcium dynamics measured using Fura 2-AM by the ratio of the mission signals at excitation wavelength 340 nm and 380 nm in response to oxLDL (5 μg/mL), Ang II (10–12 M), and their combination (for each agonist, 4–7 regions of interest were selected). Addition of these agonists is marked with arrows on the timeline of the assay. (h) Percentage changes from baseline in the ratio of emission signals (F340/F380) measured by Fura 2-AM were quantified following treatment with oxLDL and Ang II at specified concentrations in CHO-LOX-1-AT1 cells as detailed in the figure (n=4–8). (i) Percentage change from baseline in the ratio of emission signals (F340/F380) measured by Fura 2-AM after stimulation with oxLDL (5 μg/mL), Ang II (10–12 M), and YM-254890, a Gq inhibitor, in CHO-LOX-1-AT1 cells. (j) Percentage changes from baseline in the ratio of emission signals (F340/F380) measured by Fura 2-AM were quantified following treatment with oxLDL (5 μg/mL) and Ang II at specified concentrations in CHO-AT1 cells, as detailed in the Figure Biological replicates were performed using two independent cell cultures. Data are represented as mean ± SEM. Differences were determined using one-way ANOVA, followed by Tukey’s multiple comparison test for (a-f) and (h-j).
-
Figure 1—source data 1
Oxidized low-density lipoprotein (LDL) potentiates angiotensin II (Ang II)-induced G protein αq subunit (Gq) signaling and calcium influx in a LOX-1-dependent manner.
Source data for Figure 1a–j.
- https://cdn.elifesciences.org/articles/98766/elife-98766-fig1-data1-v1.xlsx
Figure 2 with 1 supplement
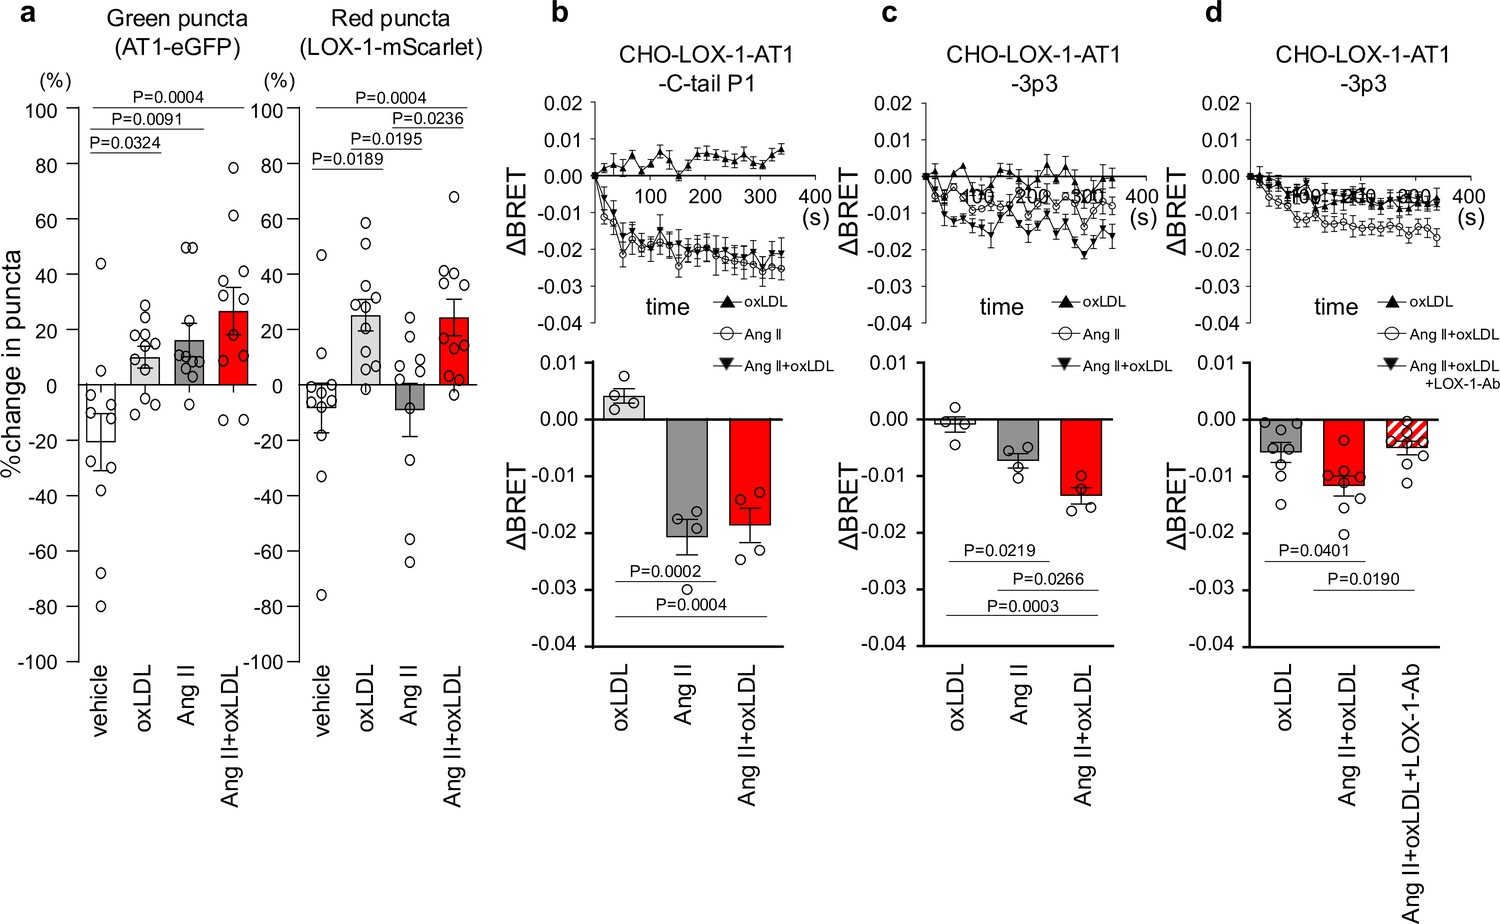
Co-treatment of oxidized low-density lipoprotein (oxLDL) with angiotensin II (Ang II) induces conformational change of AT1 different from each treatment alone.
(a) Change in green puncta (AT1-eGFP) and red puncta (LOX-1-mScarlet) by the treatment with vehicle, oxLDL (10 μg/mL), Ang II (10–5M), and the combination of oxLDL and Ang II in Chinese hamster ovary (CHO) cell overexpressing these fluorescent protein-conjugated receptors (n=10–11 for each group). The puncta were manually counted by a blinded observer and the number of puncta at 0 and 3 min was determined (N0 and N3, respectively). The change in puncta was calculated as (N0-N3)/N0. (b-d) Changes in BRET signals were monitored in CHO-LOX-1 cells expressing the following conformational biosensors: AT1-C-tailP1 (b) and AT1-ICL3P3 (c, d) bearing FlAsH insertion at the cytoplasmic-terminal tail (C-tailP1) and the third intracellular loop (ICL3P3) of AT1, respectively, that interact with Renilla luciferase at the end of the cytoplasmic tail. Cells were subjected to treatments with vehicle, oxLDL (10 μg/mL), Ang II (10–5M), the combination of Ang II and oxLDL, and the combination of AngII, oxLDL, and LOX-1 antibody. The BRET ratios were calculated every 16 s for a total of 320 s and the relative change in intramolecular BRET ratio (ΔBRET) was calculated by subtracting the average BRET ratio measured for cells stimulated with vehicle at each time point. Lower panels indicate average ΔBRET of all the time points during measurement. Data are represented as mean ± SEM. Differences were determined by one-way ANOVA, followed by Tukey’s multiple comparison test (a-d).
-
Figure 2—source data 1
Co-treatment of oxidized low-density lipoprotein (oxLDL) with angiotensin II (Ang II) induces conformational change of AT1 different from each treatment alone.
Source data for Figure 2a–d.
- https://cdn.elifesciences.org/articles/98766/elife-98766-fig2-data1-v1.xlsx
Figure 2—figure supplement 1
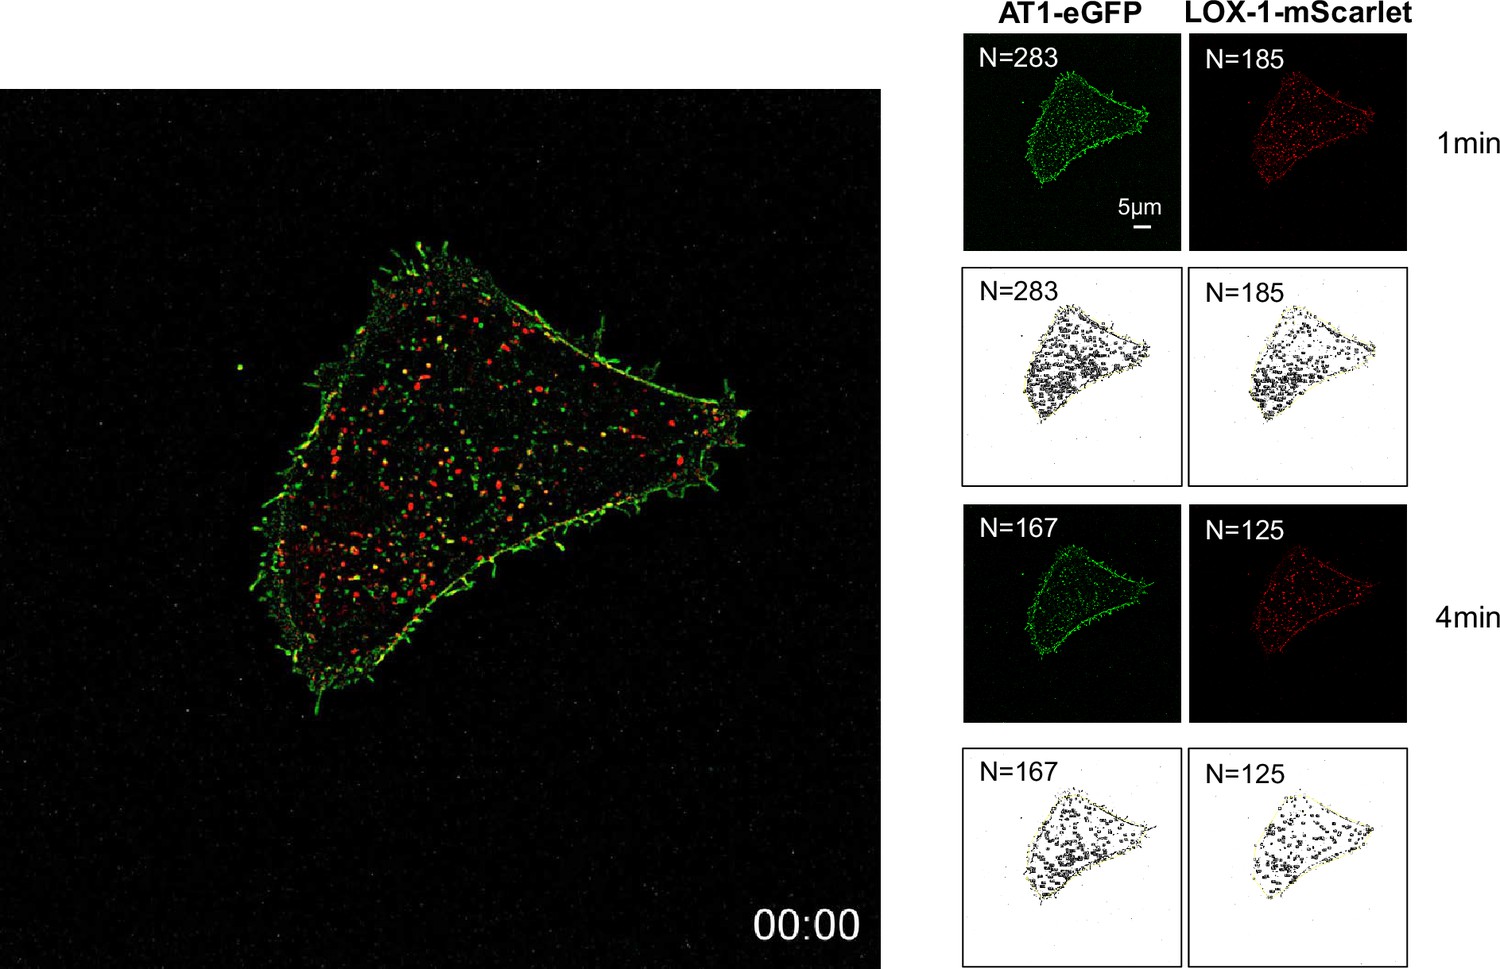
Live-imaging analysis of membrane LOX-1 and AT1 in response to the co-treatment of oxidized low-density lipoprotein (oxLDL) with AngII.
Real-time membrane imaging of Chinese hamster ovary (CHO) cells co-transfected with LOX-1-mScarlet and AT1-eGFP in response to oxLDL (10 μg/ml) in the combination of Ang II (10–7M) (Video 1). A count of puncta was performed using separate images visualizing LOX-1-mScarlet (red puncta) and AT1-eGFP (green puncta) immediately before and 3 min after ligand application.
Figure 3 with 3 supplements
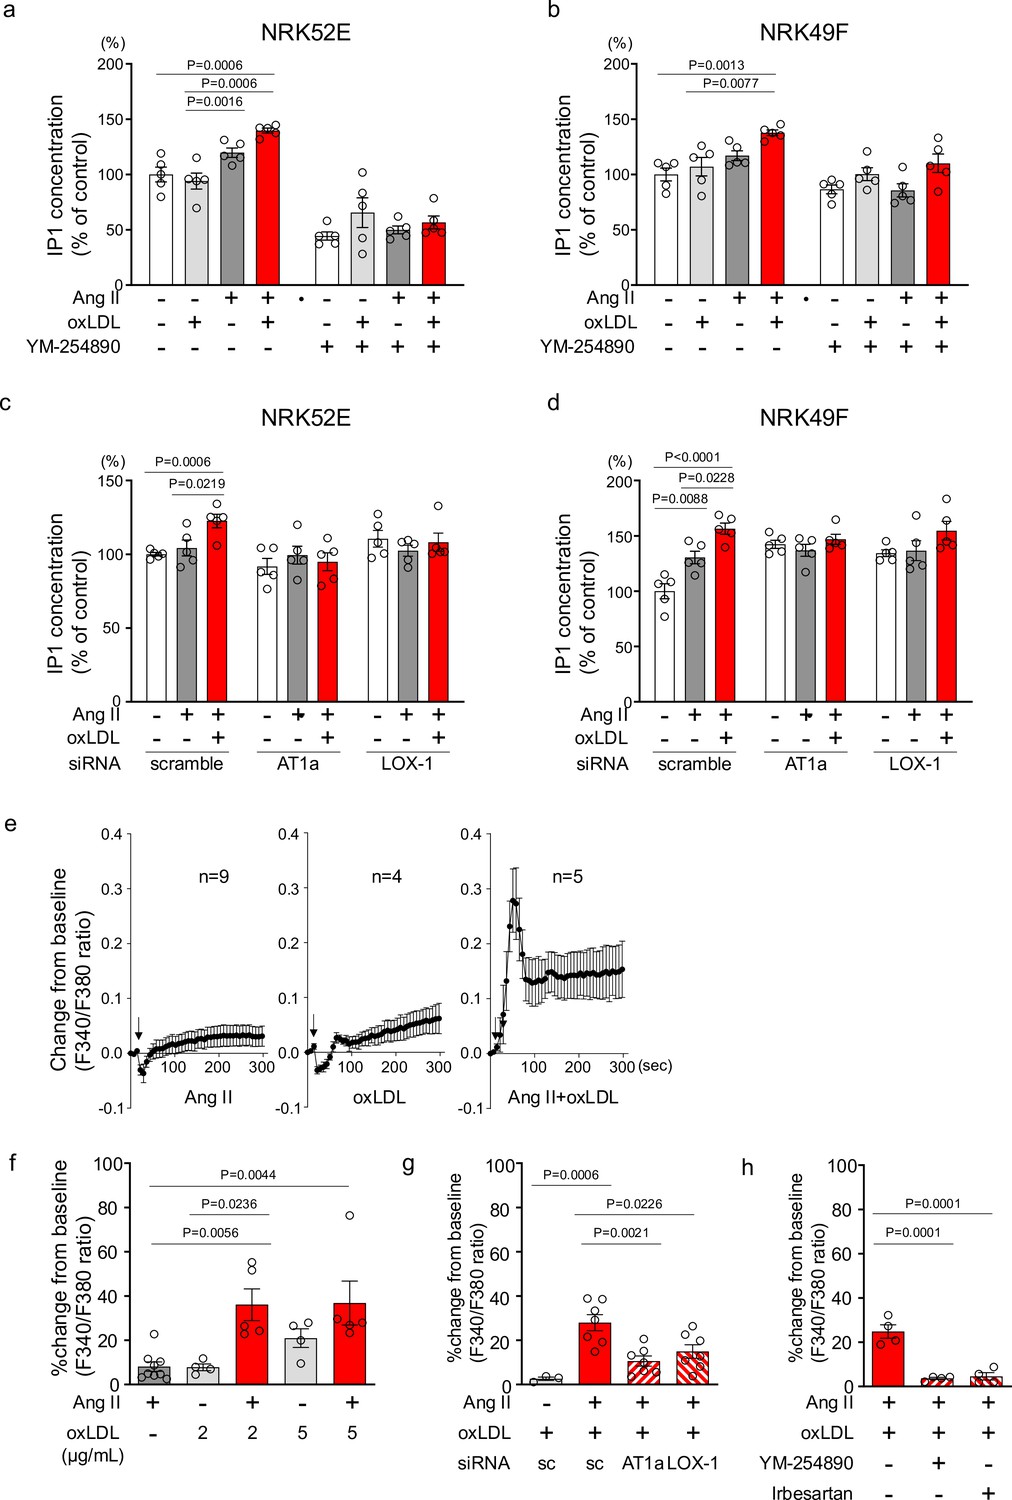
Oxidized low-density lipoprotein (LDL) potentiates angiotensin II (Ang II)-induced G protein αq subunit (Gq)-calcium signaling in renal cells.
(a, b) IP1 concentration in response to Ang II (10–7 M), oxLDL (10 μg/mL), and the combination of both with or without YM-254890, Gq inhibitor, in NRK52E (a) and NRK49F cells (b) (n=5 for each group). (c, d) IP1 concentration in response to Ang II (10–7 M) and oxLDL (10 μg/mL) in the combination of Ang II (10–7 M) and the additional effect of siRNA-mediated knockdown of Agtr1a or Olr1 in NRK52E (c) and NRK49F cells (d) (n=5 for each group). (e) Intracellular calcium concentration in NRK49F cells using Fura 2-AM and dual-excitation microfluorometry. Changes in the fluorescence intensity ratio (F340/F380) served as an index of the calcium dynamics. Cells were exposed to Ang II (10–7 M), oxLDL (2 μg/mL), and a combination of both agents. Addition of these agonists is marked with arrows on the timeline of the assay. Data acquisition and analysis were performed using a digital image analyzer to monitor real-time calcium flux (n=4–9). (f) Percentage changes from baseline in the ratio of emission signals (F340/F380) measured by Fura 2-AM were quantified following treatment with Ang II (10–7 M) and oxLDL at the concentrations detailed in the Figure in NRK49F cells (n=5 for each group).Biological replicates were performed using 3 independent cell cultures. (g) Impact of siRNA-mediated knockdown Agtr1a or Olr1 on the percentage changes from baseline in the ratio of emission signals (F340/F380) measured by Fura 2-AM were quantified following treatment with Ang II (10–7 M) and oxLDL (2 μg/mL) in NRK49F cells (n=3–7). (g) Impact of co-treatment of YM-254890, Gq inhibitor, or Irbesartan, an angiotensin receptor blocker (ARB), on the percentage changes from baseline in the ratio of emission signals (F340/F380) measured by Fura 2-AM were quantified following treatment with Ang II (10–7 M) and oxLDL (2 μg/mL) in NRK49F cells (n=4 for each group). Data are represented as mean ± SEM. Differences were determined using one-way ANOVA, followed by Tukey’s multiple comparison test for (a-d) and (f-h).
-
Figure 3—source data 1
Oxidized low-density lipoprotein (LDL) potentiates angiotensin II (Ang II)-induced G protein αq subunit (Gq)-calcium signaling in renal cells.
Source data for Figure 3a–h.
- https://cdn.elifesciences.org/articles/98766/elife-98766-fig3-data1-v1.xlsx
Figure 3—figure supplement 1
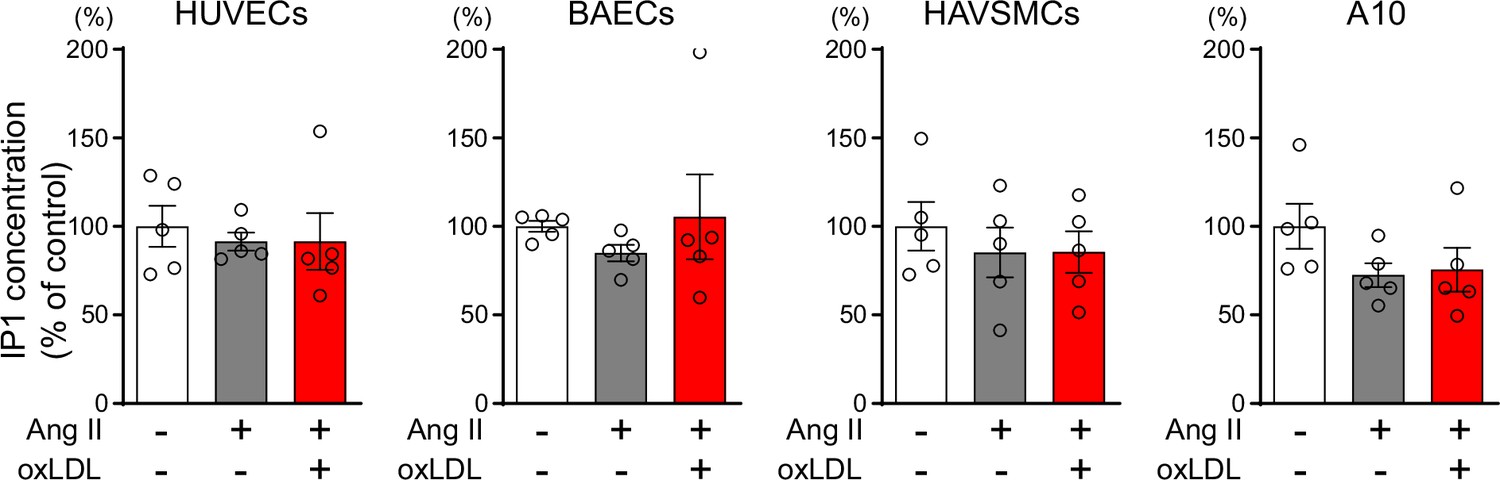
Oxidized low-density lipoprotein (LDL) in combination with angiotensin II (Ang II) do not increase cellular IP1 content in human umbilical vein endothelial cells and bovine vascular endothelial cells, human aortic vascular smooth muscle cells, and rat macrophages.
IP1 concentration in response to oxLDL (10 μg/ml) in the combination of Ang II (10–7M) in HUVECs (human umbilical vein endothelial cell), BAECs (bovine aortic endothelial cell), HAVSMCs (human aortic vascular smooth muscle cell), and A10 cells (rat macrophages). Data are represented as mean ± SEM. Differences were determined using one-way ANOVA, followed by Tukey’s multiple comparison test (n=5 for each group).
-
Figure 3—figure supplement 1—source data 1
Oxidized low-density lipoprotein (LDL) in combination with angiotensin II (Ang II) do not increase cellular IP1 content in human umbilical vein endothelial cells and bovine vascular endothelial cells, human aortic vascular smooth muscle cells, and rat macrophages.
Source data for Figure 3—figure supplement 1.
- https://cdn.elifesciences.org/articles/98766/elife-98766-fig3-figsupp1-data1-v1.xlsx
Figure 3—figure supplement 2
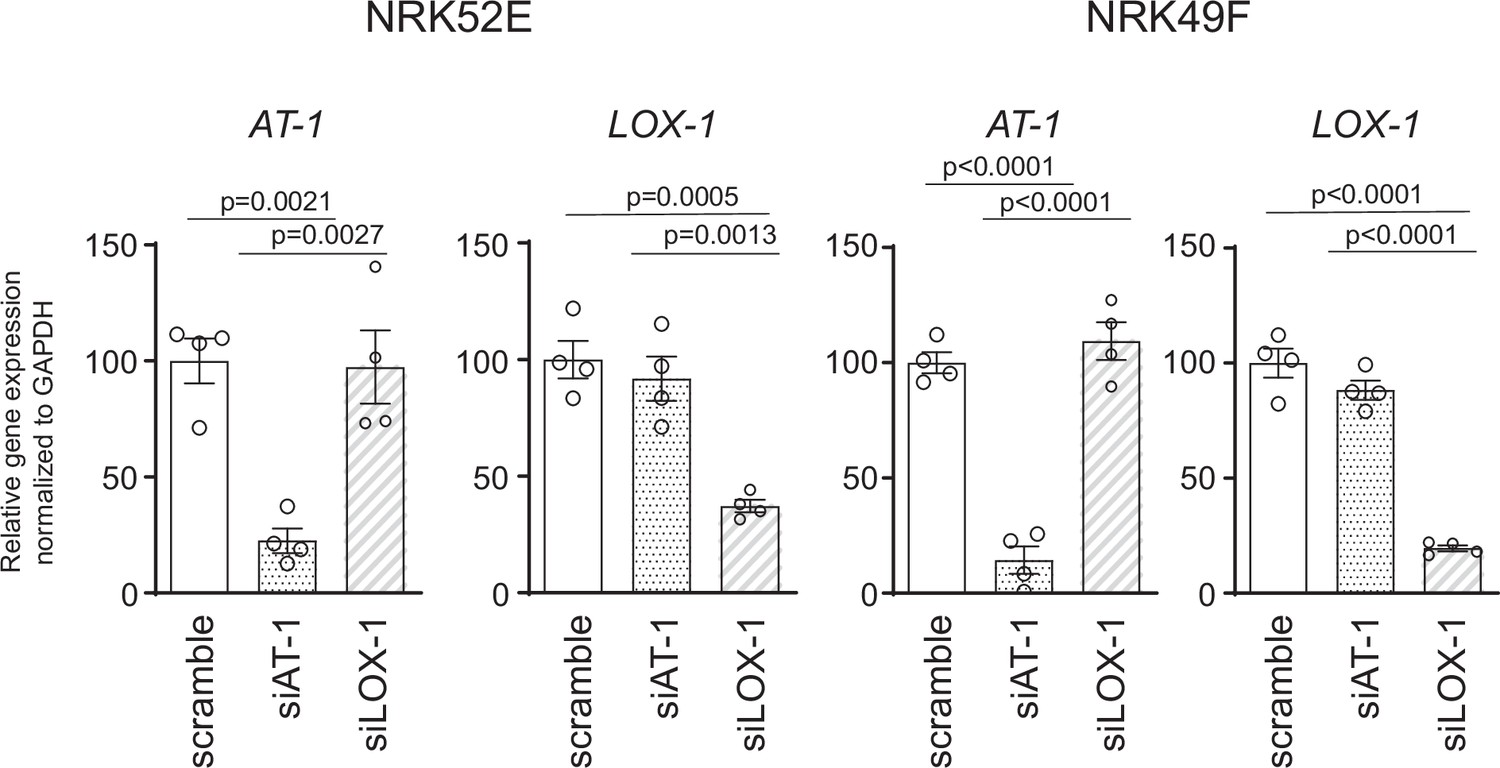
Efficiency of small interfering RNA (siRNA)-mediated knockdown for AT1a and LOX-1 in NRK52E and NRK49F cells.
NRK52E and NRK49F cells were transfected with siRNAs against scrambled siRNA, Agtr1a, or Olr1. The efficiency of siRNA-mediated gene silencing was quantified by assessing Agtr1a and Olr1 expression levels using quantitative real-time PCR. Data are represented as mean ± SEM. Differences were determined using one-way ANOVA, followed by Tukey’s multiple comparison test.
-
Figure 3—figure supplement 2—source data 1
Efficiency of small interfering RNA (siRNA)-mediated knockdown for AT1a and LOX-1 in NRK52E and NRK49F cells.
Source data for Figure 3—figure supplement 2.
- https://cdn.elifesciences.org/articles/98766/elife-98766-fig3-figsupp2-data1-v1.xlsx
Figure 3—figure supplement 3

Calcium influx was not induced by either the combination treatment of angiotensin II (Ang II) or oxidized low-density lipoprotein (oxLDL) or each treatment alone in NRK52E cells.
Percentage changes from baseline in the ratio of emission signals (F340/F380) measured by Fura 2-AM were quantified following treatment with Ang II (10–7M) and oxLDL at the concentrations detailed in the Figure for NRK49E cells (n=5–7 for each group). Data are represented as mean ± SEM. Differences were determined using one-way ANOVA, followed by Tukey’s multiple comparison test.
-
Figure 3—figure supplement 3—source data 1
Calcium influx was not induced by either the combination treatment of angiotensin II (Ang II) or oxidized low-density lipoprotein (oxLDL) or each treatment alone in NRK52E cells.
Source data for Figure 3—figure supplement 3.
- https://cdn.elifesciences.org/articles/98766/elife-98766-fig3-figsupp3-data1-v1.xlsx
Figure 4
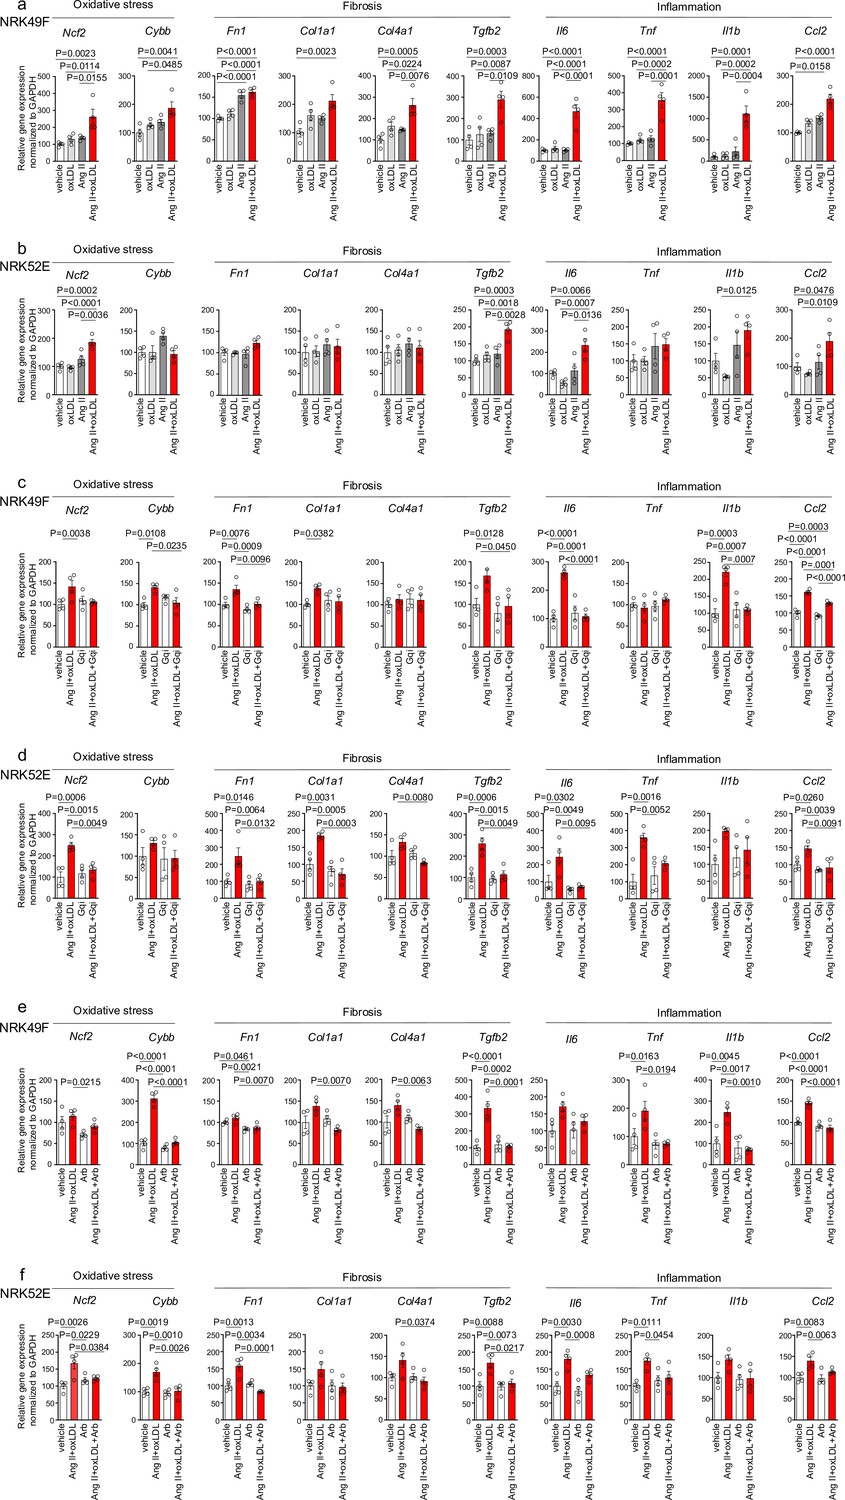
Co-treatment of oxidized low-density lipoprotein (oxLDL) and AII enhanced cellular response upon G protein αq subunit (Gq) activation in renal cells.
(a, b) Quantitative real-time PCR analysis was performed to measure the gene expression of NADPH oxidase subunits (Ncf2 and Cybb), fibrosis markers (Fn1, Col1a1, Col4a1, and Tgfb2), and inflammatory cytokines (Tnf, IL1β, IL-6, and Ccl2) in NRK49F cells (a) and NRK 52E cells (b). Gene expression levels were normalized to those of Gapdh. Cells were stimulated by oxLDL (5 μg/mL), angiotensin II (Ang II) (10–7 M), or their combination (n=4 for each group). (c, d) Cells were pre-treated with vehicle or Gq inhibitor (YM-254890, Gqi), followed by treatment with vehicle or the combination of oxLDL (5 μg/mL) and Ang II (10–7 M) in NRK49F cells (c) and NRK 52E cells (d) (n=4 for each group). (e, f) Cells were pre-treated with vehicle or ARB (Irbesartan, Arb), followed by treatment with vehicle or the combination of oxLDL (5 μg/mL) and Ang II (10–7 M) in NRK49F cells (e) and NRK 52E cells (f) (n=4 for each group). Data are represented as mean ± SEM. Differences were determined by one-way ANOVA, followed by Tukey’s multiple comparison test (a-f).
-
Figure 4—source data 1
Co-treatment of oxidized low-density lipoprotein (oxLDL) and AII enhanced cellular response upon G protein αq subunit (Gq) activation in renal cells.
Source data for Figure 4a–f.
- https://cdn.elifesciences.org/articles/98766/elife-98766-fig4-data1-v1.xlsx
Figure 5
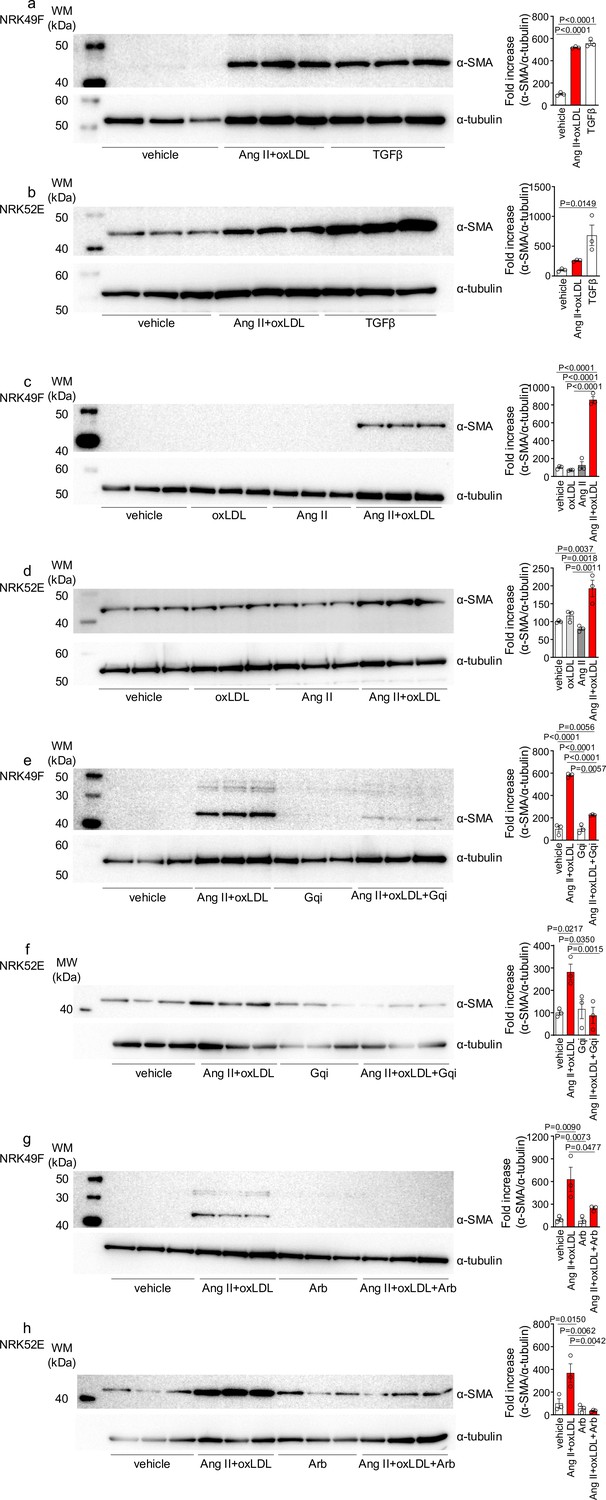
Oxidized low-density lipoprotein (LDL) enhanced angiotensin II (Ang II)-induced epithelial-mesenchymal transition (EMT) in NRK52E and NRK49F cells.
(a, b) Left: Western blot analysis of α-smooth muscle actin (α-SMA), a marker of epithelial-mesenchymal transition (EMT), in NRK49F (a) and NRK52E (b) cells. Cells were stimulated with oxLDL (5 μg/mL), Ang II (10–7 M), and TGF-β (10 ng/mL), with TGF-β serving as a well-known EMT inducer. Right: Densitometric analysis of α-SMA protein expression normalized to α-Tubulin (n=3 for each group). (c, d) Left: Western blot analysis of α-SMA in NRK49F (c) or NRK52E (d) after stimulation with oxLDL (5 μg/mL), Ang II (10–7 M), and their combination. Right: Densitometric analysis of α-SMA protein expression normalized to α-tubulin (n=3 for each group). (e, f) Left: Western blot analysis of α-SMA in NRK49F (e) or NRK52E (f) after treatment with a combination of oxLDL (5 μg/mL) and Ang II (10–7 M). Prior to this treatment, the cells were pre-treated with either a vehicle or a Gq inhibitor (YM-254890, Gqi). Right: Densitometric analysis of α-SMA protein expression normalized to α-Tubulin (n=3 for each group). (g, h) Left: Western blot analysis of α-SMA in NRK49F (e) or NRK52E (f) after treatment with a combination of oxLDL (5 μg/mL) and Ang II (10–7 M). Prior to treatment, cells were pre-treated with either vehicle or ARB (Irbesartan, Arb). Right: Densitometric analysis of α-SMA protein expression normalized to α-tubulin (n=3 for each group). Data are represented as mean ± SEM. Differences were determined by one-way ANOVA, followed by Tukey’s multiple comparison test (a-f).
-
Figure 5—source data 1
Oxidized low-density lipoprotein (LDL) enhanced angiotensin II (Ang II)-induced epithelial-mesenchymal transition in NRK52E and NRK49F cells.
Source data for densitometric analysis in Figure 5a–h.
- https://cdn.elifesciences.org/articles/98766/elife-98766-fig5-data1-v1.xlsx
-
Figure 5—source data 2
Oxidized low-density lipoprotein (LDL) enhanced angiotensin II (Ang II)-induced epithelial-mesenchymal transition in NRK52E and NRK49F cells.
Original blots for western blot analysis displayed in Figure 5.
- https://cdn.elifesciences.org/articles/98766/elife-98766-fig5-data2-v1.zip
-
Figure 5—source data 3
Oxidized low-density lipoprotein (LDL) enhanced angiotensin II (Ang II)-induced epithelial-mesenchymal transition in NRK52E and NRK49F cells.
Original western blots for Figure 5, indicating the relevant bands and treatments.
- https://cdn.elifesciences.org/articles/98766/elife-98766-fig5-data3-v1.zip
Figure 6
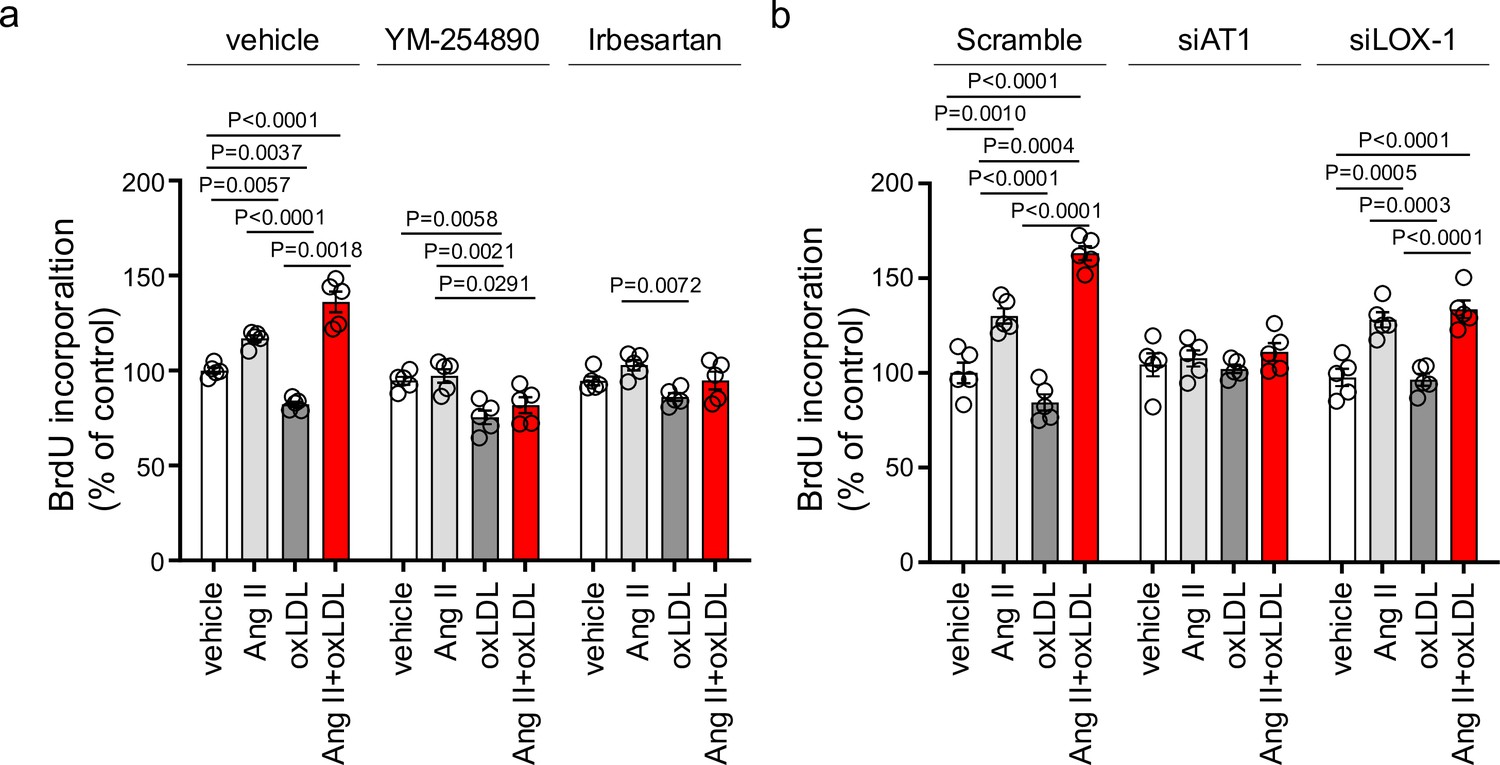
Oxidized low-density lipoprotein (LDL) enhanced angiotensin II (Ang II)-induced renal fibroblast proliferation via AT1-G protein αq subunit (Gq) signaling and LOX-1-dependent manner.
(a) Proliferative activity assessed by BrdU incorporation into NRK49F cells. Cells were pretreated with vehicle, YM-254890, or ARB, Irbesartan, followed by the treatment with oxLDL (5 μg/mL), Ang II (10–7 M), or their combination. (n=5 for each group). Biological replicates were performed using two independent cell cultures. (b) NRK49F cells were subjected to siRNA-mediated knockdown using specific siRNAs for Agtr1a (siAT1) or Olr1 (siLOX-1). Following knockdown, cells were treated with either vehicle, oxLDL (5 μg/mL), Ang II (10–7 M), or their combination. Proliferative activity was assessed by measuring the BrdU levels (n=5 for each group). Data are represented as mean ± SEM. Differences were determined using one-way ANOVA, followed by Tukey’s multiple comparison test for (a) and (b). Biological replicates were performed using two independent cell cultures.
-
Figure 6—source data 1
Oxidized low-density lipoprotein (LDL) enhanced angiotensin II (Ang II)-induced renal fibroblast proliferation via AT1-G protein αq subunit (Gq) signaling and LOX-1-dependent manner.
Source data for Figure 6a and b.
- https://cdn.elifesciences.org/articles/98766/elife-98766-fig6-data1-v1.xlsx
Figure 7 with 3 supplements
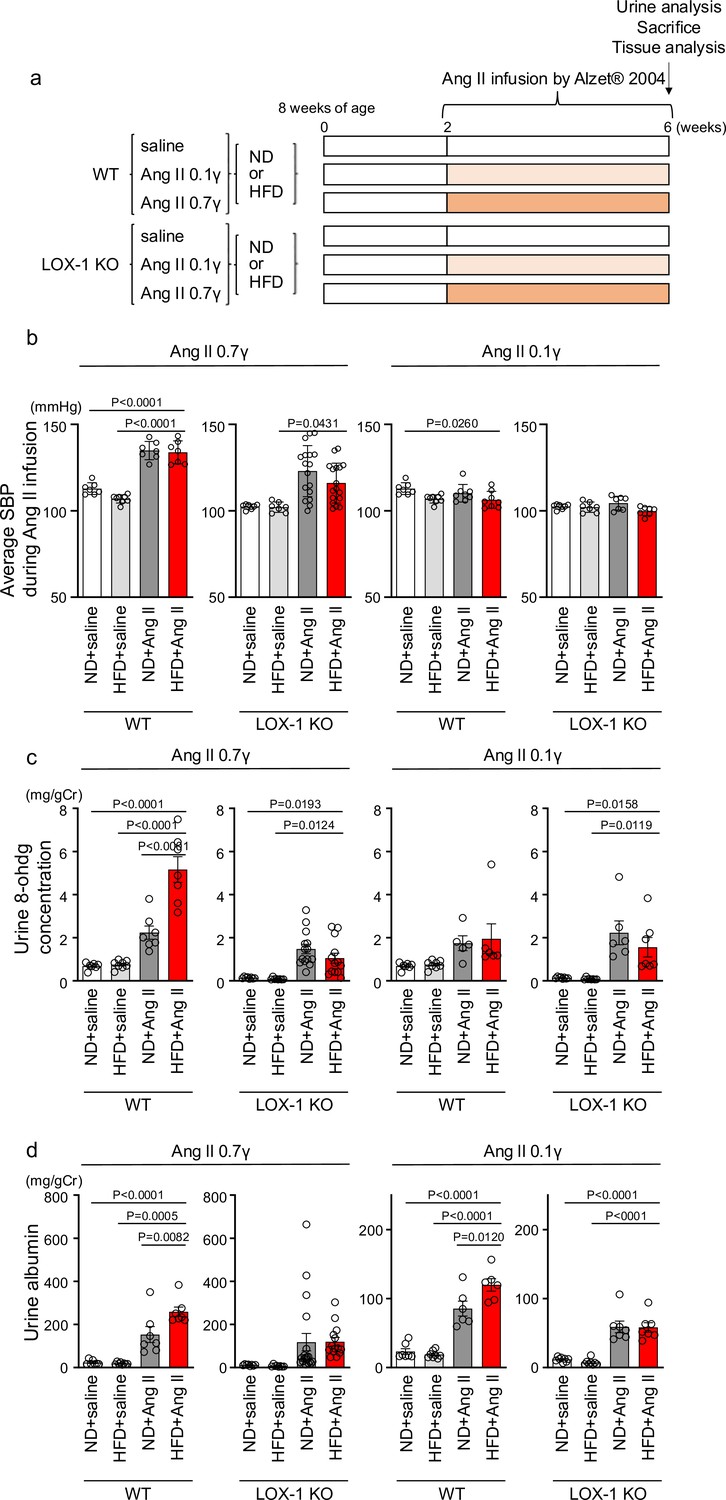
Oxidized low-density lipoprotein (LDL)-inducible diet exacerbates angiotensin II (Ang II)-induced renal dysfunction in wild-type mice, but not in LOX-1 knockout mice.
(a) A Schematic protocol for the animal experiments. Eight-wk-old male wild-type (WT) mice and male LOX-1 KO mice were fed either an normal diet (ND) or an high-fat diet (HFD) for 6 wk. After 10 wk of age, the mice were treated over a 4 wk period with infusions of either saline or Ang II. Ang II was administered at two dosage levels: a subpressor dose of 0.1 γ and a pressor dose of 0.7 γ, delivered via subcutaneously implanted osmotic pumps. At the end of the infusion period, urine was collected, the animals were sacrificed, and comprehensive tissue analysis was conducted to evaluate the renal effects of the treatments. (b) Average systolic blood pressure (SBP) measured at half-week intervals in WT and LOX-1 KO mice during the 4 wk infusion period. (c, d) Urine 8-OHDG concentrations (mg/g creatinine [Cr]) (c) and urine albumin concentrations (mg/g creatinine [Cr]) (d) in WT and LOX-1 KO mice at the conclusion of the 4 wk infusion period. Data are represented as mean ± SEM. Differences were determined by one-way ANOVA, followed by Tukey’s multiple comparison test (a-d).
-
Figure 7—source data 1
Oxidized low-density lipoprotein (LDL) inducible diet exacerbates angiotensin II (Ang II)-induced renal dysfuntion in wild-type mice, but not in LOX-1 knockout mice.
Source data for Figure 7b–d.
- https://cdn.elifesciences.org/articles/98766/elife-98766-fig7-data1-v1.xlsx
Figure 7—figure supplement 1

High-fat Diet used in the study prominently increased plasma LOX-1 ligand concentration.
Plasma LOX-1 ligand concentration of 14-wk-old wild-type mice upon normal diet (ND) and high-fat diet (HFD) for 6 wk. From 10 wk of age, these mice also received concurrent 4 wk infusions of angiotensin II (Ang II) at a pressor dose of 0.7 γ, administered through subcutaneously implanted osmotic pumps. Data are represented as mean ± SEM. Differences were determined using Student’s t-test (n=7 for each group).
-
Figure 7—figure supplement 1—source data 1
High-fat diet used in the study prominently increased plasma LOX-1 ligand concentration.
Source data for Figure 7—figure supplement 1.
- https://cdn.elifesciences.org/articles/98766/elife-98766-fig7-figsupp1-data1-v1.xlsx
Figure 7—figure supplement 2
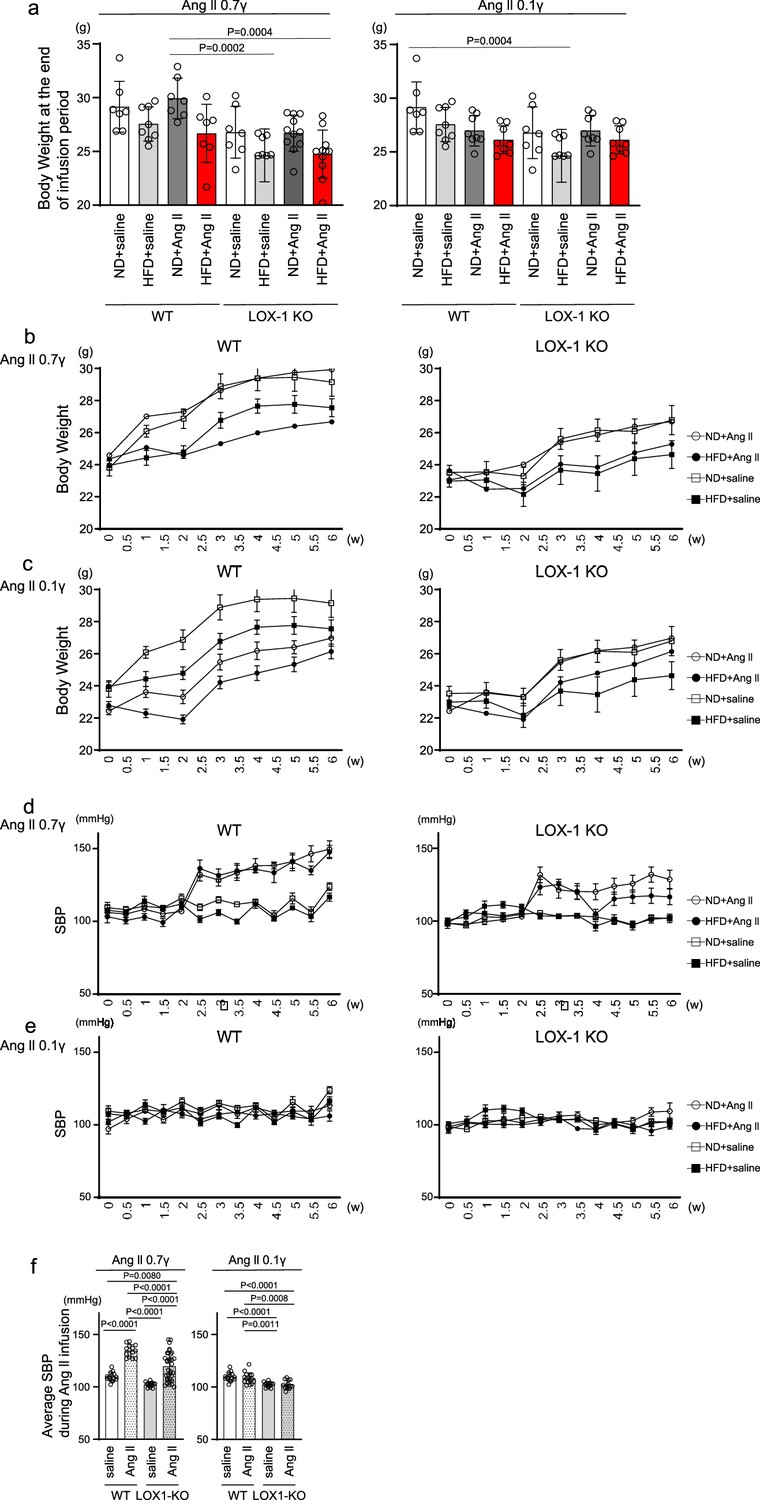
Impact of Diet and angiotensin II (Ang II) Infusion on Body Weight and Systolic Blood Pressure in Mice.
(a) Final Body weight: This figure shows the body weights of wild-type (WT) and LOX-1 KO mice at the end of the 4 wk infusion period, highlighting the effects of diet and pharmacological treatment. (b, c) Serial Body Weight Changes: These graphs depict the progression of body weight over time in WT and LOX-1 KO mice, illustrating the impact of the dietary regimen and Ang II infusion on weight dynamics. (d, e) Food Intake: Food intake Trajectory: Serial measurements of weekly food intake (g/wk per mouse) are presented for WT and LOX-1 KO mice. The Figures show the changes in food intake over the course of the study, corresponding to the administration of a pressor dose of 0.7 γ (d) and a subpressor dose of 0.1 γ (e) of Ang II, respectively. (f, g) Systolic Blood Pressure Trajectory: Serial measurements of systolic blood pressure (SBP) obtained using the tail-cuff method are presented for WT and LOX-1 KO mice. The Figures show the changes in SBP over the course of the study, corresponding to the administration of a pressor dose of 0.7 γ (d) and a subpressor dose of 0.1 γ (e) of Ang II, respectively. Beginning at 8 wk of age, mice were fed either an normal diet (ND) or an high-fat diet (HFD) for 6 wk. From 10 wk of age, coinciding with the 2 wk time point in the Figure, the mice underwent a 4 wk period of infusion with either vehicle or Ang II. The infusion was delivered at specific dosage levels through subcutaneously implanted osmotic pumps. Data are represented as mean ± SEM. Differences were determined using one-way ANOVA, followed by Tukey’s multiple comparison test for (a).
-
Figure 7—figure supplement 2—source data 1
Impact of diet and angiotensin II (Ang II) infusion on body weight and systolic blood pressure in mice.
Source data for Figure 7—figure supplement 2a–g.
- https://cdn.elifesciences.org/articles/98766/elife-98766-fig7-figsupp2-data1-v1.xlsx
Figure 7—figure supplement 3

No significant difference was found in plasma aldosterone concentration between a normal diet and a high fat diet-fed wild-type mice with a pressor dose of angiotensin II (Ang II).
Plasma aldosterone concentration in 14-wk-old wild-type mice fed an normal diet (ND) or an high-fat diet (HFD) for 6 wk. From 10 wk of age, these mice also received concurrent 4 wk infusions of Ang II at a pressor dose of 0.7 γ, administered through subcutaneously implanted osmotic pumps. Data are represented as mean ± SEM. Differences were determined using Student’s t-test (n=7 for each group).
-
Figure 7—figure supplement 3—source data 1
No significant difference was found in plasma aldosterone concentration between a normal diet and a high fat diet-fed wild-type mice with a pressor dose of angiotensin II (Ang II).
Source data for Figure 7—figure supplement 3.
- https://cdn.elifesciences.org/articles/98766/elife-98766-fig7-figsupp3-data1-v1.xlsx
Figure 8 with 1 supplement
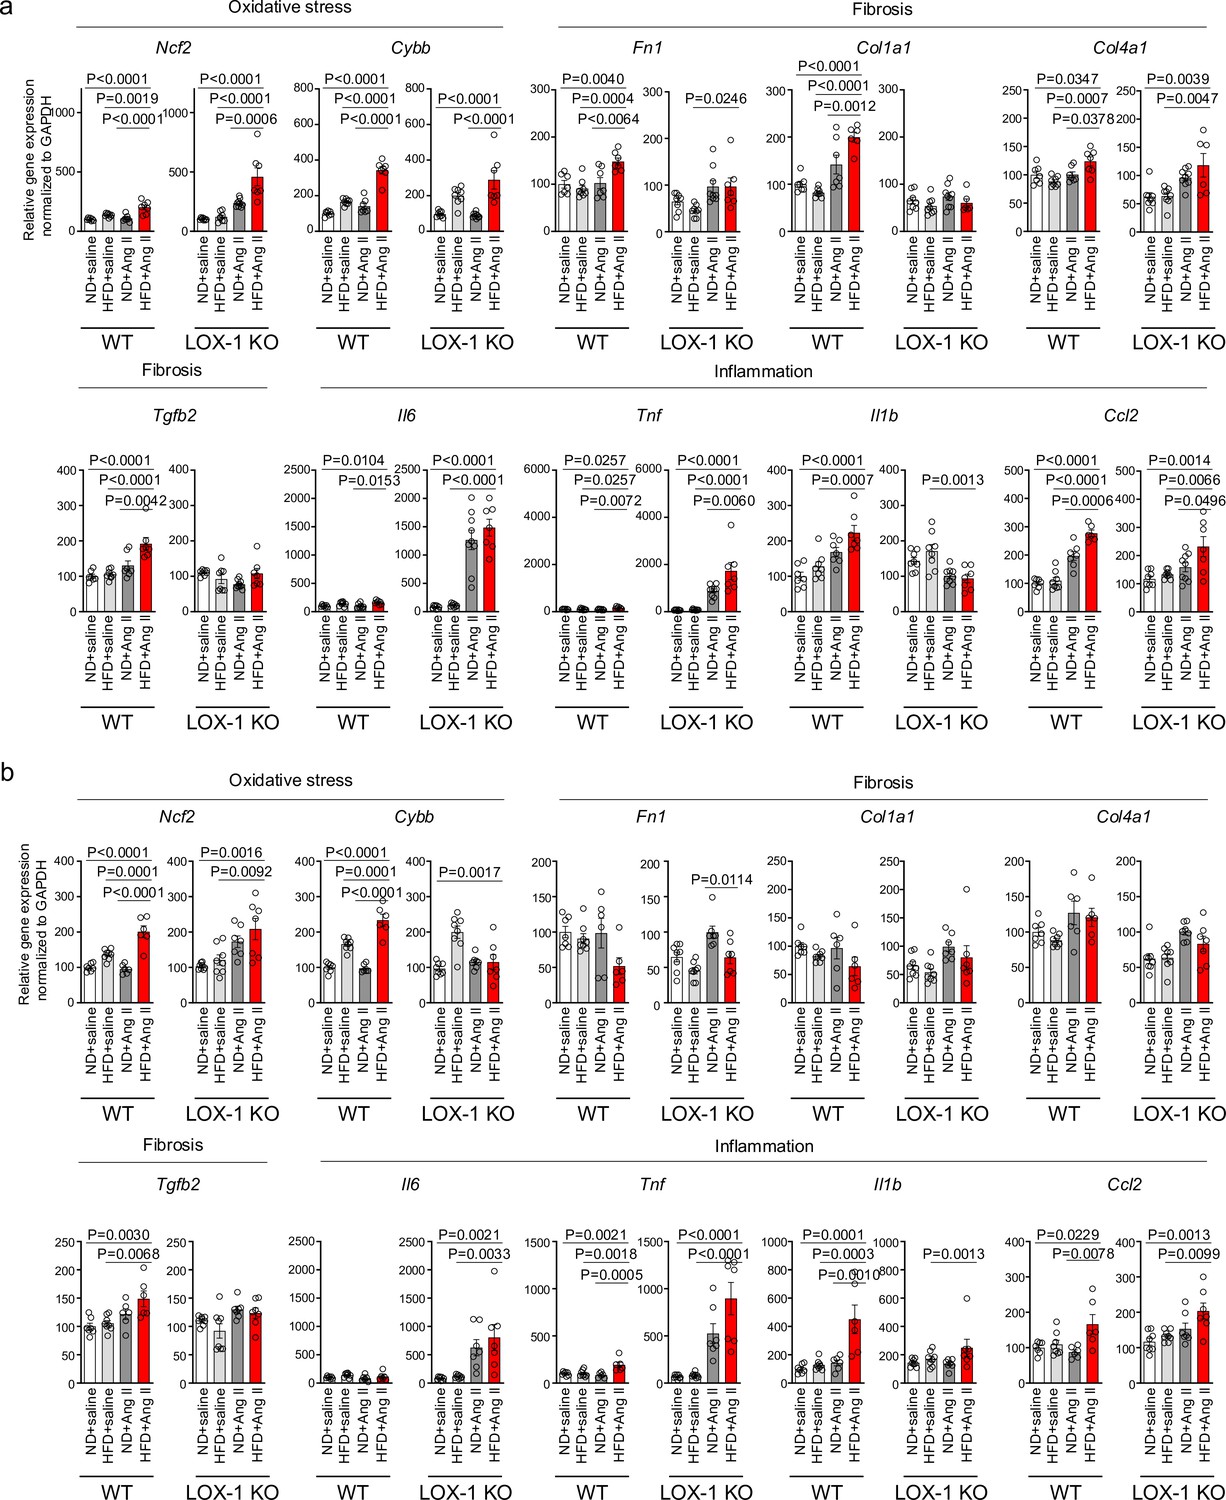
A high-fat diet enhanced angiotensin II (Ang II)-induced renal injury-related gene expression in the kidney in a LOX-1-dependent manner.
Quantitative real-time PCR analysis for gene expression of NADPH components (Ncf2 and Cybb), inflammatory cytokines (Il6, Tnf, Il1b, and Ccl2), and fibrosis markers (Tgfb2, Fn1, Col1a1, and Col4a1) in the kidney harvested from wild-type (WT) and LOX-1 KO mice. The experimental procedures, including the dietary regimen and Ang II administration, are detailed in Figure 7a. Mice were administered either a pressor dose of 0.7 γ Ang II (a) or a subpressor dose of 0.1 γ Ang II (b). Data are represented as mean ± SEM. Differences were determined using one-way ANOVA, followed by Tukey’s multiple comparison test for (a) and (b).
-
Figure 8—source data 1
A high-fat diet enhanced angiotensin II (Ang II)-induced renal injury-related gene expression in the kidney in a LOX-1-dependent manner.
Source data for Figure 8a and b.
- https://cdn.elifesciences.org/articles/98766/elife-98766-fig8-data1-v1.xlsx
Figure 8—figure supplement 1
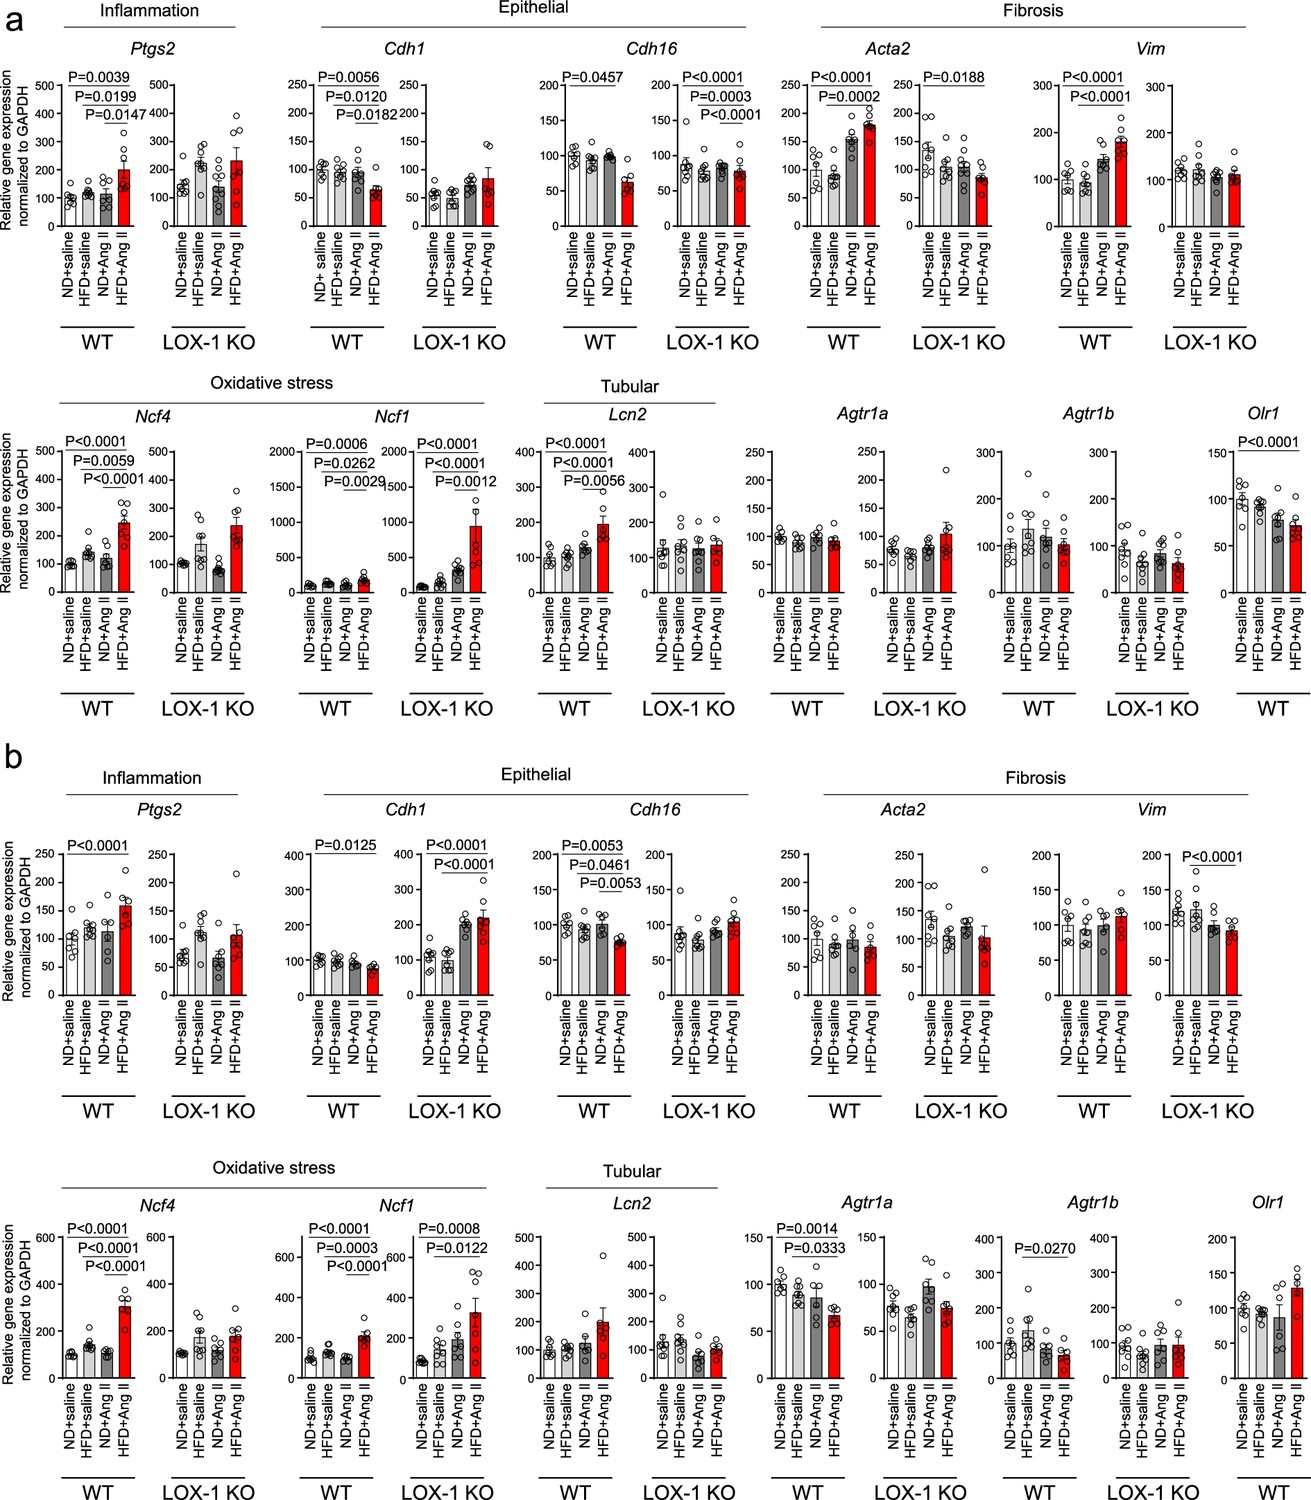
A high-fat diet enhanced angiotensin II (Ang II)-induced renal injury-related gene expression in the kidney in a LOX-1-dependent manner.
Quantitative real-time PCR analysis for gene expression of NADPH components (Ncf4 and Ncf1), inflammatory gene (Ptgs2), fibrosis markers (Acta2 and Vim), epithelial markers (Cdh1 and Chd16), tubular marker (Ptgs2), Agtr1a, Agtr1b, and Olr1 in the kidney harvested from wild-type (WT) and LOX-1 KO mice. The experimental procedures, including the dietary regimen and Ang II administration, are detailed in Figure 7a. Mice were administered either a pressor dose of 0.7 γ Ang II (a) or a subpressor dose of 0.1 γ Ang II (b). Data are represented as mean ± SEM. Differences were determined using one-way ANOVA, followed by Tukey’s multiple comparison test for (a) and (b).
-
Figure 8—figure supplement 1—source data 1
A high-fat diet enhanced angiotensin II (Ang II)-induced renal injury-related gene expression in the kidney in a LOX-1-dependent manner.
Source data for Figure 8—figure supplement 1a and b.
- https://cdn.elifesciences.org/articles/98766/elife-98766-fig8-figsupp1-data1-v1.xlsx
Figure 9 with 2 supplements
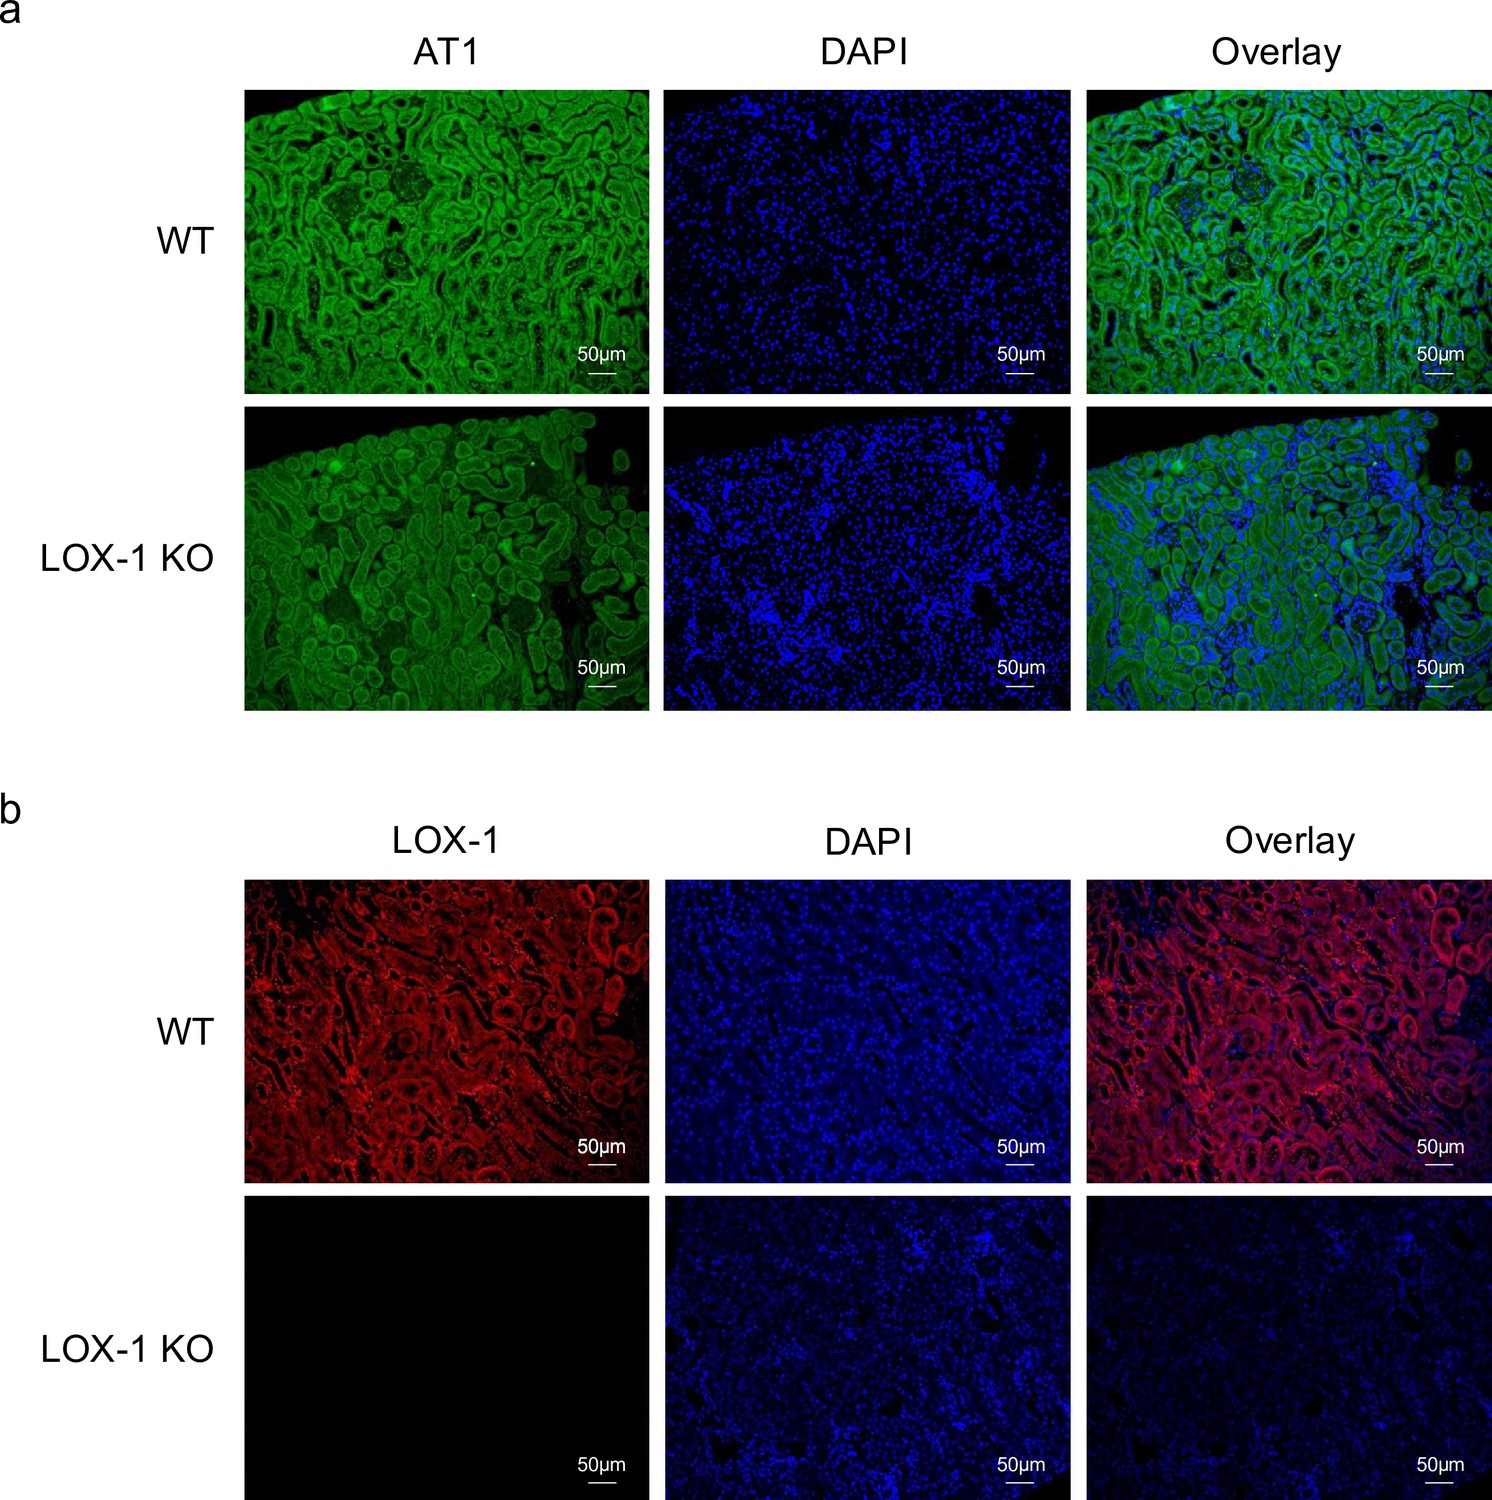
LOX-1 and AT1a were predominantly co-localized in renal tubules.
(a, b) Representative images depicting staining for LOX-1 (a) and AT1 (b) in the renal cortex tissues from wild-type mice (WT) and LOX-1 knockout mice (LOX-1 KO). Nuclei are stained blue with DAPI. Green and red signals indicate AT1, while the red signal indicates LOX-1. Overlay images demonstrate the merged visualization of AT1 or LOX-1 with DAPI, highlighting the predominant colocalization of LOX-1 and AT1 in renal tubules as opposed to the glomerulus.
Figure 9—figure supplement 1
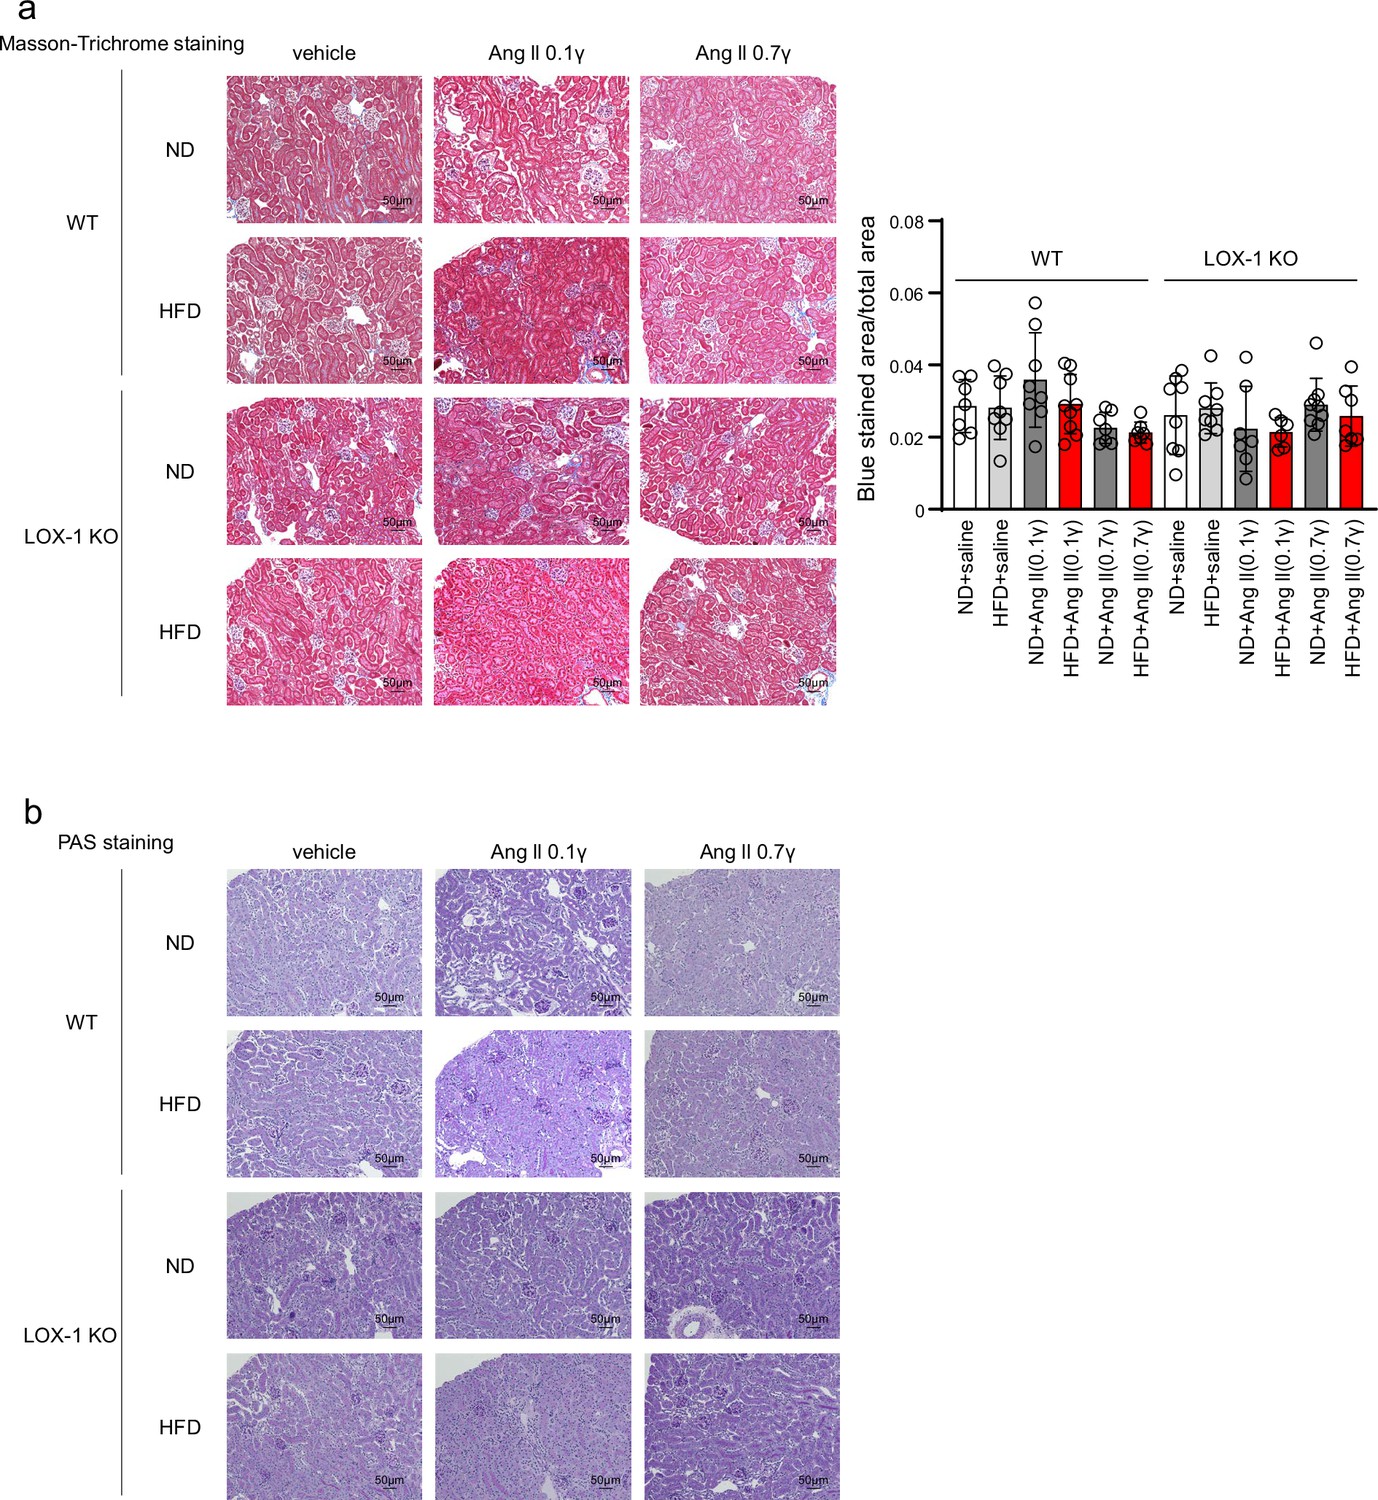
The treatment with angiotensin II (Ang II), a high fat diet, or their combination for 4 wk did not induce any histological changes indicative of renal injury.
(a) Left: Representative histological images of Masson-Trichrome staining used to detect fibrosis in renal tissues harvested from wild-type (WT) and LOX-1 KO mice. Right: Quantitative analysis by Masson-Trichrome staining. Data are represented as mean ± SEM. Differences were determined using one-way ANOVA, followed by Tukey’s multiple comparison test. (b) Representative histological images of renal tissues harvested from WT and LOX-1 KO mice stained for periodic acid-Schiff (PAS) to assess mesangial expansion and glomerular area, providing insight into the structural integrity of the glomeruli. Eight-week-old mice were fed an normal diet (ND) or an high-fat diet (HFD) for 6 wk. From 10 wk of age, these mice were concurrently treated for 4 wk with infusions of vehicle or Ang II (a subpressor dose of 0.1 γ or a pressor dose of 0.7 γ) through subcutaneously implanted osmotic pomps.
-
Figure 9—figure supplement 1—source data 1
The treatment with angiotensin II (Ang II), a high fat diet, or their combination for 4 wk did not induce any histological changes indicative of renal injury.
Source data for quantitative analysis for Masson-Trichrome staining in Figure 9—figure supplement 1a.
- https://cdn.elifesciences.org/articles/98766/elife-98766-fig9-figsupp1-data1-v1.xlsx
Figure 9—figure supplement 2
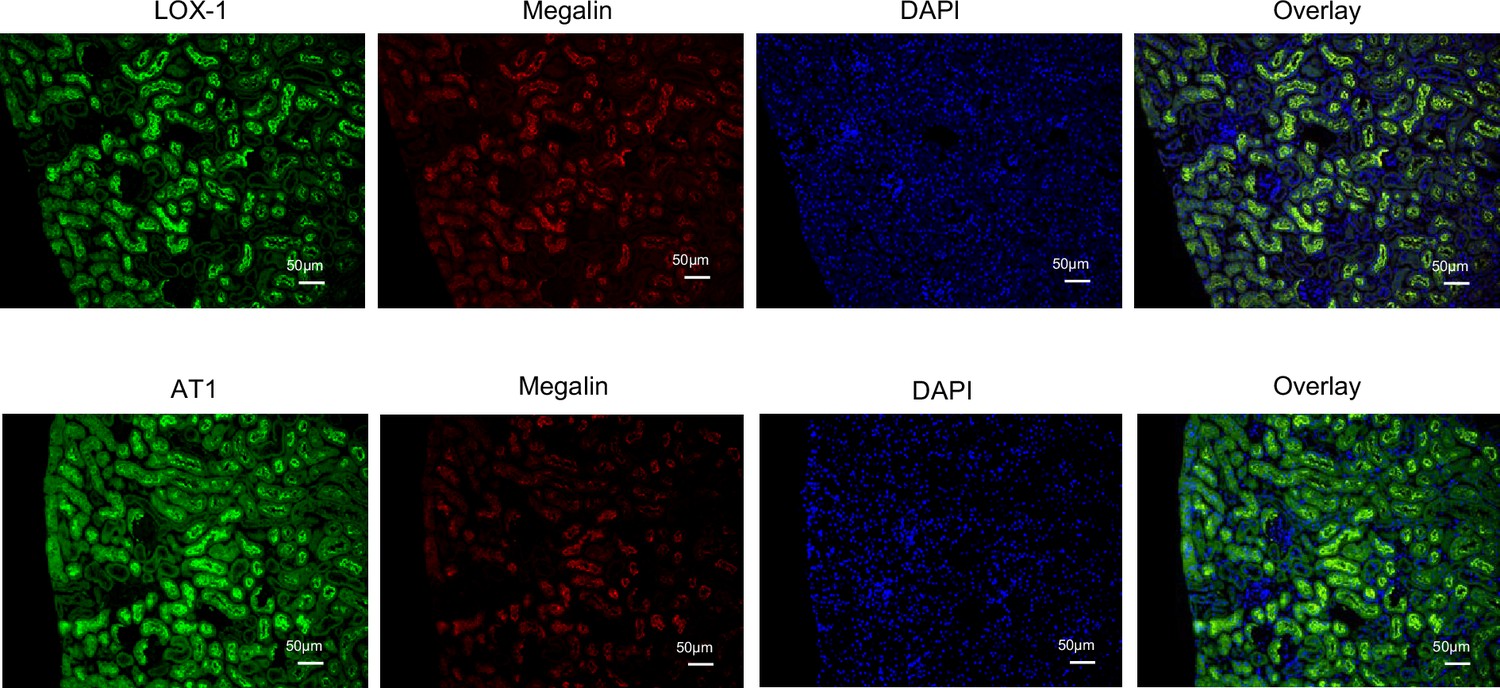
LOX-1 and AT1a were co-localized with megalin.
Representative images showing co-staining of LOX-1 (upper panels) and AT1 (lower panels) with megalin in renal cortex tissues from wild-type (WT) mice. Nuclei are stained blue with DAPI. Green signals indicate LOX-1 or AT1, while red signals indicate megalin. The overlay images show the merged visualization of AT1 or LOX-1 with megalin and DAPI, highlighting the predominant co-localization of LOX-1 and AT1 at the brush borders.
Figure 10
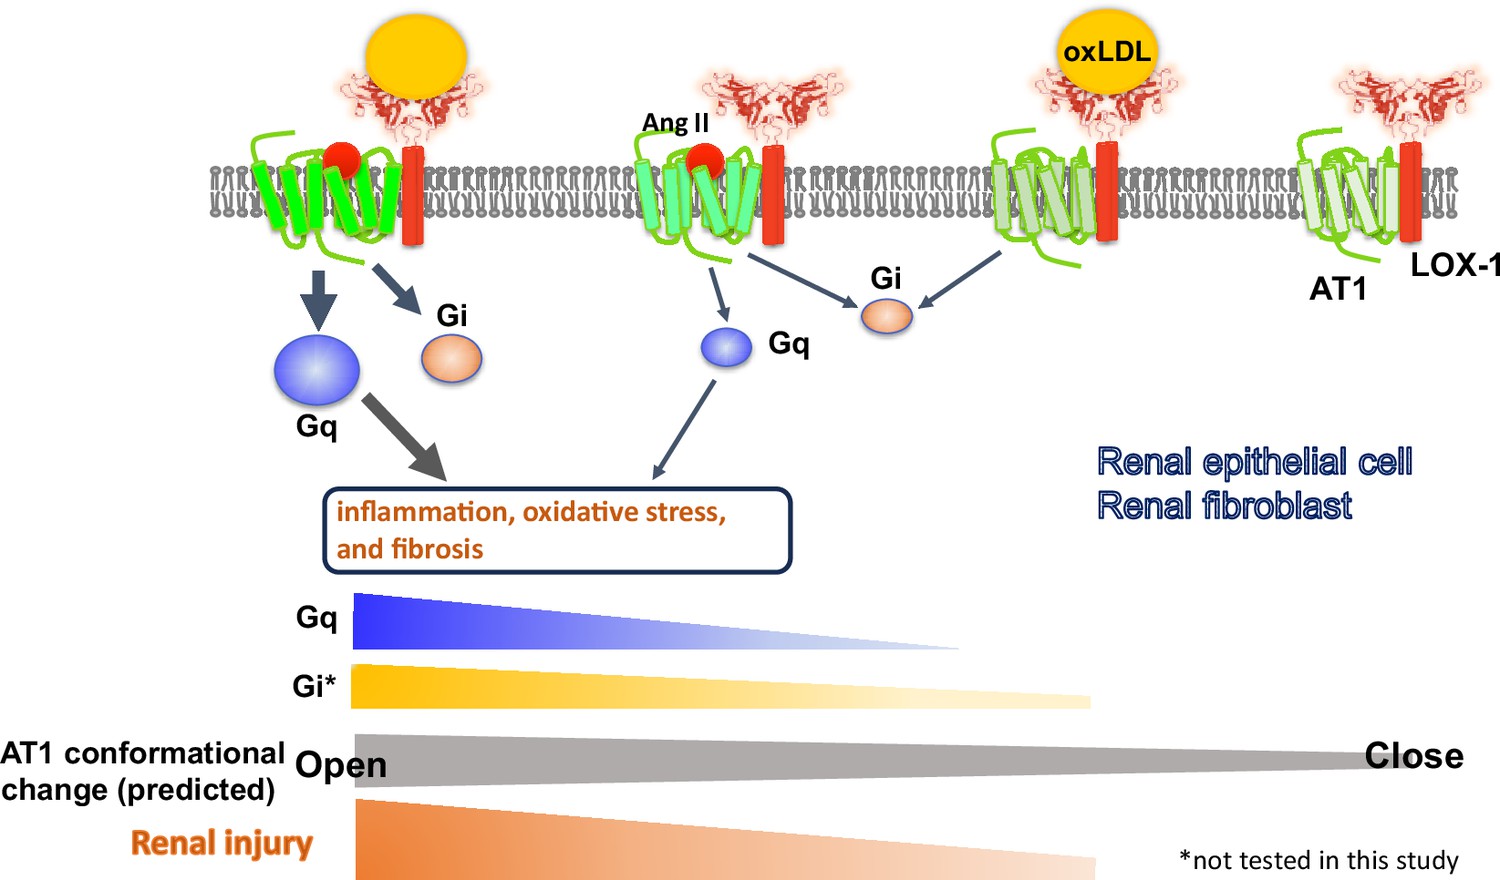
Schematic overview of the AT1 and LOX-1 Interaction dynamics in renal cells.
This schematic summary illustrates the predicted structure-activation relationship of the AT1 receptor within the LOX-1-AT1 complex in renal component cells. This highlights how the simultaneous binding of angiotensin II (Ang II) to AT1 and oxidized low-density lipoprotein (oxLDL) to LOX-1 induces conformational changes in AT1. These changes were more pronounced than those triggered by the individual ligands. Such structural alterations have been proposed to amplify G protein αq subunit (Gq) signaling pathway activation, subsequently leading to renal damage.
Author response image 1

Videos
Video 1
Live-imaging of membrane LOX-1 and AT1 in response to the co-treatment of oxidized low-density lipoprotein (oxLDL) with AngII.
Real-time membrane imaging of Chinese hamster ovary (CHO) cells co-transfected with LOX-1-mScarlet and AT1-eGFP in response to oxLDL (10 μg/ml) in the combination of angiotensin II (Ang II) (10–7M).
Additional files
-
Supplementary file 1
Primer sequences used in this study.
This table lists the gene symbols, names, and primer sequences used in the study. The first section contains primer sequences for rats, while the second section contains those for mice.
- https://cdn.elifesciences.org/articles/98766/elife-98766-supp1-v1.docx
-
MDAR checklist
- https://cdn.elifesciences.org/articles/98766/elife-98766-mdarchecklist1-v1.docx
Download links
A two-part list of links to download the article, or parts of the article, in various formats.
Downloads (link to download the article as PDF)
Open citations (links to open the citations from this article in various online reference manager services)
Cite this article (links to download the citations from this article in formats compatible with various reference manager tools)
Oxidized low-density lipoprotein potentiates angiotensin II-induced Gq activation through the AT1-LOX1 receptor complex
eLife 13:RP98766.
https://doi.org/10.7554/eLife.98766.3


