Induction of hepatitis B core protein aggregation targeting an unconventional binding site
- Rudolf Virchow Center, Center for Integrative and Translational Bioimaging; University of Würzburg, Germany
- Biocenter, University of Würzburg, Germany
Figures
Figure 1
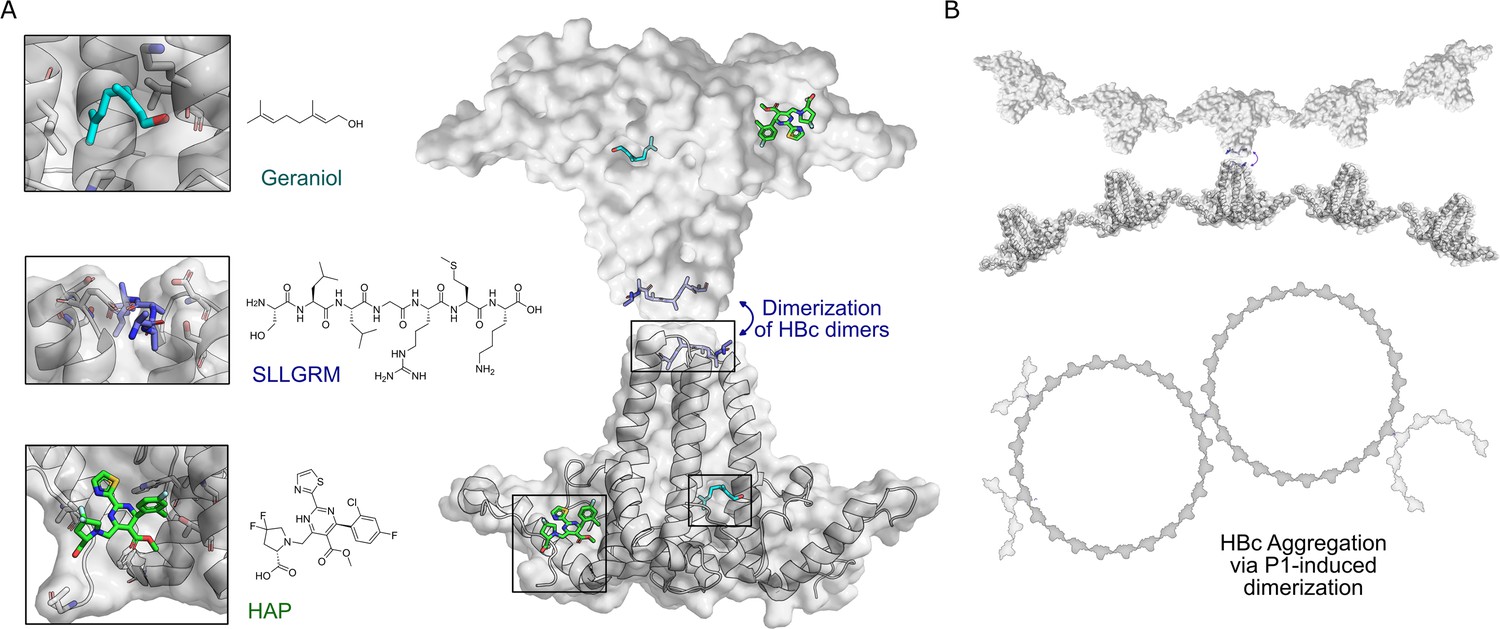
HBc binding pockets and mode of action of dimeric binders.
(A) Left: close-up view of the three addressable effector sites within HBc-dimers (shown as cartoon model with transparent surface in gray) together with representative ligands shown as stick models: SLLGRM peptide (marine blue, PDB: 7PZN); geraniol, resolved here (cyan); heteroaryldihydropyrimidine (HAP [(2S)-1-[[(4R)-4-(2-chloranyl-4-fluoranyl-phenyl)-5-methoxycarbonyl-2-(1,3-thiazol-2-yl)-1,4-dihydropyrimidin-6-yl]methyl]-4,4-bis(fluoranyl)-pyrrolidine-2-carboxylic acid], green, PDB: 5WRE). HAP is a representative example of a canonical capsid assembly modulator (CAM) that targets a hydrophobic pocket mediating HBc-dimer multimerization, an essential step in capsid assembly. A blue arrow indicates how dimeric peptide-based ligands may induce aggregation. Right: the general architecture of an HBc-dimer is depicted as a cartoon with transparent surface model in gray and the three ligands that target distinct binding pockets are in color. The binding sites of two HBc dimers can be linked by dimeric ligands, here exemplified with the peptide ligand. (B) Hypothetical mode of action of HBc aggregation triggered by cross-linking the spikes of individual HBc dimers, HBc multimers or the whole capsid.
Figure 2 with 3 supplements
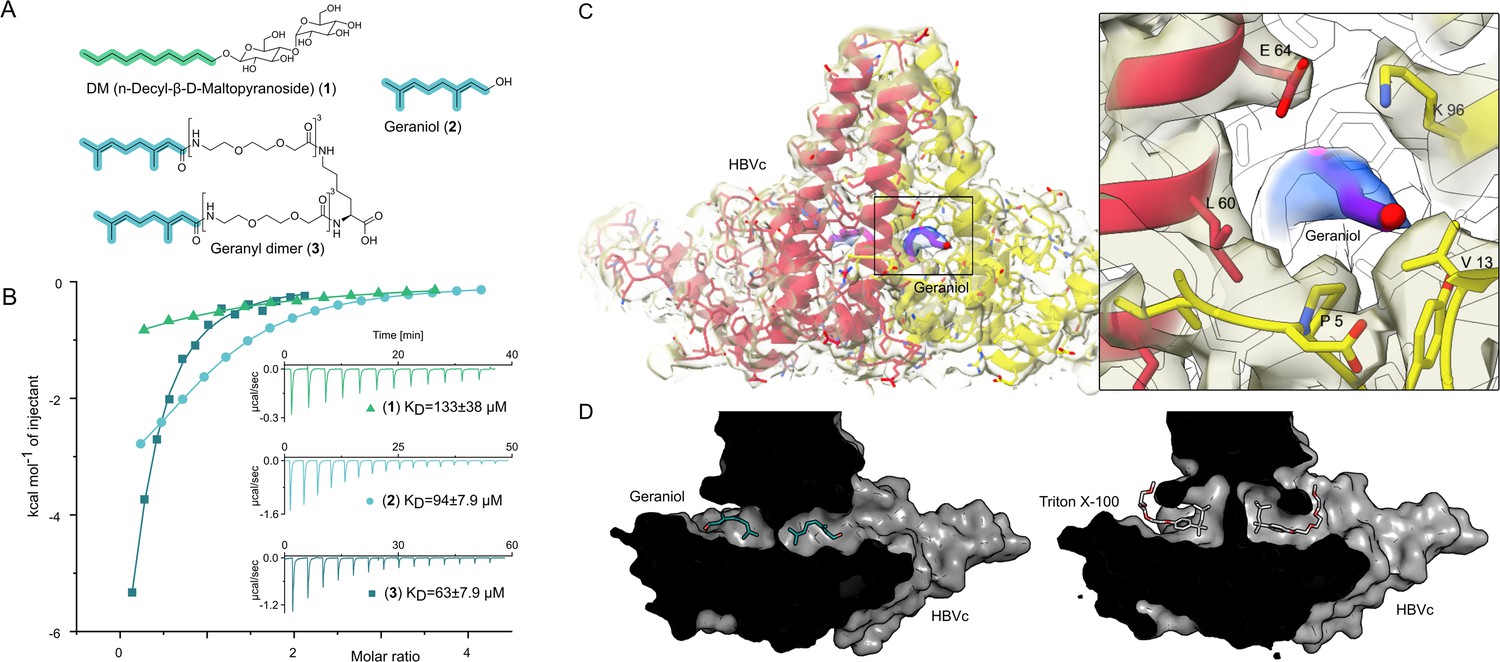
The central hydrophobic pocket of HBc-dimer is targeted by hydrophobic molecules containing isoprene units.
(A) Structures of different substances used for the isothermal calorimetric titration (ITC) and cryo-EM experiments. N-Decyl-beta-d-maltopyranoside (DM) (1) and geraniol (2). Using geranic acid, we synthesized geranyl dimer (3), a dimeric binder forked by a lysine and having a linker of six dioxaoctanoic units. (B) Representative ITC heat signatures of DM (1), geraniol (2), and the geranyl dimer (3) with HBc capsids. Heat release is detected upon titration of the ligands to the HBc solution, indicating stoichiometric binding interaction. 4 mM geraniol (2) was titrated into a solution of 210 µM HBc. A solution of 2 mM geranyl dimer (3) was titrated into a solution 200 µM HBc. 1.6–2 mM solutions of DM (1) were titrated into solutions with 90, 100, and 150 µM HBc, respectively. The control experiments where geraniol, geranyl dimer, and DM were titrated into buffer are shown in Figure 2—figure supplement 1. Integrated heat signatures in kcal⋅mol–1 plotted against the molar ratio of titrants to HBc. Binding isotherms (solid lines) were determined using a curve fitting procedure based on a one-site model. Among the ligands, the geranyl dimer has the strongest affinity to HBc, expectedly surpassing the monovalent geraniol by twofold. (C) Structure of the geraniol (magenta) within the HBc binding site (yellow and red) together with close-up view of the binding site with the EM-densities. Geraniol and residues (P5, L60, K96, E64, and V13) involved in hepatitis B virus’s (HBV) envelopment with natural phenotypes are depicted in stick representation. The EM density of geraniol is shown in the zoom-out in blue. (D) Side-by-side comparison of the overlapping HBc geraniol and TX100 (Makbul et al., 2021b) binding sites suggests conformational flexibility and the ability of the hydrophobic pocket to accommodate larger hydrophobic molecules.
Figure 2—figure supplement 1
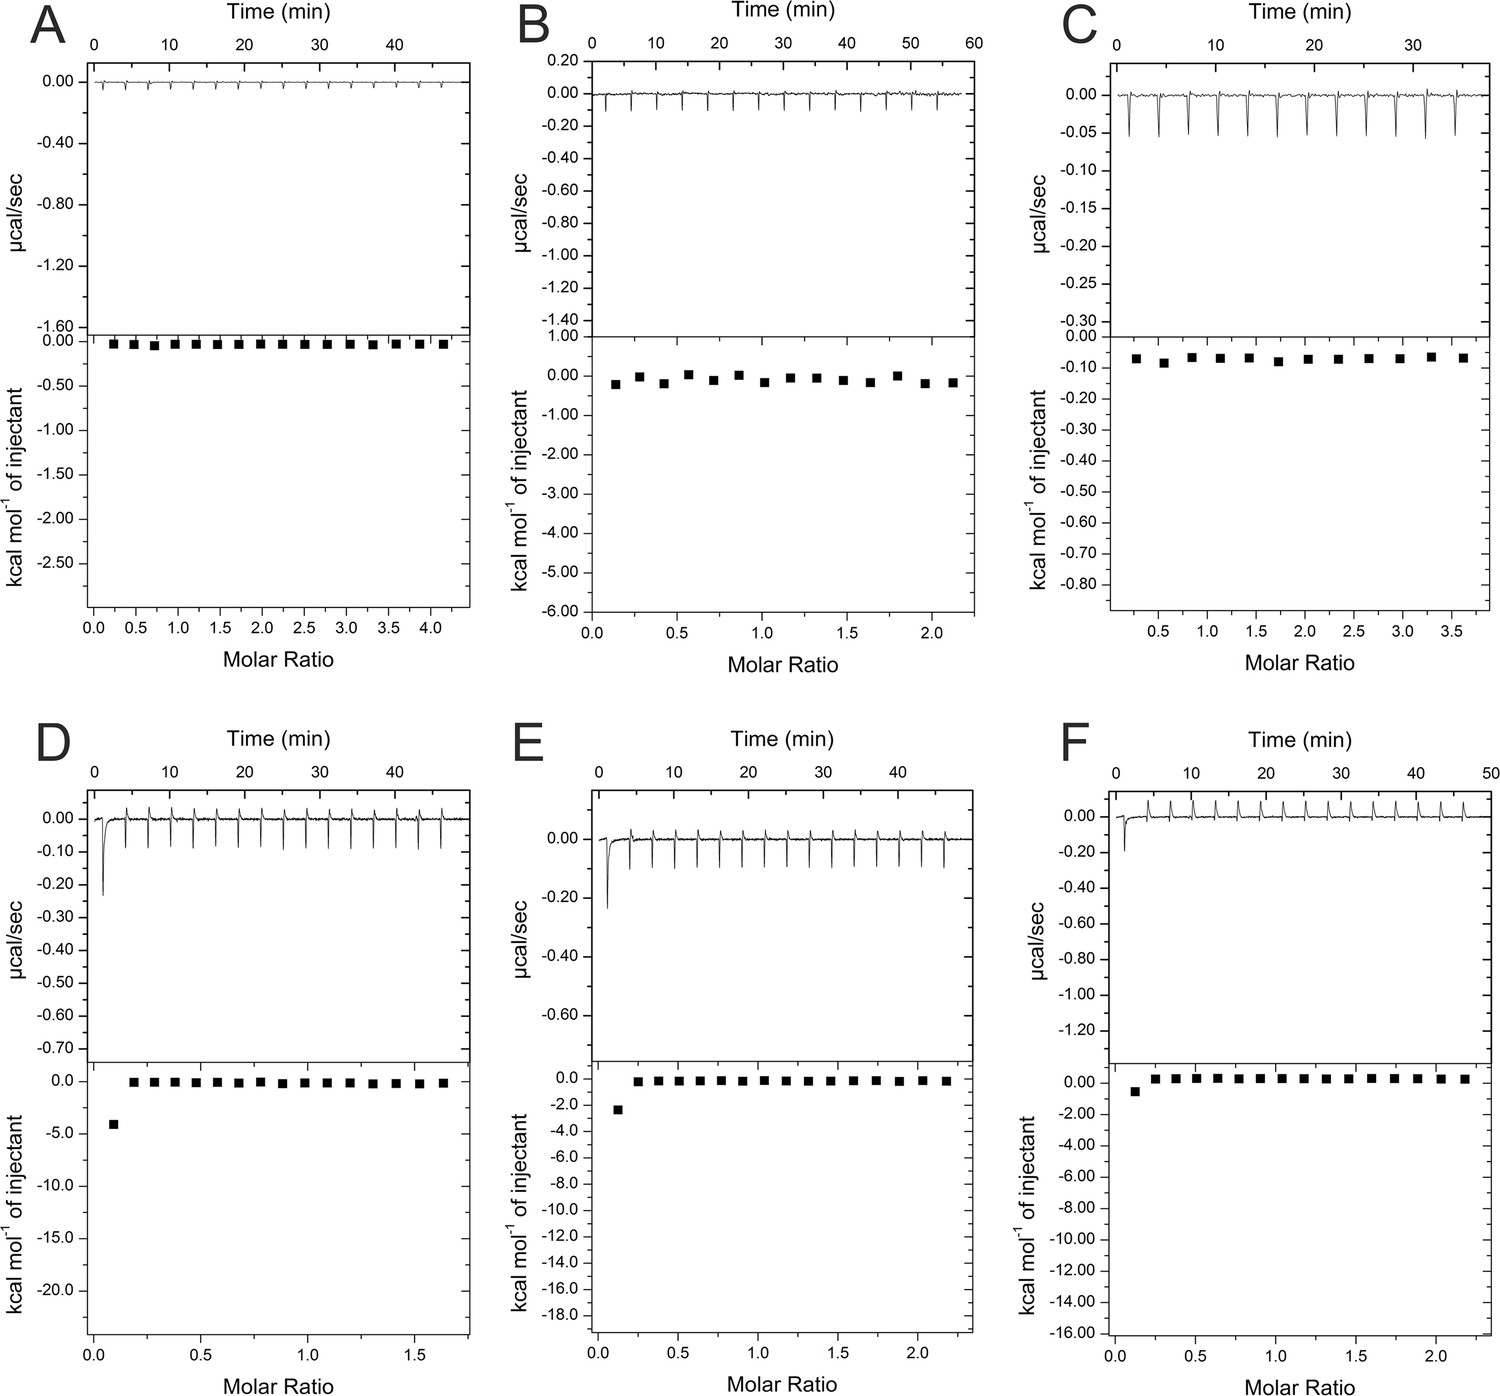
Control titrations of substances used for isothermal calorimetric titration (ITC) experiments.
All substances were dissolved in buffer A and titrated into buffer A as a control for experiments where equal concentrations of these substances were titrated into solutions of HBc (see Figures 2 and 3). (A) 4 mM geraniol, (B) 2 mM geranyl dimer, (C) 1.7 mM DM, (D) 0.3 mM P1d, (E) 0.5 mM P2d, and (F) 1.5 mM SLLGRM dimer. X and Y axes are scaled differently in the panels.
Figure 2—figure supplement 2
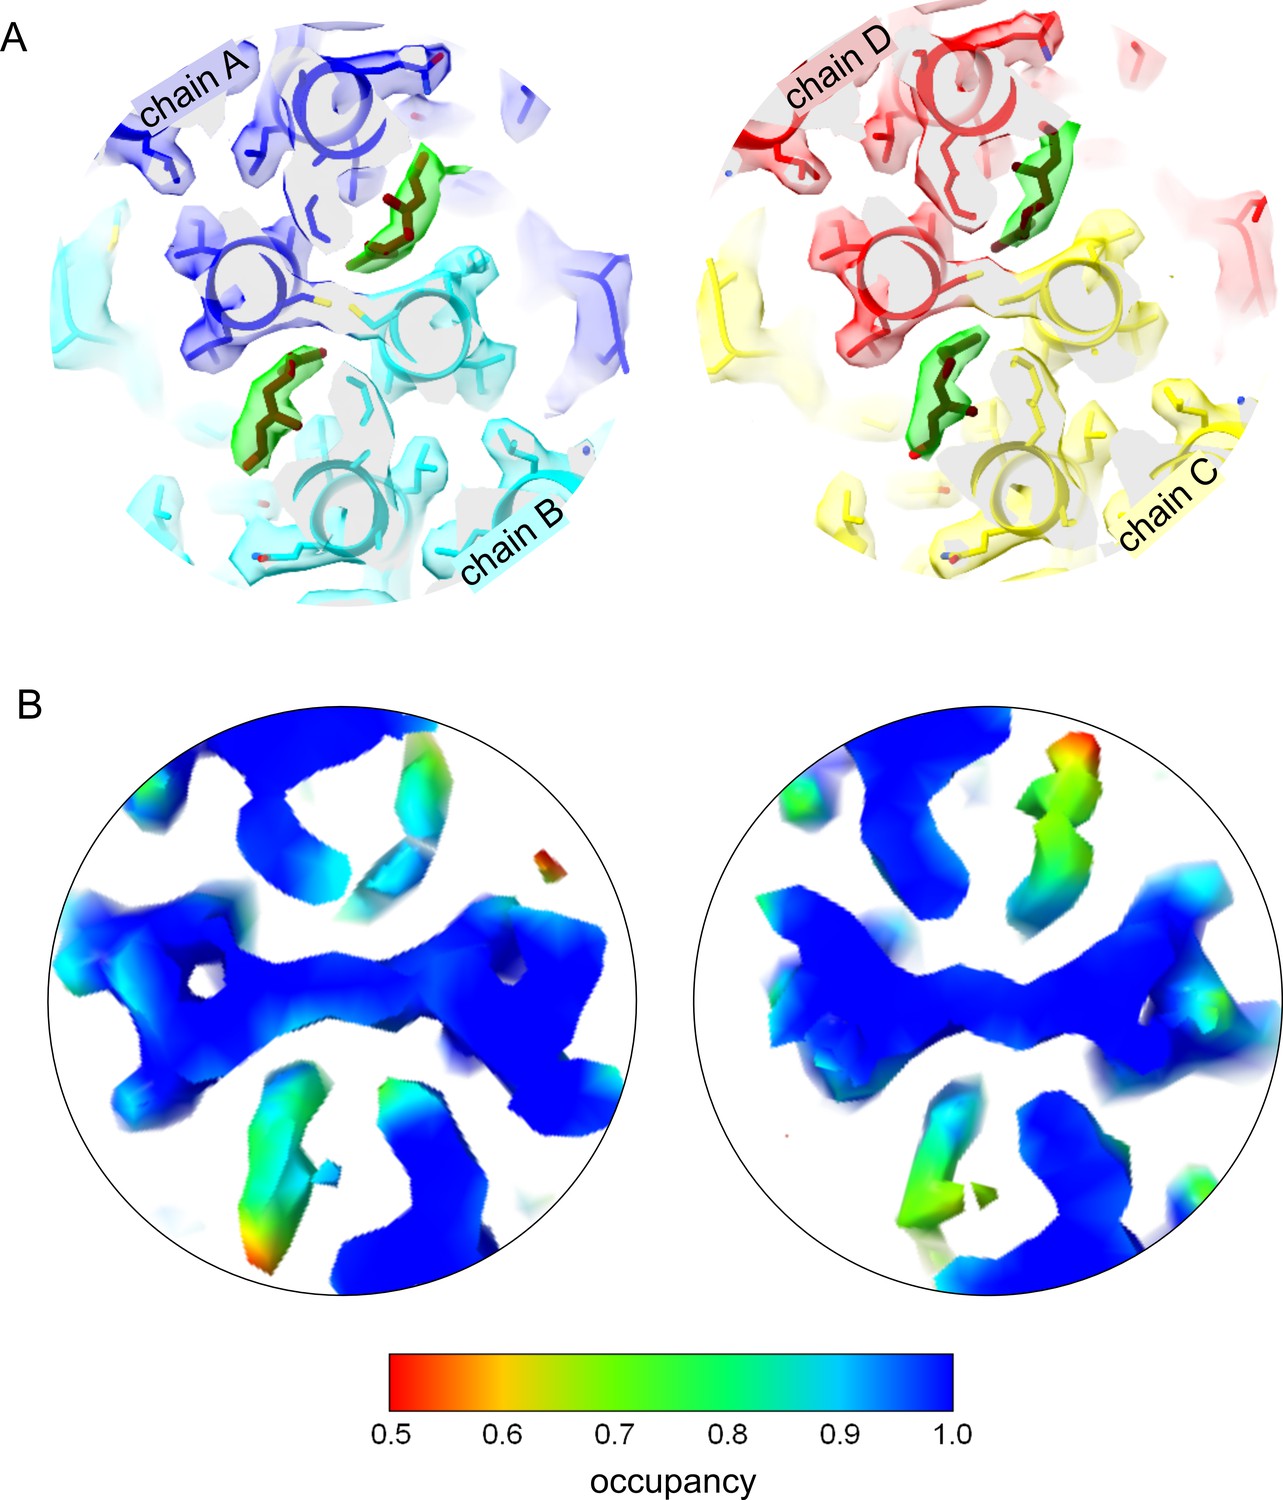
Geraniol binding mode to the hydrophobic pocket at the base of the capsid spike.
(A) Slice of the EM-map with fitted model: The slice shows the center of the two quasi-equivalent spikes with the fitted models of geraniol in brown. One geraniol molecule is bound to each of the quasi-equivalent sites. The surface of the EM-map is transparent and colored according to the chains. For clarity, the density attributed to geraniol is highlighted in green (color blob option of Chimera; Pettersen et al., 2004). Geraniol binds to the same site as Triton X100 (Makbul et al., 2021b) but does not change the rotamer conformation of F97. Binding of geraniol is not linked to conformational changes in the HBc-dimers. (B) Slices of the EM-map at the center of the spikes shown above. The surface of the map is colored according to the relative occupancy estimated with ‘OccuPy’ (Forsberg et al., 2023) based on the gray value distribution. The relative occupancies at the geraniol moiety are somewhat lower than the surrounding protein. Considering that flexibility and occupancy have a similar effect on the gray value distribution, the geraniol has an increasing flexibility towards the outside of the pocket and has at least 80–90% occupancy at the interior of the pockets. The color key for the relative occupancy is shown below.
Figure 2—figure supplement 3
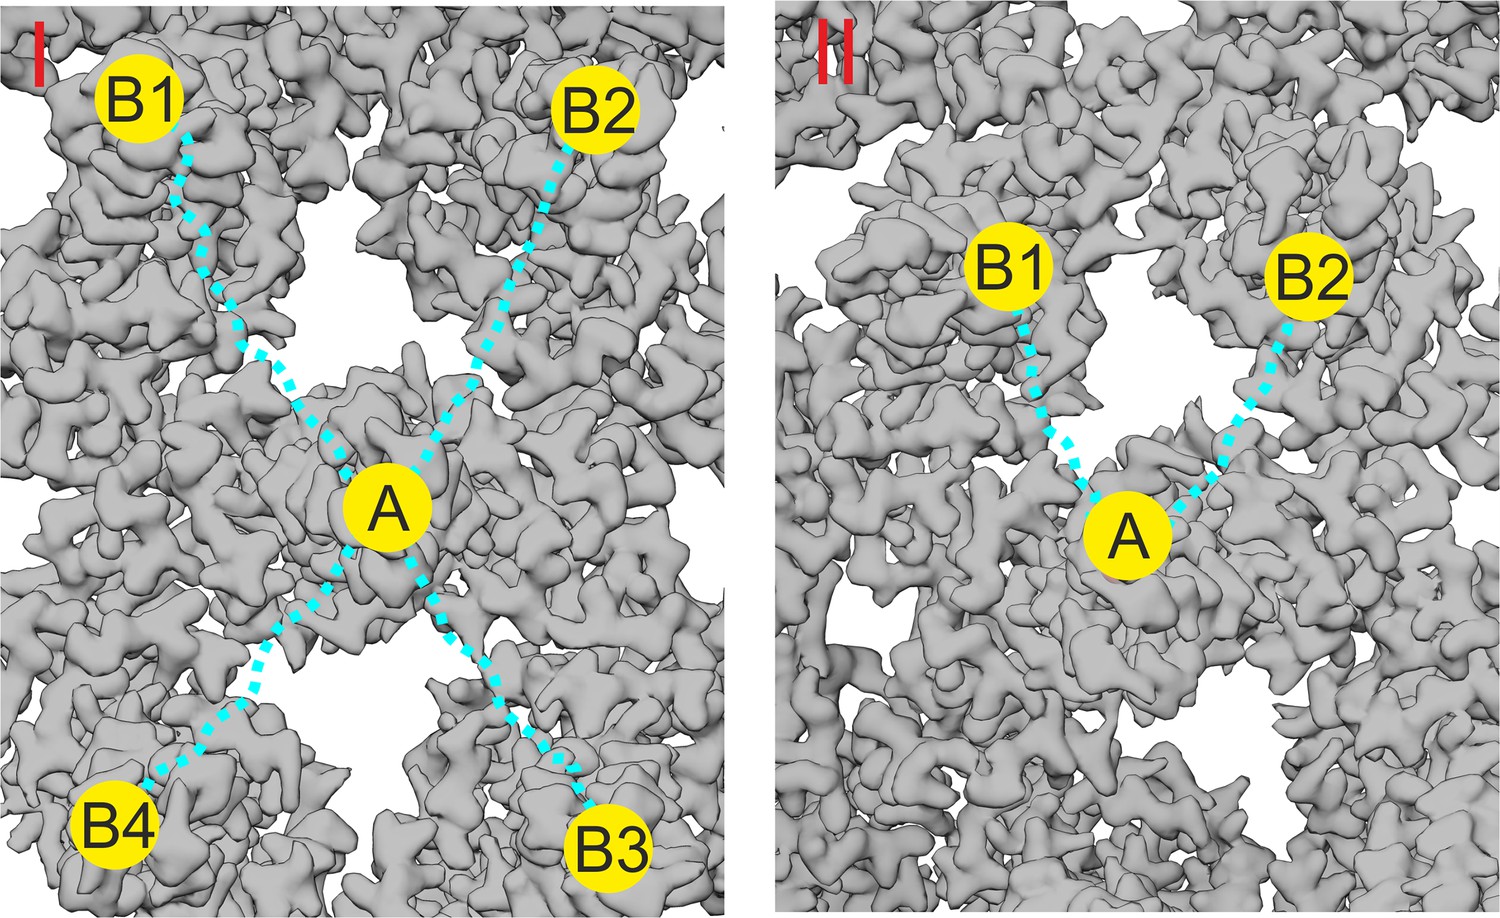
Rational design of multivalent binders.
This figure illustrates the rationale behind the design of the PEG linker length in the peptide- and geraniol-dimers. The binding site A, where the peptide or geranyl dimer binds, is located at the tip of a capsid spike or in a hydrophobic pocket (depicted as a yellow circle). The possible additional interactions of the dimers are shown as yellow circles labeled B1, B2, B3, and B4. The PEG linker, depicted as a dotted blue line, has been carefully chosen to allow simultaneous binding between two opposing sites. (I) The distance between the tip of a ‘central’ capsid spike A and the surrounding four spikes B1, B2, B3, and B4 is approximately 6 nm (60 Å). The PEG linker, with a length of about 8 nm (80 Å), was selected to provide flexibility and ensure the dimer can potentially bridge two adjacent spike tips, optimizing binding avidity by enabling interaction with any combination of the adjacent spikes. (II) For geranyl dimers, the hydrophobic pockets are separated by a distance of approximately 4 nm (40 Å), and the designed PEG linker (~3.8 nm or 38 Å) was chosen to match this distance, allowing for optimal interaction with two pockets in close proximity.
Figure 3 with 3 supplements
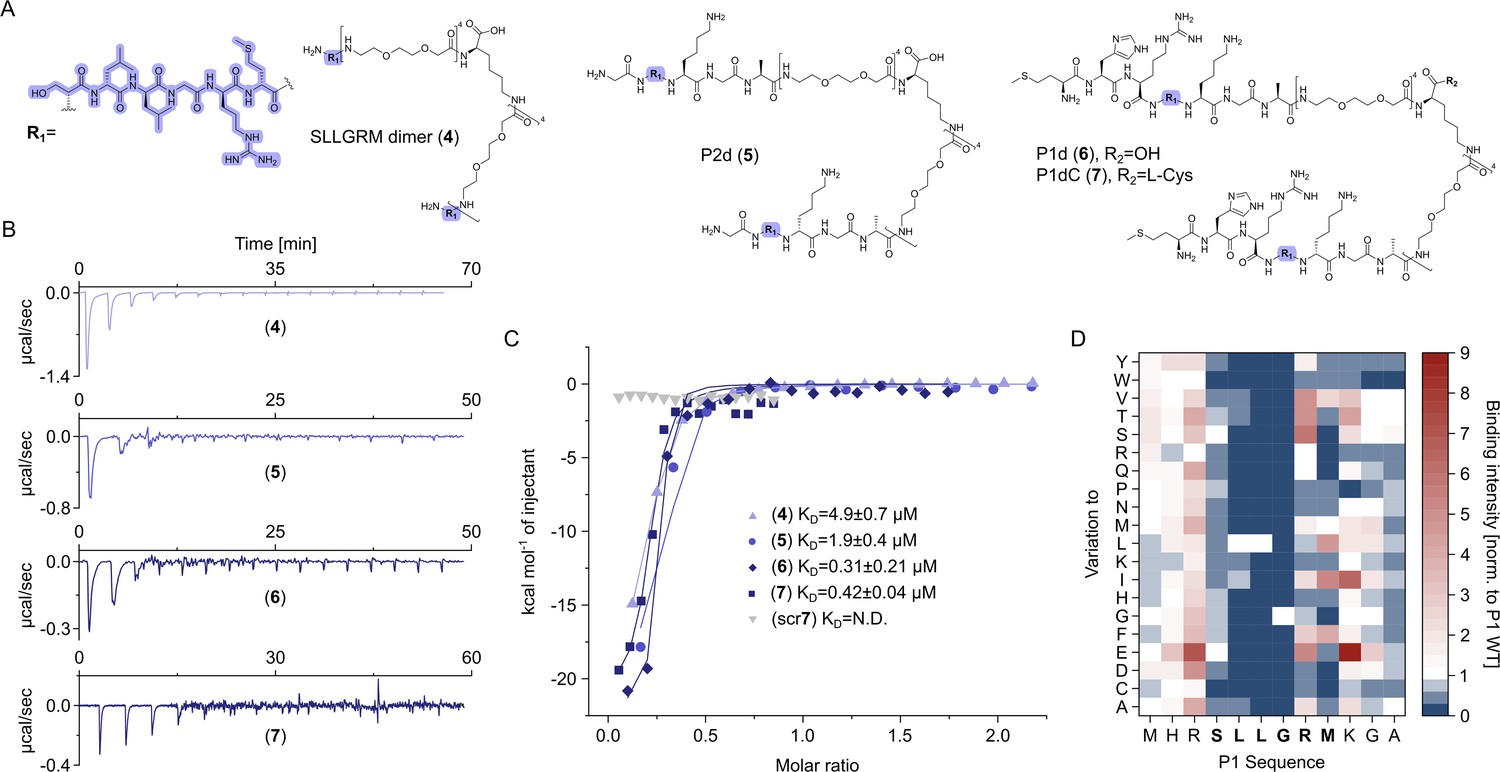
Dimeric peptide spike binders display strong low micromolar and sub-micromolar affinity.
(A) Chemical structures of the dimeric peptides, all contain the core binding sequence -SLLGRM and share the same PEG linker and a lysine as the branching element of the dimer. (B) Exemplary isothermal calorimetric titration (ITC) thermograms showing the titration heat signature of HBc with dimers. A solution of 1500 µM (4) was titrated into a solution 150 µM HBc. A solution of 125 µM (5) was titrated into a solution 25 µM HBc. A solution of 200 µM (6) was titrated into a solution 25 µM HBc. A solution of 100 µM (7) was titrated into a solution 25 µM HBc. (C) The peptide dimers display low micromolar to sub-micromolar affinity to HBc, the affinity increases with the elongation of the binding sequence. (D) Sequence requirements of the HBc Spike binding site. Full positional scan of the P1 peptide sequence in microarray format, in which each residue was varied to each other proteogenic amino acid. Note that a drop in binding intensity upon variation of the core motif SLLGRM (highlighted in bold) substantiates its critical involvement in HBc binding. Refer to Supplementary file 3 for the corresponding absolute grayscale values. Affinity gains observed for exchanging positively charged for negatively charged amino acids may be assay-specific false-positives as highlighted previously (Makbul et al., 2021a).
Figure 3—figure supplement 1
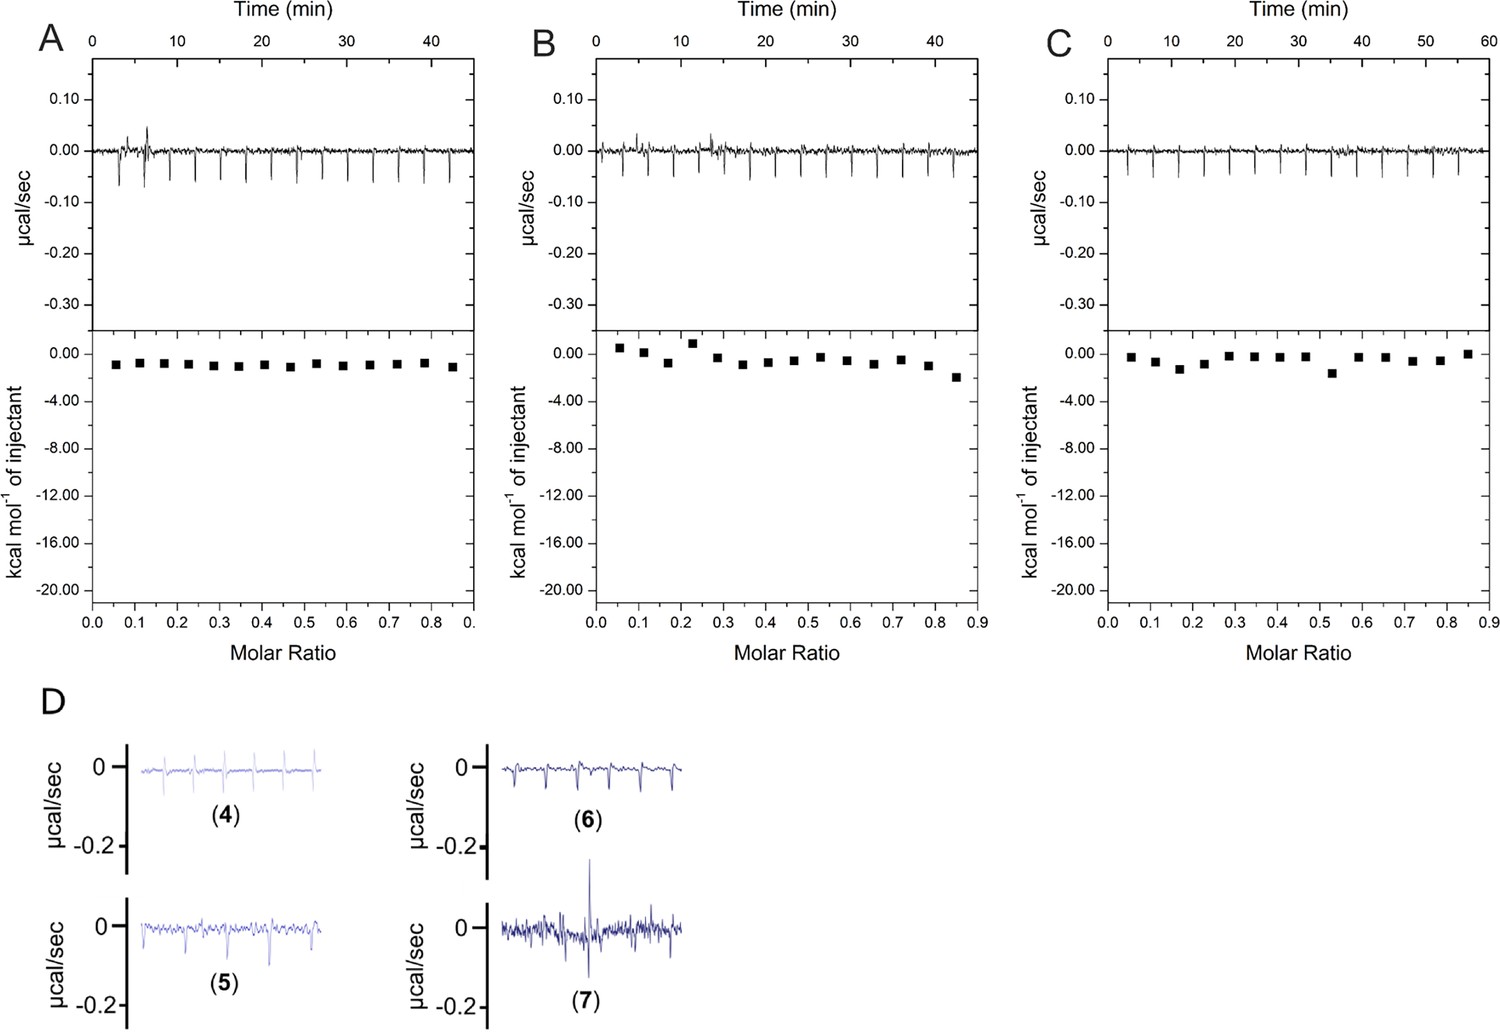
scrP1dC does not interact with HBc.
(A) 0.1 mM solution of the scrP1dC-dimer (scrambled version of the P1dC-dimer) was titrated into a solution of 0.025 mM HBc. (B, C) 0.1 mM solutions of scrP1dC-dimer and P1dC-dimer were titrated into buffer A as additional controls. In all cases no heat change was examined, validating the lack of HBc–scrambled peptide interaction and excluding residual binding interactions from the handle or linker. (D) Heat fluctuations from Figure 3B on identical y-axis scaling.
Figure 3—figure supplement 2
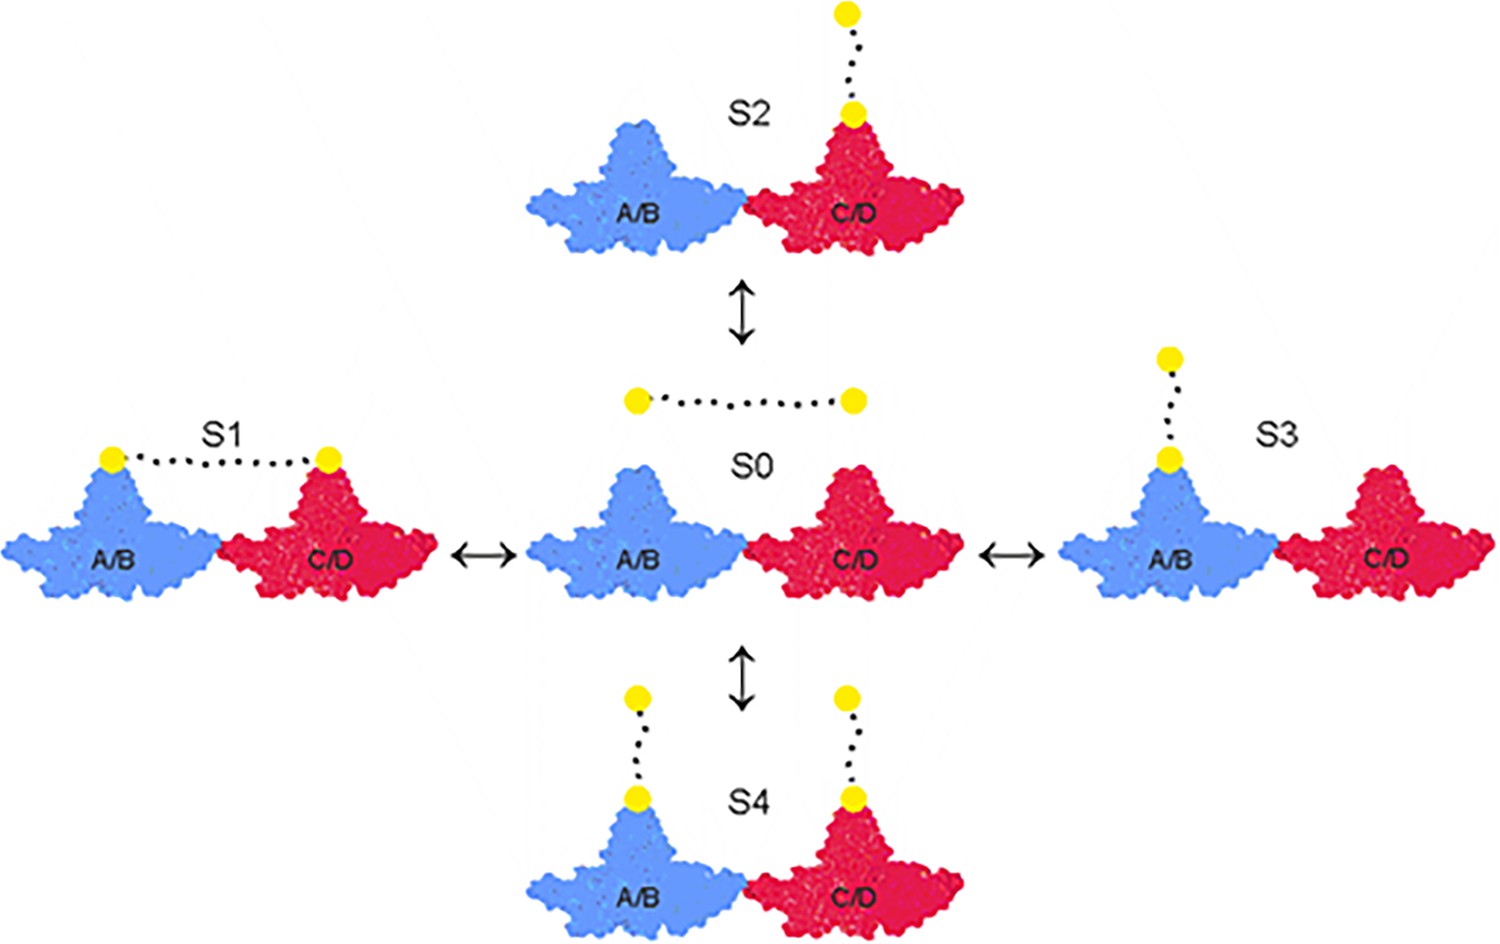
Overview of equilibria between the asymmetric unit of HBc and peptide-binders.
The asymmetric unit of HBc capsids (T = 4) consists of a tetramer which is composed of the A/B (closest to the fivefold symmetry axes in the icosahedron) (in blue) and the C/D-dimer (closest to the threefold symmetry axes) (in red). The peptide moiety of the dimers is depicted as yellow filled circles connected by a flexible PEG linker symbolized as a dotted line. Peptide dimers interact with the asymmetric unit in four different states (S1, S2, S3, and S4). The concentration of every state is dictated by the energetics of the respective state and the concentration of the peptide-dimer. At low concentrations, S1 and the possible degenerative permutations could be expected to be favored and at high concentrations S4. For the sake of simplicity, only a single (abstract) asymmetric unit is depicted here, which represents capsid with 60 asymmetric units.
Figure 3—figure supplement 3
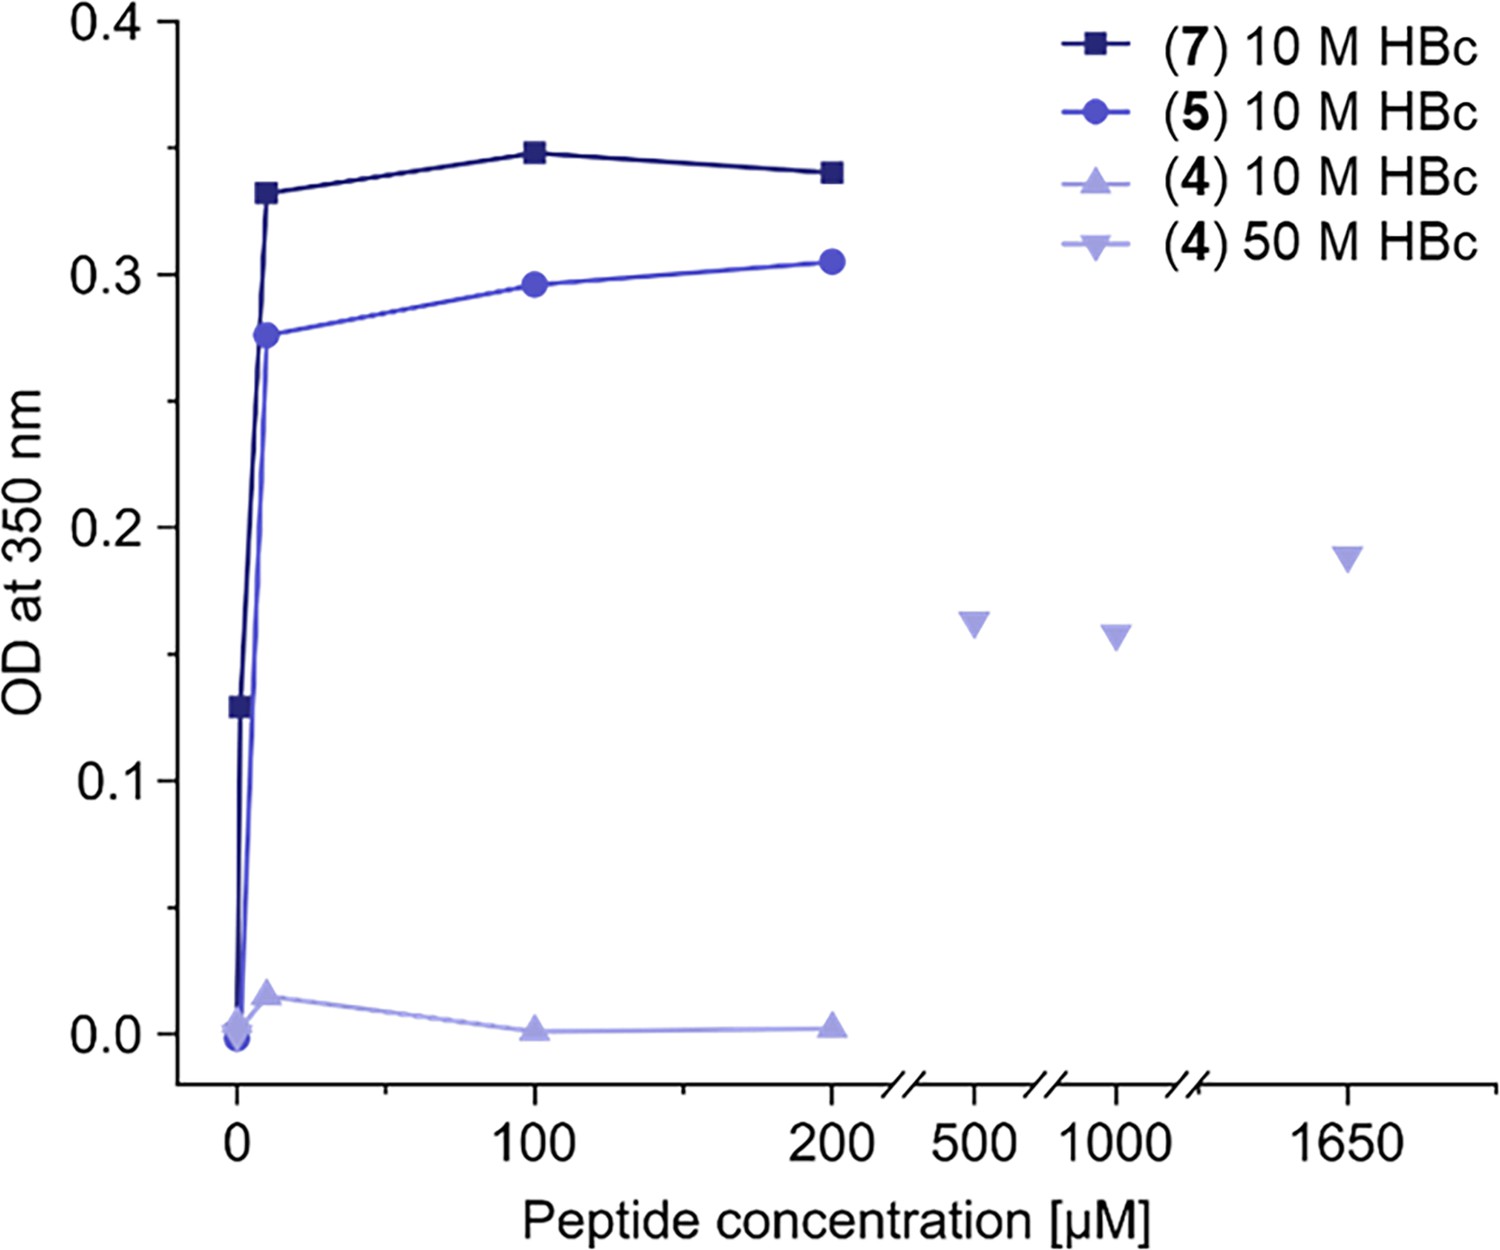
High turbidity is observed upon addition of HBc binding dimers to HBc solution.
Assessment of turbidity of capsid solutions induced by peptide dimers. The optical densities (OD) of HBc solutions (10 or 50 µM) with and increasing peptide-dimer concentrations were measured at a wavelength of 350 nm and plotted against peptide-dimer concentrations. All peptides showed increased turbidity with increasing concentrations, with P1 (7) and P2 (5) dimers inducing turbidity at low micromolar concentrations, while the SLLGRM dimer (4) induced turbidity at high micromolar concentrations.
Figure 4 with 1 supplement
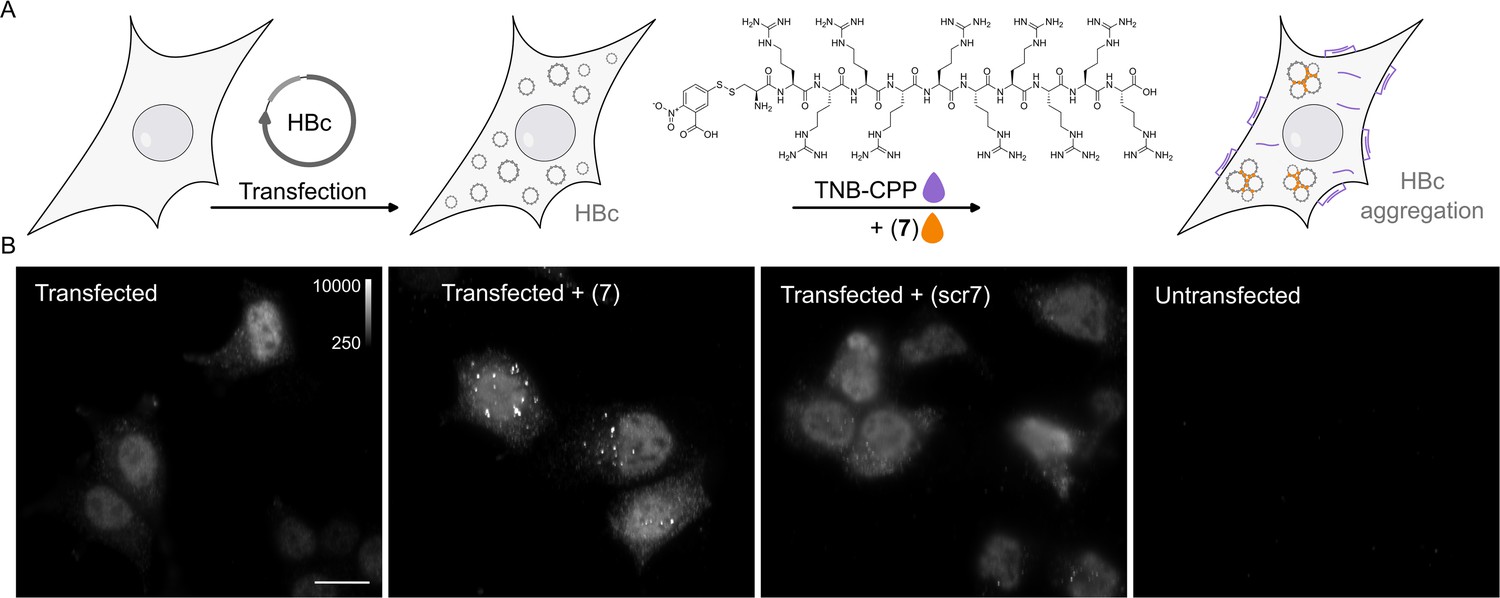
P1dC aggregates HBc in living HEK293 cells.
(A) A polyarginine cell-penetrating peptide containing a cysteine with a TNB-activated thiol (gray highlight (8)). (B) The live cell experiment flow. First, mammalian cells are transfected with HBc coding plasmid. Then, after the cells express the protein, a mix of (8) and (7) is applied. The excess CPP facilitates membrane permeation, allowing (7) to enter the cell after a brief incubation. Once inside, (7) is separated from the CPP and can interact with the capsids. (C) After 1 hour incubation with (7) or scr(7), the cells were immediately washed, fixed, and labeled with anti HBc mAb16988 and a secondary DyLight650 conjugated antibody. The cells were visualized on wide-field fluorescent microscope with identical conditions and are presented with the same grayscale range. Transfected and untreated cells display diffuse HBc distribution, with clear fluorescence at the nucleus. Transfected cells treated with (7) display bright aggregates, whereas transfected cells treated with scr(7) have similar diffuse labeling as the untreated cells. Non-transfected cells are non-fluorescent. Scale bar 20 µm.
Figure 4—figure supplement 1
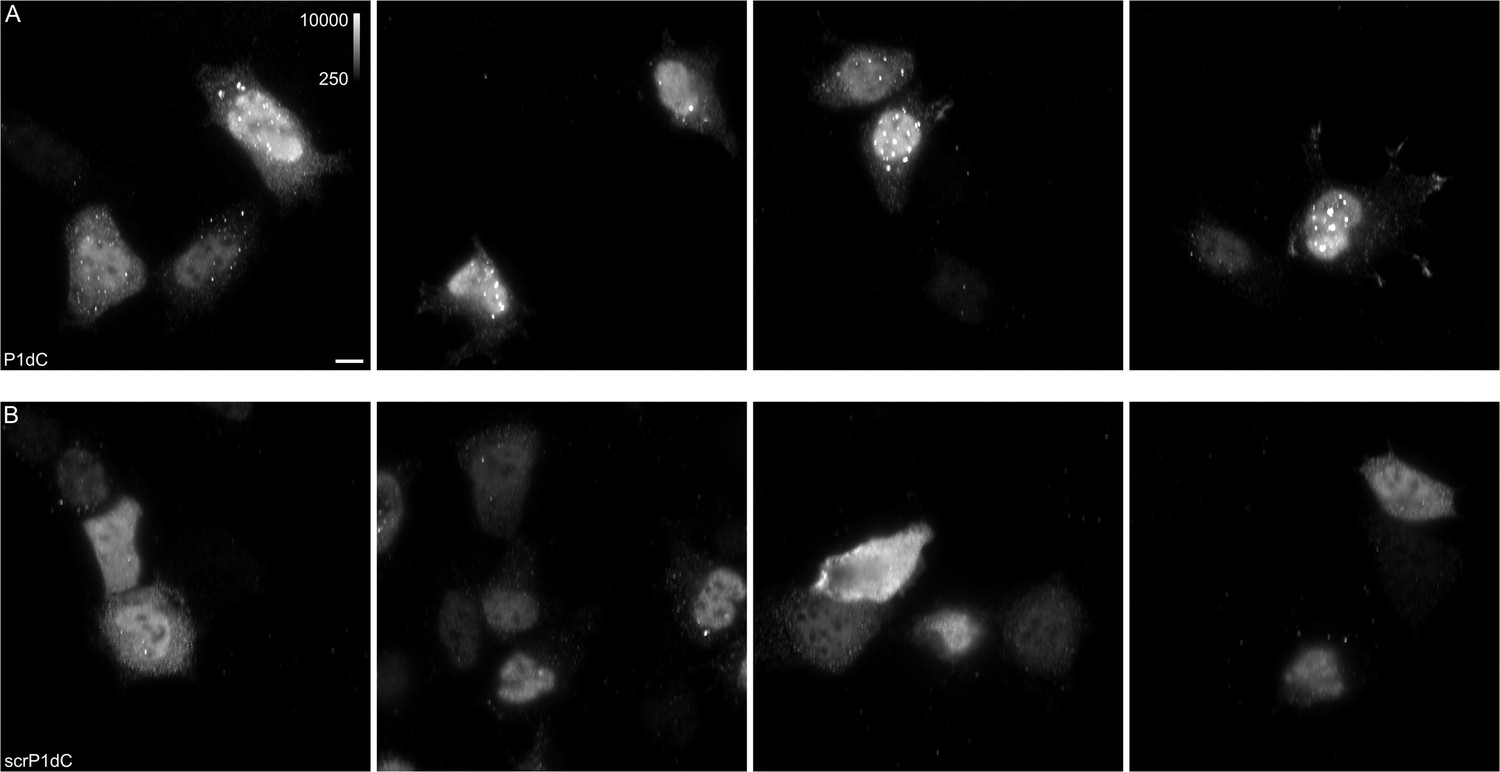
HBc aggregates appear after treatment with P1dC.
Live HEK293 cells expressing HBc were treated with either P1dC or with the scrambled (scr) P1dC analogue together with the cell penetrating peptide. After treatment, the live cells were fixed and labeled with HBc antibody and a secondary DyLight650 conjugated antibody (1:500). The imaging showed HBc aggregates in P1dC treated cells (A), while scrP1dC-treated cells showed little to none aggregates (B). All images shown with identical grayscale range. Scale bar 10 μm.
Figure 5 with 3 supplements
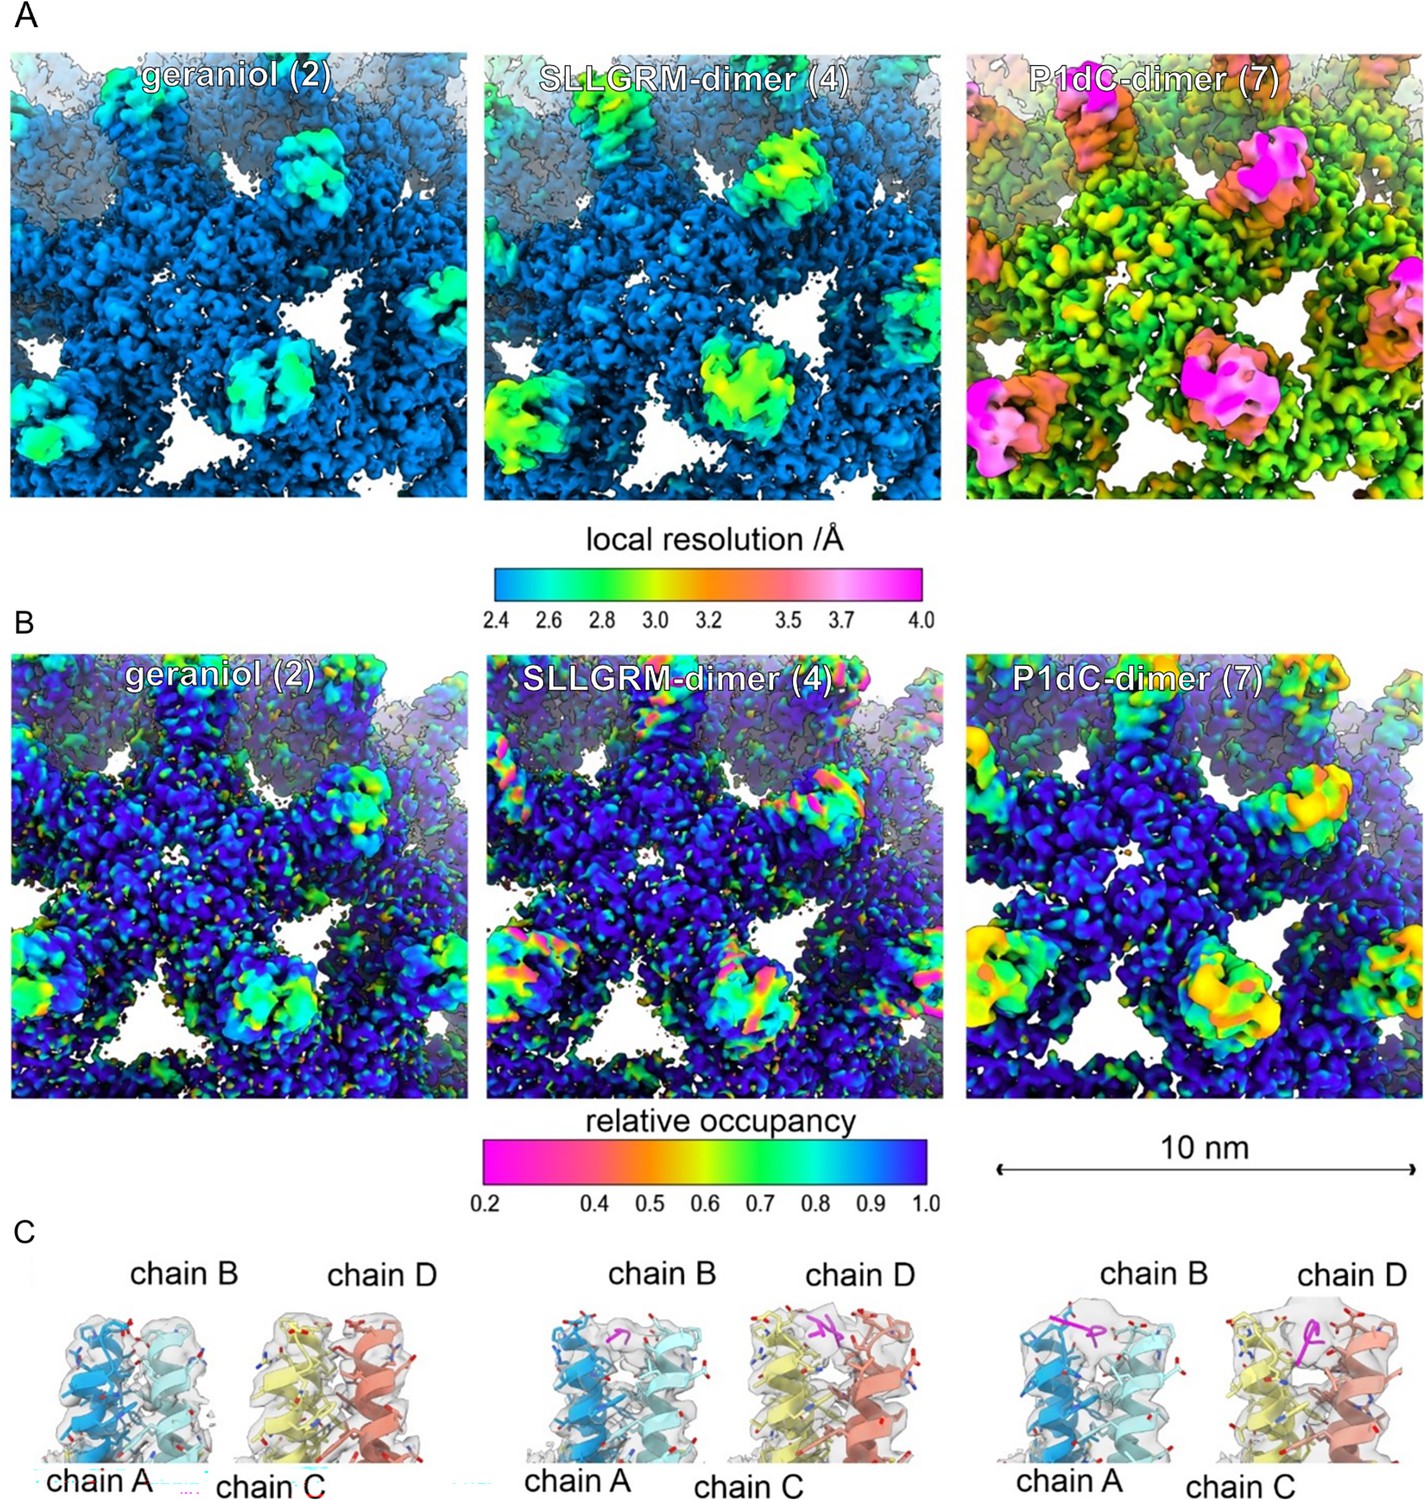
Peptide dimers binding the spike tips.
Close-up of the surface representation of the EM-maps of capsid-like particle (CLP) incubated with geraniol (2), with SLLGRM-dimer (4) and P1dC (7). (A) The surface of the map is colored according to the local resolution. The map of (7) has a lower overall resolution, which is consistent with the lower number of particles in the reconstruction (Supplementary file 4). In all three maps the tips of the spikes are less well resolved than the capsid shell regardless of whether peptides are bound or not. This is in line with the general flexibility of the protruding spikes in HBc-CLPs (Böttcher et al., 1998; Hadden et al., 2018). (B) The surface of the maps is colored according to the relative occupancy based on the gray value distribution as determined with OccuPy (Forsberg et al., 2023). Low relative occupancy cannot be distinguished from local flexibility. As the tips of the spike are flexible, they show generally lower occupancy than the protein shell. Comparing the relative occupancies in samples incubated with (4) and (7) suggests a lower occupancy with (4) than with (7). (C) Fit between the model and the map (gray, translucent) at the tips of spikes. Binding of an (4) or of (7) splays the helices at the tips apart similar as previously reported for binding of a P2-monomer (Makbul et al., 2021a). (4) binds to both quasi equivalent sites in contrast to SLLGRM-monomers, which binds only to the CD-dimer and does not show such a prominent splaying (Makbul et al., 2021a). Geraniol binds at the center of the spikes and does not change the conformation at the tips of the spikes.
Figure 5—figure supplement 1
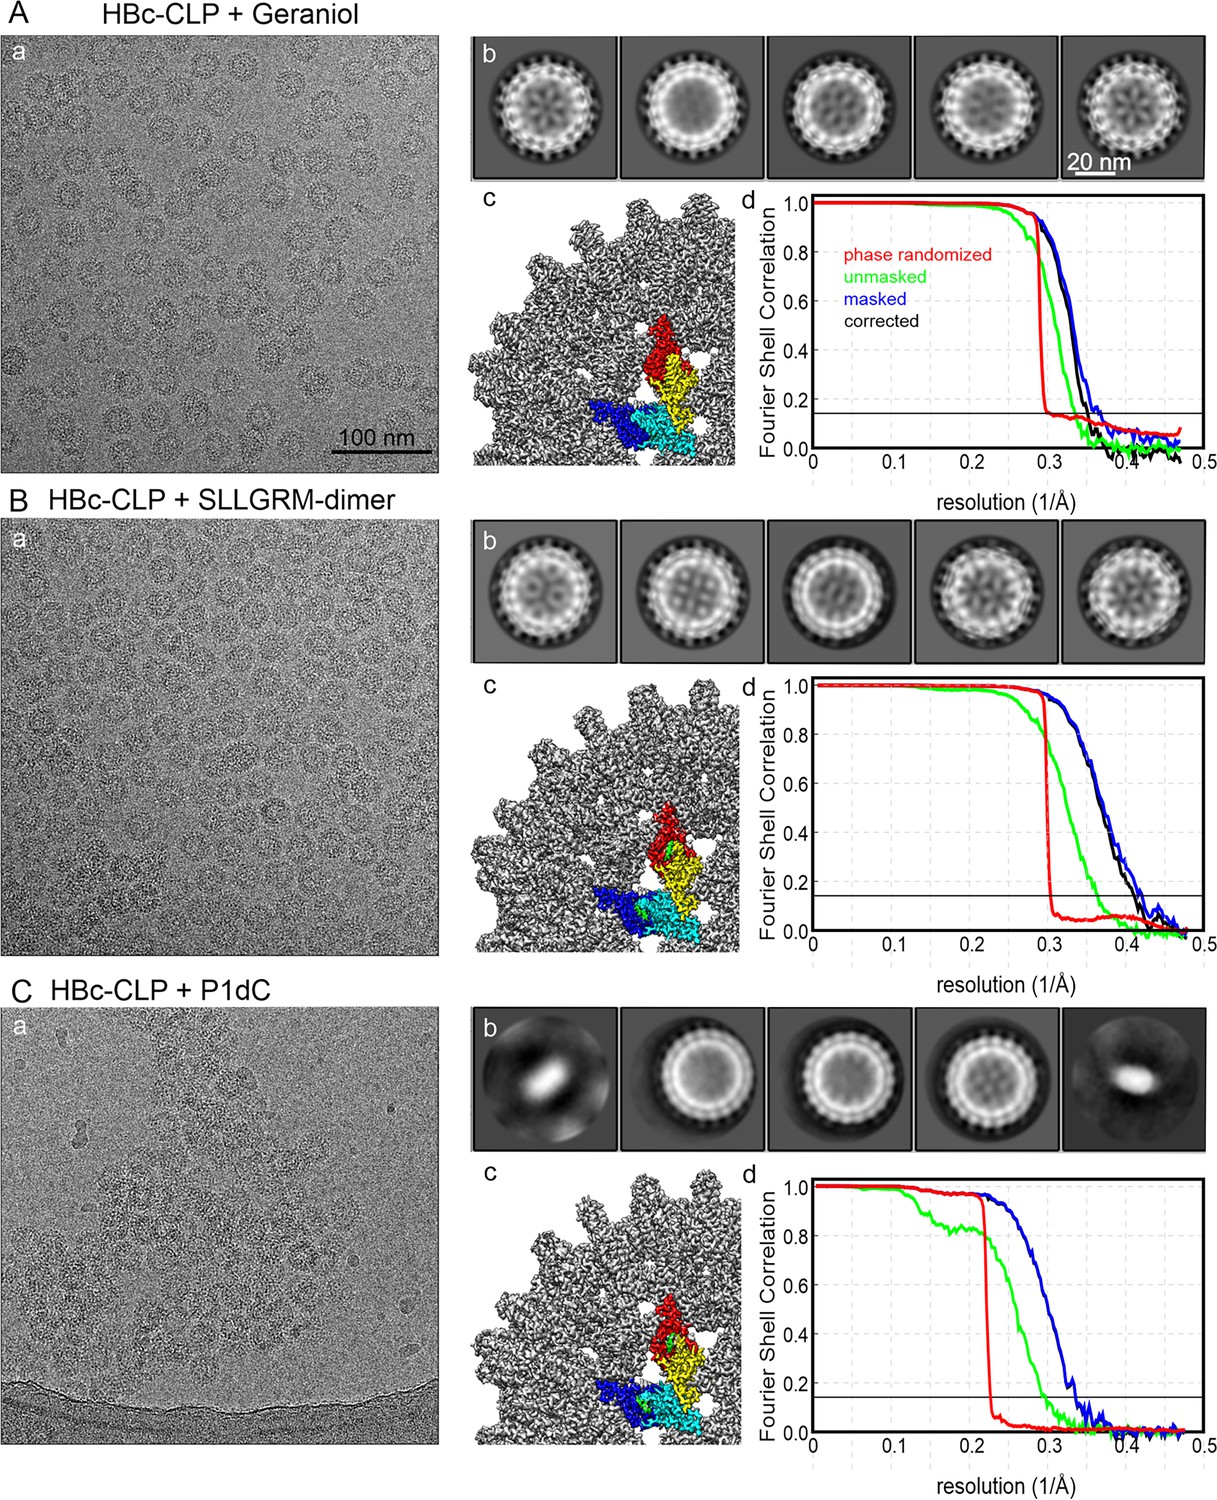
Electron microscopy and image processing of HBc-CLPs with binders.
(A) CLPs with bound geraniol, (B) HBc-CLPs with bound SLLGRM-dimer, and (C) HBC-CLPs with bound P1dC. (a) shows a representative micrograph. All micrographs are shown at the same scale; (b) shows the 2D-class averages of the five most populated classes after automated template picking. All class averages are shown at the same scale; (c) shows a close-up of the surface representation of the final map after post-processing with relion (filtered by Fourier shell correlation [FSC], B-factor sharpened). One unit cell is colored according to the density covered by the model (HBc chains A, B, C, D in blue, cyan, yellow, and red respectively) and binders (geraniol, SLLGM-dimer and P1dC in green); (d) FSC plot of the final map. FSC = 0.143 is marked by a thin, solid line. Green curve: FSC between unmasked half-maps; blue curve: FSC between masked half-maps; red curve: FSC between phase-randomized masked half-maps; black curve: FSC corrected for the contribution of the mask.
Figure 5—figure supplement 2
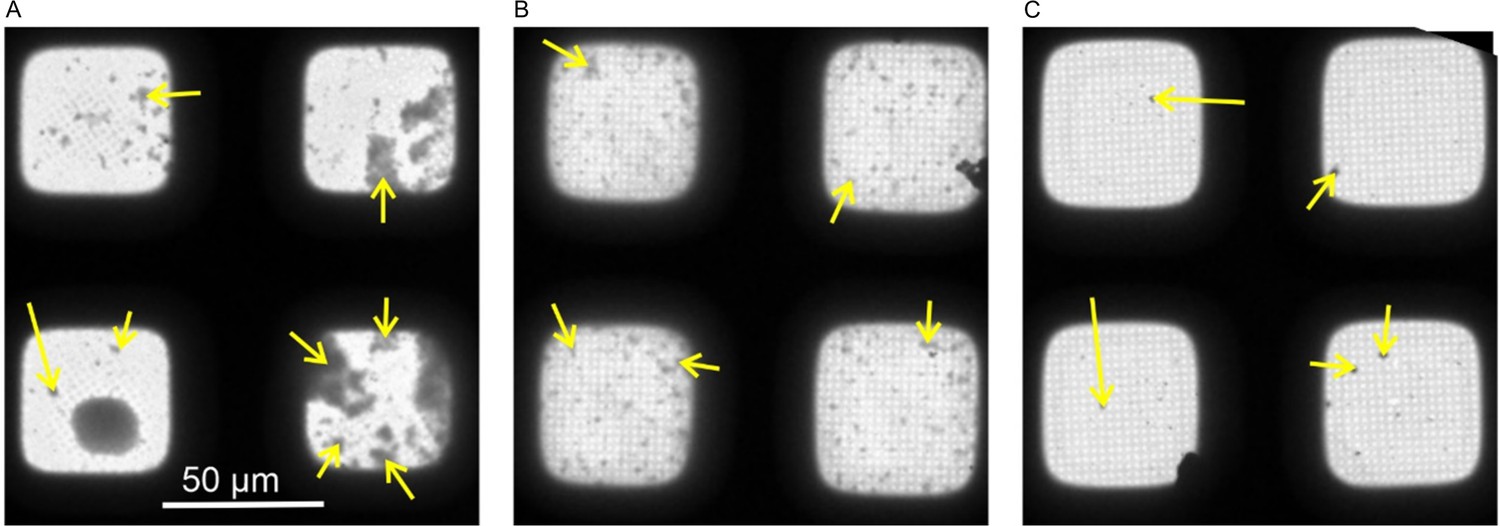
Cryo-EM confirms strong capsid aggregation with peptide dimers.
Low-magnification cryo-EM images of CLPs + P1 dC (7) (A), (B) CLPs + SLLGRM-dimer (4), and (C) CLPs + geraniol (2). The micrographs are part of the grid-atlas of the respective data acquisition. Each image shows four meshes of the respective grid atlas at a similar ice thickness. For representation, the images were aligned to show a similar orientation of the meshes. CLP aggregates are seen as dark speckles (yellow arrow). The size of the aggregates is largest in P1dC-treated samples, while aggregates are frequent and smaller in samples treated with SLLGRM-dimer. Geraniol treated samples have very few aggregates, which are generally smaller than 1 µm.
Figure 5—figure supplement 3
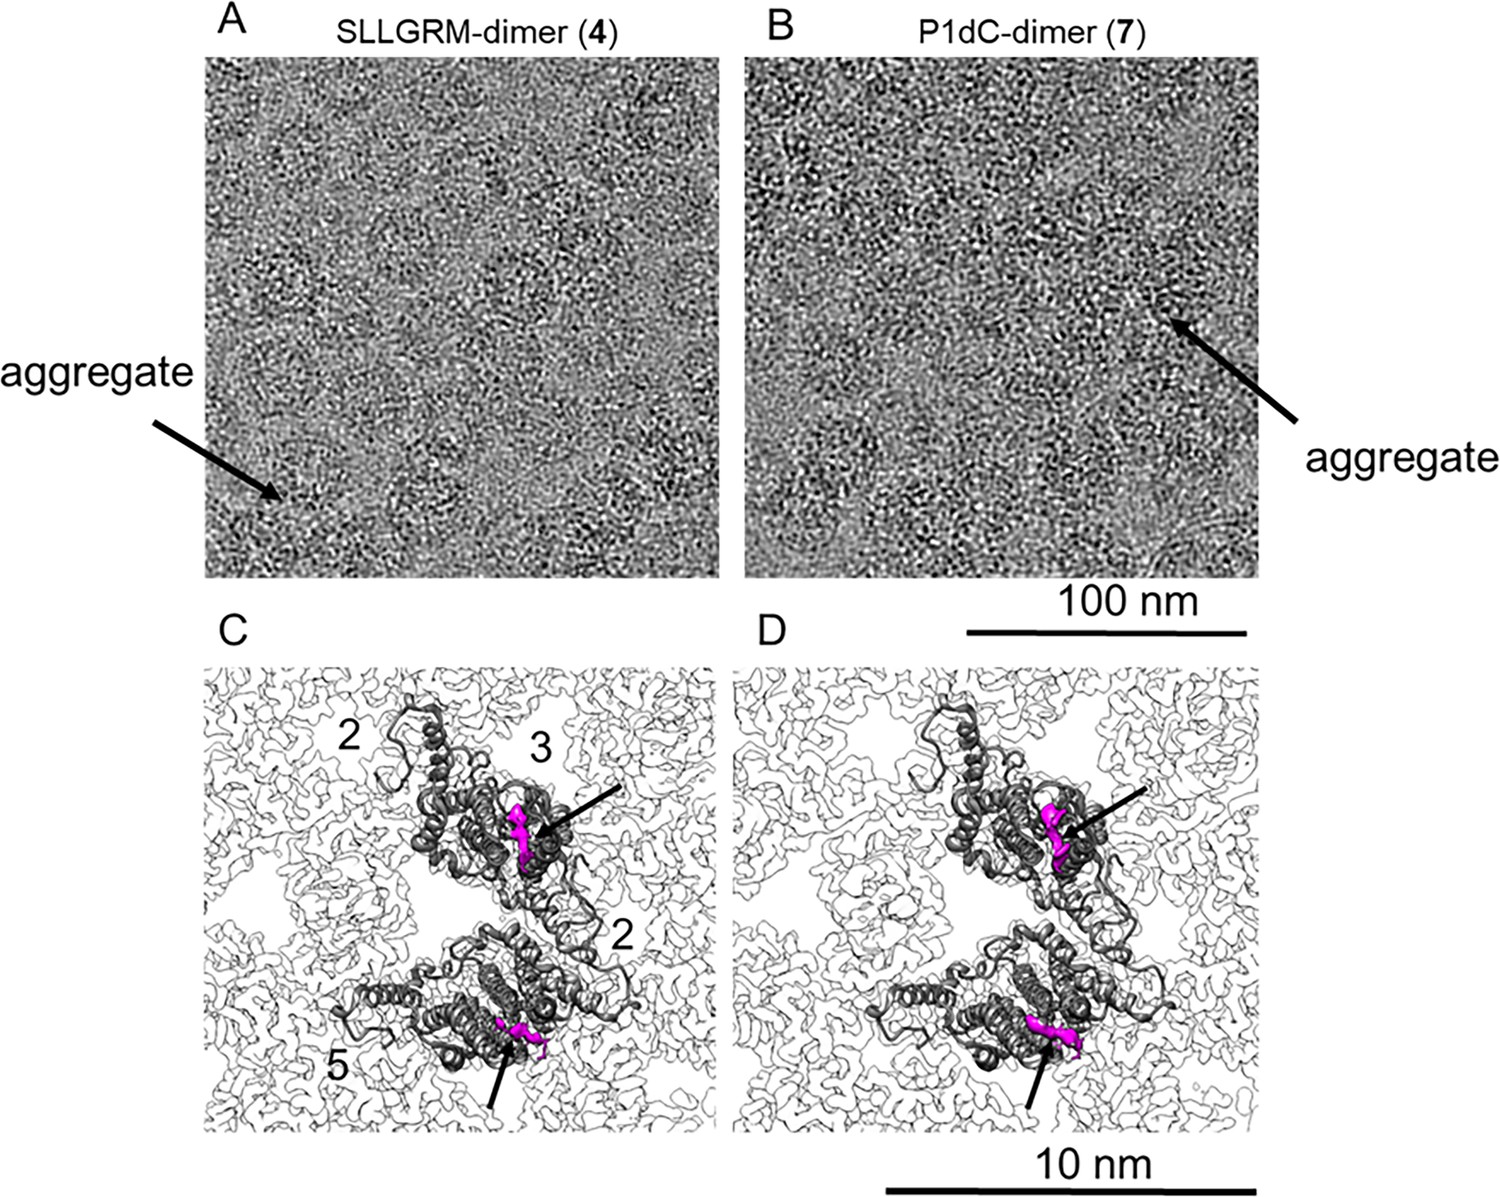
Nanoscale resolution of the dimer binding sites by cryo-EM.
HBc capsids with bound SLLGRM-dimer (4) or P1dC-dimer (7) imaged by electron cryo-microscopy. (A) and (B) show selected areas of micrographs of CLPs treated with (4) or with (7). One exemplary aggregate of multiple HBc capsids is indicated by an arrow in each micrograph. (C) and (D) show close-ups of the asymmetric unit of HBc capsids with bound SLLGRM dimers or with bound P1dC. Models of a single asymmetric unit consisting of two HBc dimers are fitted into the asymmetric unit. Both maps show a density at the tips of the spikes (arrow) that accounts for approximately six amino acids of the peptide-dimer. The flexible linker between the peptides was not resolved. The position of the symmetry axes of the icosahedral capsid is labeled with numbers in (C).
Appendix 1—figure 1
SLLGRL-PEGlinker-Dimer.
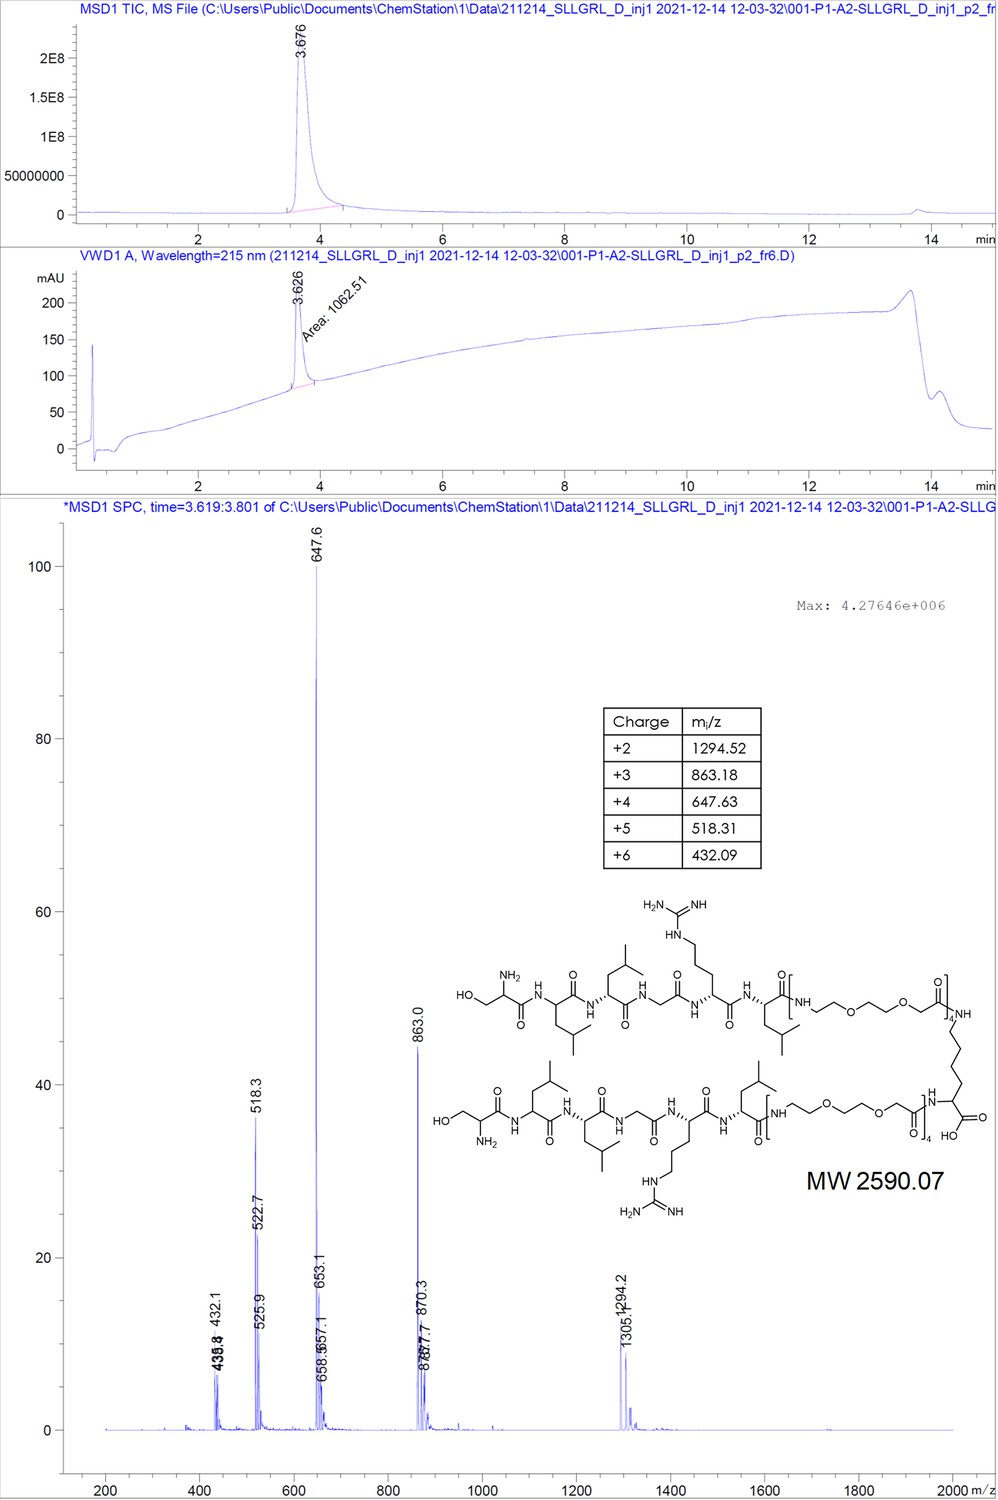
Appendix 1—figure 2
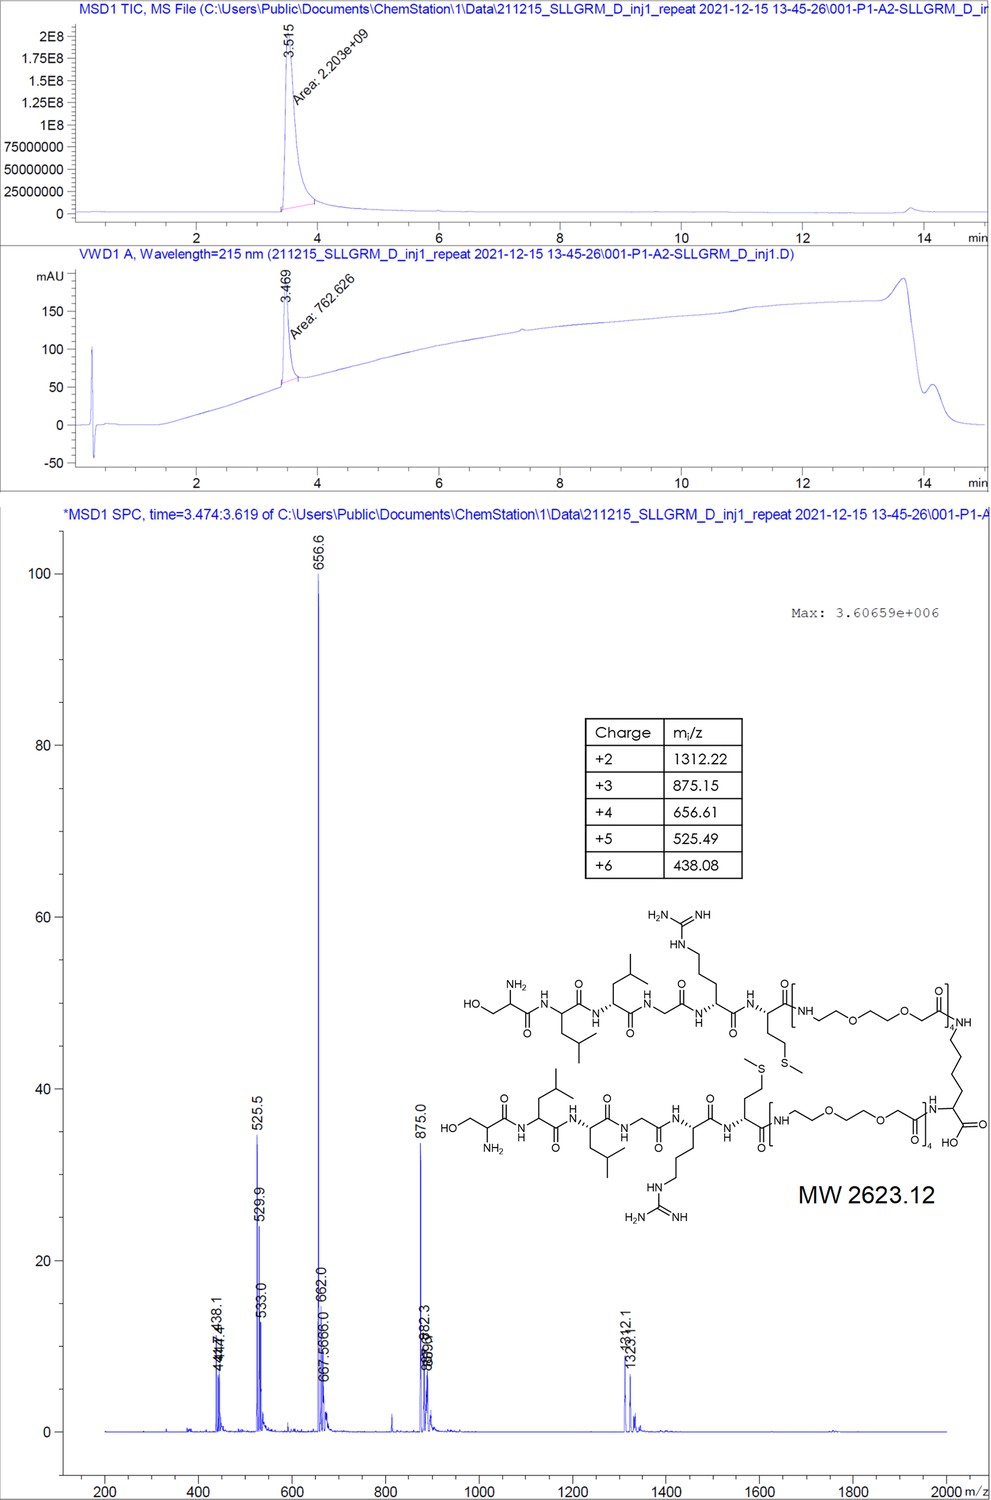
SLLGRM-PEGlinker-Dimer (SLLGRM dimer).
Appendix 1—figure 3
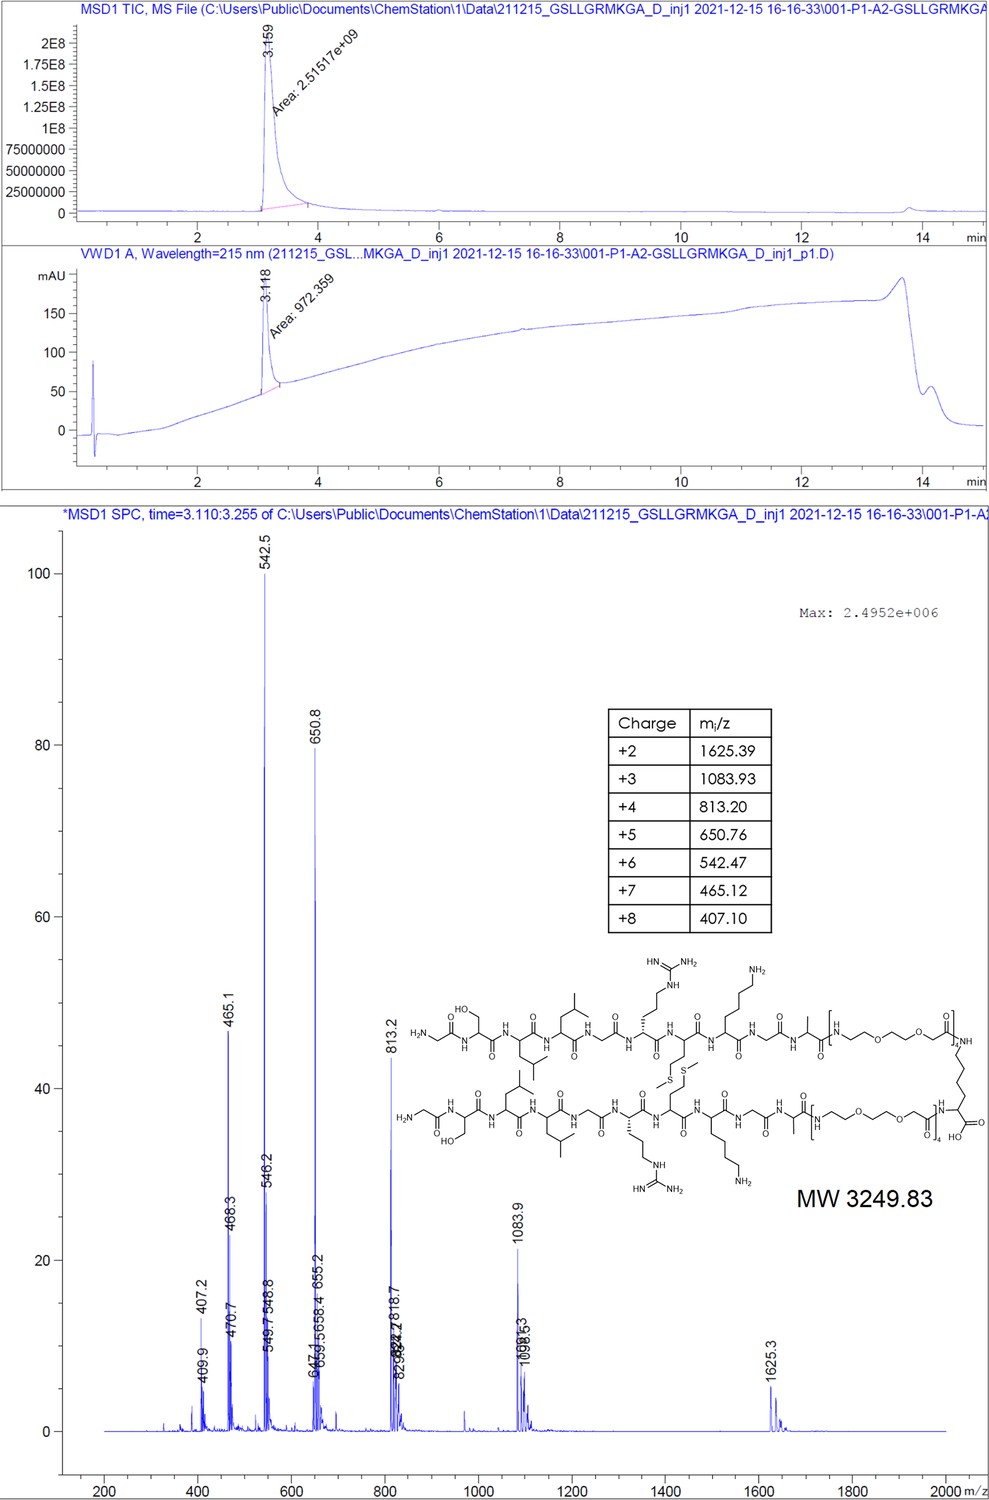
GSLLGRMKGA-PEGlinker-Dimer (P2 dimer).
Appendix 1—figure 4
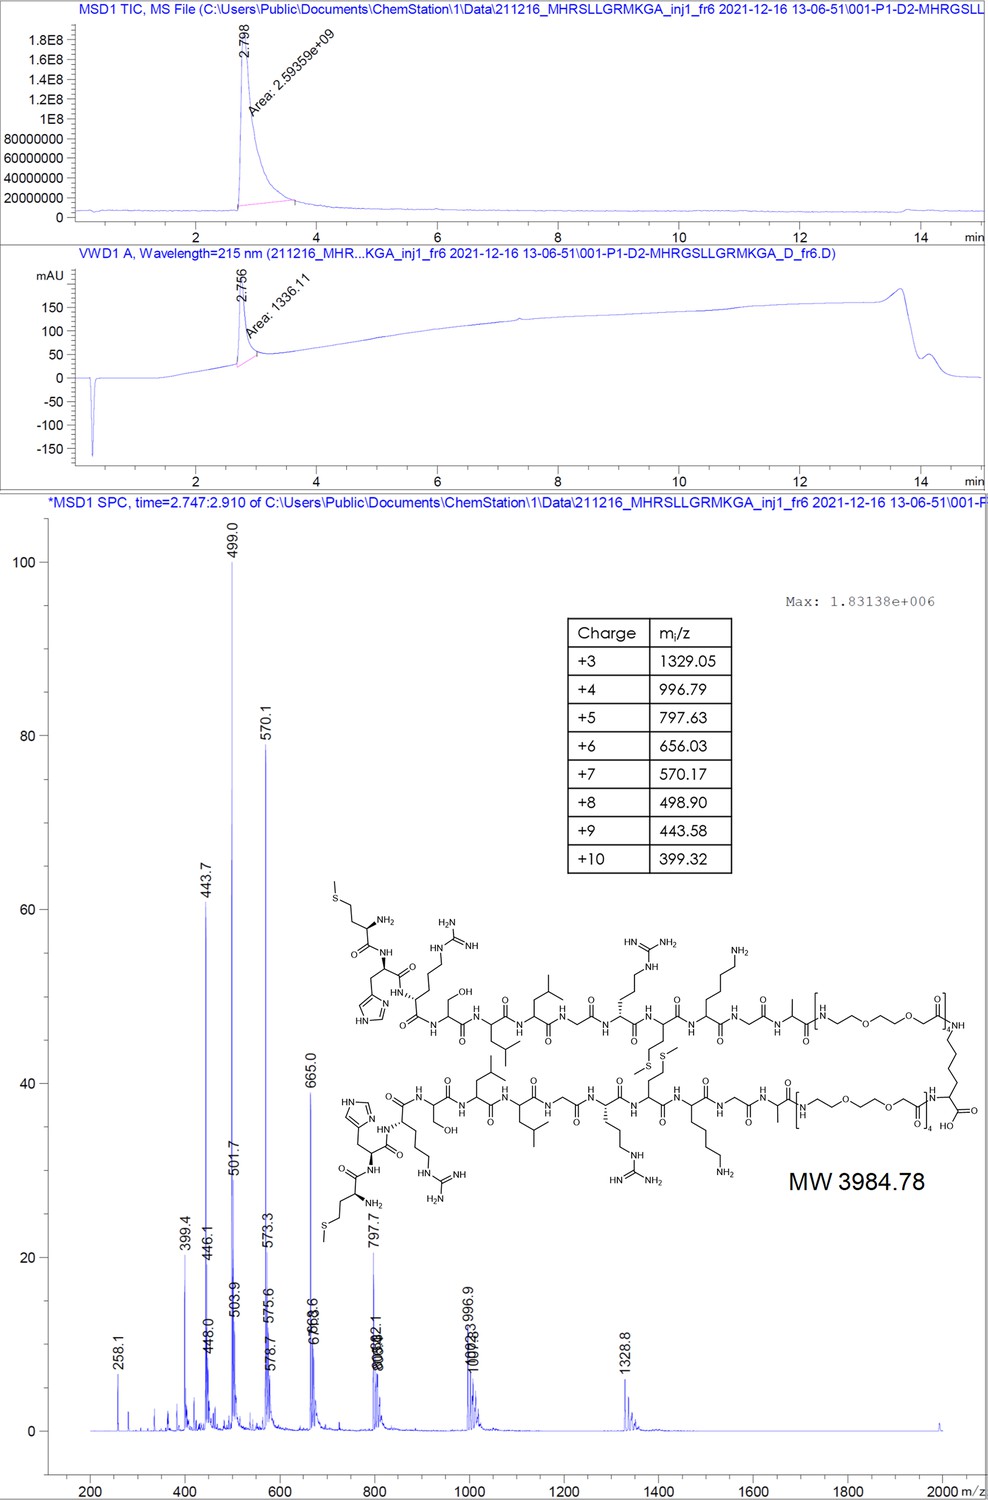
MHRSLLGRMKGA-PEGlinker-Dimer (P1 dimer).
Appendix 1—figure 5
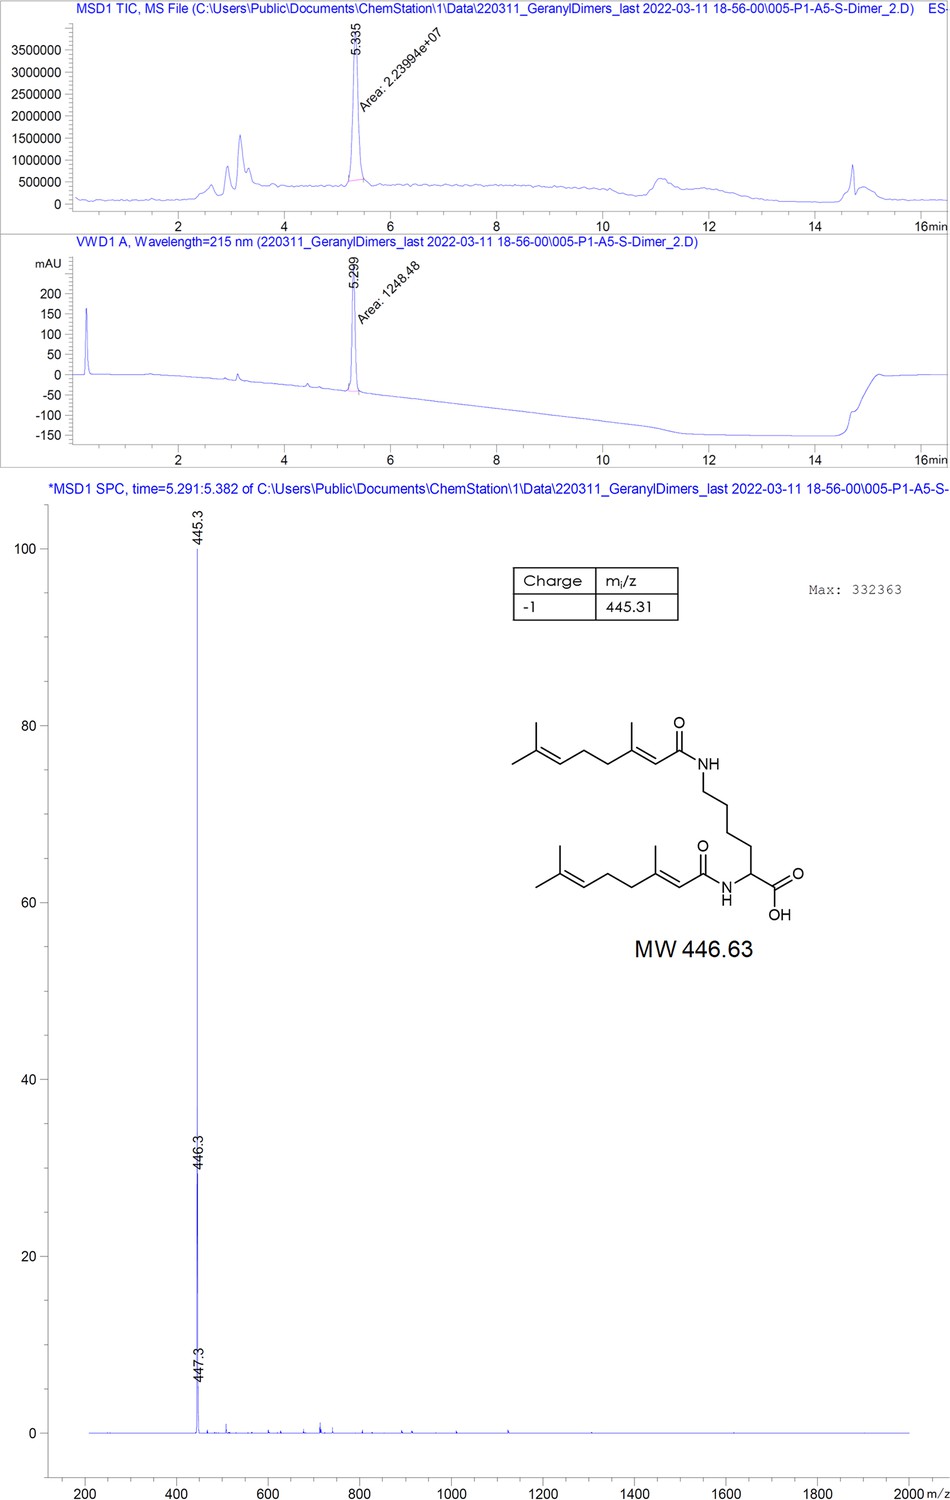
(Geranyl)2-Lys2.
Appendix 1—figure 6
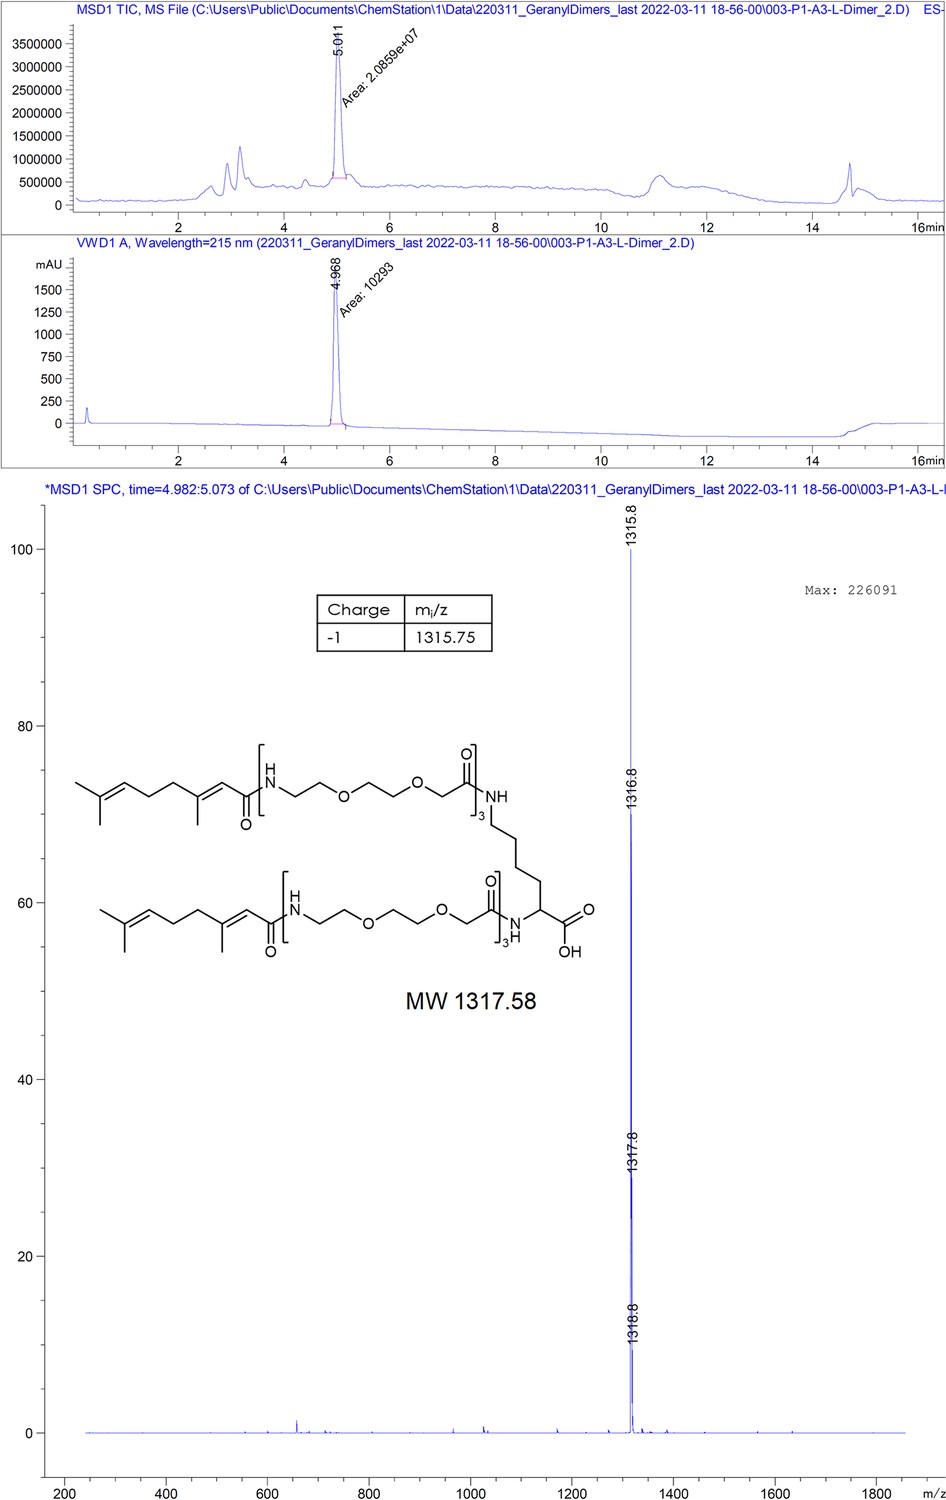
(Geranyl-PEG3)2-Lys.
Appendix 1—figure 7
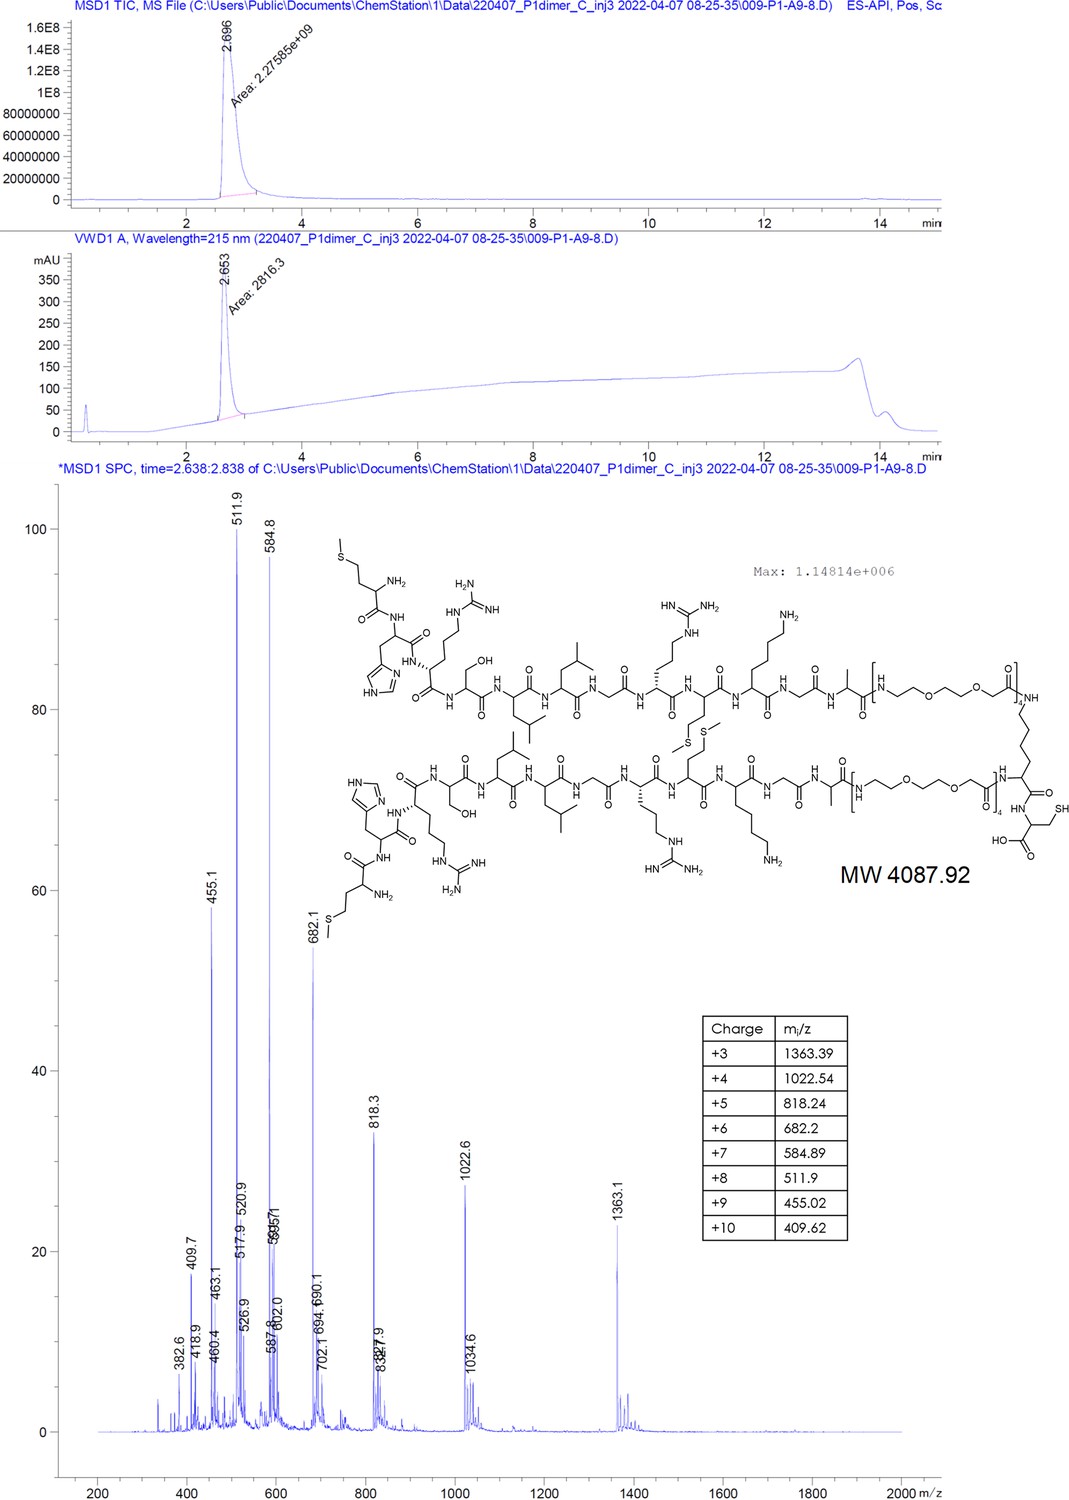
MHRSLLGRMKGA-PEGlinker-Dimer-C (P1dC).
Appendix 1—figure 8
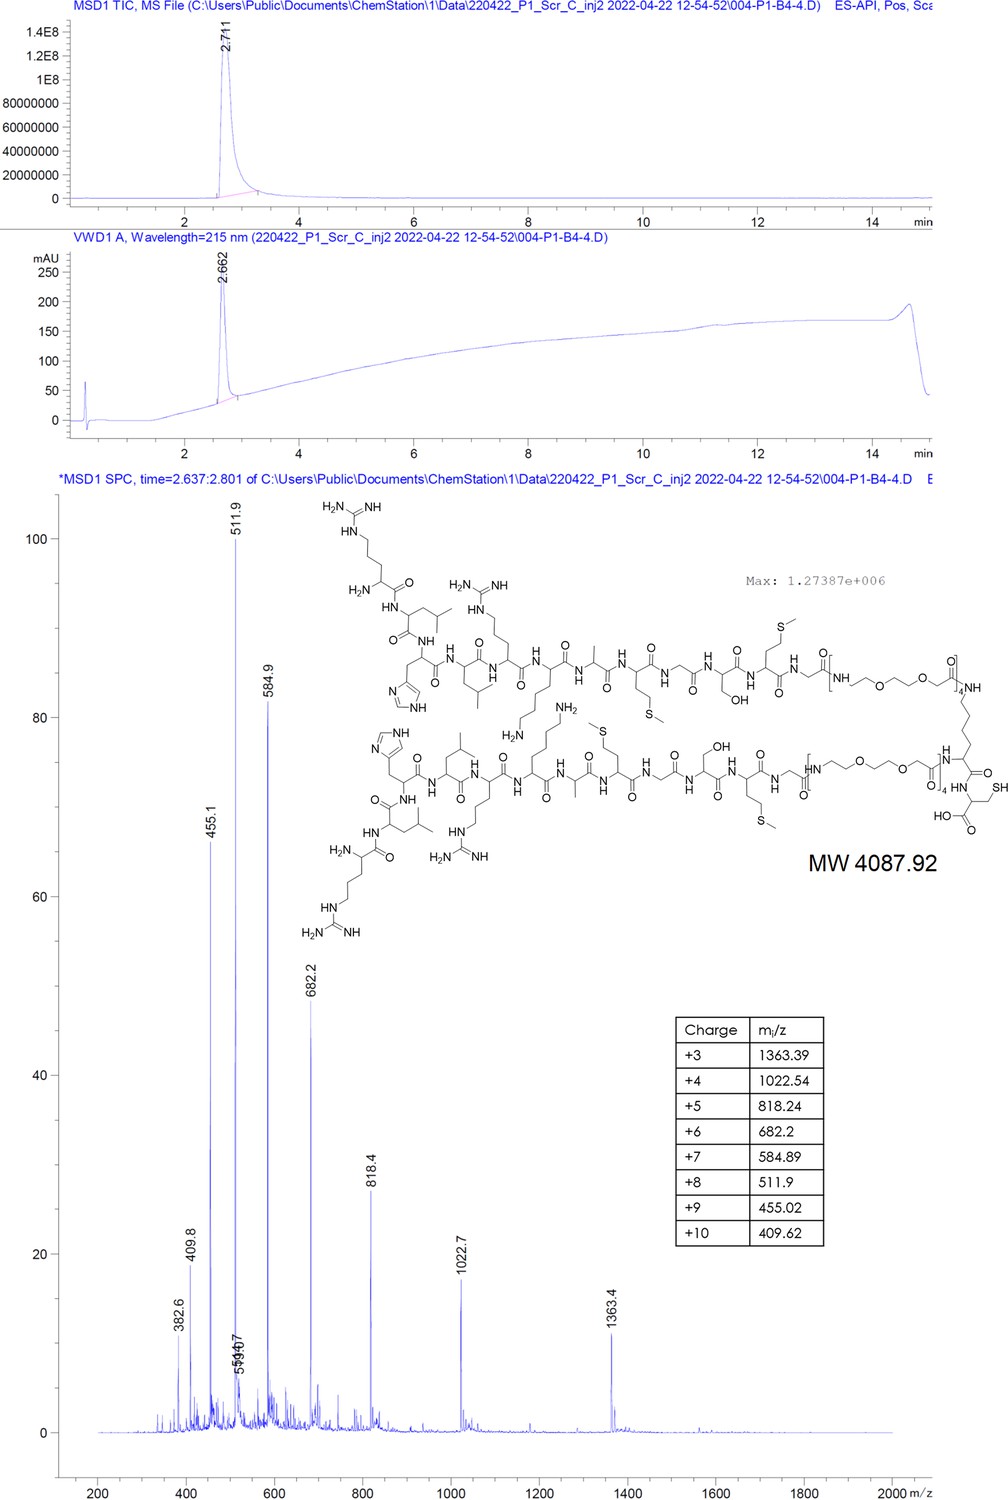
RLHLRKAMGSMG-PEGlinker-Dimer-C (scrP1dC).
Appendix 1—figure 9
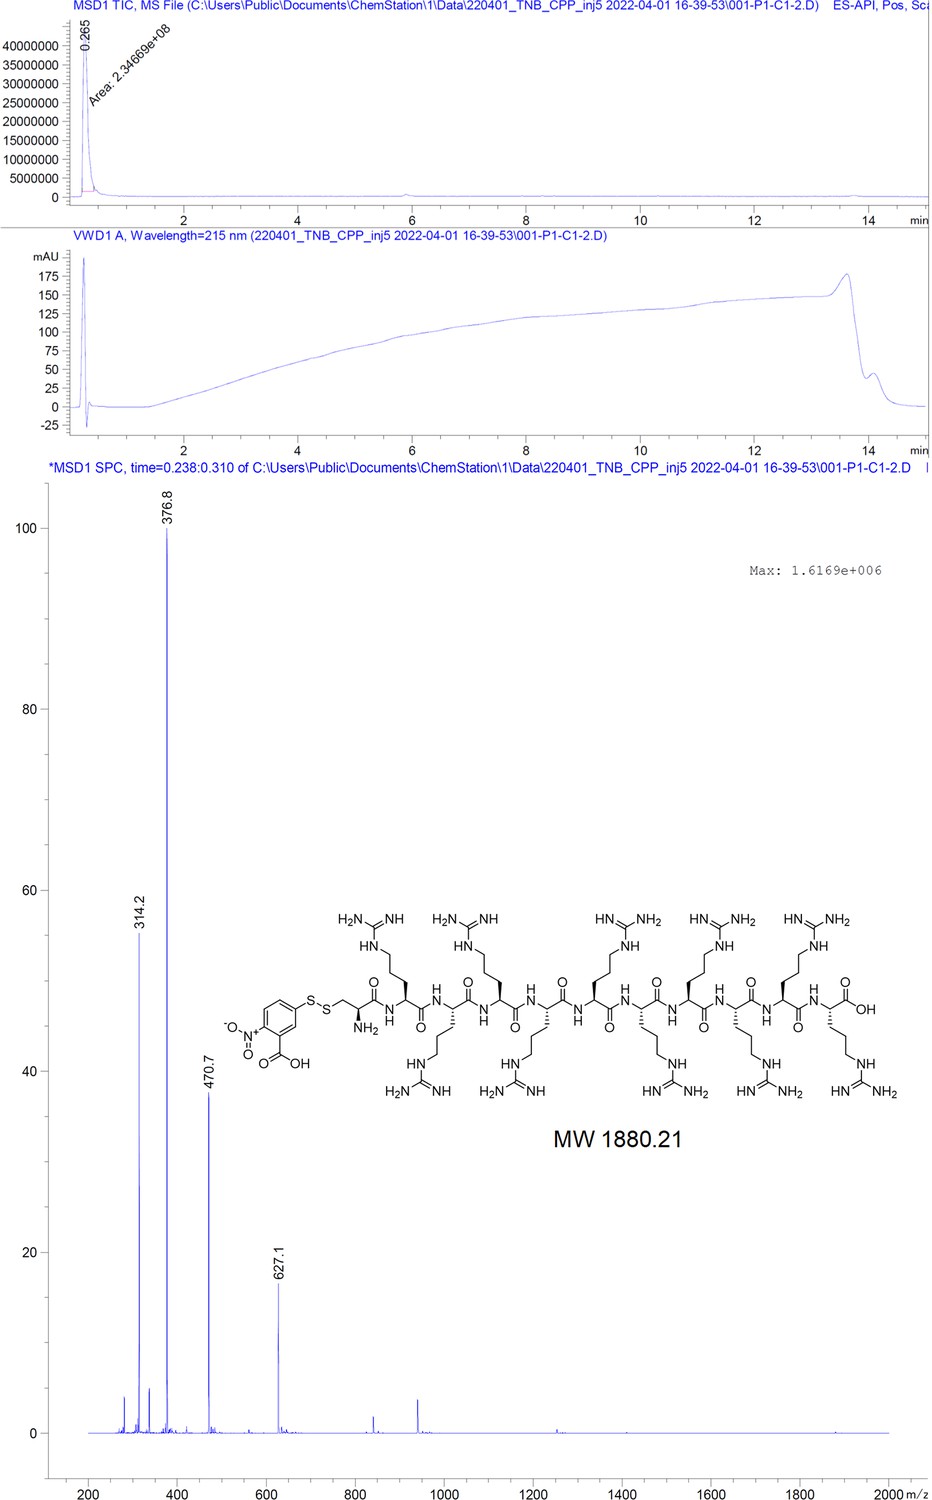
TNB-C-10R.
Tables
Table 1
Direct-acting hepatitis B virus (HBV) antivirals.
| Class | Mechanism of action | Examples | Development stage (Hepatitis B Foundation, 2023) | Molecule type |
|---|---|---|---|---|
| Entry inhibitors | NTCP (sodium/taurocholate co-transporting polypeptide) receptor (Watashi and Wakita, 2015) inhibition. | Bulevirtide (Ligat et al., 2021) | Phase III | Lipopeptide |
| A2342 (Bonn et al., 2022) | Preclinical | Small molecule | ||
| HBsAg inhibitor | Inhibition of the host HSP40 chaperone DNAJB12 that mediates spherical HBV assembly. Reduces the HBsAg in the circulation and lowers intracellular HBsAg (Vaillant, 2022). | REP 2139 (Vaillant, 2019) | Phase II | Nucleic acid polymer |
| Translation inhibitors | Antisense oligonucleotide (ASO) or small interfering RNAs (siRNA) (Gareri et al., 2022) that target HBV messenger RNAs and act to decrease levels of viral proteins. | Bepirovirsen (Yuen et al., 2022) | Phase III | ASO |
| VIR-2218 (Gane et al., 2023) | Phase II | siRNA | ||
| Viral gene repressors | Specific cleavage mediation of viral covalently closed circular DNA (cccDNA) via nucleases (Ono and Bassit, 2021). | PBGENE-HBV (Gorsuch et al., 2022) | Preclinical | Endonuclease I-CreI |
| EBT107 (Ono and Bassit, 2021) | Preclinical | CRISPR-Cas9 | ||
| Capsid assembly modulators | Target the hydrophobic pocket located at the dimer-dimer interface near the C termini of HBc subunits and induce misassembly of the core protein, thereby impeding the formation of infectious progeny virions (Ono and Bassit, 2021; Kim et al., 2021; Zheng et al., 2023). | Canocapavir (Zheng et al., 2023) | Phase II | Small molecule |
| EDP-514 (Feld et al., 2022) | Phase I | Small molecule |
Key resources table
| Reagent type (species) or resource | Designation | Source or reference | Identifiers | Additional information |
|---|---|---|---|---|
| Gene (hepatitis B virus genome) | CLP coding region; complement (733.1371) | GenBank: V01460.1 | Genotype D; strain ayw | |
| Cell line (Homo sapiens) | HEK293 | DSMZ | Cat# ACC 305 RRID:VCL_0045 | Epithelial morphology; embryo kidney |
| Transfected construct (human) | pEGFP-C2 | Clontech | Donor vector for CLP expression | |
| Antibody | Mouse anti-Hepatitis B Virus Antibody; core Antigen; clone C1-5, monoclonal; a.a. 74–89 | MilliporeSigma | Cat# MAB16988 RRID:AB_11212378 | IF (1:500) |
| Antibody | Goat anti-Mouse IgG (H+L), polyclonal | Invitrogen | Cat# 84545 RRID:AB_2633280 | IF (1:500) |
| Chemical compound, drug | n-Decyl-β-D-maltopyranoside (DM) | Anatrace | Cat# D310 | Used in binding assays. |
| Software algorithm | Relion 3.1. and 4.0 | https://github.com/3dem/relion; Scheres, 2012a; Scheres, 2012b | Image processing | |
| Software, algorithm | Cryosparc 4.0 | https://Cryosparc.com/ | Image processing | |
| Software, algorithm | MotionCorr2 | Zheng et al., 2017 | Movie processing | |
| Software, algorithm | Phenix | https://phenix-online.org/ | Model building | |
| Software, algorithm | Coot | https://www2.mrc-lmb.cam.ac.uk/personal/pemsley/coot/binaries/ | Model building | |
| Software, algorithm | Chimera | https://www.rbvi.ucsf.edu/chimera | Preparation of figures from pdb models and EM-maps | |
| Software, algorithm | MicroCal ITC200 Analysis | Malvern Panalytical, Malvern | Processing of the ITC data implemented in Origin and supplied with the MicroCal iTC200 |
Additional files
-
Supplementary file 1
ITC200 specifications.
ITC200 instrument’s specifications used for the interaction analysis between peptides and capsids.
- https://cdn.elifesciences.org/articles/98827/elife-98827-supp1-v1.docx
-
Supplementary file 2
Thermodynamic parameters of HBc capsids interactions.
Summary of thermodynamic parameters obtained by ITC experiments using the peptide dimers and fl wt HBc capsids. In case of the P2 dimer, the deviations represent deviations of fit since only one ITC experiment was performed. N represents stoichiometry.
- https://cdn.elifesciences.org/articles/98827/elife-98827-supp2-v1.docx
-
Supplementary file 3
Microarray positional scan data.
Obtained raw grayscale values from P1 full positional scan in µSPOT format. Each box corresponds to a single-point variation of the P1 peptide sequence (horizontal) as indicated in the first column. The raw intensity values presented here were used for calculating the fold intensity change of each point variation against the wildtype sequence. Data are presented as mean of n=3 microarray slides with SD.
- https://cdn.elifesciences.org/articles/98827/elife-98827-supp3-v1.docx
-
Supplementary file 4
Cryo-EM data.
Summary of cryo-EM data acquisition and image processing of the HBc CLPs with bound geraniol, P1dC, and SLLGRM-dimers.
- https://cdn.elifesciences.org/articles/98827/elife-98827-supp4-v1.docx
-
MDAR checklist
- https://cdn.elifesciences.org/articles/98827/elife-98827-mdarchecklist1-v1.docx
Download links
A two-part list of links to download the article, or parts of the article, in various formats.
Downloads (link to download the article as PDF)
Open citations (links to open the citations from this article in various online reference manager services)
Cite this article (links to download the citations from this article in formats compatible with various reference manager tools)
Induction of hepatitis B core protein aggregation targeting an unconventional binding site
eLife 13:RP98827.
https://doi.org/10.7554/eLife.98827.3


