Srs2 binding to proliferating cell nuclear antigen (PCNA) and its sumoylation contribute to replication protein A (RPA) antagonism during the DNA damage response
- Molecular Biology Program, Memorial Sloan Kettering Cancer Center, United States
- City University of New York Hunter College, United States
Figures
Figure 1
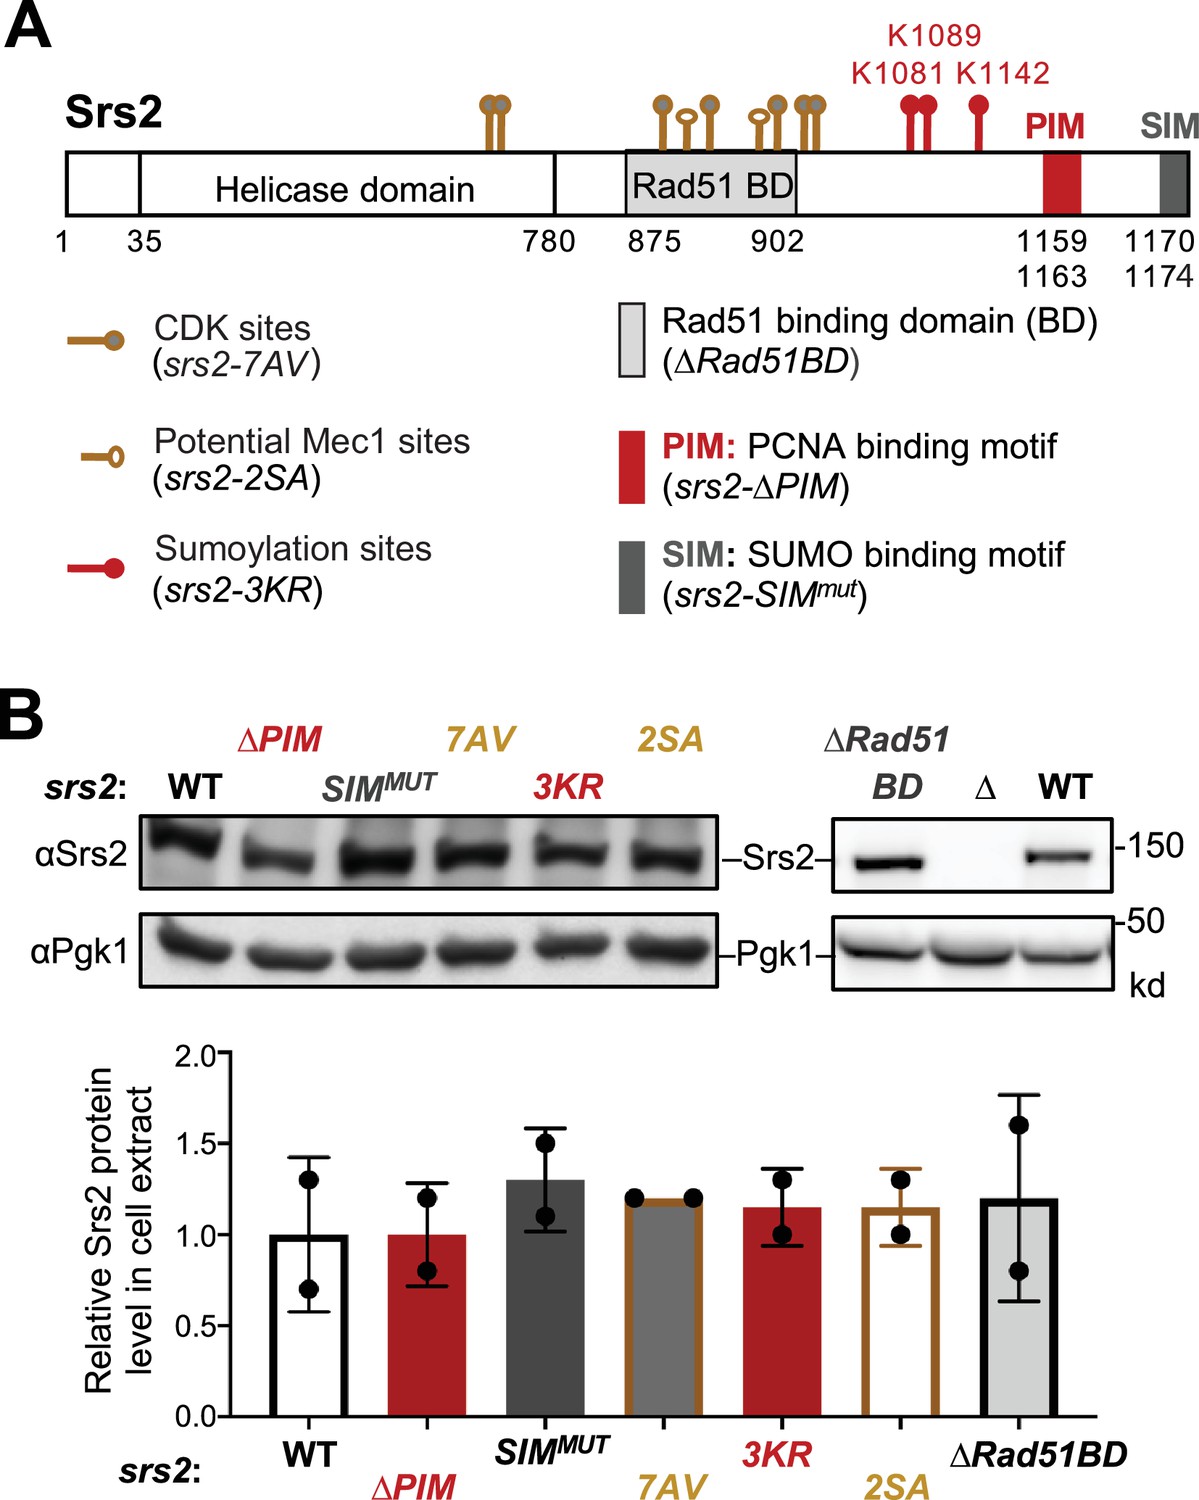
Regulatory features of Srs2 and corresponding mutants.
(A) Schematic of Srs2 protein domains, regulatory features, and mutations affecting each of its features. Cdk1 phosphorylation sites depicted here include T604, S698, S879, S893, S938, S950, and S965 (Chiolo et al., 2005). Potential Mec1 phosphorylation sites include S890 and S933 (Albuquerque et al., 2015; Faca et al., 2020). Sumoylation sites mapped previously include K1081, K1089, and K1142 (Saponaro et al., 2010). Protein-interaction domains or motifs include the Rad51 binding domain (BD), PCNA Interaction Motif (PIM), and SUMO Interaction Motif (SIM) (Colavito et al., 2009; Kolesar et al., 2016; Kolesar et al., 2012). The residues for these domains are indicated. Mutant alleles disabling each of these features are included in the parentheses. (B) Mutations affecting Srs2 features do not affect Srs2 protein level. Protein extracts were prepared from asynchronous cells. Srs2 was examined using anti-Srs2 antibody by immunoblotting. Srs2 levels in each mutant were first normalized to the Pgk1 loading control and then to those in wild-type cells. Mean of two biological isolates per genotype is graphed with error bars representing standard deviation (SD). No statistical differences were seen when comparing the Srs2 protein level between the wild-type (WT) control and each of the indicated mutants based on Student’s t-test.
-
Figure 1—source data 1
Original western blots for Figure 1B, indicating the relevant lanes.
- https://cdn.elifesciences.org/articles/98843/elife-98843-fig1-data1-v1.pdf
-
Figure 1—source data 2
Original files for western blot analysis displayed in Figure 1B.
- https://cdn.elifesciences.org/articles/98843/elife-98843-fig1-data2-v1.zip
Figure 2 with 1 supplement
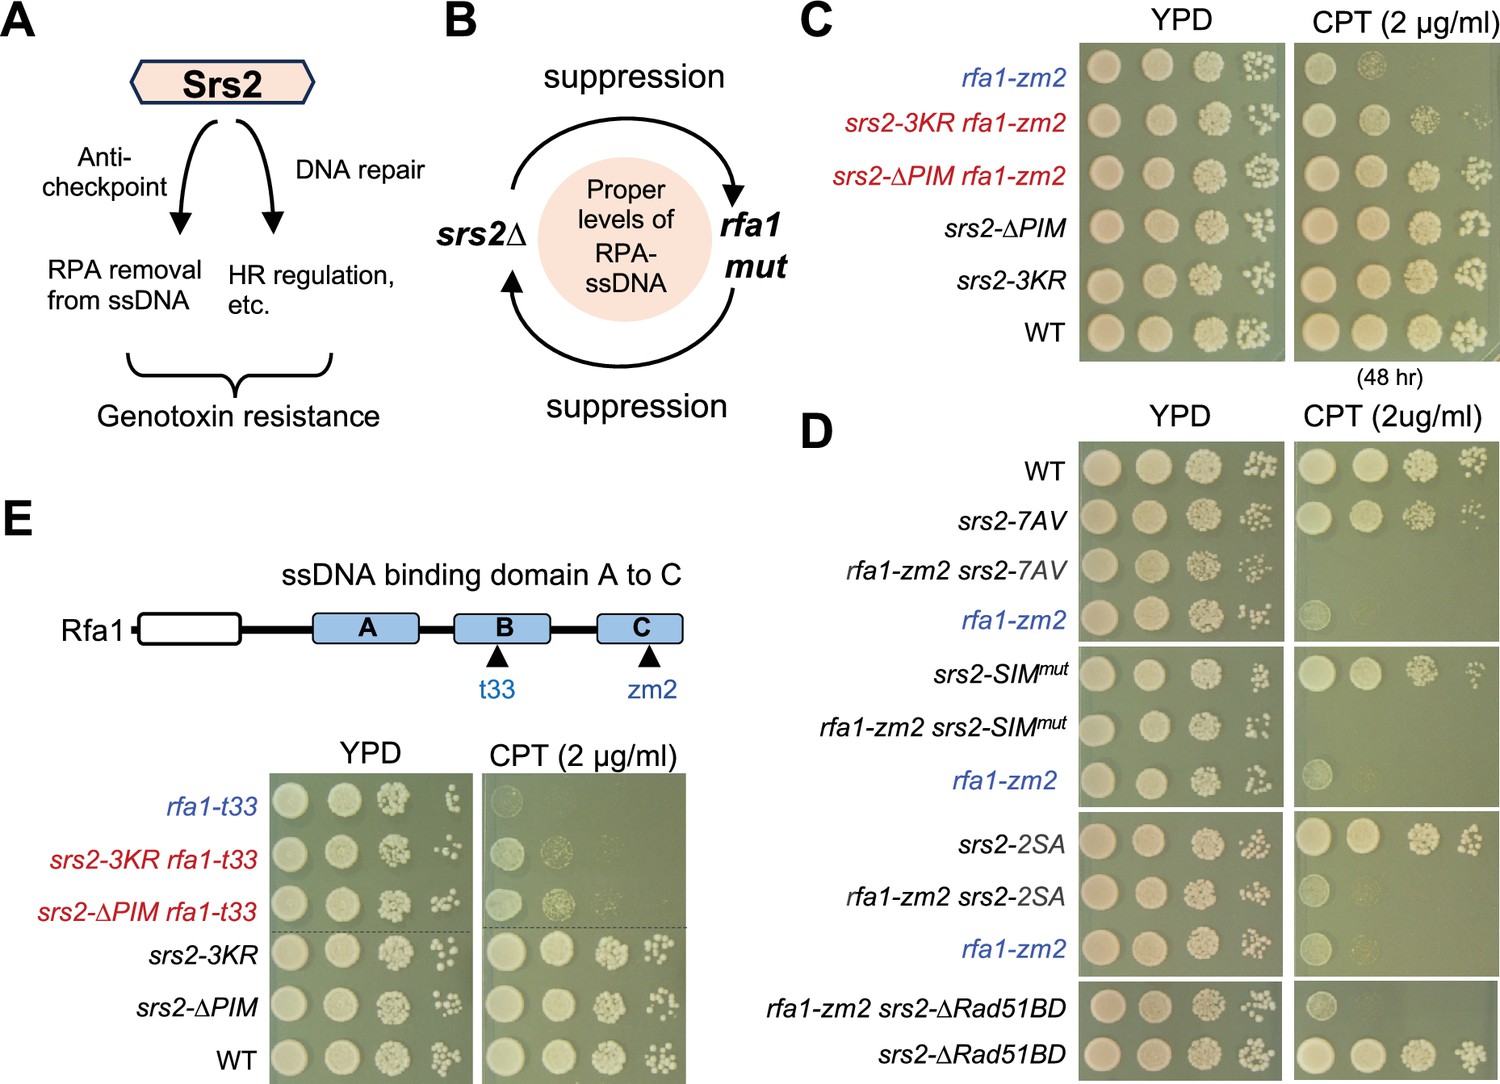
PCNA binding and sumoylation are involved in suppressing rfa1 mutants.
(A) Schematic to show that Srs2’s roles in checkpoint dampening (anti-checkpoint for simplicity) and DNA repair, both of which contribute to genotoxin resistance. (B) Schematic to highlight the mutual suppressive relationship between srs2∆ and rfa1 mutants and the underlying effects on the RPA-ssDNA levels in cells. (C) srs2-∆PIM or -3KR suppresses rfa1-zm2 sensitivity to CPT. A 10-fold serial dilution of cells of the indicated genotypes was spotted and growth was assessed after incubation at 30°C for 40 hours unless otherwise noted. (D) Several srs2 mutants did not suppress rfa1-zm2 sensitivity to CPT. Experiments were performed as in (C). (E) srs2-∆PIM or -3KR suppresses rfa1-t33 sensitivity to CPT. Top: schematic of the Rfa1 protein domains and rfa1 mutant alleles. Bottom: srs2-∆PIM or -3KR improved CPT sensitivity of rfa1-t33 cells. Experiments were performed as in (C).
Figure 2—figure supplement 1

srs2 mutants examined for CPT sensitivity and interactions with rfa1 mutant.
(A) srs2 mutants exhibit different levels of CPT sensitivity. srs2-∆PIM showed slow growth on 8 µg/ml CPT. Sensitivity of srs2- SIMMUT toward CPT was seen at three CPT concentrations. srs2-7AV showed slow growth on media containing 4 and 8 µg/ml CPT. srs2∆ and rfa1-zm2 are mutually suppressive for CPT sensitivity. Experiments are performed as in Figure 2C. (B) srs2-∆PIM confers better suppression of rfa1-zm2’s CPT and MMS sensitivity than srs2-3KR. We note that mild suppression of rfa1-zm2 by srs2-3KR was only seen at 0.03% MMS plates. Experiments are performed as in Figure 2C, and incubation times are noted. Dashed lines indicate the removal of superfluous rows. (C) srs2-∆PIM suppresses rfa1-t33 sensitivity toward MMS. Dashed lines indicate the removal of superfluous rows.
Figure 3 with 1 supplement
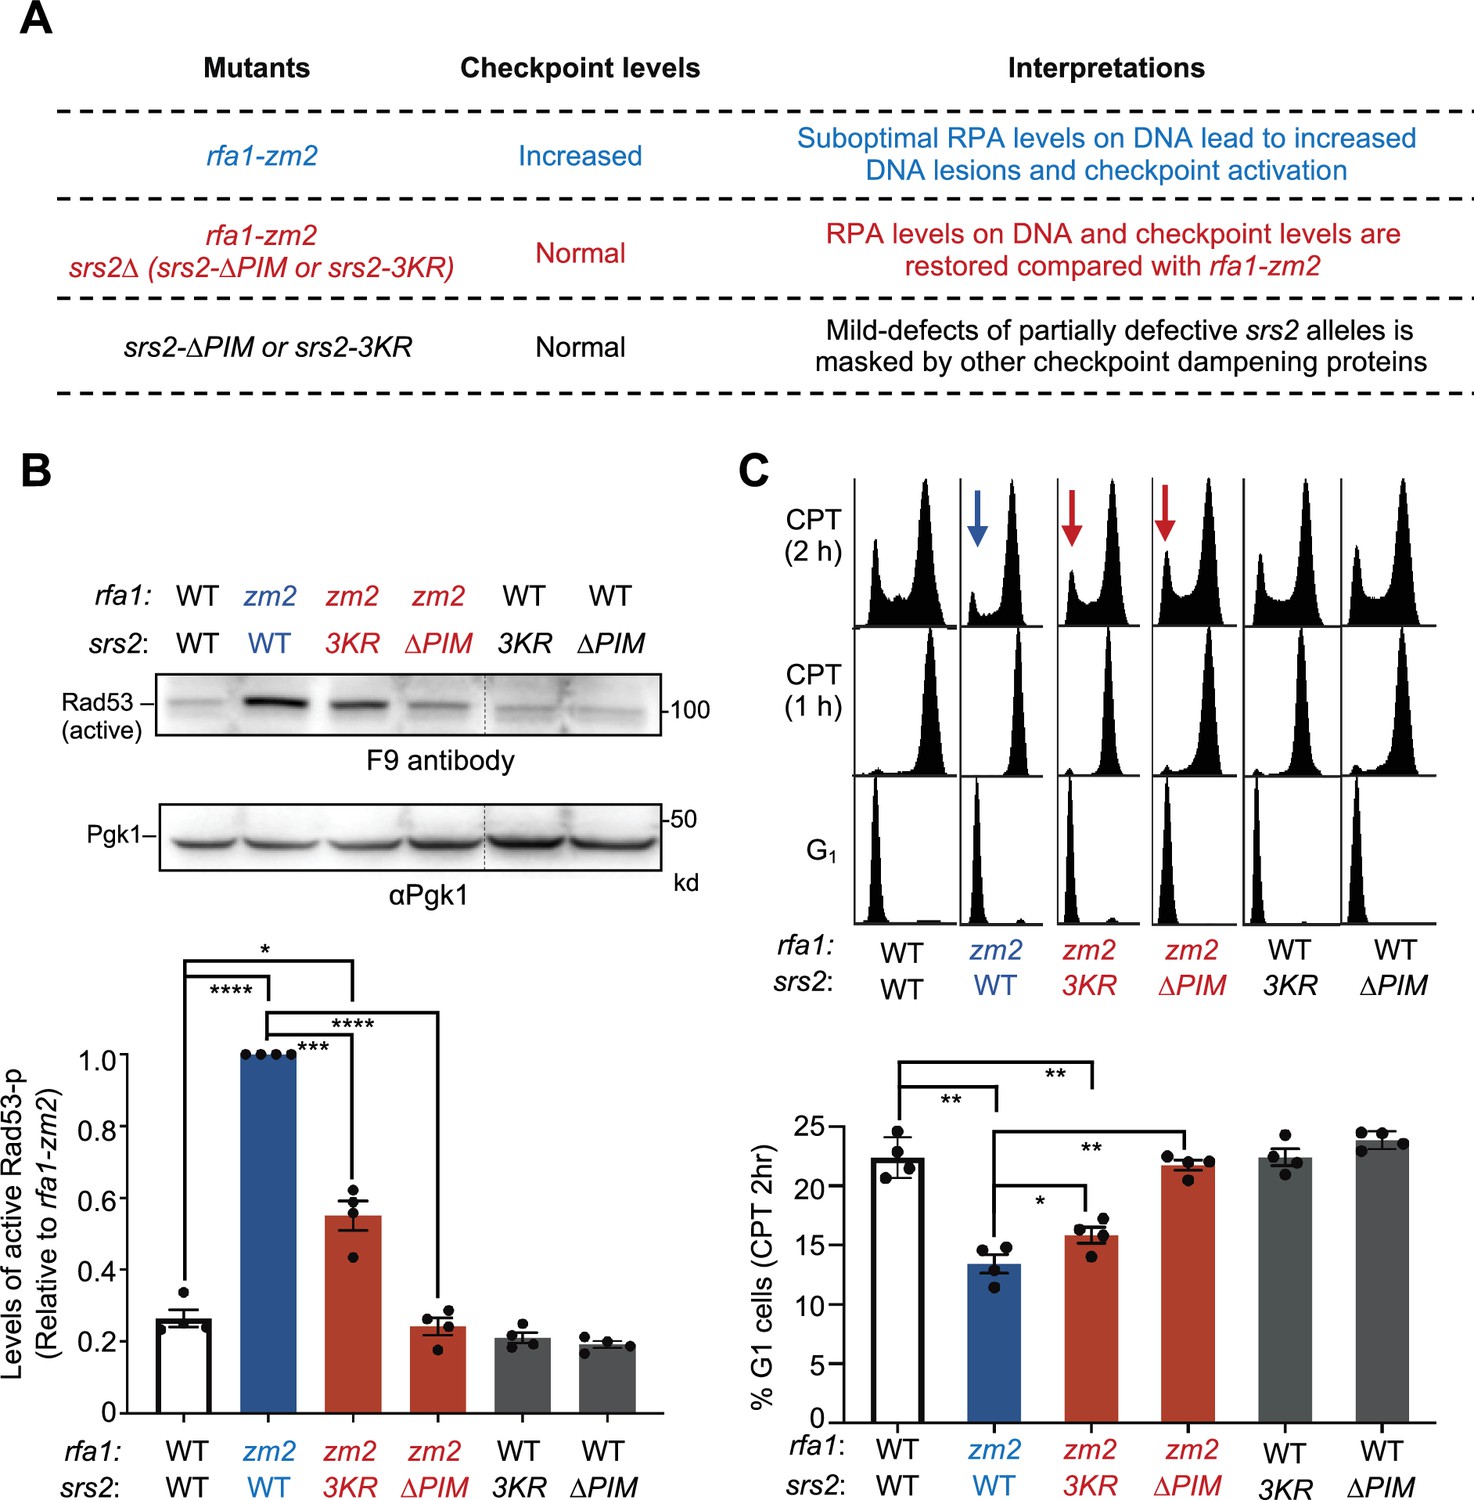
PIM and-3KR correct checkpoint abnormalities in rfa1-zm2 cells.
(A) A table summarizing DDC levels observed in rfa1-zm2, srs2 null or partially defective mutants, and their combined mutants in this work and in a previous study (Dhingra et al., 2021) and interpretations. (B) srs2-∆PIM or -3KR reduces the levels of phosphorylated Rad53 in rfa1-zm2 cells. Protein extracts were examined after G1 cells were released into cycling in the presence of 16 ug/ml CPT for 2 hours. Phosphorylated Rad53 (active form) was detected by the F9 antibody by immunoblotting. Phosphorylated Rad53 signals in each indicated strain were compared to the Pgk1 loading control and normalized to those of rfa1-zm2. Two biological isolates per genotype were examined in two technical repeats, and results are graphed with error bars representing SD. Statistical analysis was performed using pairwise Student’s t-test (*p<0.05; ***p<0.001; ****p<0.0001, and non-statistical significance is not marked) (C) srs2-∆PIM and -3KR allow better G1 entry of rfa1-zm2 cells. Experiments were performed as in (A), and samples were collected at indicated time points. FACS profiles of the samples are shown at the top and percentages of G1 cells after 2 hours of CPT treatment (CPT 2 h) are plotted at the bottom. Two biological isolates per genotype were examined in two technical repeats and results are graphed with error bars representing SD. Statistical analysis was performed and results are depicted as in (B).
-
Figure 3—source data 1
Original western blots for Figure 3B, indicating the relevant lanes.
- https://cdn.elifesciences.org/articles/98843/elife-98843-fig3-data1-v1.pdf
-
Figure 3—source data 2
Original files for western blot analysis displayed in Figure 3B.
- https://cdn.elifesciences.org/articles/98843/elife-98843-fig3-data2-v1.zip
Figure 3—figure supplement 1

srs2-∆PIM cells exhibit increased levels of Rfa1 on chromatin.
(A) rfa1-zm2 suppresses increased levels of Rfa1 in the chromatin fraction seen in srs2-∆PIM. Rfa1 in chromatin and non-chromatin fractions as well as in total cell extracts was examined for strains with indicated genotypes. Histone H3 and Pgk1 were used as markers for chromatin and nonchromatin fractions, respectively. (B) The relative levels of chromatin-bound Rfa1 after being normalized to H3 levels are shown. Mean of three biological isolates per genotype is graphed, with error bars representing standard deviation (SD). Statistical analysis was performed using pairwise Student’s t-test. *p<0.05.
-
Figure 3—figure supplement 1—source data 1
Original western blots for Figure 3—figure supplement 1, indicating the relevant lanes.
- https://cdn.elifesciences.org/articles/98843/elife-98843-fig3-figsupp1-data1-v1.pdf
-
Figure 3—figure supplement 1—source data 2
Original files for western blot analysis displayed in Figure 3—figure supplement 1.
- https://cdn.elifesciences.org/articles/98843/elife-98843-fig3-figsupp1-data2-v1.zip
Figure 4
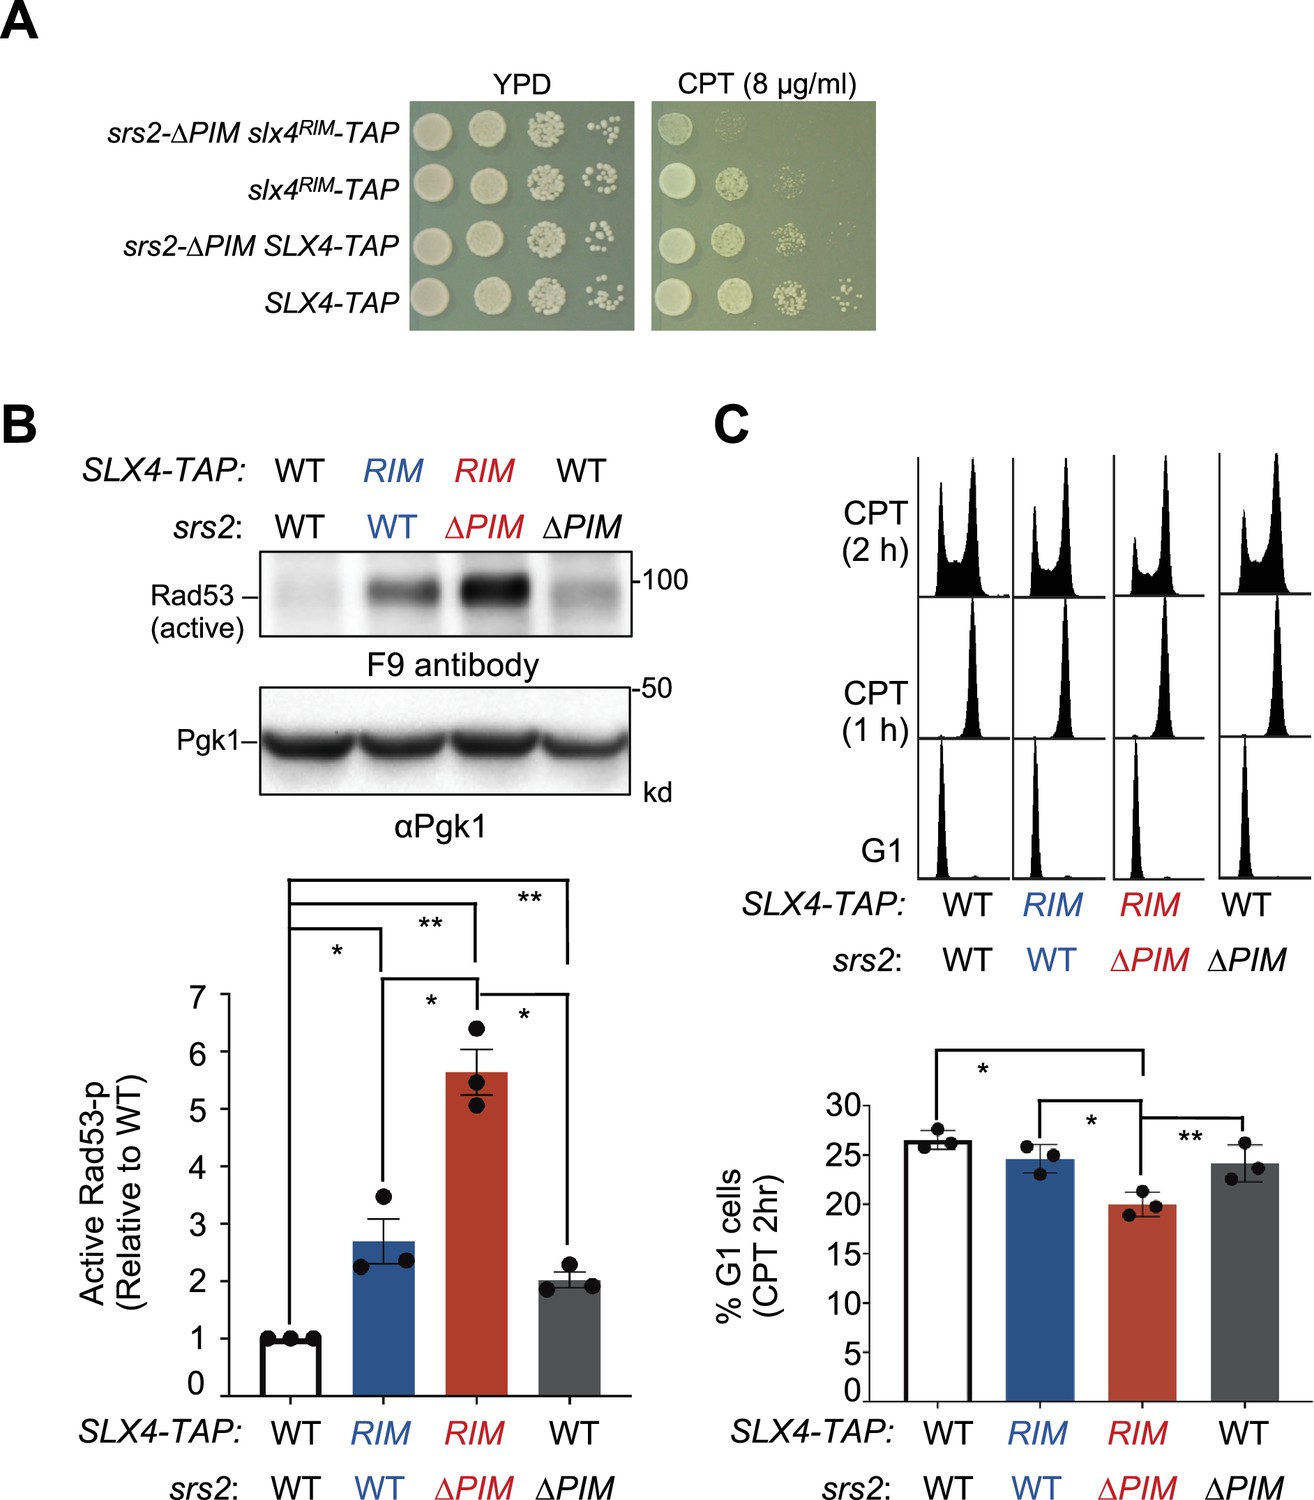
srs2-∆PIM and slx4RIM are additively defective in DDC downregulation.
(A) The srs2-∆PIM slx4RIM double mutant shows stronger CPT sensitivity than either single mutant. Experiments are performed as in Figure 2C. (B) srs2-∆PIM and slx4RIM are additive for increasing the level of phosphorylated Rad53 when cells are treated with CPT. Experiments were conducted, and data are quantified as those described in Figure 3B. Results from three biological isolates per genotype are graphed with error bars representing SD. Statistical analysis was performed using pairwise Student’s t-test. *p<0.05; **p<0.01. (C) srs2-∆PIM and slx4RIM are additive for reducing cells exiting from G2/M phase at 2 hours post CPT treatment. Experiments were conducted and data are quantified as those described in Figure 3C. Results from three biological isolates per genotype are graphed with error bars representing SD. Statistical analysis was performed using pairwise Student’s t-test. *p<0.05; **p<0.01.
-
Figure 4—source data 1
Original western blots for Figure 4B, indicating the relevant lanes.
- https://cdn.elifesciences.org/articles/98843/elife-98843-fig4-data1-v1.pdf
-
Figure 4—source data 2
Original files for western blot analysis displayed in Figure 4B.
- https://cdn.elifesciences.org/articles/98843/elife-98843-fig4-data2-v1.zip
Figure 5 with 1 supplement
Sumoylation depends on the Srs2 PIM motif and the Mec1 kinase.
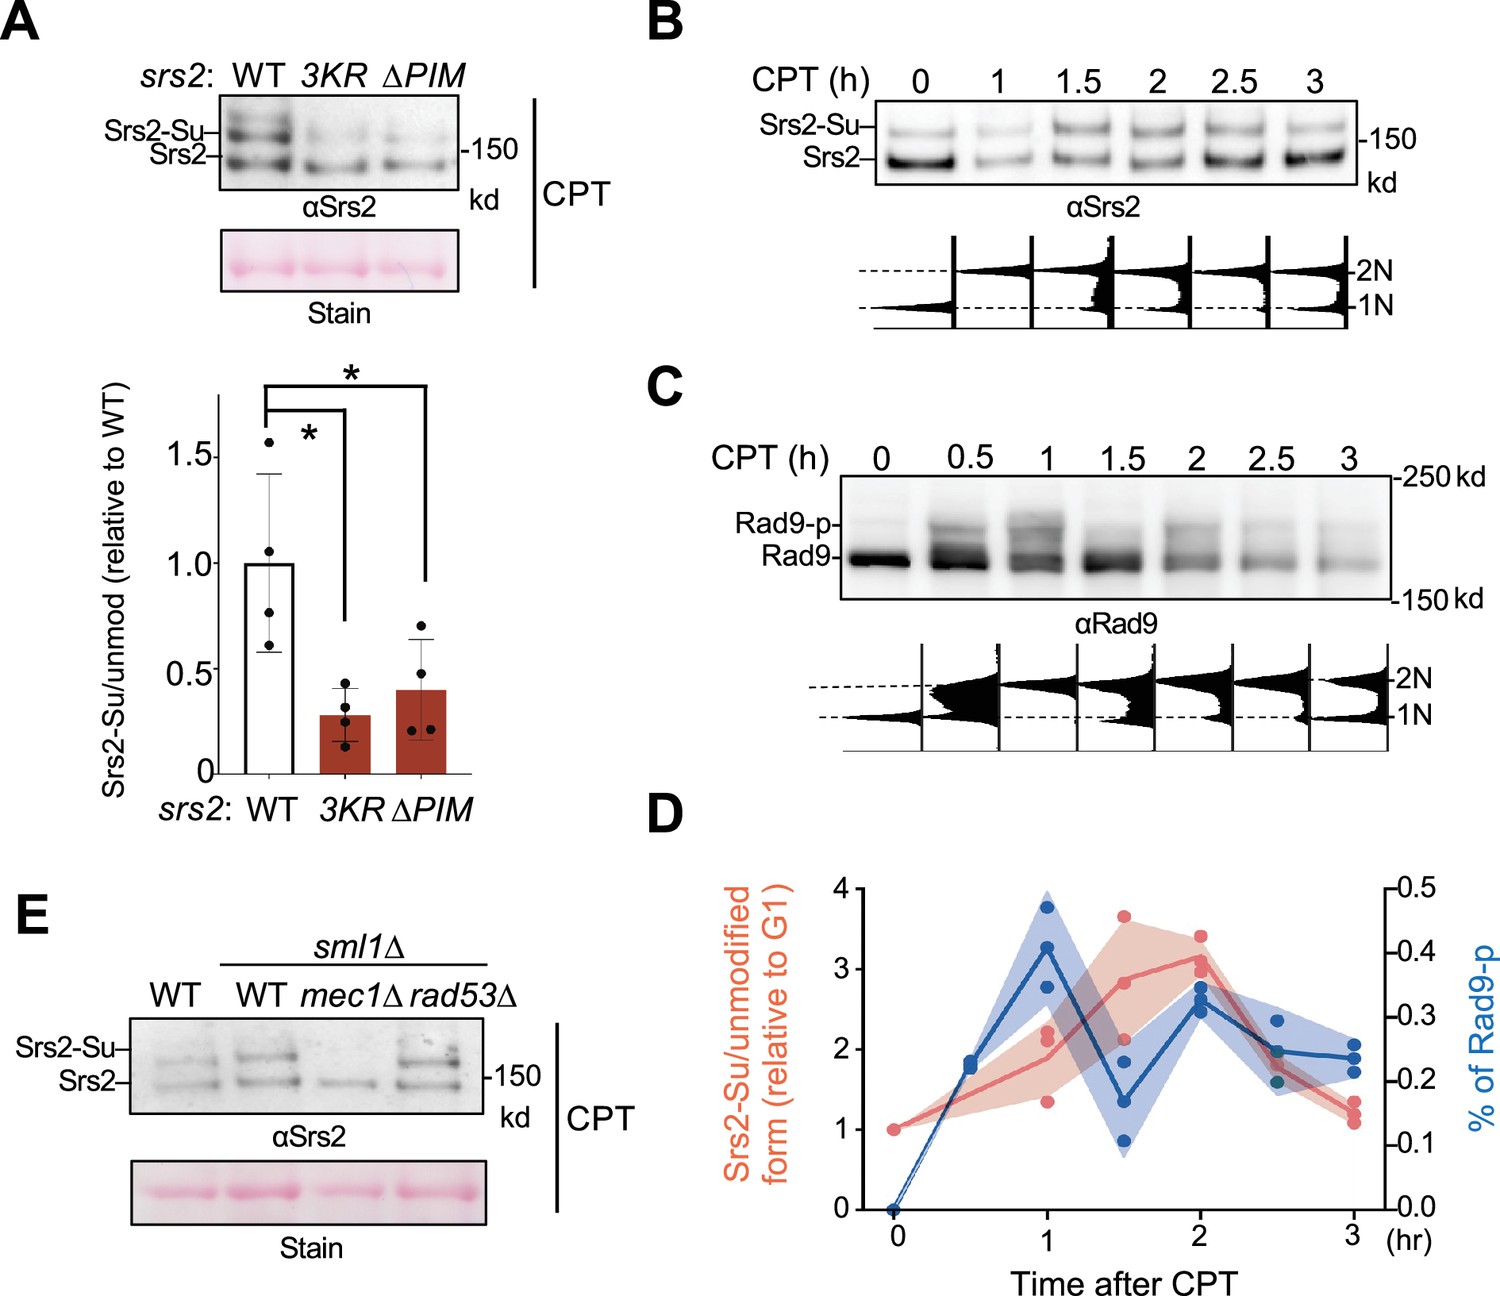
(A) Srs2 sumoylation level is reduced in srs2-∆PIM cells. Samples were collected after CPT treatment as in Figure 3A and sumoylated proteins were enriched as described in the text and ‘Materials and methods’. Sumoylated form of Srs2 (Srs2-Su) migrated slower than unmodified Srs2 on gel and both were detected using anti-Srs2 antibody in immunoblotting. Equal loading is indicated by Ponceau-S stain (Stain). The levels of sumoylated Srs2 relative to those of unmodified Srs2 were normalized to wild-type cells and plotted. Two biological isolates per genotype were examined in two technical repeats and results are graphed with error bars representing SD. Statistical analysis was performed using pairwise Student’s t-test. *p<0.05. (B) Srs2 sumoylation level during CPT treatment. Samples were collected as described in Figure 3B. Experiments were conducted, and immunoblotting data is presented as those in (A). Time 0 samples are G1 cells before CPT treatment. FACS analysis at corresponding time points is included below the plot. (C) Rad9 phosphorylation level during CPT treatment. Samples used in (B) were examined for Rad9 phosphorylation using an anti-Rad9 antibody. Unmodified and phosphorylated (Rad9-p) Rad9 forms are indicated. FACS analysis at corresponding time points is indicated below blots. (D) Quantification of Srs2 sumoylation and Rad9 phosphorylation level changes during CPT treatment. Srs2 sumoylation signals were normalized based on unmodified form. Values at each timepoint were relative to that of G1 sample (Time 0) before CPT treatment, and fold changes were indicated on left y-axis. Rad9 signals were normalized to non-modified form and percentage of phosphorylated form was indicated on right y-axis. Results from three biological isolates per genotype are graphed, and shade width indicates the standard deviation. (E) Mec1 is required for Srs2 sumoylation. Experiments were performed and data are presented as in panel A.
-
Figure 5—source data 1
Original western blots for Figure 5A, B, C and E, indicating the relevant lanes.
- https://cdn.elifesciences.org/articles/98843/elife-98843-fig5-data1-v1.pdf
-
Figure 5—source data 2
Original files for western blot analysis displayed in Figure 5A.
- https://cdn.elifesciences.org/articles/98843/elife-98843-fig5-data2-v1.zip
-
Figure 5—source data 3
Original files for western blot analysis displayed in Figure 5B.
- https://cdn.elifesciences.org/articles/98843/elife-98843-fig5-data3-v1.zip
-
Figure 5—source data 4
Original files for western blot analysis displayed in Figure 5C.
- https://cdn.elifesciences.org/articles/98843/elife-98843-fig5-data4-v1.zip
-
Figure 5—source data 5
Original files for western blot analysis displayed in Figure 5E.
- https://cdn.elifesciences.org/articles/98843/elife-98843-fig5-data5-v1.zip
Figure 5—figure supplement 1

Confirmation of Srs2 sumoylation.
Detection of Srs2 sumoylation. Protein extracts from asynchronous cells were bound to Ni-NTA beads and the elutes were examined by immunoblotting using an anti-Srs2 antibody. Sumoylated Srs2 form was detected in wild-type cells expressing 8His-tagged SUMO (Smt3) but not in cells lacking this construct or in srs2∆ cells. Unmodified Srs2 showed unspecific Ni-NTA bead binding, thus being detectable in cells containing Srs2 regardless of the SUMO status.
-
Figure 5—figure supplement 1—source data 1
Original western blots for Figure 5—figure supplement 1, indicating the relevant lanes.
- https://cdn.elifesciences.org/articles/98843/elife-98843-fig5-figsupp1-data1-v1.pdf
-
Figure 5—figure supplement 1—source data 2
Original files for western blot analysis displayed in Figure 5E.
- https://cdn.elifesciences.org/articles/98843/elife-98843-fig5-figsupp1-data2-v1.zip
Figure 6 with 1 supplement
Mec1 and RPA phosphorylation did not link to Srs2 anti-checkpoint function.
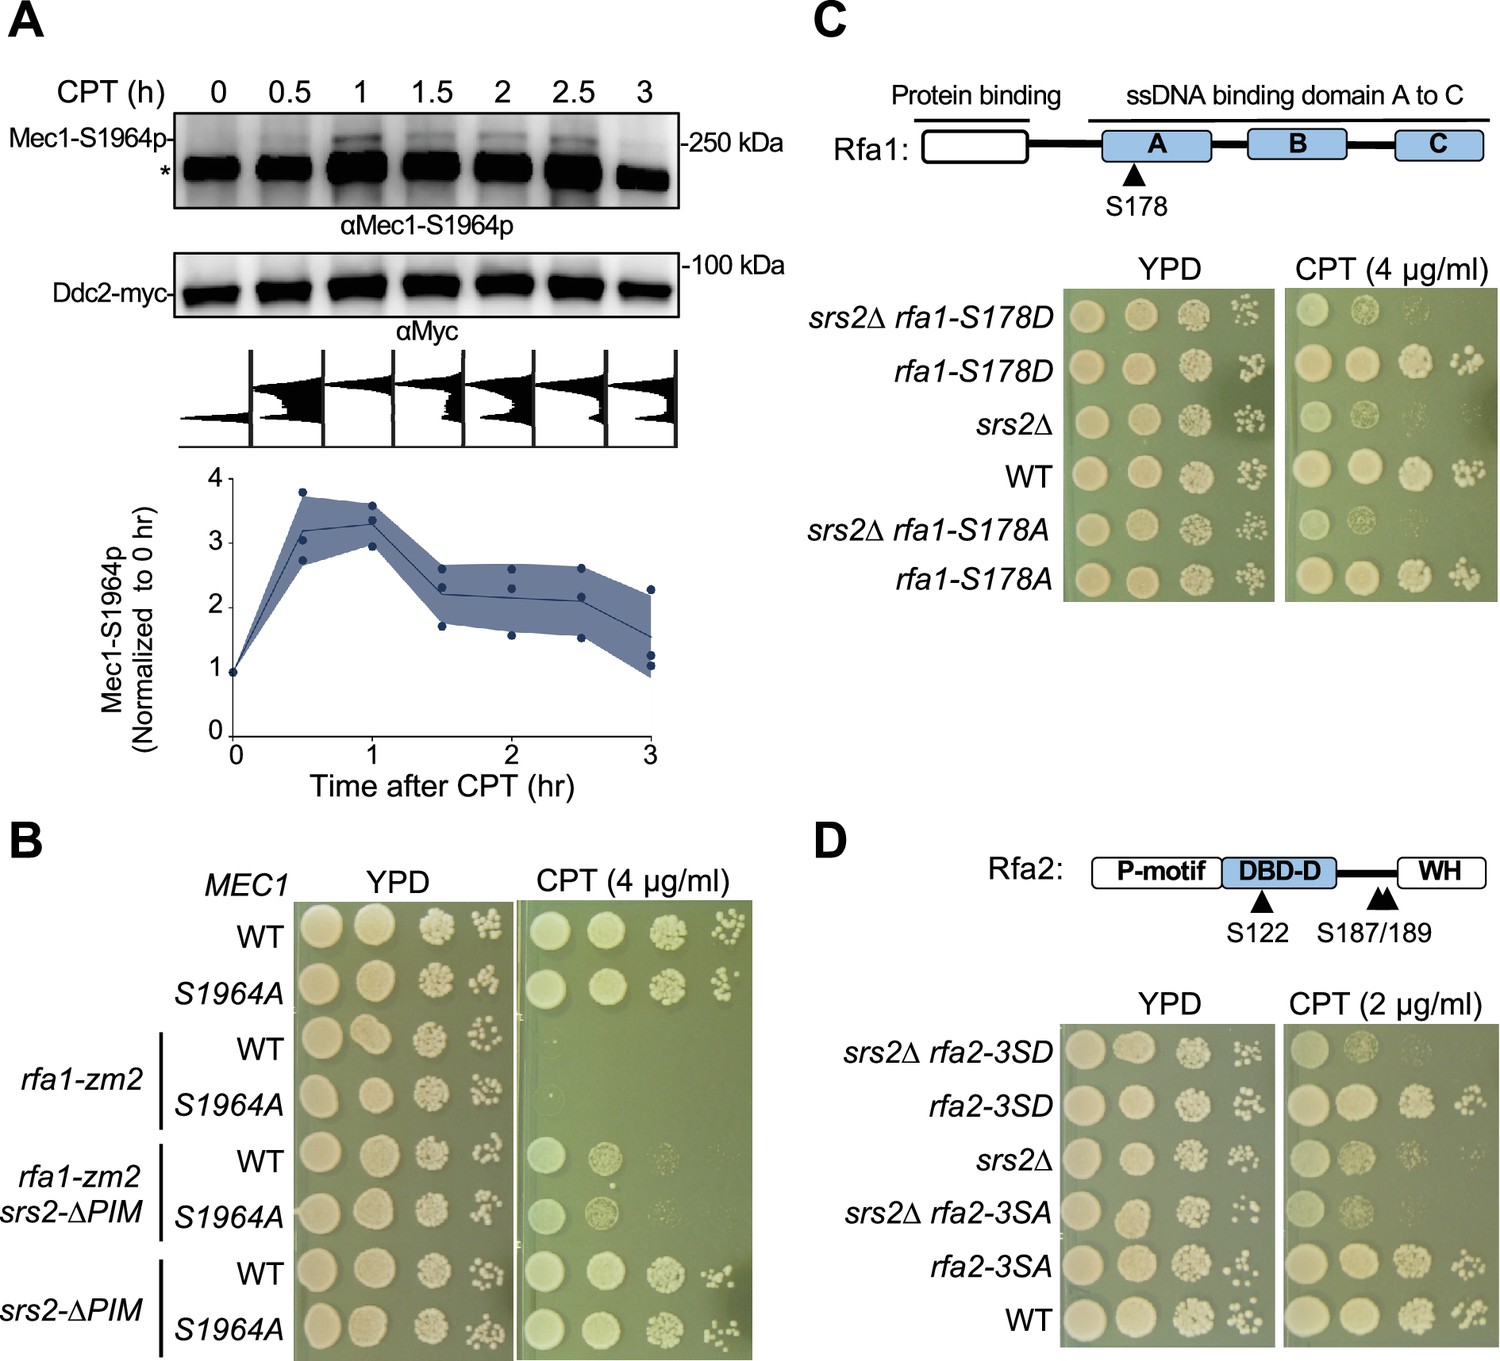
(A) Mec1 autophosphorylation at S1964 during CPT treatment. Samples were collected as described in Figure 3B. Ddc2-myc was immunoprecipitated and the associated Mec1 was co-purified. The anti-Mec1-S1964-p antibody detected the phosphorylated form of Mec1 and a non-specific band (*). Quantification below the blot was based on results from three biological isolates, and shade width indicates the standard deviation. (B) mec1-S1964A did not rescue rfa1-zm2 sensitivity toward CPT. Experiments were performed as in Figure 2C. (C) Examination of the rfa1-S178A and -S178D mutants. Top: schematic of the Rfa1 protein domains and position of Ser178. ssDNA binding domain (DBD) A-C are shown. Bottom, rfa1-S178A and -S178D had no effect on srs2∆’s sensitivity to CPT. Experiments were performed as in Figure 2C. (D) Examination of the rfa2-3SA and -3SD mutants. Top: schematic of the Rfa2 protein domains and position of Ser122, Ser187, and Ser189 mutated in rfa2-3SA and –3SD. ssDNA binding domain (DBD)-D is indicated. Bottom: rfa2-3SA has no effect on srs2∆’s sensitivity toward CPT while rfa2-3SD showed additive effect. Experiments were performed as in Figure 2C.
-
Figure 6—source data 1
Original western blots for Figure 6A, indicating the relevant lanes.
- https://cdn.elifesciences.org/articles/98843/elife-98843-fig6-data1-v1.pdf
-
Figure 6—source data 2
Original files for western blot analysis displayed in Figure 6A.
- https://cdn.elifesciences.org/articles/98843/elife-98843-fig6-data2-v1.zip
Figure 6—figure supplement 1

Confirmation and examination of Mec1-S1964 phosphorylation.
(A) Detection of Mec1-S1964 phosphorylation. Cells were treated with CPT for 2 hours before immunoprecipitating Ddc2-myc was conducted. Ddc2 and the co-immunoprecipitated Mec1 were examined by immunoblotting. Phosphorylation of Ser1964 of the Mec1 protein was detected using the anti-Mec1-S1964-p antibody. This antibody also detected a non-specific band (*). Cells containing untagged Ddc2 or the mec1-S1964A mutation were used as controls. (B) mec1-S1964A does not affect the CPT sensitivity of srs2-3KR or srs2-3KR rfa1-zm2 cells. Experiments were performed as in Figure 2C. (C) The effects of mec1-S1964E on the CPT sensitivity of srs2-3KR and srs2-∆PIM cells with or without rfa1-zm2. Experiments were performed as in Figure 2C. (D) mec1-S1964A or -S1964E does not affect Srs2 sumoylation. Experiments were performed as in Figure 4A. Mean values of three biological isolates per genotype are graphed, with error bars representing SD. Statistical analysis was performed using pairwise Student’s t-test; no significance was found between values of wild-type and mutant strains.
-
Figure 6—figure supplement 1—source data 1
Original western blots for Figure 6—figure supplement 1, indicating the relevant lanes.
- https://cdn.elifesciences.org/articles/98843/elife-98843-fig6-figsupp1-data1-v1.pdf
-
Figure 6—figure supplement 1—source data 2
Original files for western blot analysis displayed in Figure 6—figure supplement 1.
- https://cdn.elifesciences.org/articles/98843/elife-98843-fig6-figsupp1-data2-v1.zip
-
Figure 6—figure supplement 1—source data 3
Original files for western blot analysis displayed in Figure 6—figure supplement 1.
- https://cdn.elifesciences.org/articles/98843/elife-98843-fig6-figsupp1-data3-v1.zip
Figure 7
A working model for the regulation of Srs2-mediated checkpoint dampening.
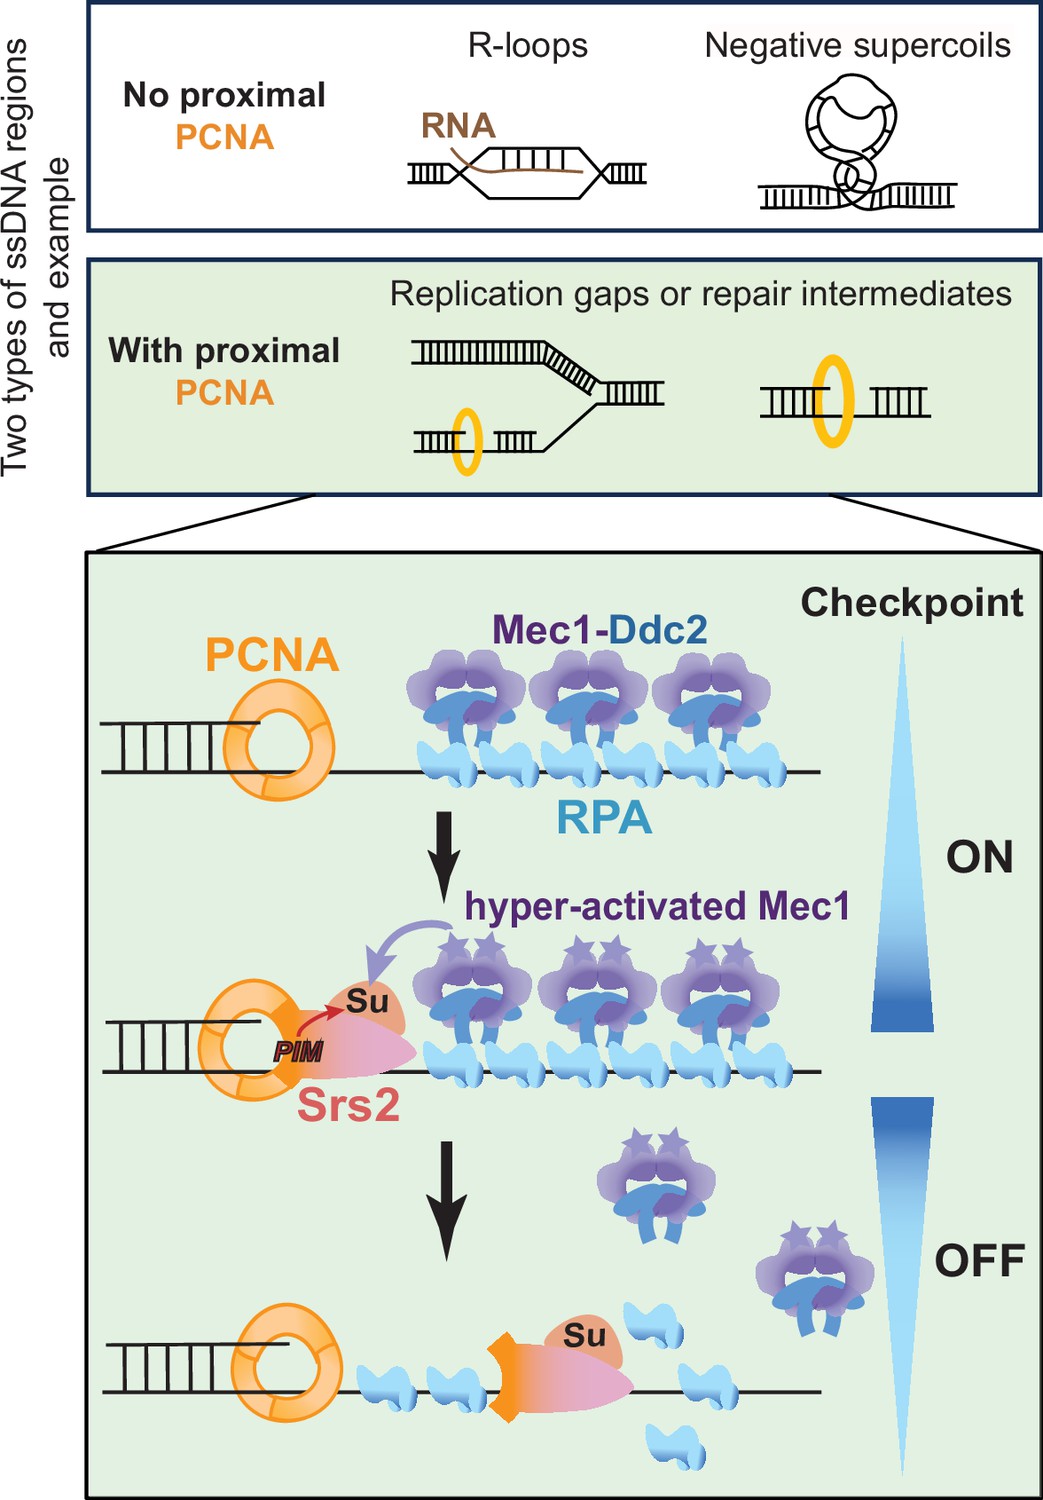
RPA-coated ssDNA regions generated from multiple DNA metabolic processes include those without proximal PCNA, such as ssDNA within R-loops and negatively supercoiled regions, and those with proximal PCNA, such as ssDNA gaps associated with perturbed DNA replication or repair. In latter situations, the resultant RPA-ssDNA can recruit the Mec1/Ddc2 kinase complex. Mec1 is subsequently activated by other DDC proteins, such as the 9-1-1 complex that demarcates the 5’ end junctions adjacent to ssDNA regions (not drawn). After DDC is activated for a prolonged period, Srs2 recruited to PCNA that demarcates the 3’ end junction flanking the ssDNA regions can be sumoylated. Srs2 sumoylation level increases as Mec1 activation heightens and can result in more efficient RPA removal, leading to Mec1 downregulation.
Appendix 1—figure 1
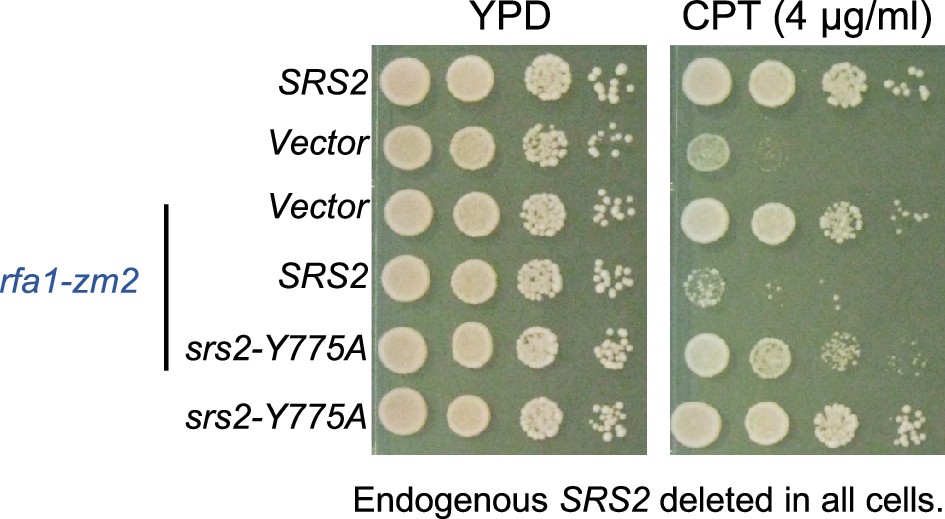
srs2-Y775A improves rfa1-zm2 mutant growth on CPT containing media.
Tables
Key resources table
| Reagent type (species) or resource | Designation | Source or reference | Identifiers | Additional information |
|---|---|---|---|---|
| Strain, strain background (Saccharomyces cerevisiae) | W303 | Lab stock | G16 | Strains are listed in Supplementary file 1, table 1 |
| Sequence-based reagent | gRNA sequence | IDT | N/A | Sequences are listed in Supplementary file 1, table 2 |
| Chemical compound, drug | Ni-NTA Agarose | QIAGEN | Cat# 30210 | |
| Chemical compound, drug | (S)- (+)-Camptothecin (CPT) | Sigma | Cat# C9911 | |
| Antibody | F9 anti-phosphorylated Rad53 (mouse polyclonal) | Pellicioli et al., 2001 | N/A | WB: 1:250 |
| Antibody | Anti-Rad9 (rabbit polyclonal) | Usui et al., 2009 | N/A | WB: 1:3000 |
| Antibody | Anti-Mec1-S1964-p (rabbit polyclonal) | Memisoglu et al., 2019 | N/A | WB: 1:500 |
| Antibody | Anti-Srs2 (goat polyclonal) | Santa Cruz (yC-18) | Cat# sc-11991; RRID:AB_672740 | WB: 1:1000 |
| Antibody | Anti-Pgk1 (mouse monoclonal) | Invitrogen (22C5D8) | Cat# 459250; RRID:AB_2532235 | WB: 1:8000 |
| Antibody | Anti-Myc | Thermo Fisher (9E10) | Cat# 13-2500; RRID:AB_2533008 | IP: 1 μg/ml |
| Peptide, recombinant protein | α factor | GenScript | Cat# RP01002 | |
| Peptide, recombinant protein | Pronase protease | Millipore | Cat# 53702 | |
| Commercial assay or kit | 4–20% precast polyacrylamide gel | Bio-Rad | Cat# 4561096 | |
| Commercial assay or kit | NuPAGE Tris-Acetate Mini Protein Gels, 3–8%, 1.0–1.5 mm | Thermo Fisher Invitrogen | Cat# EA03752 | |
| Commercial assay or kit | NuPAGE Tris-Acetate Mini Protein Gels, 7%, 1.0–1.5 mm | Thermo Fisher Invitrogen | Cat# EA03555 | |
| Software, algorithm | Prism 9.0 | GraphPad | RRID:SCR_002798 | |
| Software, algorithm | LAS-3000 imaging system | Fuji | N/A | |
| Software, algorithm | ImageJ | FiJi | RRID:SCR_002285 |
Additional files
-
Supplementary file 1
Yeast strains used in Appendix 1—figure 1.
- https://cdn.elifesciences.org/articles/98843/elife-98843-supp1-v1.docx
-
MDAR checklist
- https://cdn.elifesciences.org/articles/98843/elife-98843-mdarchecklist1-v1.docx
Download links
A two-part list of links to download the article, or parts of the article, in various formats.
Downloads (link to download the article as PDF)
Open citations (links to open the citations from this article in various online reference manager services)
Cite this article (links to download the citations from this article in formats compatible with various reference manager tools)
Srs2 binding to proliferating cell nuclear antigen (PCNA) and its sumoylation contribute to replication protein A (RPA) antagonism during the DNA damage response
eLife 13:RP98843.
https://doi.org/10.7554/eLife.98843.4


