Decoding phase separation of prion-like domains through data-driven scaling laws
- Department of Physics, University of Cambridge, United Kingdom
- Yusuf Hamied Department of Chemistry, University of Cambridge, United Kingdom
- Department of Physical Chemistry, Universidad Complutense de Madrid, Spain
- Department of Genetics, University of Cambridge, United Kingdom
- Department of Chemical and Biological Engineering, Princeton University, United States
- Omenn–Darling Bioengineering Institute, Princeton University, United States
Figures
Figure 1
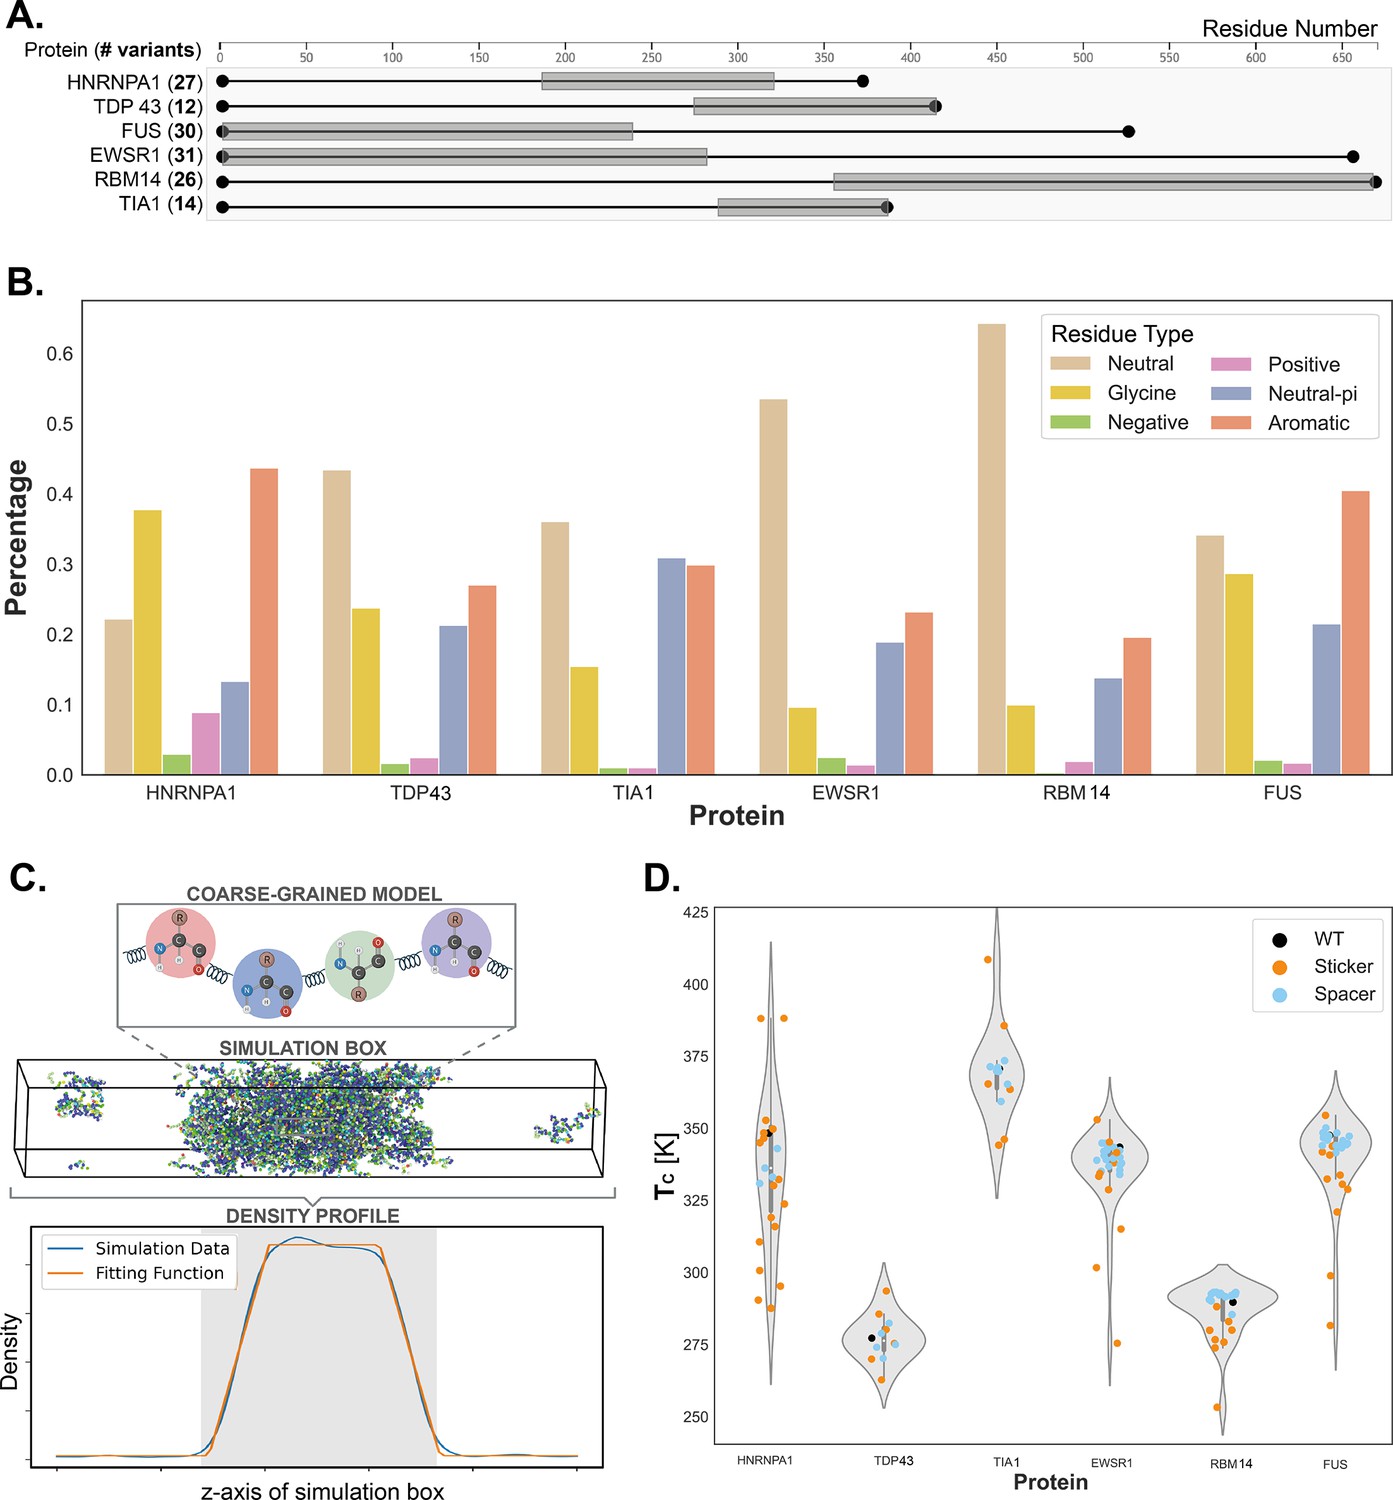
Generation and representation of dataset for probing scaling laws of prion-like low complexity domain (PLD) phase behavior.
(A) Representation of the prion-like domains (gray-shaded regions) of each considered protein, alongside the associated number of variants simulated, totaling a set of 140 sequences. (B) Composition of the wild-type sequence of the PLDs simulated, in terms of the percentage of neutral amino acids (Ala, Cys, Ile, Leu, Met, Pro, Ser, Thr, and Val; no net charge at pH 7 and no π electrons in the side chain), glycine (Gly), negative (Asp, Glu), positive (Lys, His, Arg), neutral–π (Asn and Gln; no net charge at pH 7 with π electrons in the side chain), and aromatic (Phe, Trp, Tyr) residues. (C) Top panel: Representation of the simulation model: each amino acid of the protein is represented by a single bead, bonded interactions are modeled with springs, and non-bounded interactions are modeled with a combination of the Wang–Frenkel potential and a Coulomb term with Debye–Hückel screening. Middle panel: The Direct Coexistence simulation method, in the slab geometry, is employed, where both the protein-rich and protein-depleted phases are simulated simultaneously. Bottom panel: Finally, to obtain the data point in the concentration–temperature phase space, at a given temperature the density profile is computed, and the concentrations of the rich and depleted phases are obtained via a suitable fitting (see Methods). (D) Representation of the entire computational dataset. Orange data points represent variants where charged or aromatic residues were mutated (i.e. stickers), while cyan data points represent all other types of mutations studied (i.e. spacers).
Figure 2
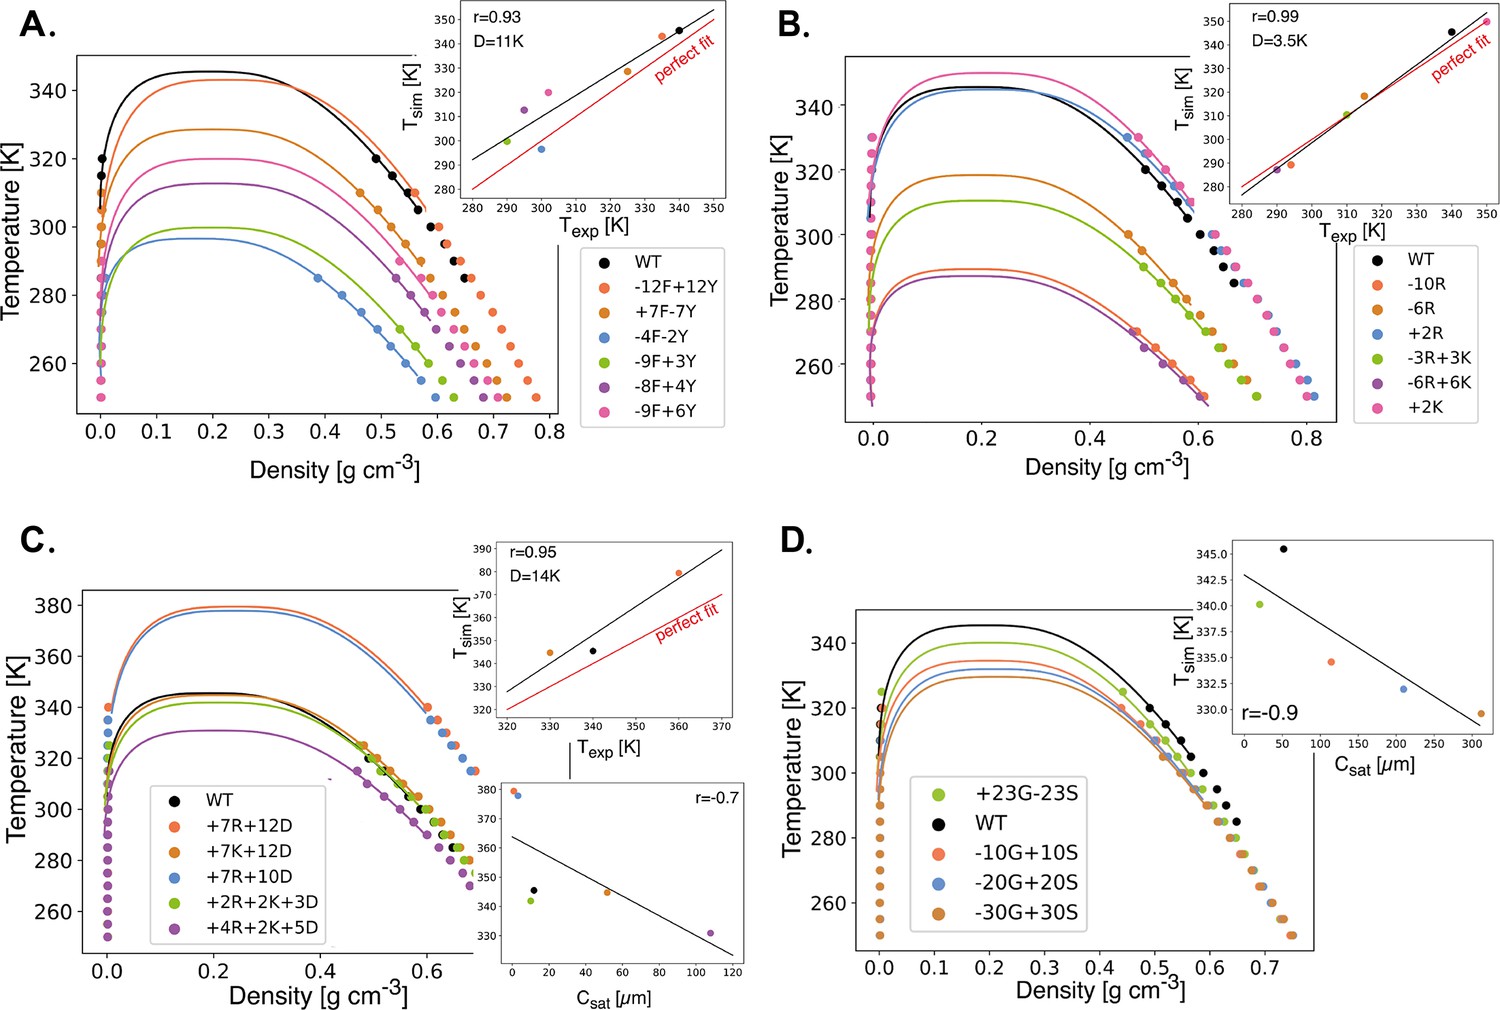
Mpipi model quantitatively captures phase behavior for a large set of heterogeneous nuclear ribonucleoprotein A1 (hnRNPA1) prion-like low complexity domain (PLD) mutants.
Mutations are divided into (A) aromatic, (B) Arg/Lys, (C) charged, and (D) Gly/Ser sequence variants of the PLD of the protein hnRNPA1, and compared with experimental results. The hnRNPA1 PLD was used to validate the accuracy of the model, by extracting critical temperatures from experimental phase diagrams of a large set of these variants (Bremer et al., 2022). To assess how well the Mpipi model performed for PLDs, we compared critical temperatures obtained from simulations with the corresponding ones extracted from the experimental data for those variants that were available (depicted in the top right of each binodal, where r is the Pearson coefficient and D is the root mean square deviation between simulated and experimental values). For the variants where the experimental critical temperature could not be determined, we make a comparison between the critical temperature with the saturation concentration, since for these systems we expect them to be inversely correlated. The naming system for the variants is discussed in detail in the text.
Figure 3
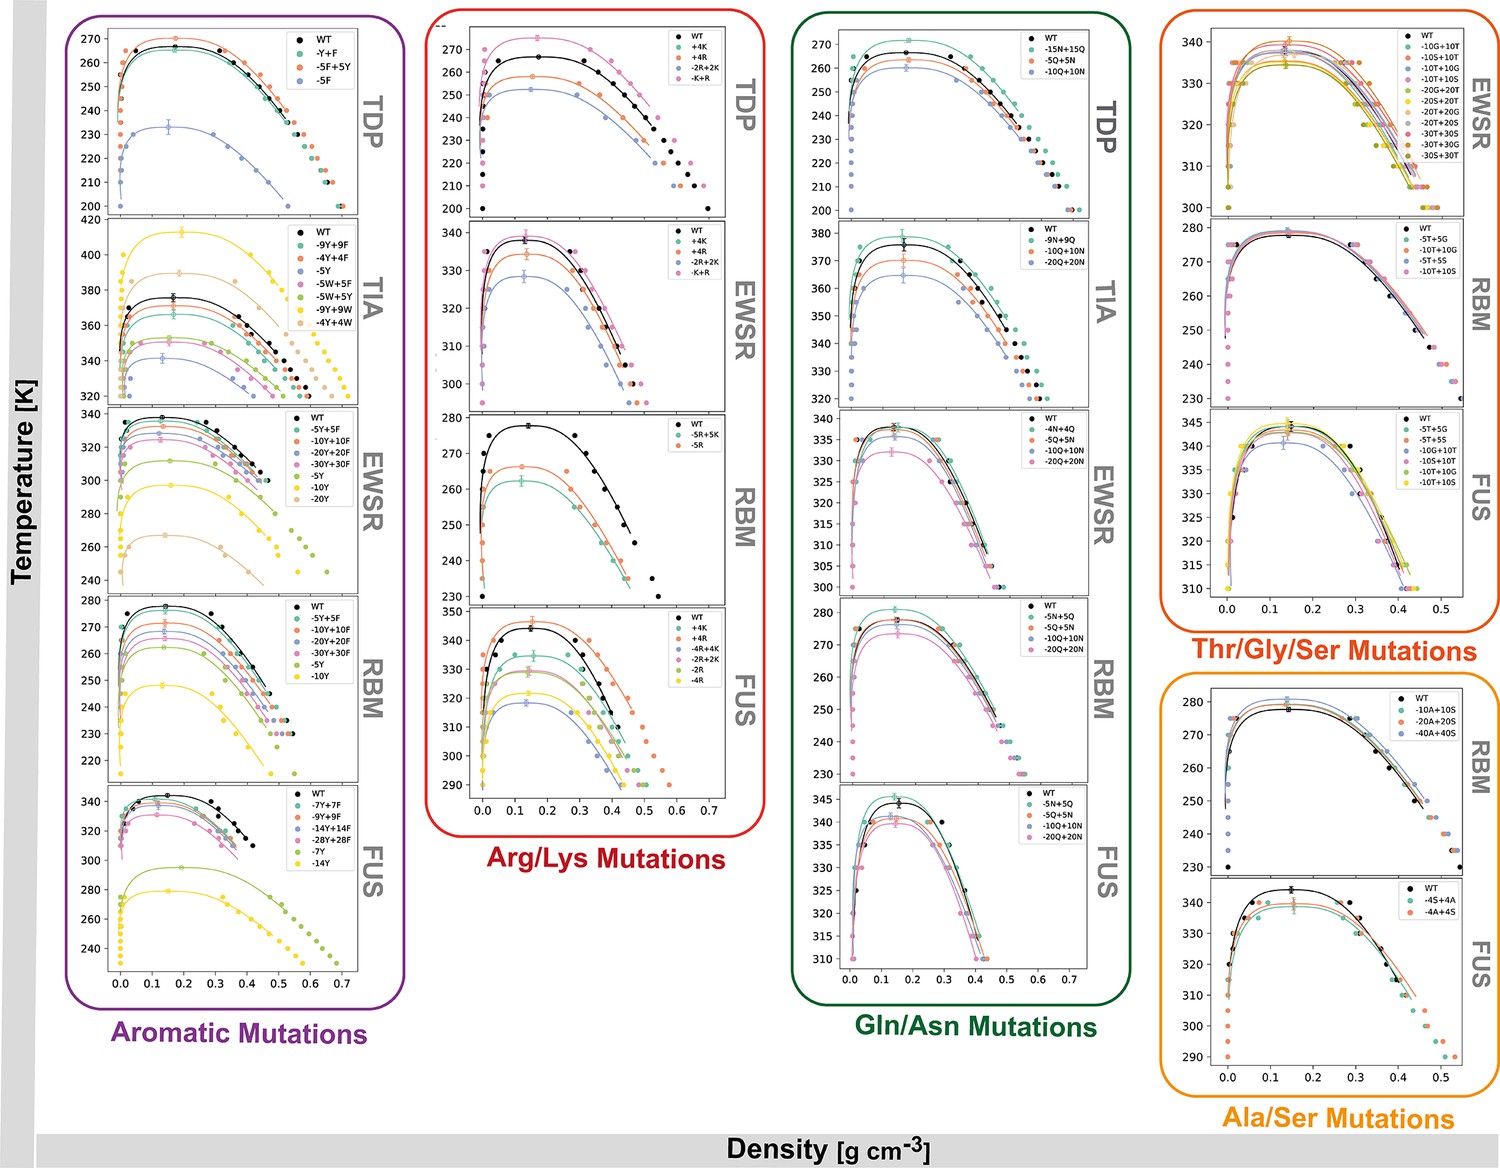
Complete set of 140 binodals, in the temperature versus density phase space, generated via large-scale molecular dynamics simulations.
Binodals are grouped according to the mutation type (Aromatic, Arg/Lys, Gln/Asn (Polar), Ala/Ser and Thr/Gly/Ser (Neutral)). Each set is further grouped based on the prion-like low complexity domain (PLD) in question. The error shown in the fitted critical temperature corresponds to the uncertainty of the fit.
Figure 4
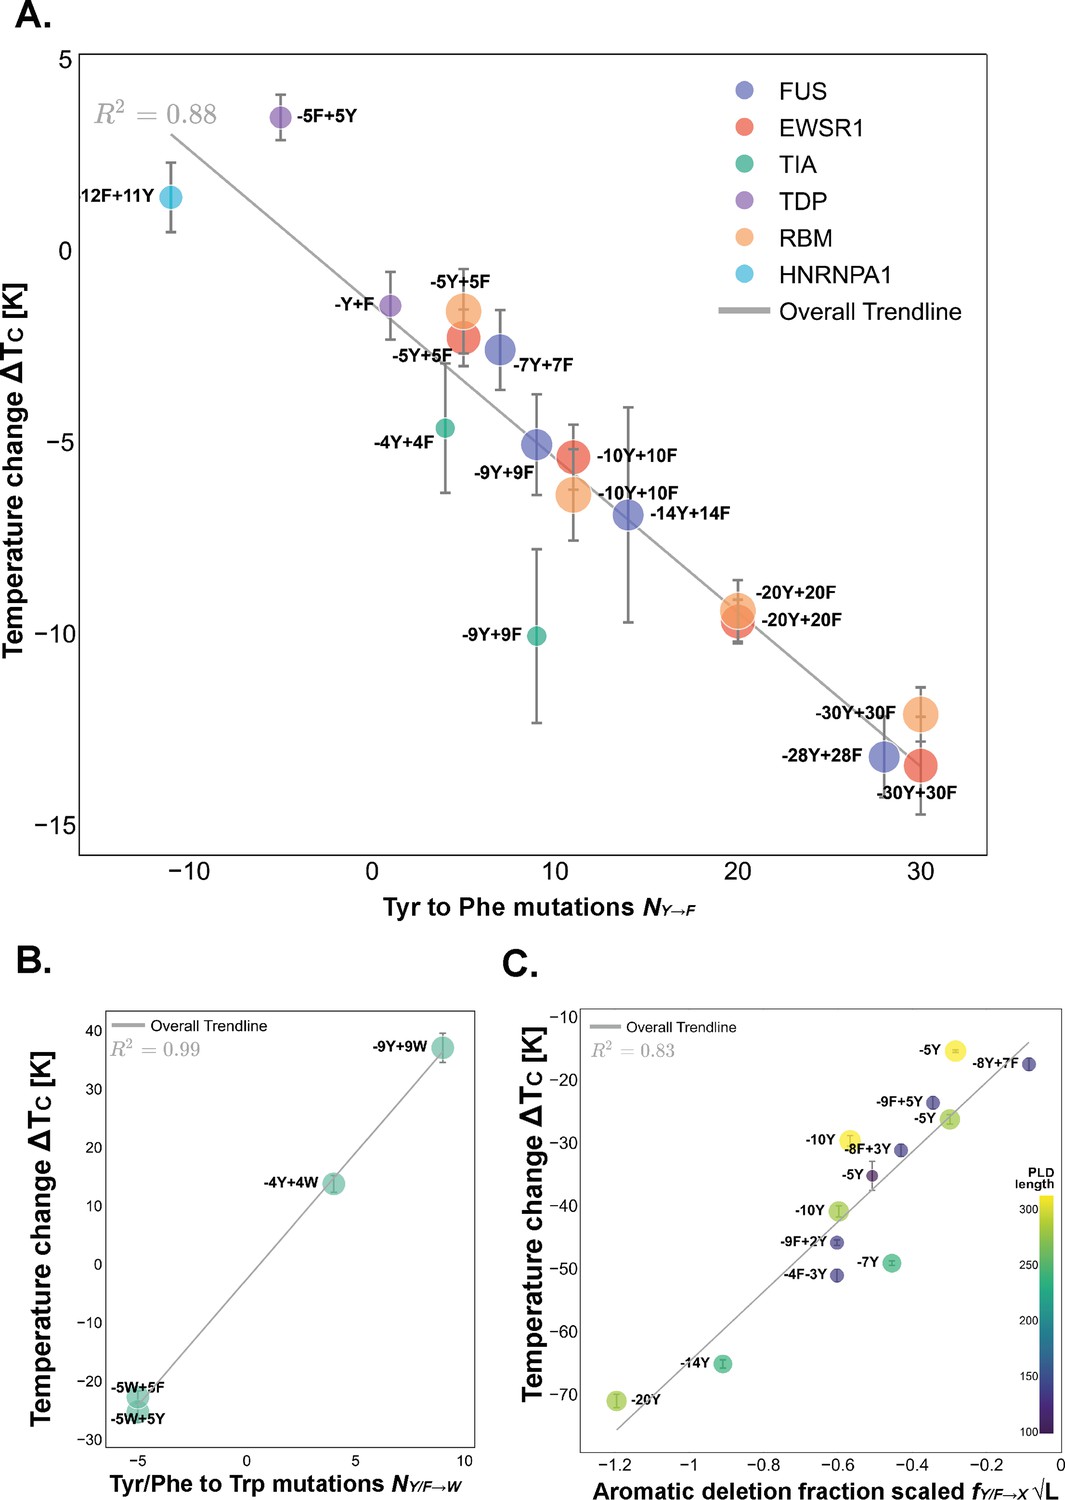
Mutations in aromatic amino acids have strong effects on the critical solution temperature of prion-like low complexity domains (PLDs).
(A) Tyr to Phe mutations. The number of Tyr mutated to Phe (x-axis) versus the change in critical temperature, (y-axis), computed as the critical temperature of the variant minus that of the corresponding PLD wild-type sequence. The trendline defines the simplest, dominating scaling law for this mutation. The value of 0.88 shows the agreement of our data to the scaling law defined by Equation 4. Errors in critical temperature are computed via error propagation, considering the uncertainty of the binodal fit. (B) Tyr or Phe to Trp mutations. In this case, the overall trendline, defined by Equation 5 has a of 0.99. (C) Analysis of the variants involving mutations of aromatic residues to uncharged, non-aromatic amino acids, a.k.a. aromatic deletions. In the y-axis, the change in the critical temperature of the variant to that of the wild-type sequence, and in the x-axis, a renormalized measure of mutations: the fraction of aromatic residues mutated times the , to account for the competing physical interactions between PLDs. Error bars indicate the standard error associated with replicas of the simulation.
Figure 5
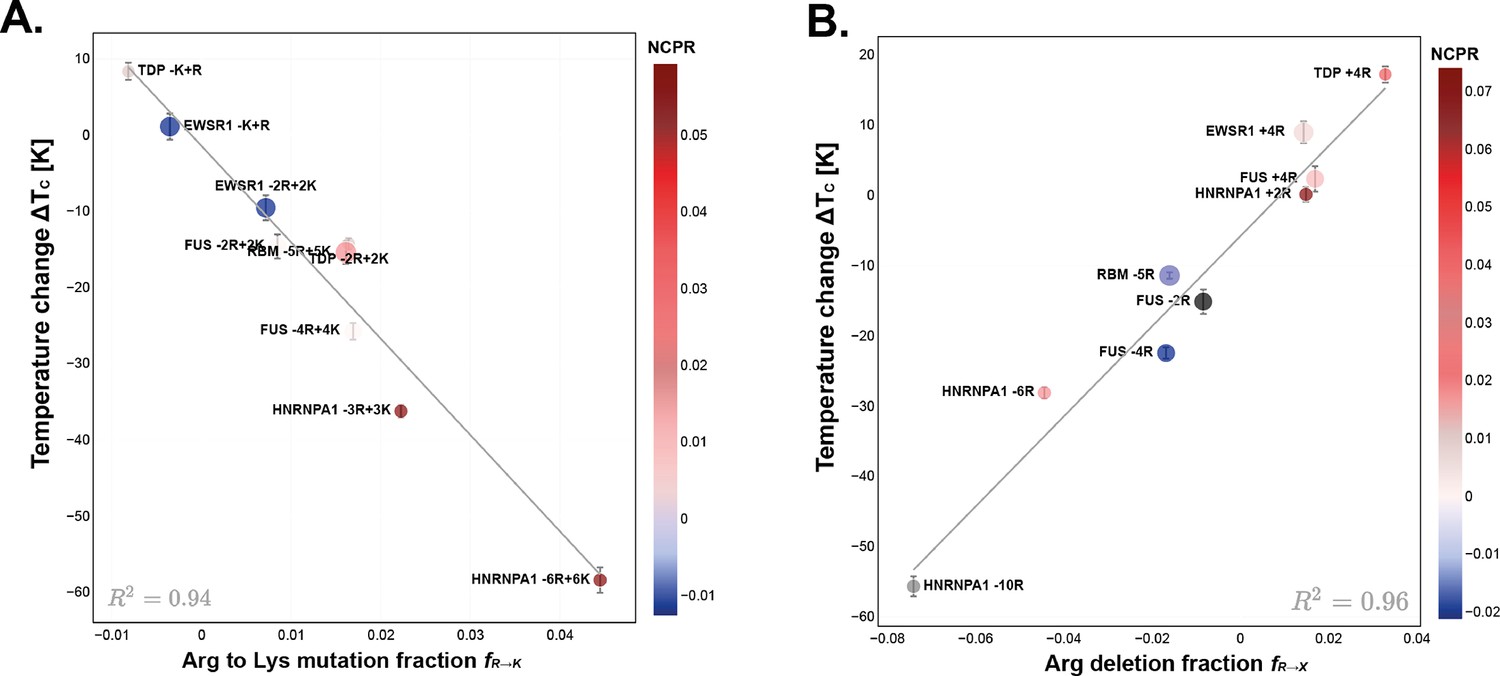
Effects of Arg mutations on the phase transition temperature of prion-like low complexity domains (PLDs).
(A) Analysis of the critical solution temperature of PLDs with Arg to Lys mutations. The number of Arg to Lys mutations divided by PLD length (x-axis) versus the change in the critical solution temperature, that is, (y-axis). The trendline, representing Equation 7, fits the data with a , and defines the stability measure of this perturbation. (B) Analysis of the critical solution temperature of PLDs with Arg mutations to uncharged, non-aromatic amino acids that maintain the wild-type (WT) compositional percentages (mainly Gly, Ser, and Ala). For more details see Appendix 1. Arg deletion fraction (x-axis) versus (y-axis). The trendline, which fits the data with , defines the stability measure, represented in Equation 8.
Figure 6
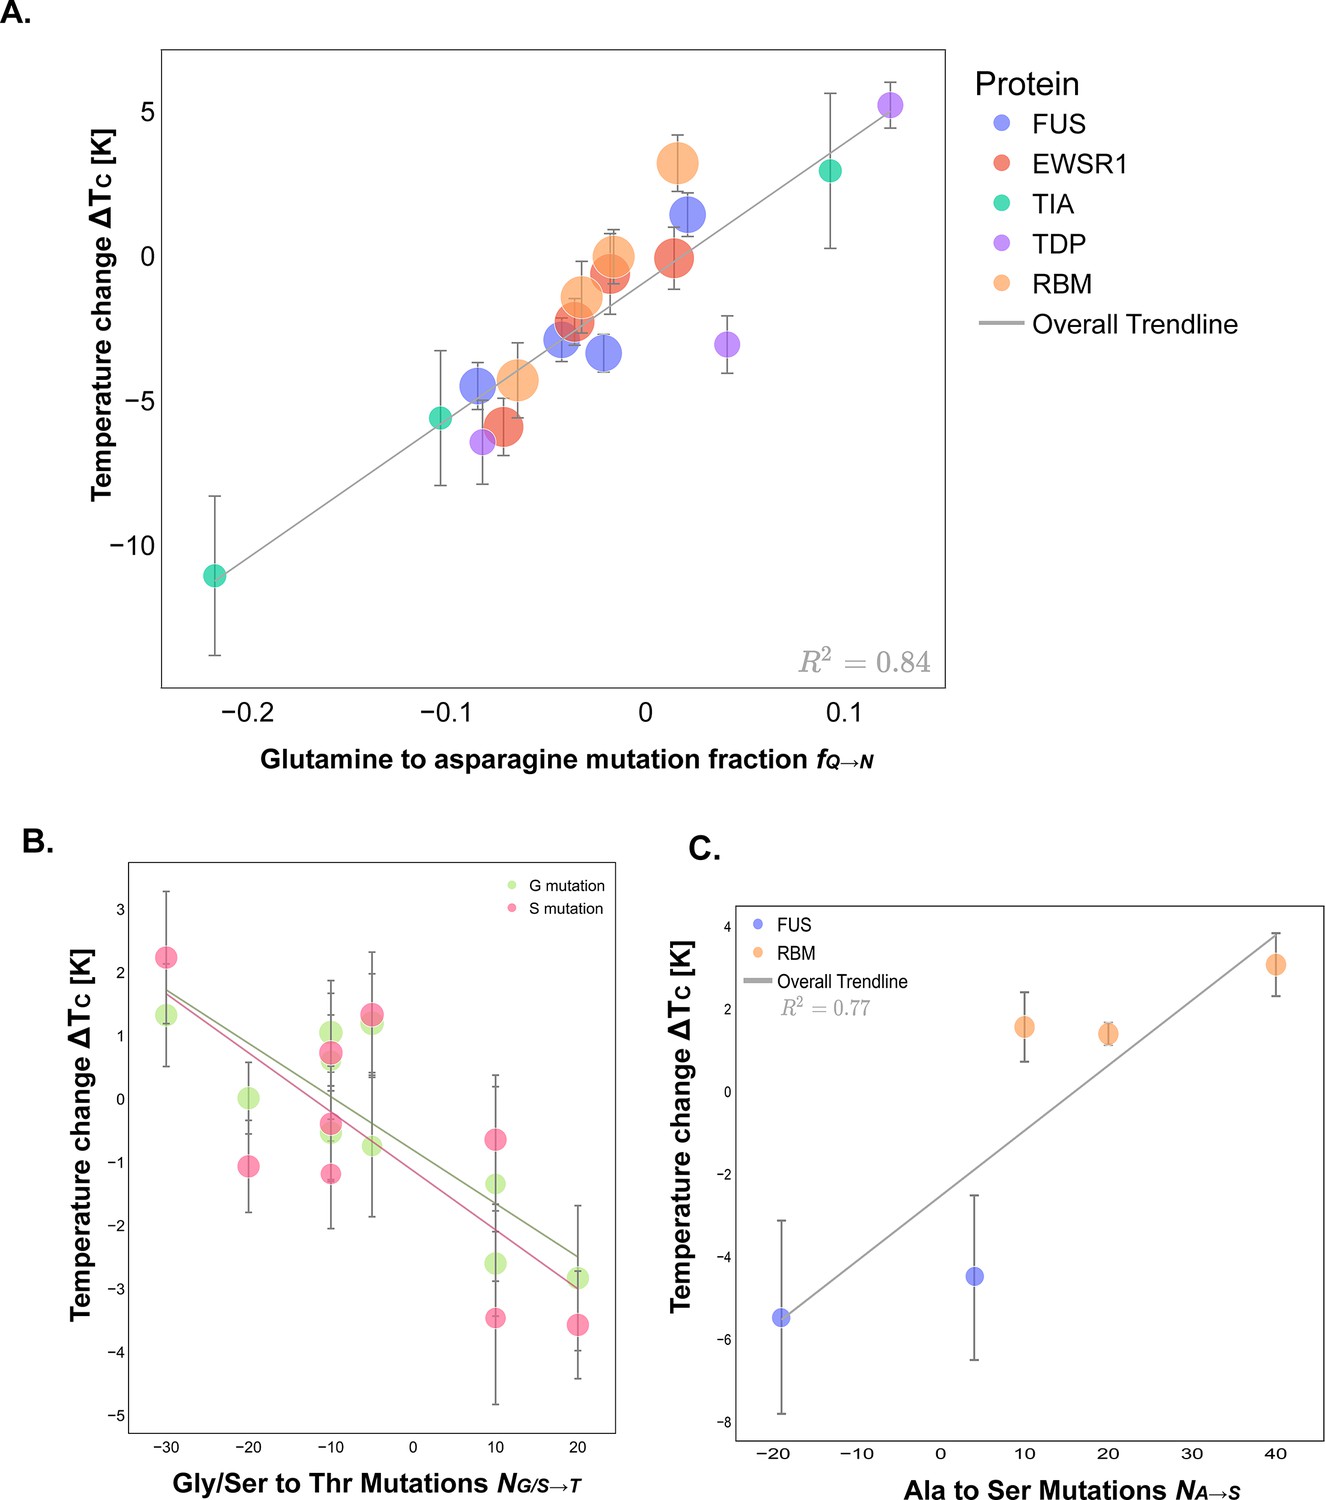
Polar and neutral amino acid mutations show subtle modulation of the critical solution temperatures of prion-like low complexity domains (PLDs).
(A) Analysis of the critical solution temperature of PLDs with Asn to Gln mutations. The number of Gln to Asn mutations renormalized by dividing by PLD length (x-axis) versus the temperature change (y-axis). The trendline, which fits the data with a , fits the scaling law in Equation 9. (B) Analysis of the critical solution temperature of PLDs with Gly/Ser to Thr mutations (x-axis) versus the temperature change (y-axis). The trendlines, representing Equations 10 and 11, fit the data with a . (C) The number of Ala to Ser mutations (x-axis) versus the temperature change . The trendline, Equation 12, fits the data with a .
Figure 7
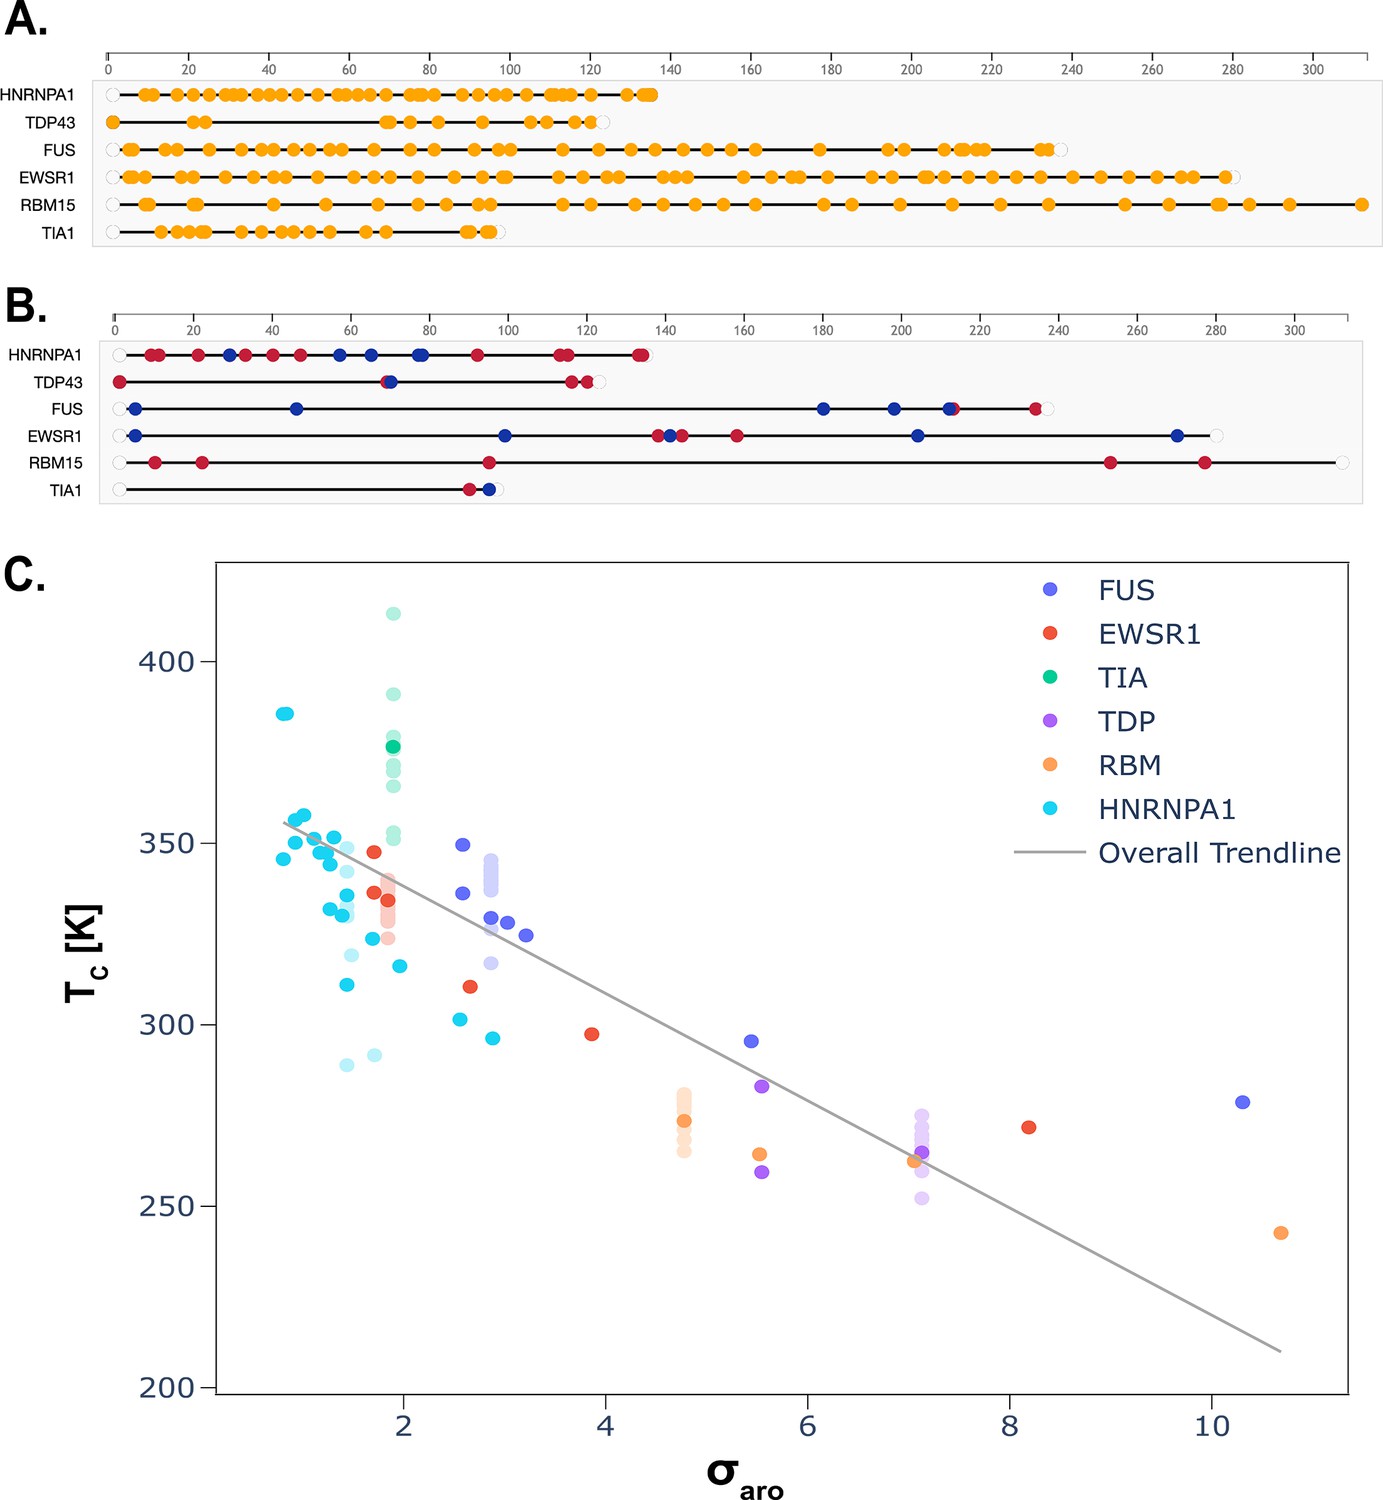
Prion-like domains featuring sequences with dispersed aromatic residues show greater propensities for phase separation.
(A) Representation of the aromatic amino acids present in the wild-type sequences of each prion-like low complexity domain (PLD) considered. (B) Location of the positively charged (red) and negatively charged (blue) amino acids present in the wild-type sequences of each PLD considered. (C) Analysis of the critical solution temperature versus the order parameter, defined in Equation 13. Those groups of variants with the same value show their average critical temperature highlighted, with lighter symbols for other data points. For lower values of , the critical solution temperature is higher, and vice versa, indicating that those variants with a more homogeneous distribution of aromatic amino acids have condensates that are stable at higher temperatures.
Appendix 1—figure 1
Designed variants of RBM14 prion-like low complexity domain (PLD).
Appendix 1—figure 2
Designed variants of TDP43 prion-like low complexity domain (PLD).
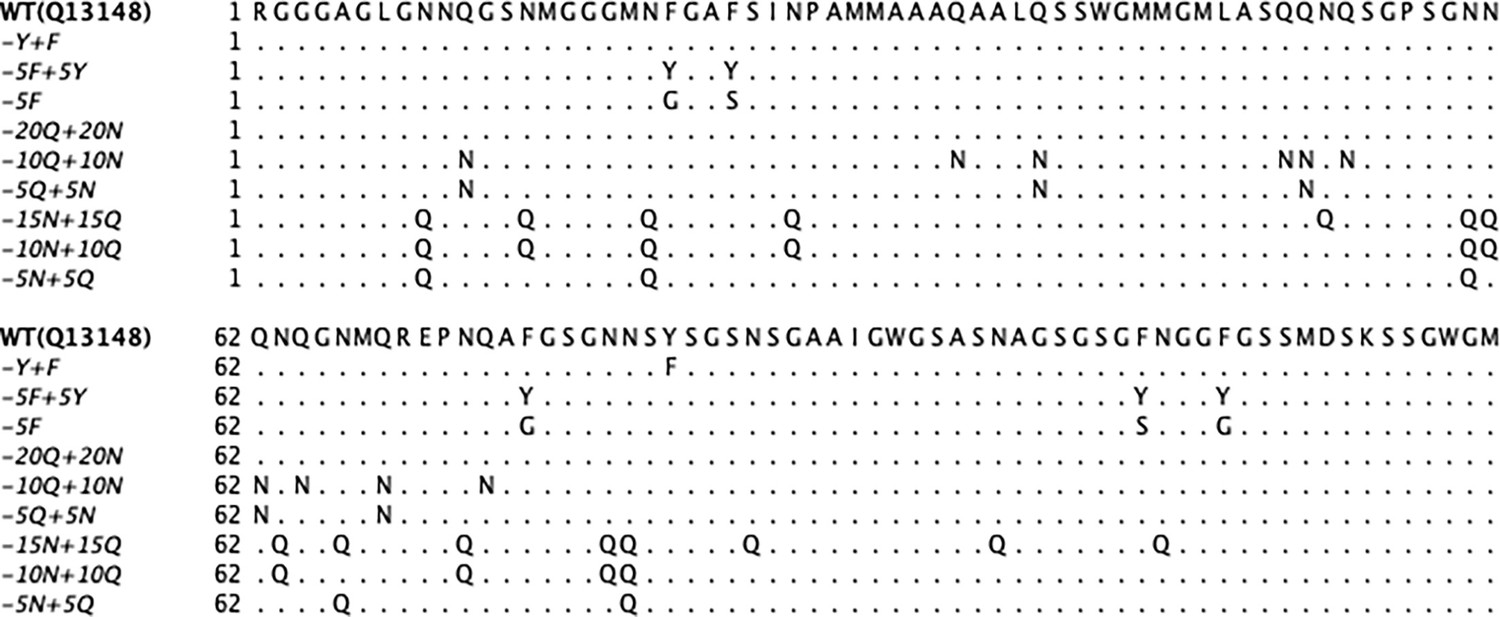
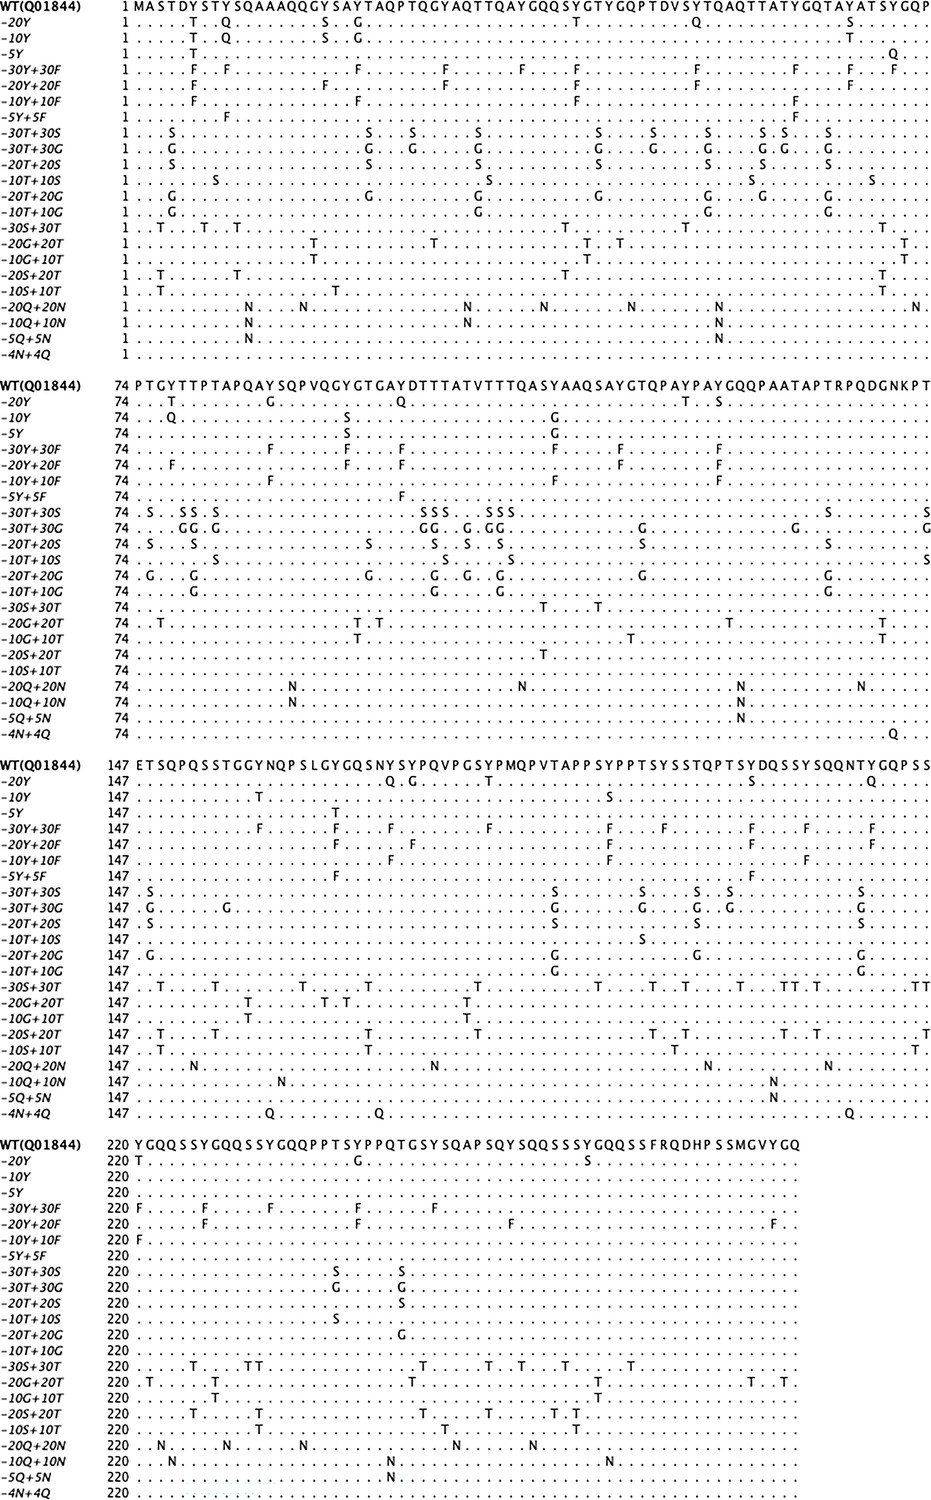
Appendix 1—figure 3
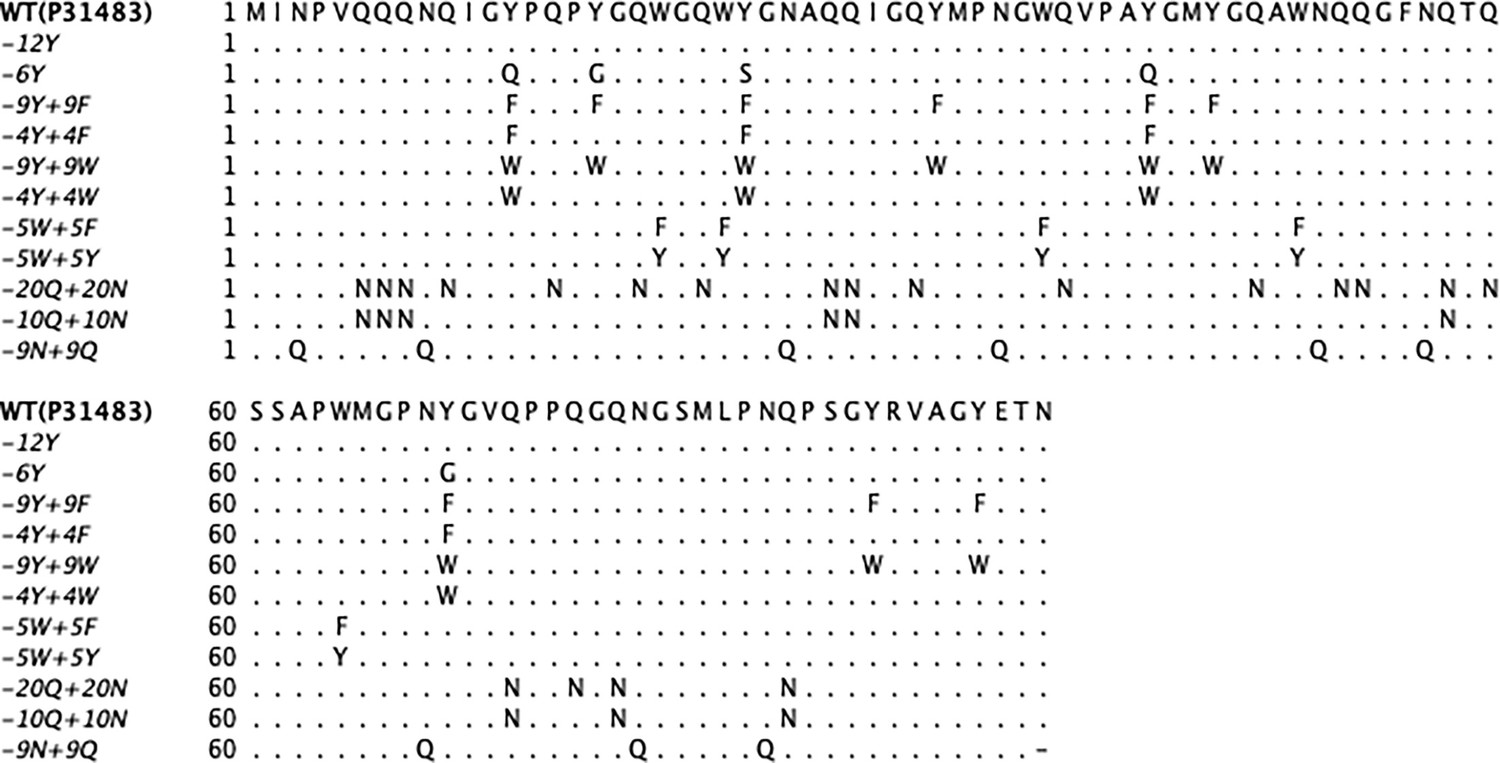
Designed variants of TIA1 prion-like low complexity domain (PLD).
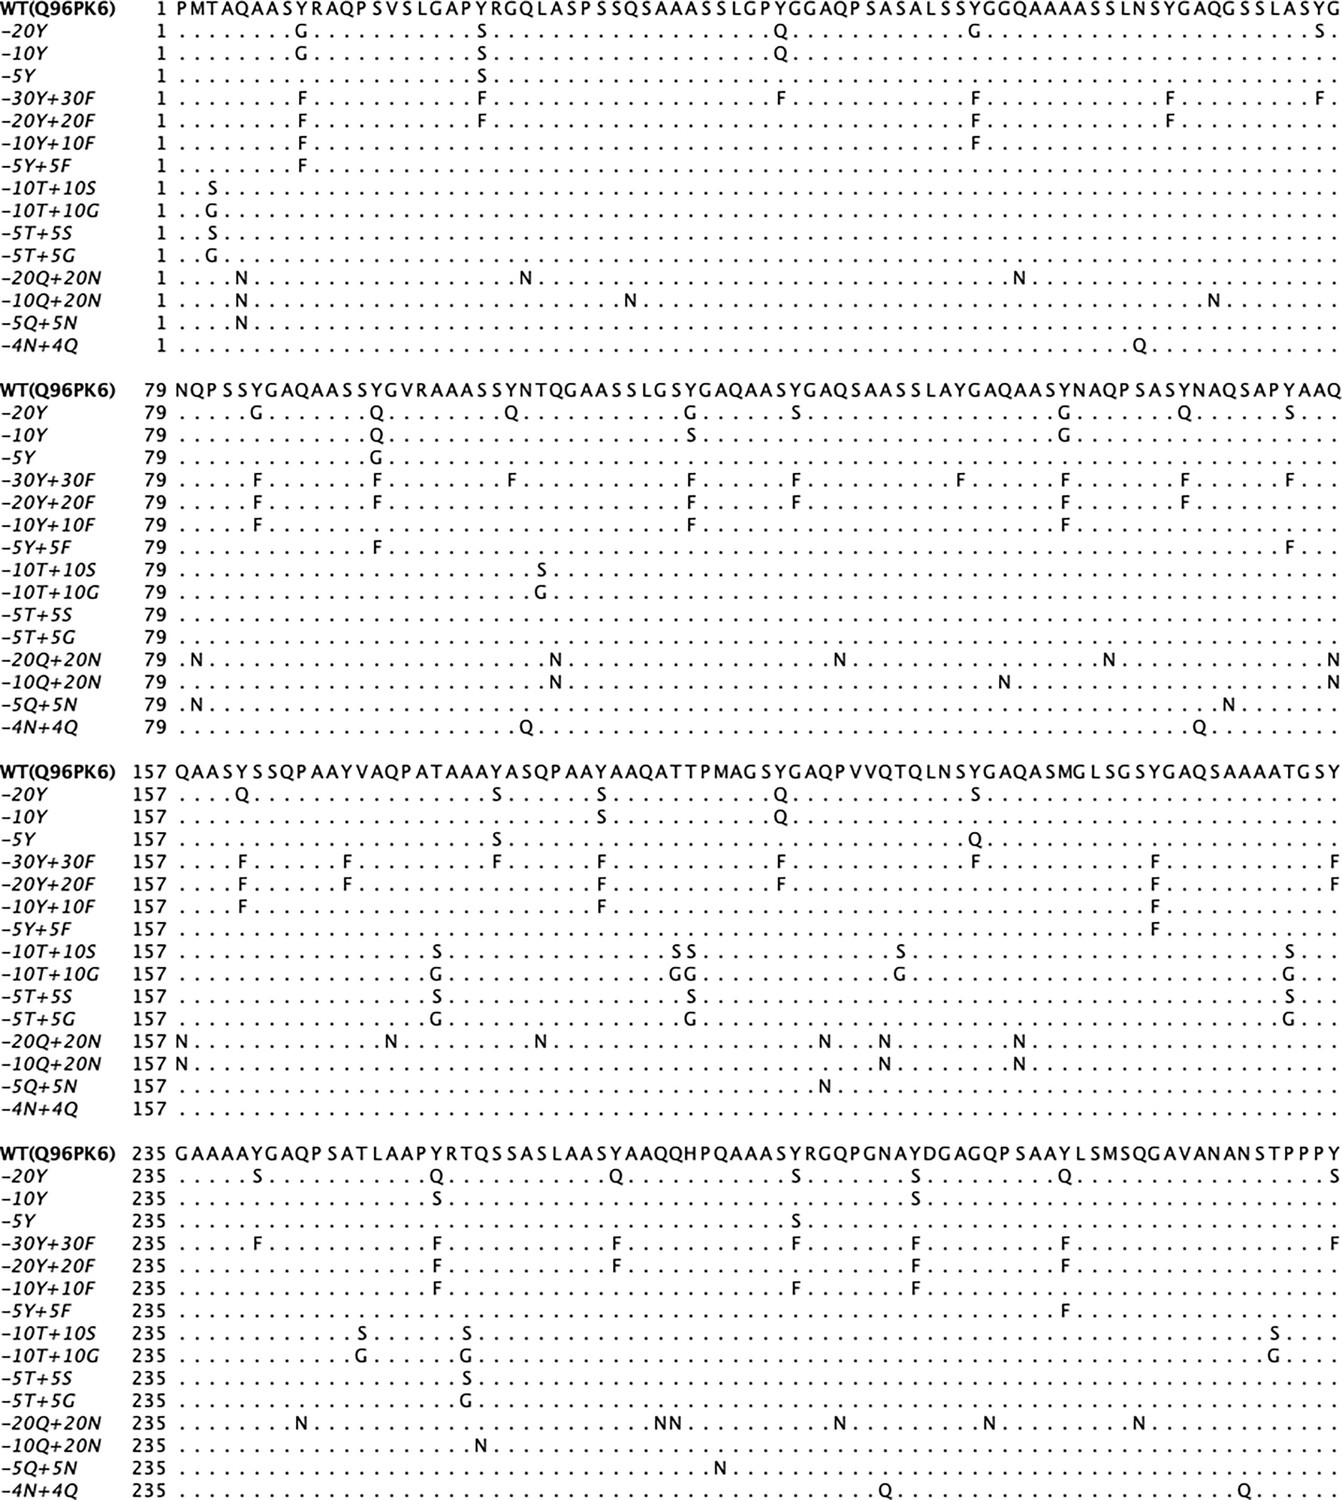
Appendix 1—figure 4
Designed variants of Fused in Sarcoma (FUS) prion-like low complexity domain (PLD).
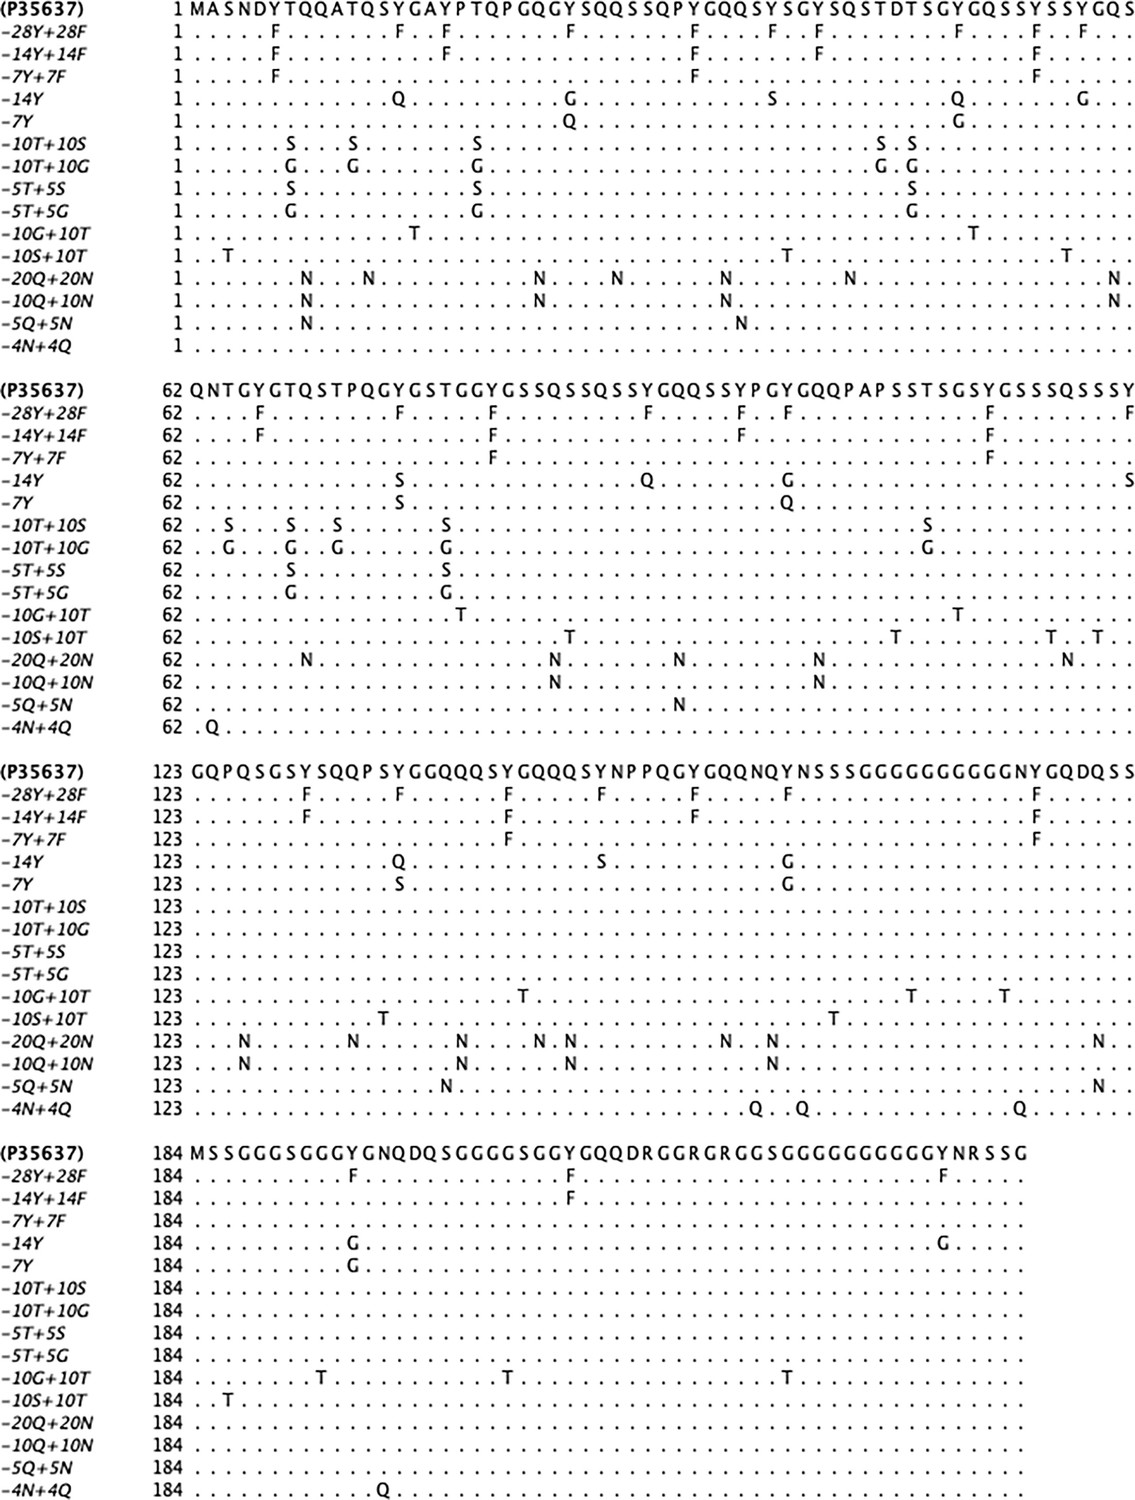
Appendix 1—figure 5
Designed variants of EWSR1 prion-like low complexity domain (PLD).
Appendix 1—figure 6
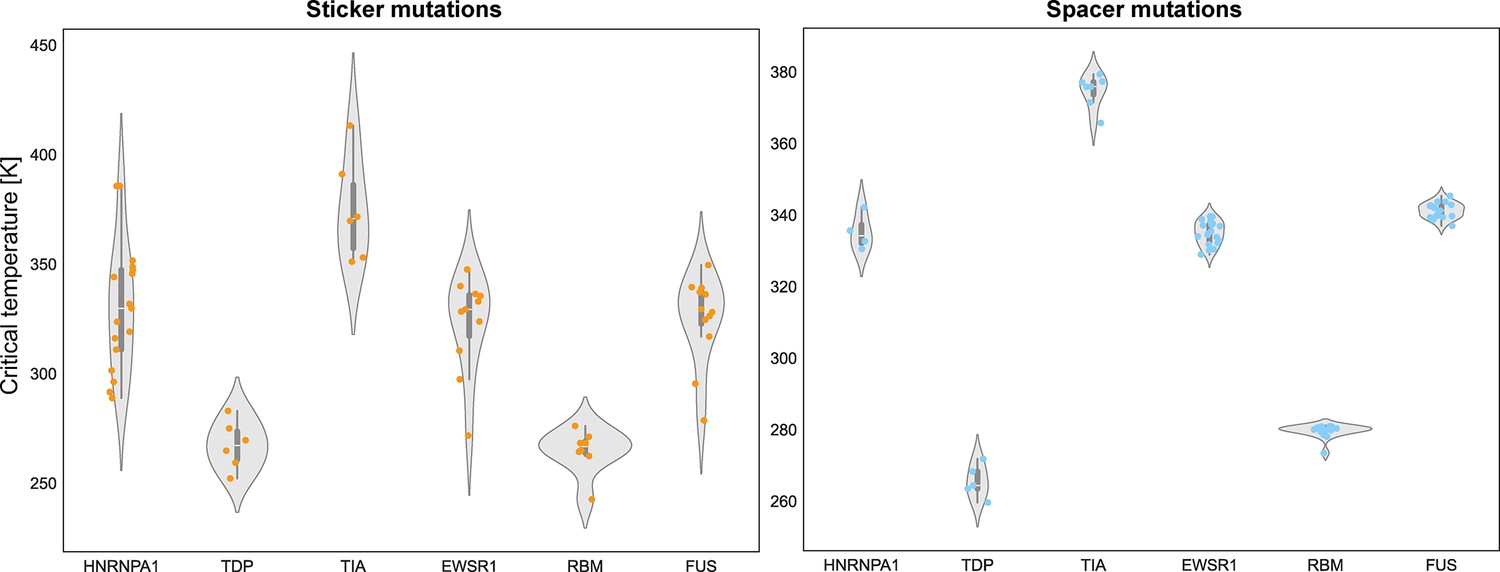
Representation of the entire computational data set, divided into mutations on ‘sticker’ or ‘spacer’ residues.
Orange data points, on the left, represent variants where charged or aromatic residues were mutated (i.e. stickers), while cyan data points, on the right, represent all other types of mutations studied (i.e. spacers).
Appendix 1—figure 7
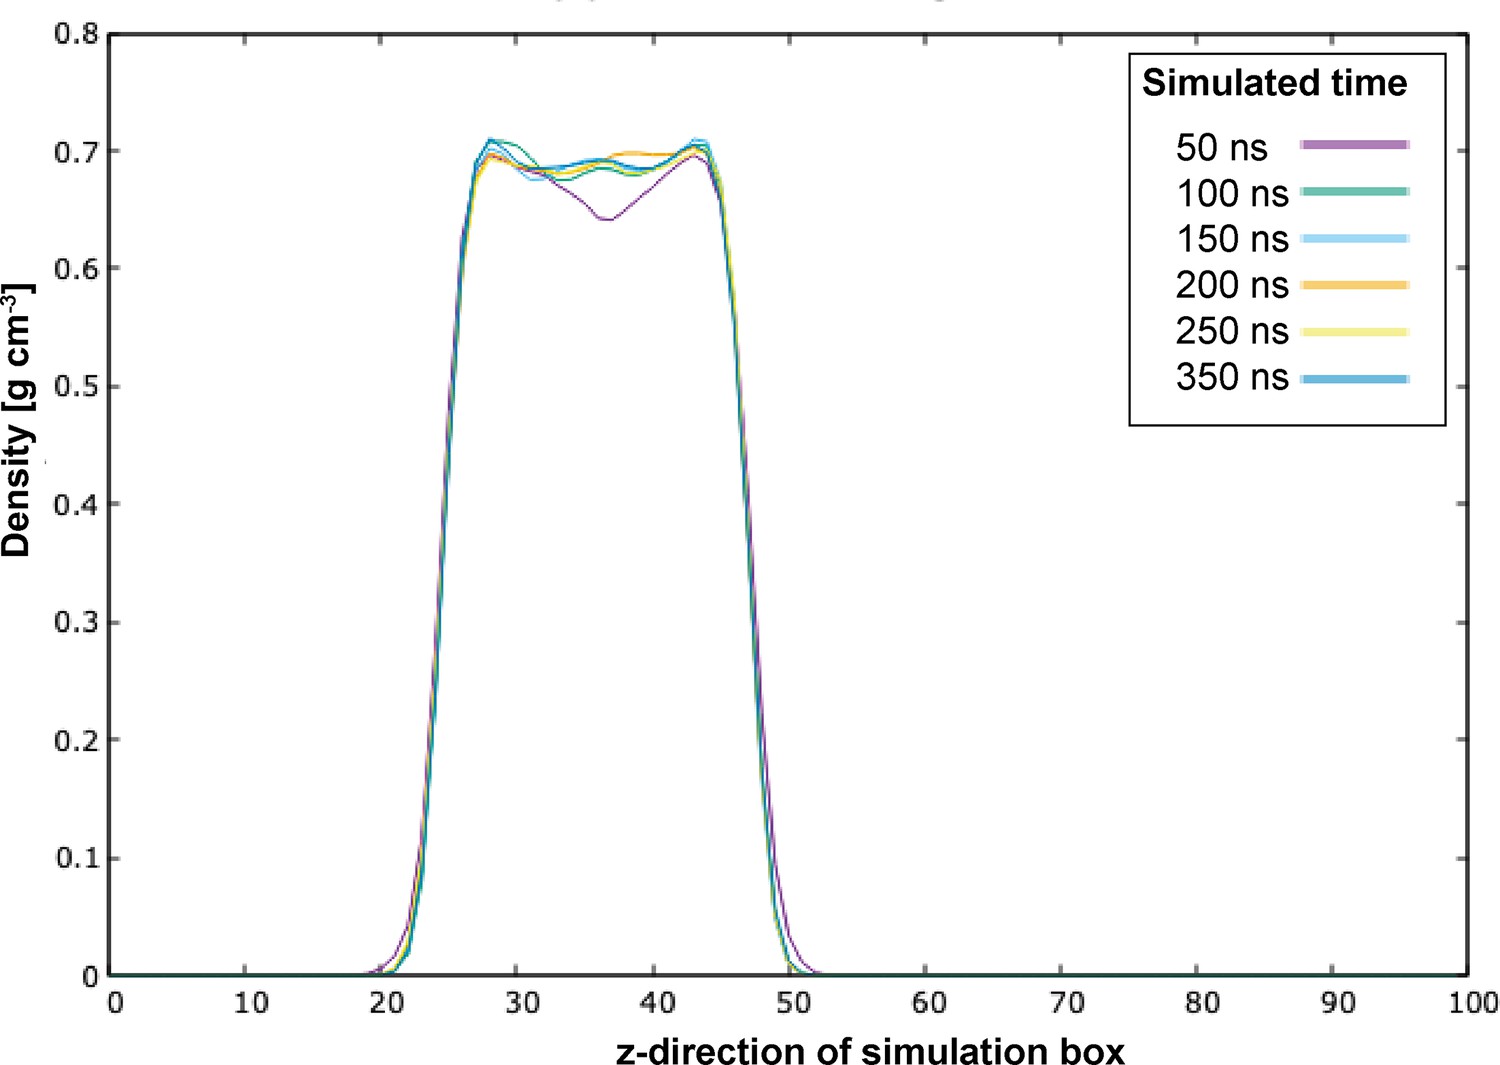
Convergence tests for the wild-type (WT) sequence of the prion-like low complexity domain (PLD) of Fused in Sarcoma (FUS).
The density profiles of different and independent simulations are plotted across the perpendicular axis to the condensate interfaces. Each simulation was performed for different timescales (as specified in the legend) to check for proper convergence.
Appendix 1—figure 8
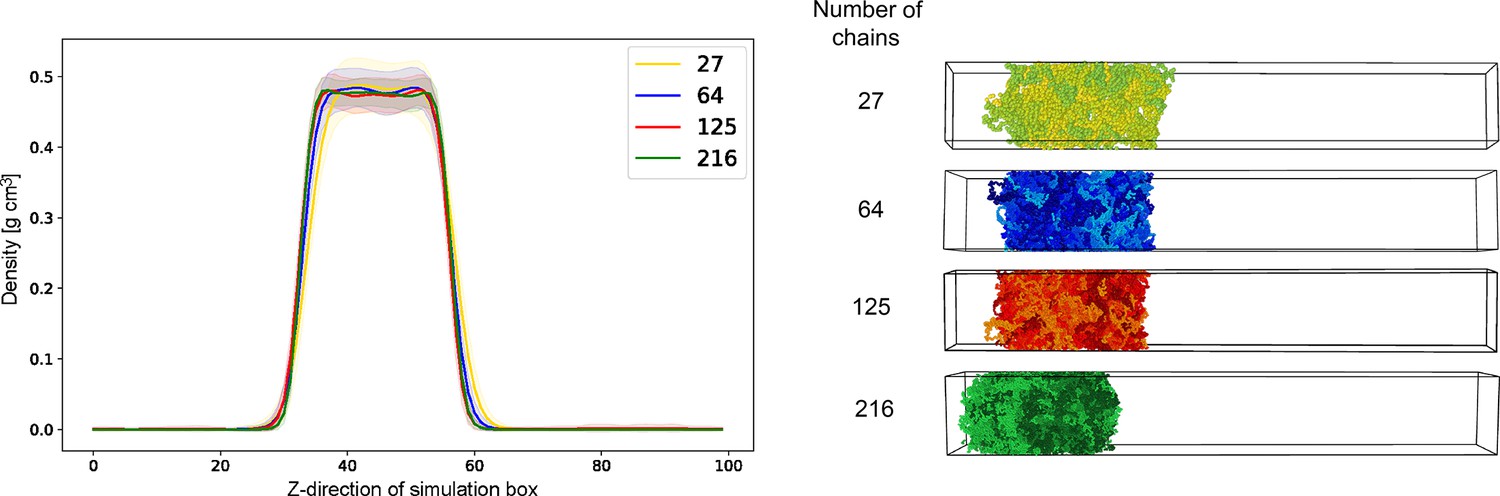
Finite-size scaling for the wild-type (WT) sequence of the prion-like low complexity domain (PLD) of Fused in Sarcoma (FUS).
The density profiles of different and independent simulations are plotted across the perpendicular axis to the condensate interfaces. Each simulation was performed for different system sizes (aka, number of chains and corresponding box size, as specified in the legend) to check for proper convergence. To the right, a representation of the systems of increasing numbers of chains we employed to check for convergence. In each case, the overall density of the box is kept constant, while the cross-section and length are varied in order to maintain a constant density. For 27 chains, the box dimensions are 109×109×765 Å; for 64 chains 145×145×1021 Å; for 125 chains 182×182×1276 Å and for the final case of 216×218×218×1531 Å.
Appendix 1—figure 9
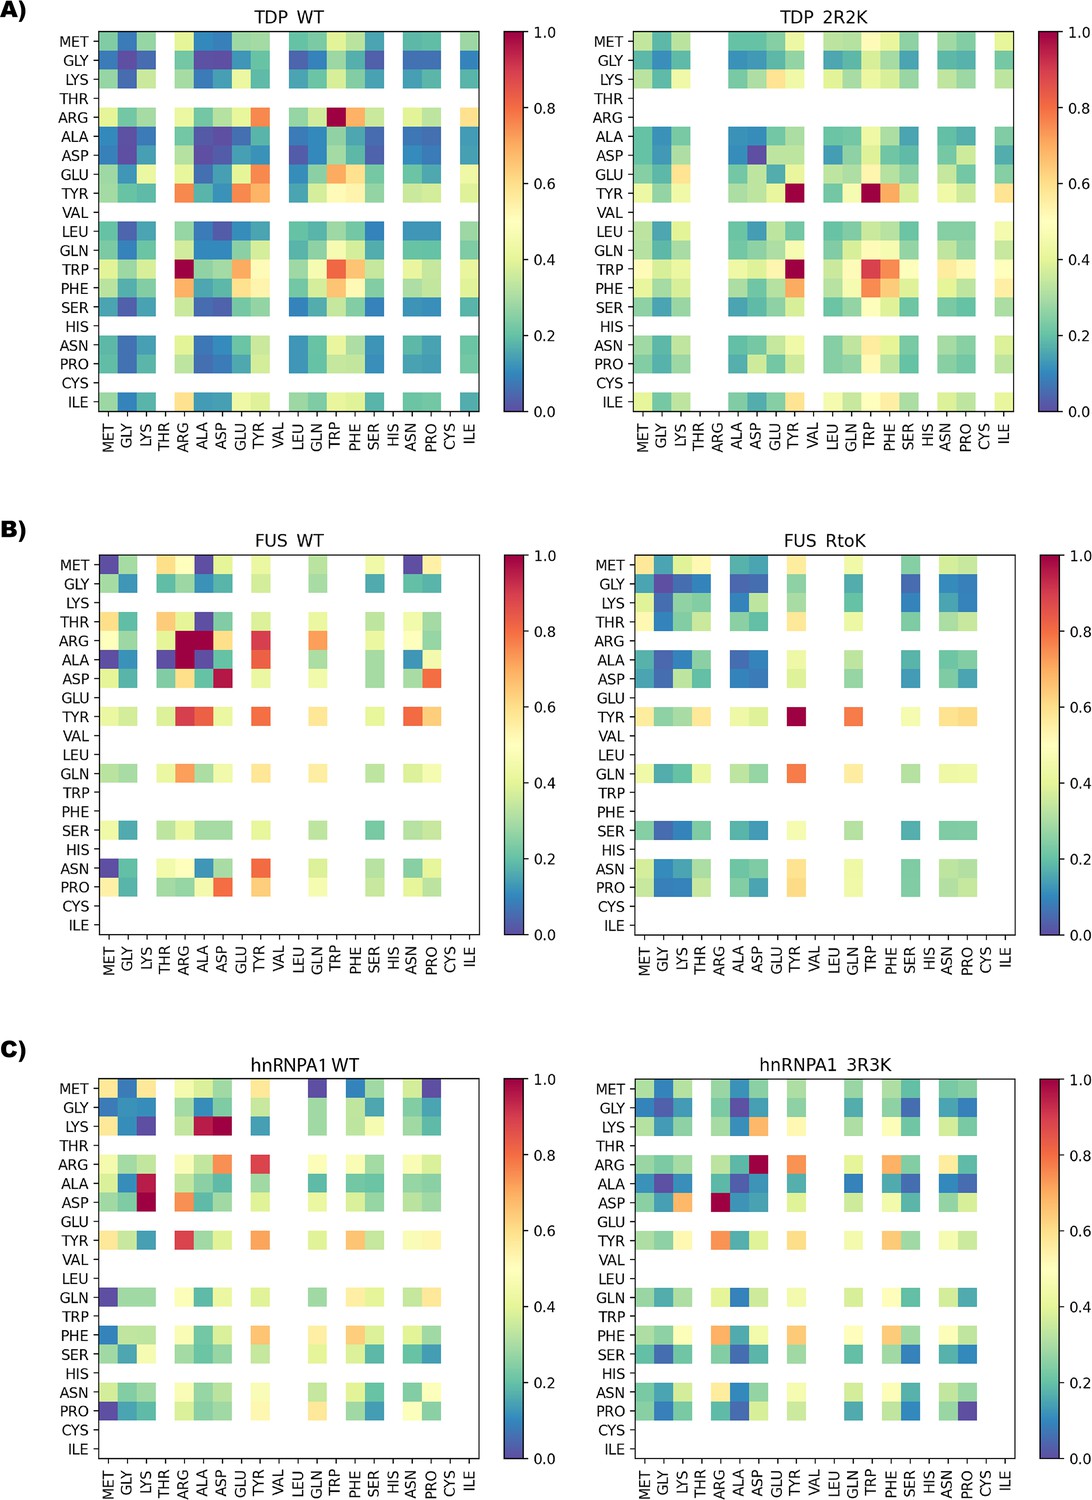
Normalized contact maps of different R to K variants of prion-like low complexity domains (PLDs): (A) TDP43 (B) Fused in Sarcoma (FUS), (C) heterogeneous nuclear ribonucleoprotein A1 (hnRNPA1).
Appendix 1—figure 10
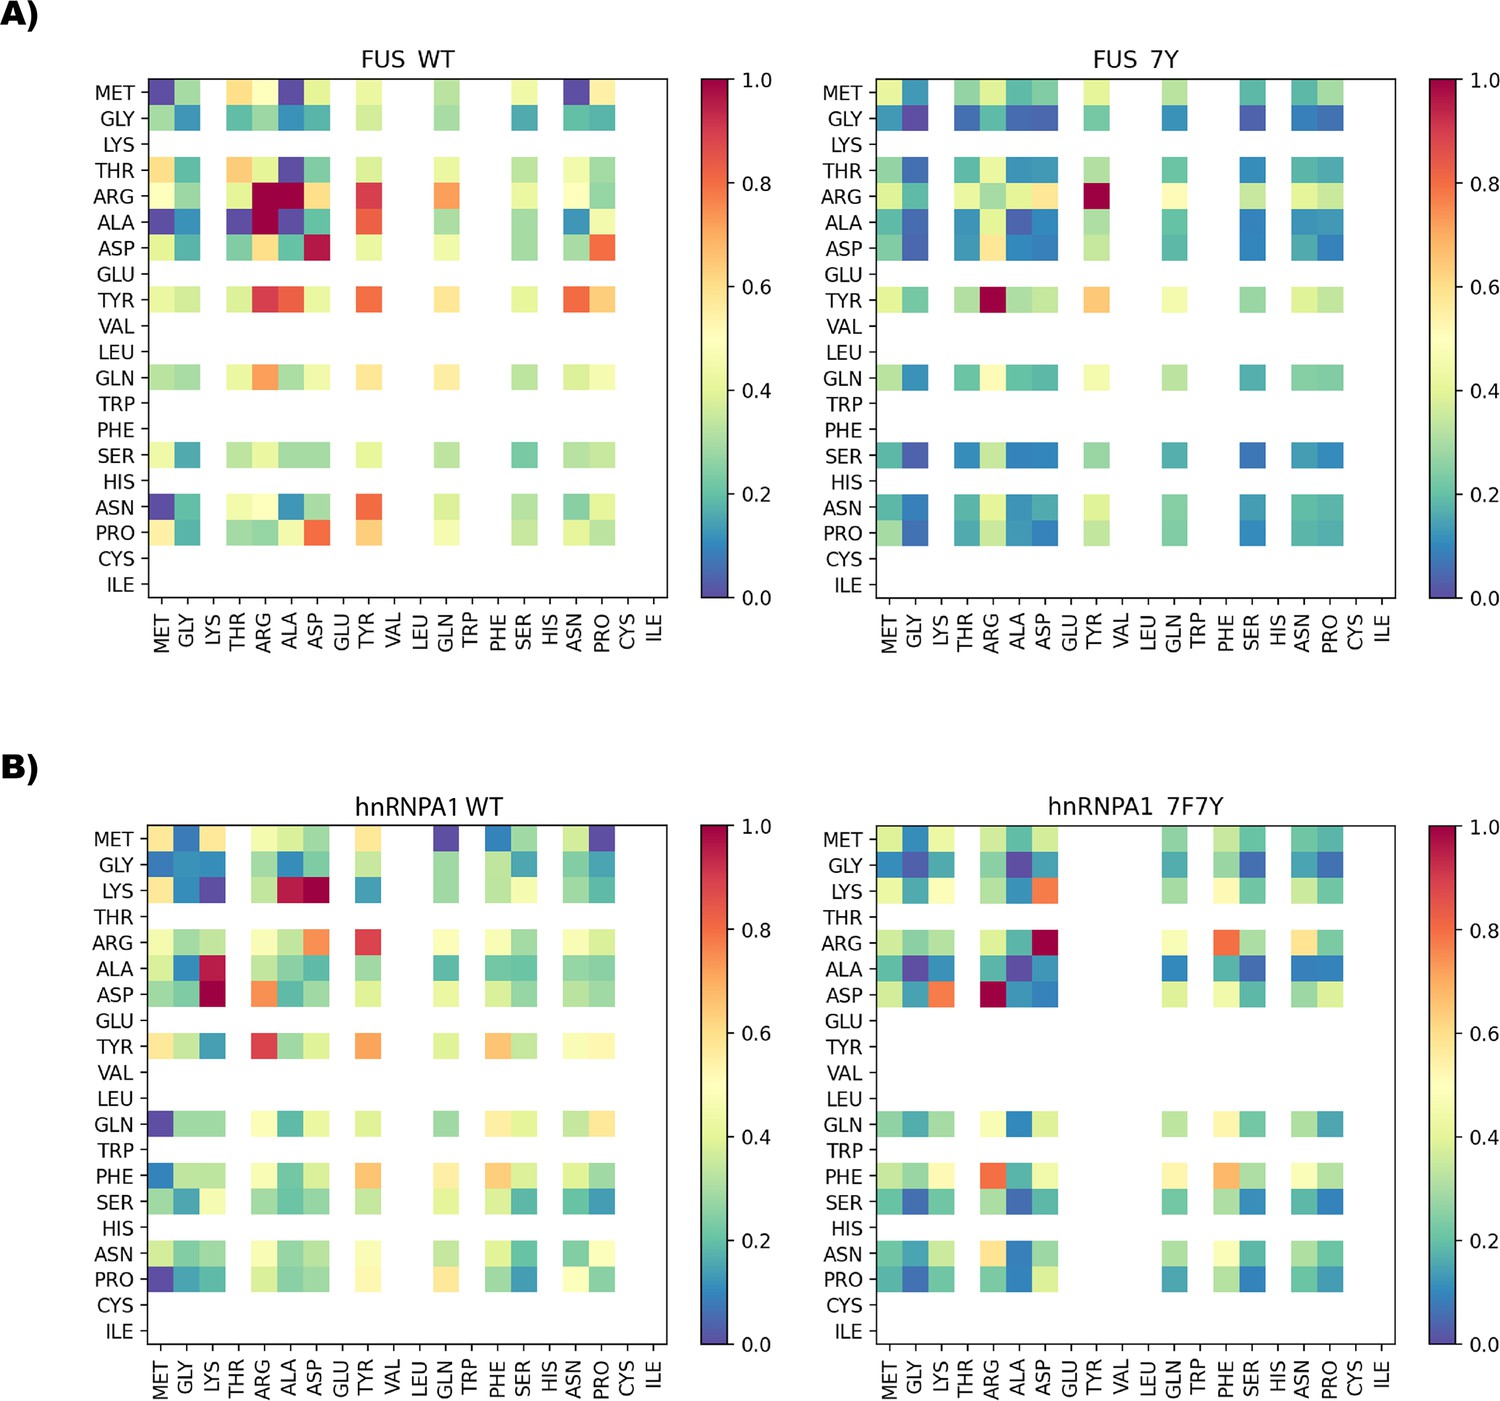
Normalized contact maps of different aromatic variants of prion-like low complexity domains (PLDs): (A) Fused in Sarcoma (FUS) (B) heterogeneous nuclear ribonucleoprotein A1 (hnRNPA1).
Tables
Table 1
Predicted effect of single point mutations on the critical temperature, in Kelvin, of prion-like low complexity domains (PLDs), as a function of their length, .
| L | Y→F | F/Y→W | F/Y→X | R→K | R→X |
|---|---|---|---|---|---|
| 100 | –0.4±0.0 | 4.3±0.1 | –5.6±0.5 | –13±1 | –6.4±0.5 |
| 200 | –0.4±0.04 | 4.3±0.1 | –3.9±0.4 | –6.5±0.5 | –3.2±0.3 |
| 300 | –0.4±0.04 | 4.3±0.1 | –3.2±0.3 | – 4.3±0.3 | –2.1±0.2 |
| L | N→Q | S→T | G→T | A→S | |
| 100 | 0.5±0.05 | –0.09±0.03 | –0.08±0.02 | 0.16±0.05 | |
| 200 | 0.25±0.03 | –0.09±0.03 | –0.08±0.02 | 0.16±0.05 | |
| 300 | 0.17±0.02 | –0.09±0.03 | –0.08±0.02 | 0.16±0.05 | |
Additional files
Download links
A two-part list of links to download the article, or parts of the article, in various formats.
Downloads (link to download the article as PDF)
Open citations (links to open the citations from this article in various online reference manager services)
Cite this article (links to download the citations from this article in formats compatible with various reference manager tools)
Decoding phase separation of prion-like domains through data-driven scaling laws
eLife 13:RP99068.
https://doi.org/10.7554/eLife.99068.3


