Artesunate, EDTA, and colistin work synergistically against MCR-negative and -positive colistin-resistant Salmonella
- Department of Pharmacology and Toxicology, College of Veterinary Medicine, Henan Agricultural University, China
Figures
Figure 1
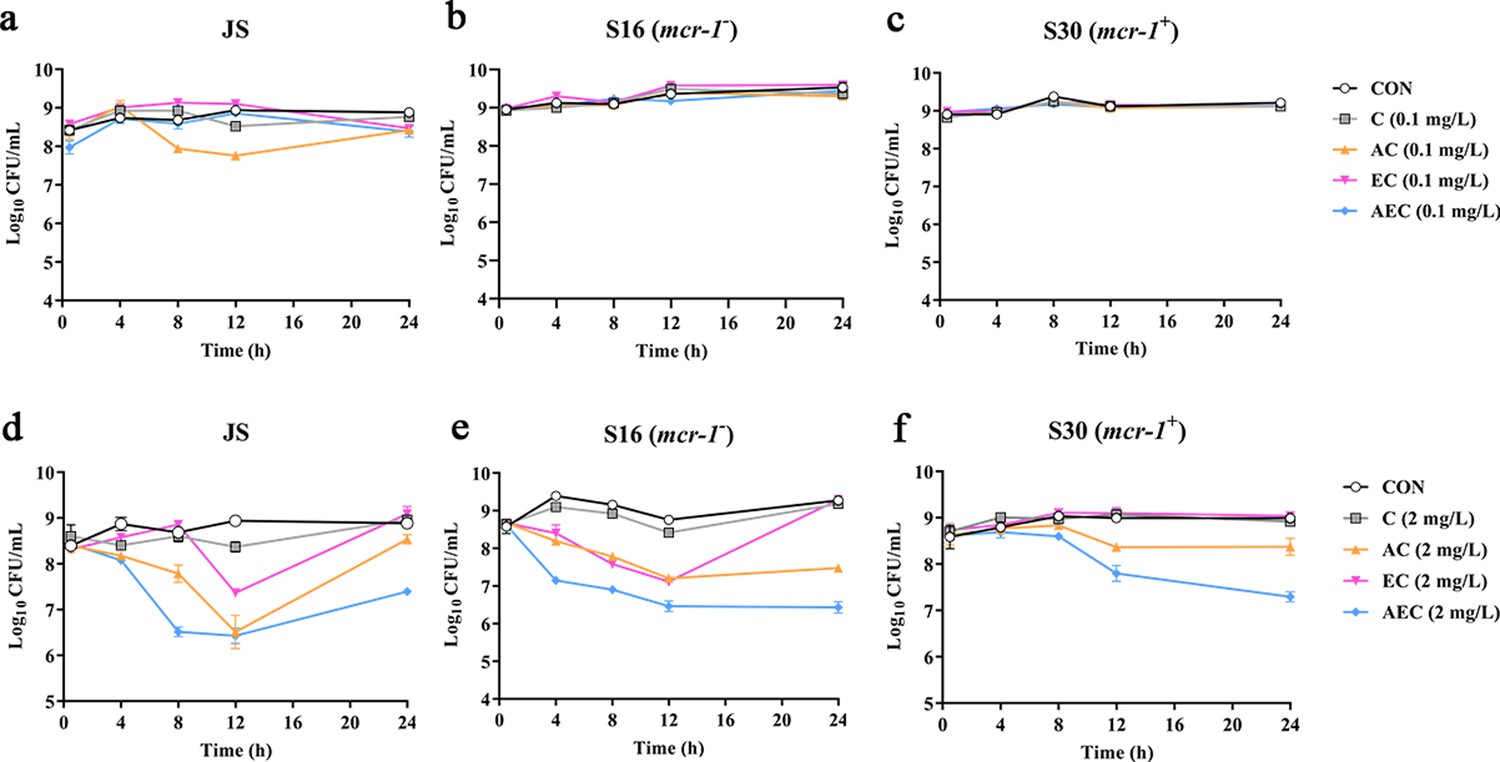
Time-kill curves of Salmonella strains JS, S16, and S30 with colistin (COL) alone and in combinations.
(a–f) Samples were treated with different concentrations of COL (0.1 or 2 mg/L), alone or in drug combinations, for 12 hr. When used in combination, 1/8 minimum inhibitory concentration (MIC) of artesunate (AS) or EDTA was added to a final concentration of 156.3 or 15.6 mg/L, respectively. Counts of CFU/mL were performed on all cultures at each time point, and data are mean ± SD from representative of three independent experiments. CON indicates the negative control group.
Figure 2 with 1 supplement

Artesunate (AS), EDTA, and colistin (COL) affected membrane integrity, proton motive force (PMF), reactive oxygen species (ROS), and H2O2 levels in S16 and S30 strains.
Different concentrations of COL (0.1 or 2 mg/L) were used alone or in combination with AS and EDTA. When used in combination, 1/8 minimum inhibitory concentration (MIC) of AS or EDTA was added to a final concentration of 156.3 or 15.6 mg/L, respectively. a-d AS, EDTA, and COL affected membrane integrity as measured by fluorescence probes 1-N-phenylnaphthylamine (NPN) and propidium iodide (PI). Error bars indicate SDs for three replicas (*p<0.001, ns not significant). CON indicates the negative control group, and SOV indicates the solvent-exposed group. (e–h) Disruption of PMF is shown by measuring the dissipation of electric potential (Δψ) (a, b) and osmotic component (ΔpH) (c, d). Error bars indicate SDs for three replicas (*p<0.001, ns not significant). CON indicates the negative control group, and SOV indicates the solvent-exposed group. (i–l) Intracellular accumulation of ROS (i, j) and H2O2 (k, l) in S16 and S30 strains after 1 hr treatment. Data are shown as the mean of triplicates ± SD (*p<0.001, ns not significant). CON indicates the negative control group, SOV indicates the solvent-exposed group, and POS indicates the positive control group that were treated with Rosup from the Total ROS Detection Kit.
Figure 2—figure supplement 1
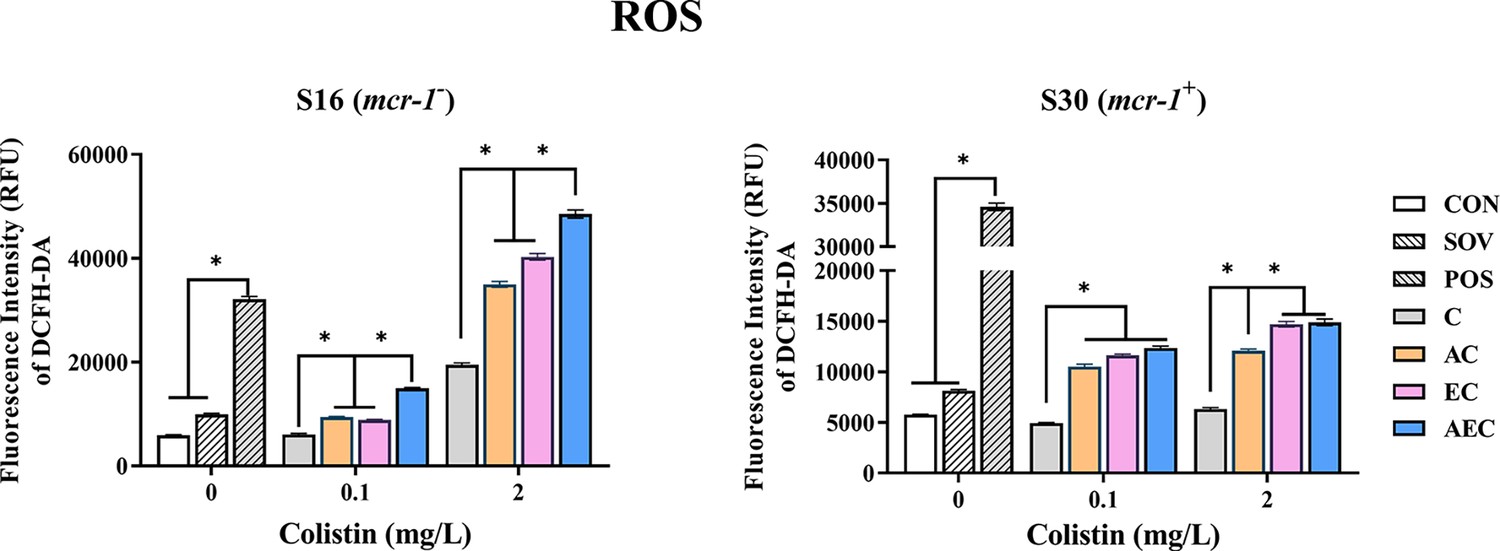
Intracellular accumulation of reactive oxygen species (ROS) in S16 and S30 strains after 6 hr treatment.
Different concentrations of colistin (COL) (0.1 or 2 mg/L) were used alone or in combination with 1/8 minimum inhibitory concentration (MIC) of artesunate (AS) (156.3 mg/L) or EDTA (15.6 mg/L). Data are shown in the mean of triplicates ± SD (*p<0.001). CON indicates the negative control group, and SOV indicates the solvent-exposed group.
Figure 3
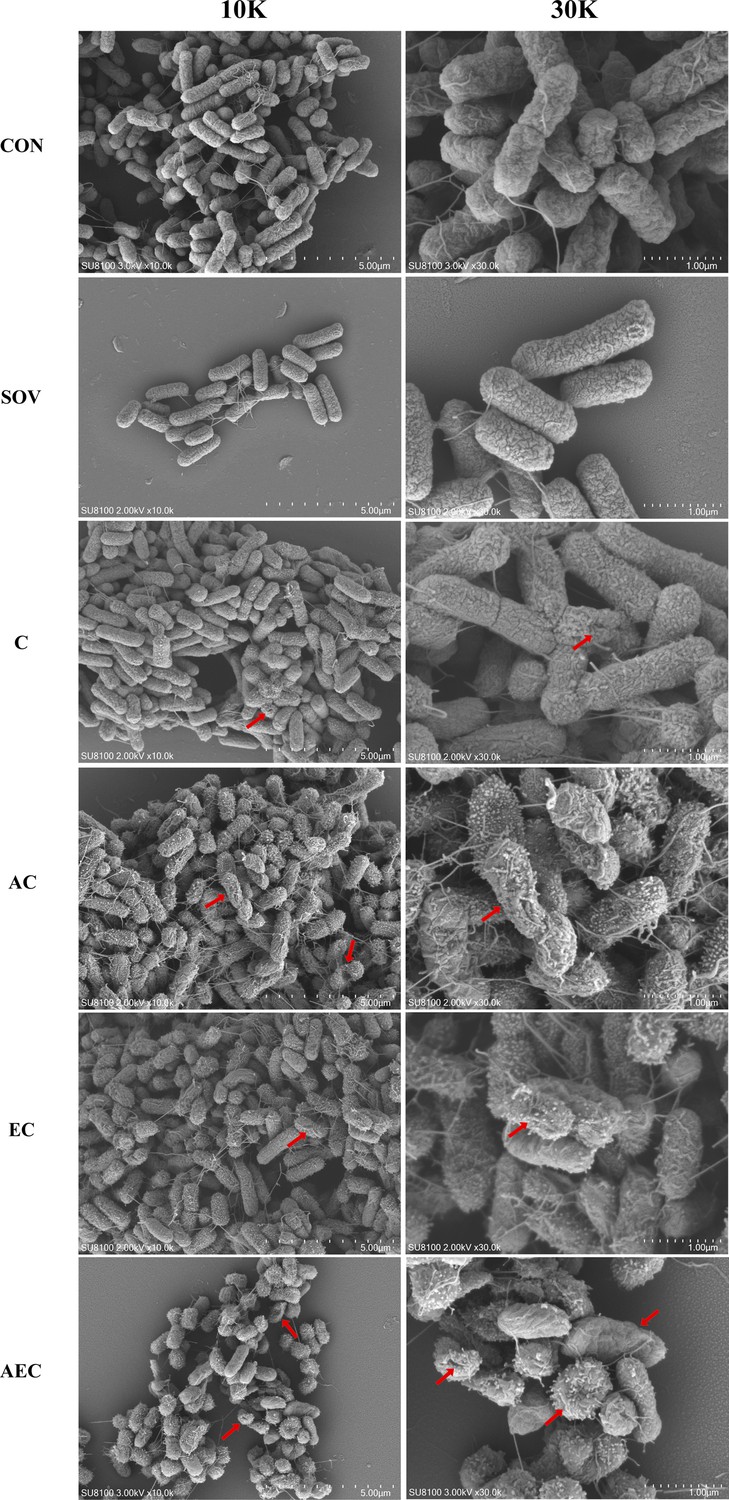
Morphological changes of S16 (mcr-1-) strain.
The images were obtained after the treatment with colistin (COL) (2 mg/L) alone or in combination with 1/8 minimum inhibitory concentration (MIC) of artesunate (AS) (156.3 mg/L) or EDTA (15.6 mg/L). CON indicates the negative control group, and SOV indicates the solvent-exposed group. Red arrows indicate the cell damages characterized by folds, crevices, or depressions.
Figure 4 with 2 supplements
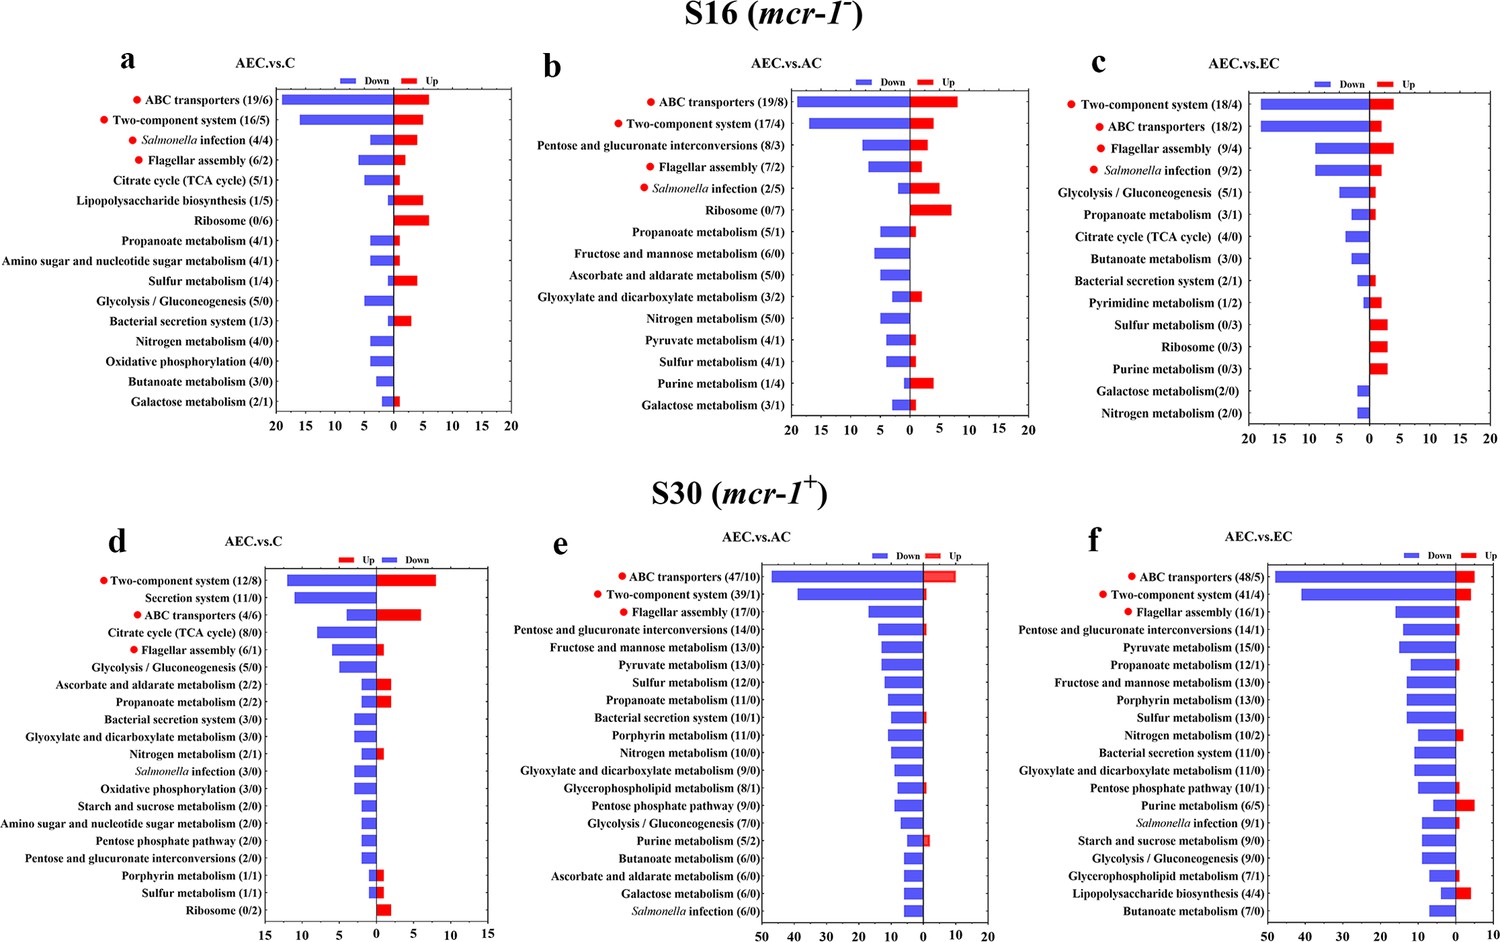
Kyoto Encyclopedia of Genes and Genomes (KEGG) pathway analysis of significantly differentially expressed genes (SDEGs) in S16 (a–c) and S30 (d–f) strains within the AEC. vs. C, AEC.vs. AC, and AEC.vs. EC groups.
Samples were harvested after the treatment of COL (2 mg/L) alone or in combination with 1/8 MIC of AS (156.3 mg/L) or EDTA (15.6 mg/L) for 6 hr. Pathway name and number of downregulated (blue) and upregulated (red) genes in each pathway are indicated in parentheses on the left (down/up). Highlighted with red circles are the pathways where SDEGs are mainly enriched and appeared simultaneously in different comparison groups.
Figure 4—figure supplement 1
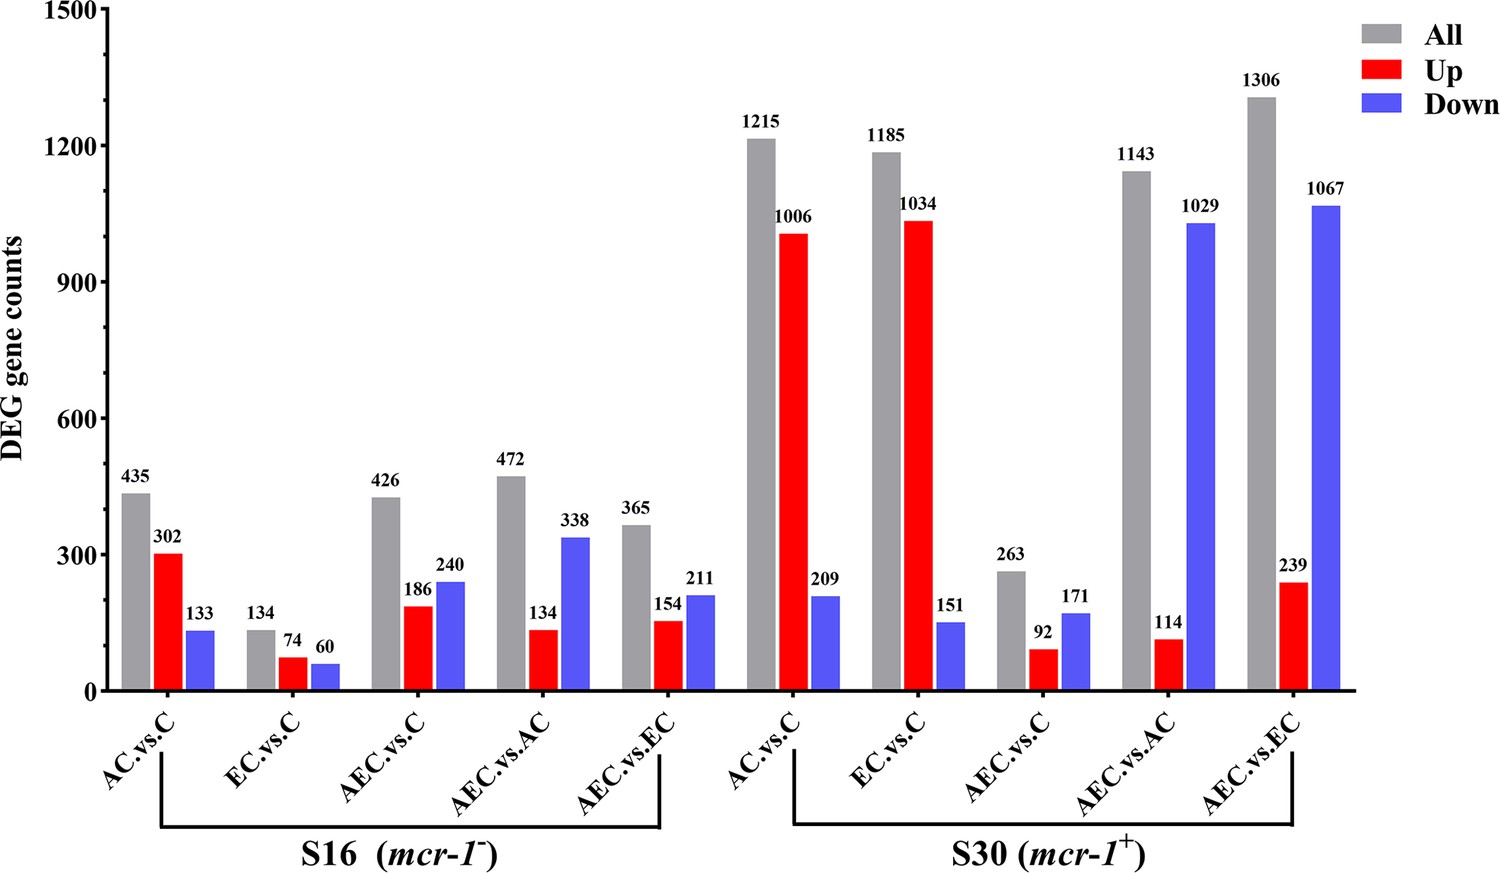
The number of differentially expressed genes (DEGs) is identified in S16 and S30 strains among different comparison groups.
The total counts of DEGs are labeled at the top of each column and distinguished by different colors, all (gray), downregulated (blue), and upregulated (red). Samples were harvested after the treatment of colistin (COL) (2 mg/L) alone or in combination with 1/8 minimum inhibitory concentration (MIC) of artesunate (AS) (156.3 mg/L) or EDTA (15.6 mg/L) for 6 hr.
Figure 4—figure supplement 2
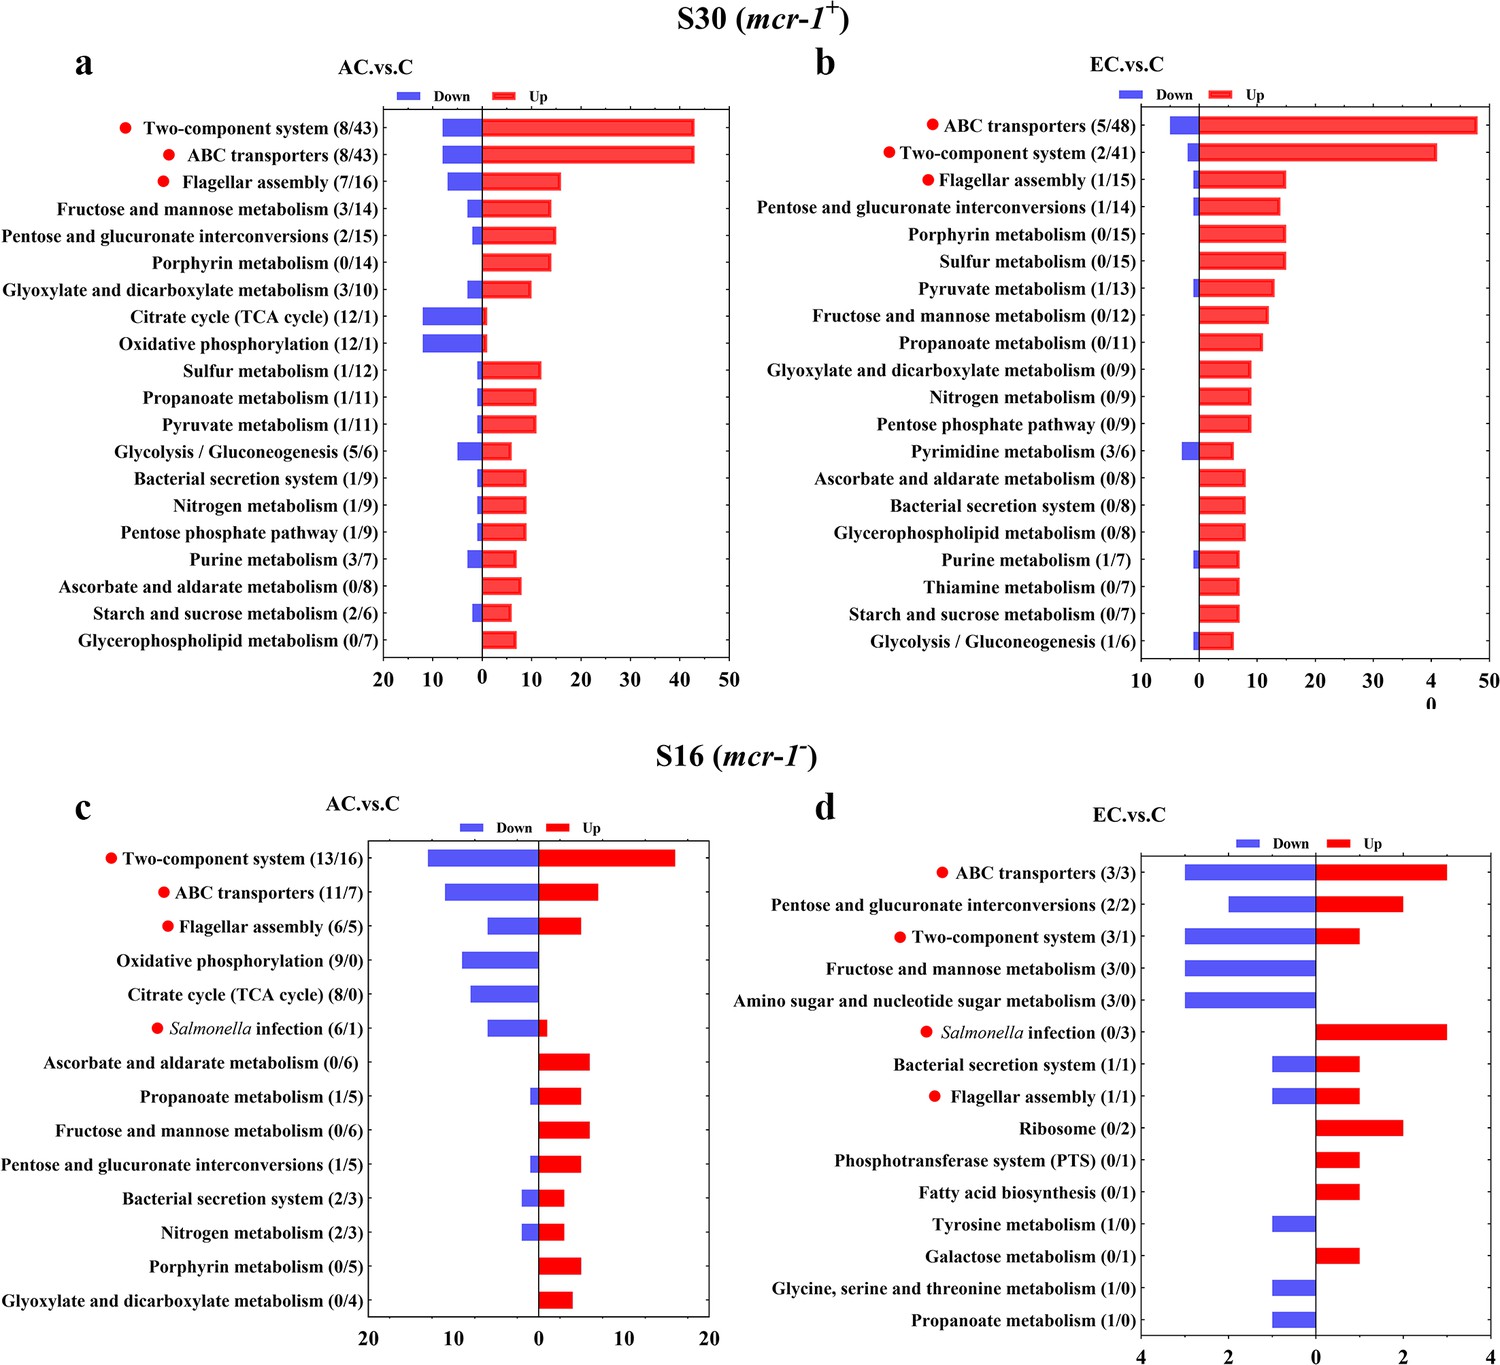
Kyoto Encyclopedia of Genes and Genomes (KEGG) pathway analysis of significantly differentially expressed genes (SDEGs) in S16 (a, b) and S30 (c, d) strains within the AC. vs. C, and EC.vs. C groups.
(a–d) Samples were harvested after the treatment of colistin (COL) (2 mg/L) alone or in combination with 1/8 minimum inhibitory concentration (MIC) of artesunate (AS) (156.3 mg/L) or EDTA (15.6 mg/L) for 6 hr. Pathway name and number of downregulated (blue) and upregulated (red) genes in each pathway are indicated in parentheses on the left (down/up). Highlighted with red circles are the pathways where SDEGs are mainly enriched and appeared simultaneously in different comparison groups.
Figure 5 with 2 supplements
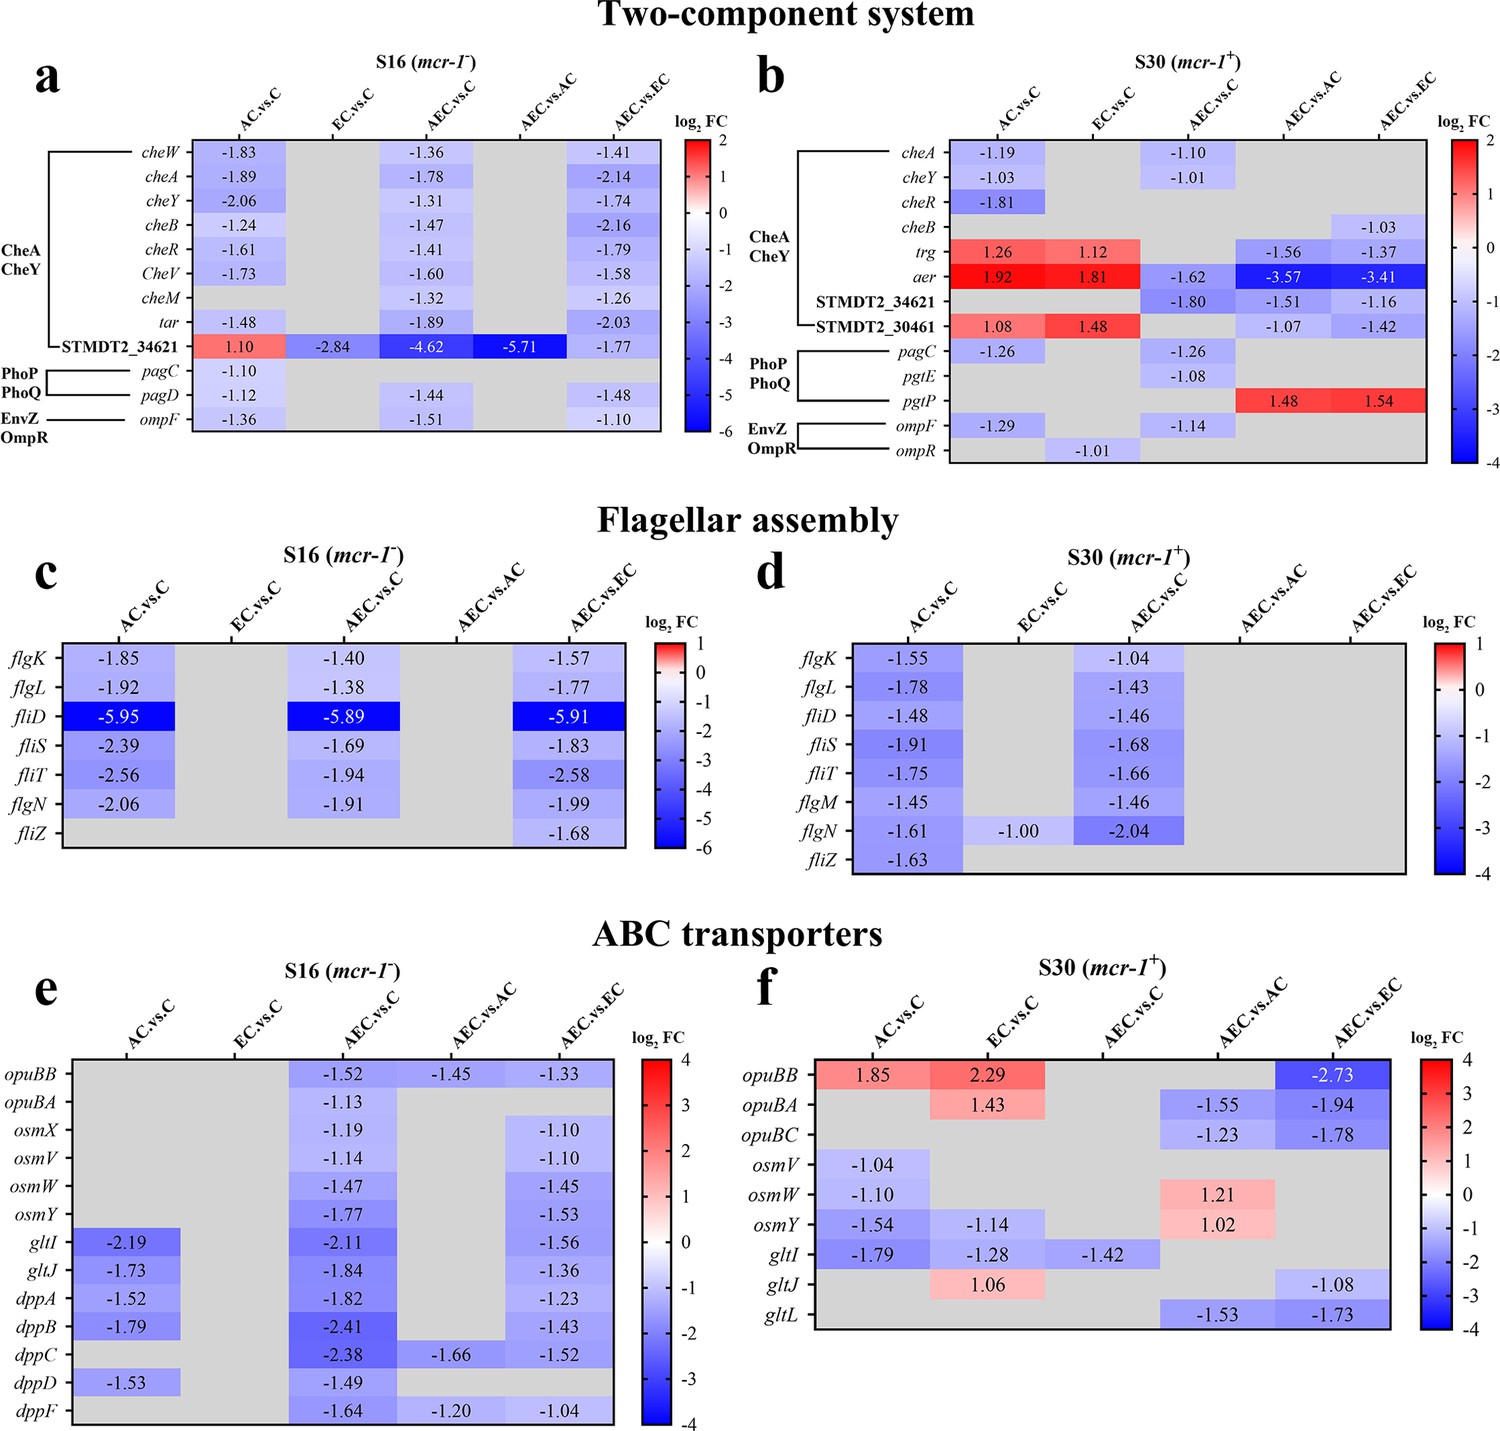
The significantly differentially expressed genes (SDEGs) detected in two-component system (a, b), flagellar assembly (c, d), and ABC transporters (e, f) pathways among different comparison groups, within S16 and S30 strains.
Samples were harvested after the treatment of colistin (COL) (2 mg/L) alone or in combination with 1/8 minimum inhibitory concentration (MIC) of artesunate (AS) (156.3 mg/L) or EDTA (15.6 mg/L) for 6 hr. Labels in each square indicate the log2 (fold change) of corresponding genes. Squares without label and gray background indicate the data are not credible (p>0.05, |log2Fold Change|<1.0). Background colors indicate the expression levels of the respective genes, red = upregulated, blue = downregulated. log2FC: log2Fold Change.
Figure 5—figure supplement 1
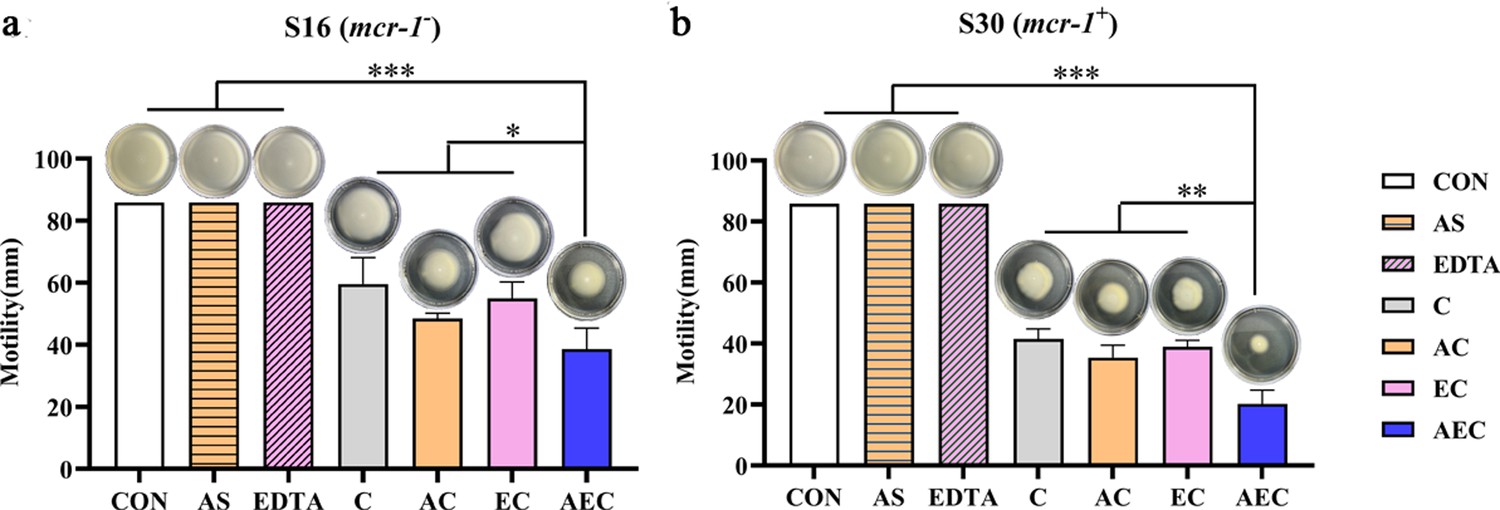
Artesunate (AS), EDTA, and colistin (COL) inhibited the swimming motility of S16 (a) and S30 (b) strains.
Overnight cultures were diluted 1:100 in fresh LB medium and grown to an OD600 of 0.5, and inoculated on 0.3% agar plates for 48 hr at 37℃. The different concentrations of COL (2 mg/L) alone or in combination with 1/8 minimum inhibitory concentration (MIC) of AS (156.3 mg/L) or EDTA (15.6 mg/L) were added into the plates. The migration distance (cm) was measured. Data are shown in the mean of triplicates ± SD (***p<0.001, **p<0.01, *p<0.05).
Figure 5—figure supplement 2
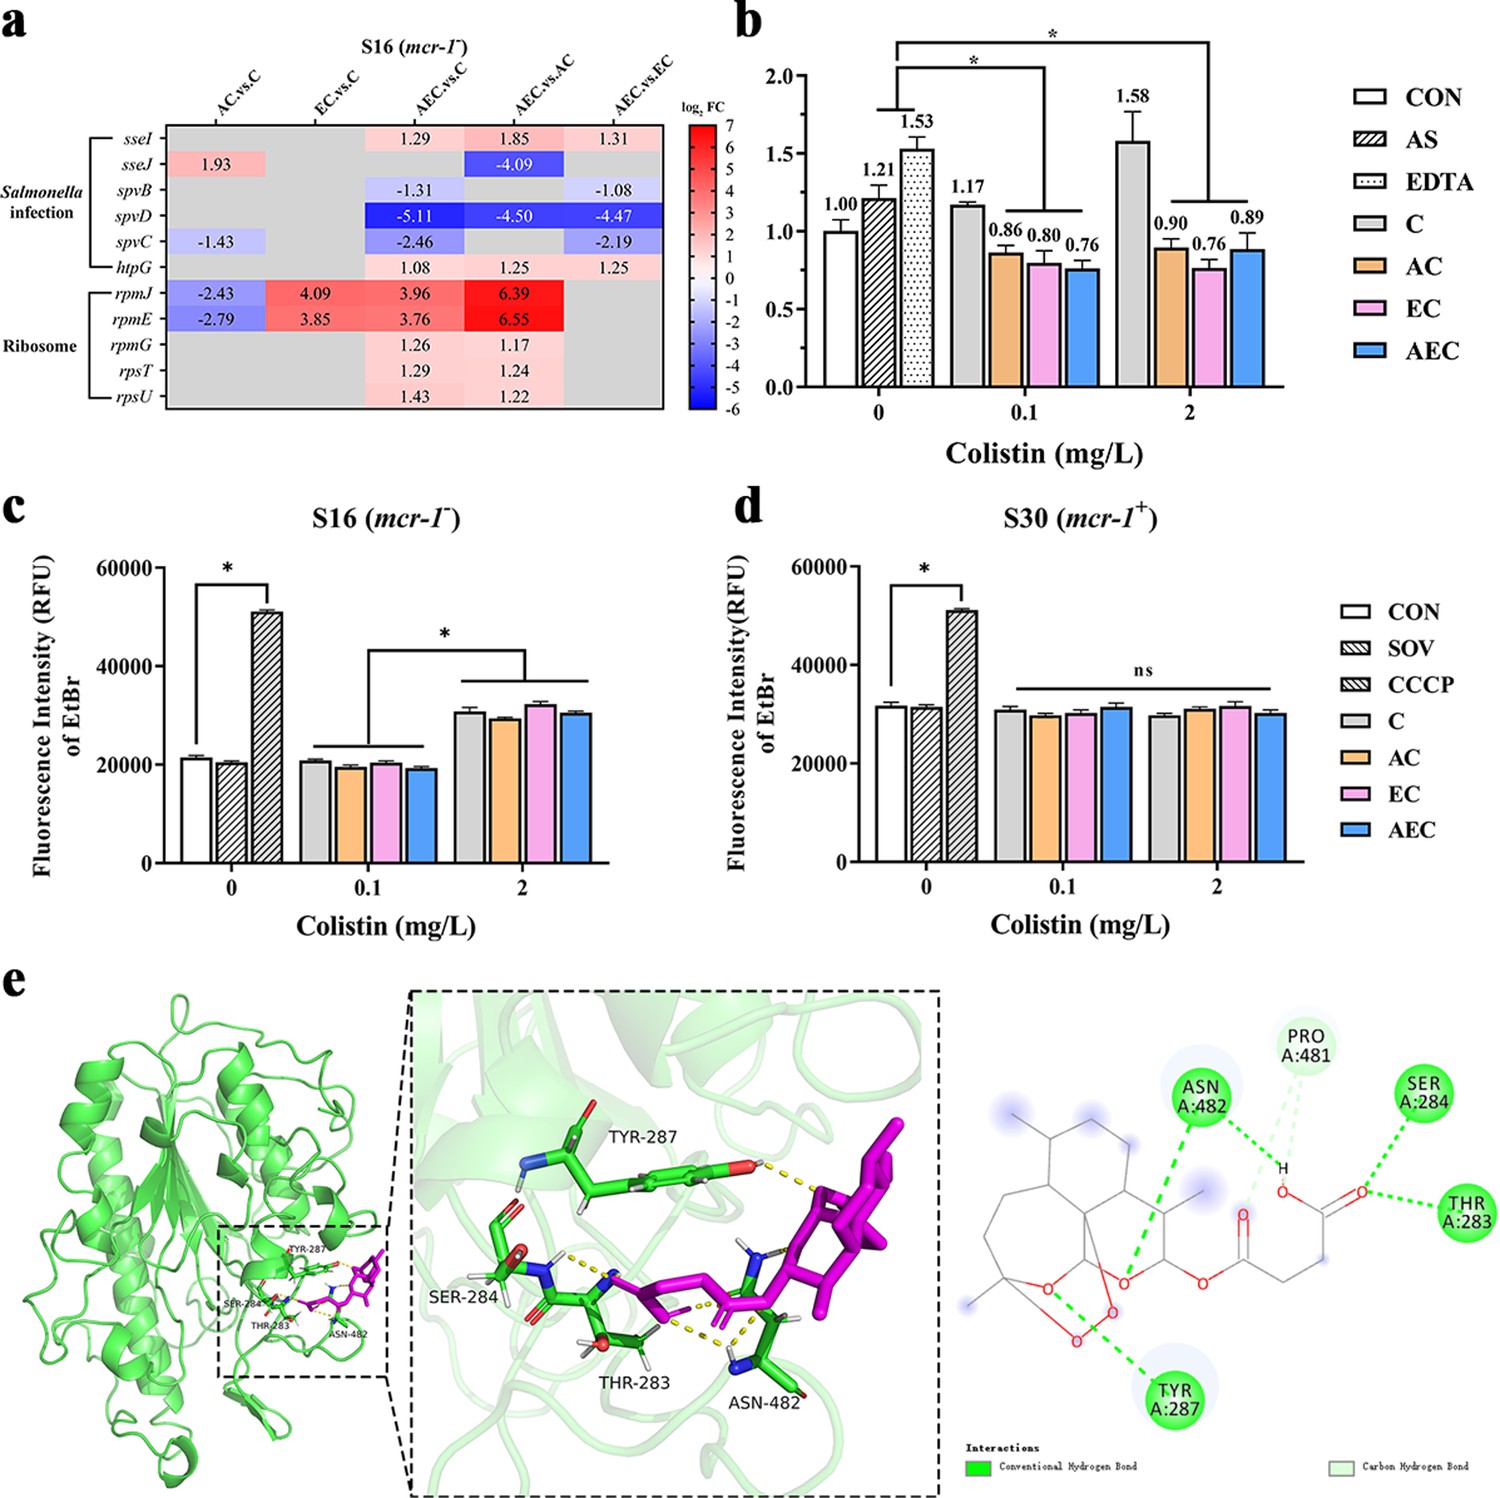
The significantly differentially expressed genes (SDEGs) detected in Salmonella infection and ribosome pathways (a); expression level of mcr-1 (b); efflux pump activity in S16 or S30 strain (c, d); putative pattern of interaction between artesunate (AS) and MCR-1 protein (e).
Different concentrations of colistin (COL) (0.1 or 2 mg/L) were used alone or in combination with 1/8 minimum inhibitory concentration (MIC) of AS (156.3 mg/L) or EDTA (15.6 mg/L). (a) The SDEGs detected in Salmonella infection, ribosome pathways among different comparison groups, within S16 strain. Labels in each square indicate the log2 (fold change) of corresponding genes. Squares without label and gray background indicate the data are not credible (p>0.05, |log2FoldChange|<1.0). Background colors indicate the expression levels of the respective genes, red = upregulated, blue = downregulated. log2FC: log2Fold Change. (b) The relative expression of mcr-1 in S30 strain after the incubation of different medication regimens. Significant differences were evaluated by Student’s t-test analysis and shown with *p<0.001. (c, d) Intracellular accumulation of EtBr in S16 and S30 strains. Data are shown in the mean of triplicates ± SD (*p<0.001, ns, not significant). CON indicates the negative control group, and SOV indicates the solvent-exposed group. (e) Putative pattern of interaction between AS and MCR-1 protein. The interactions formed between the amino acid residues (stick, green) and the docked AS molecule (stick, purple) in the MCR-1 binding sites are displayed in 3D and 2D views.
Figure 6
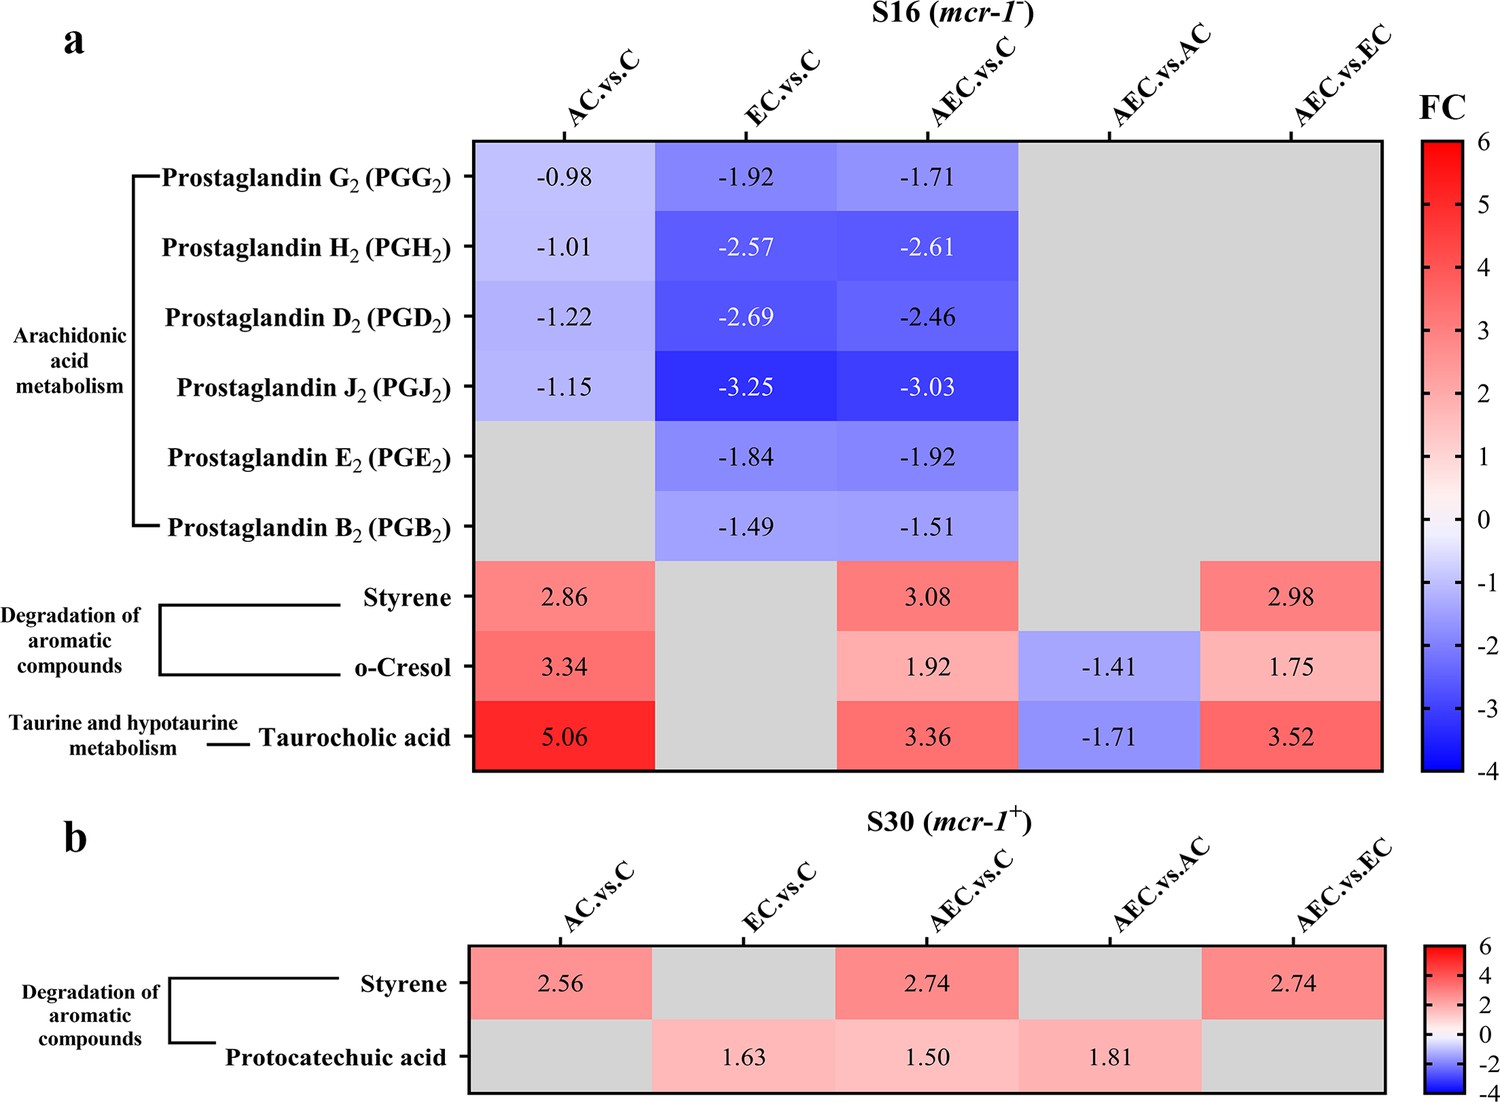
The significant differential metabolites (SDMs) detected in arachidonic acid metabolism, degradation of aromatic compounds, taurine and hypotaurine metabolism pathways among different comparison groups, within S16 (a) and S30 (b) strains.
Samples were harvested after the treatment of colistin (COL) (2 mg/L) alone or in combination with 1/8 minimum inhibitory concentration (MIC) of artesunate (AS) (156.3 mg/L) or EDTA (15.6 mg/L) for 6 hr. Labels in each square indicate the fold changes of corresponding metabolites. Squares without label and gray background indicate the data are not credible (VIP < 1.0, 0.833 > Fold Change < 1.2 or Fold Change ≤ 0.833, p≥0.05). Background colors indicate the fold changes of the respective metabolites, red = increased, blue = decreased.
Figure 7
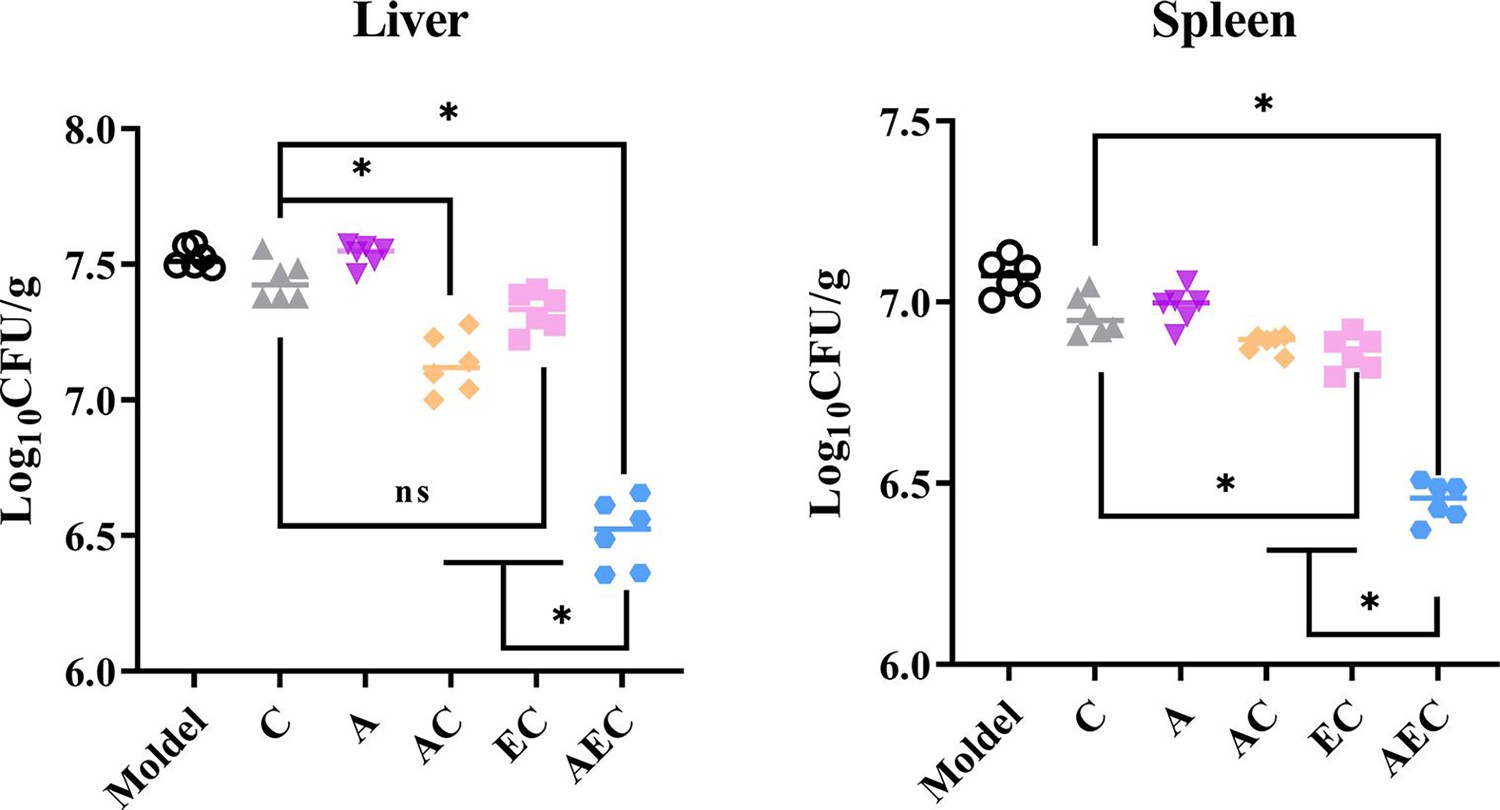
Artesunate (AS) and EDTA potentiate colistin activity against Salmonella S30 (mcr-1+) in vivo.
Kunming mice (n = 6 per group) were intraperitoneally given a nonlethal dose of Salmonella S30 (1.31 × 10⁵ CFU), then treated with PBS, colistin (COL) (10 mg/kg), AS (15 mg/kg), AS (15 mg/kg) + COL (10 mg/kg), EDTA (50 mg/kg) + COL (10 mg/kg), and AS (15 mg/kg) + EDTA (50 mg/kg) + COL (10 mg/kg) by intraperitoneal injection. Bacterial loads were determined in the spleen and liver and bacterial counts were computed and presented as the mean ± SD log10 CFU/mL. The p-values were determined by one-way ANOVA (*p<0.001, ns, not significant).
Figure 8
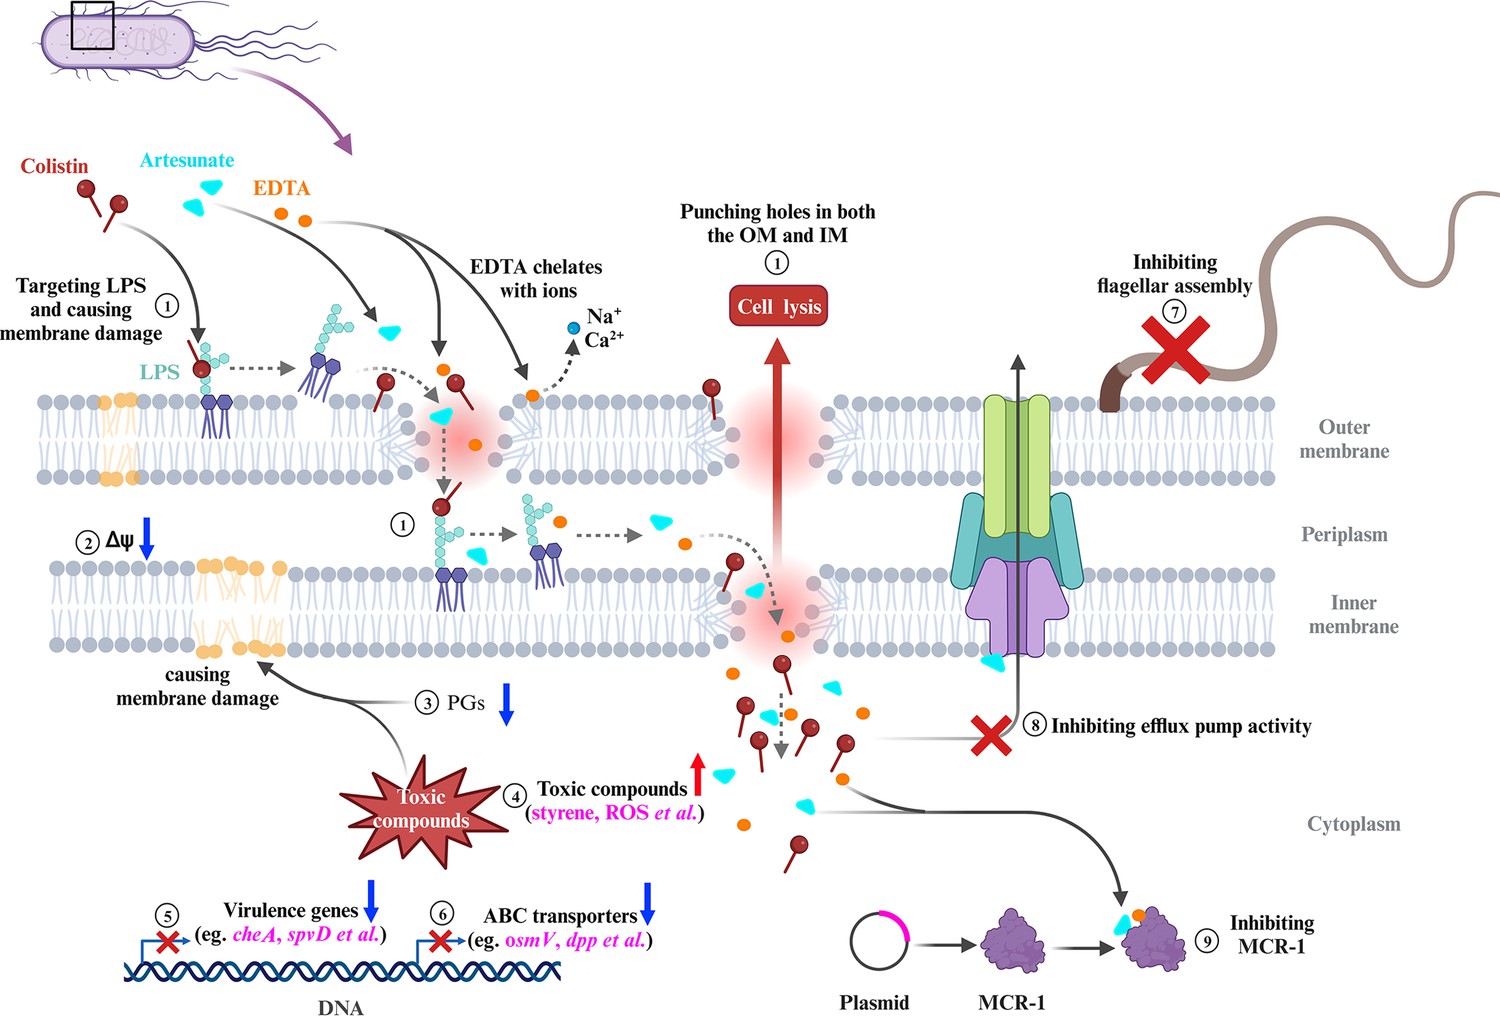
Scheme summarizing the proposed mechanisms that artesunate (AS) and EDTA enhance the antibacterial effect of colistin (COL) against Salmonella.
① COL and EDTA cause the membrane damage by targeting LPS and chelating cations, which punch holes in both the outer membrane (OM) and inner membrane (IM). ② AEC combination collapses the Δψ component of proton motive force (PMF) in Salmonella. ③ The downregulated lipid compounds prostaglandins (PGs) lead to perturbation of membrane phospholipids in cell membranes. ④ Accumulation of toxic compounds (e.g., styrene, ROS) could accelerate the destruction of cell membrane. ⑤ The downregulation of chemotaxis, flagellar assembly, and Salmonella infection-related genes indicates impaired virulence of Salmonella. ⑥ The downregulation of genes in ABC transporters indicates impaired stress tolerance of Salmonella. ⑦ AEC treatment results in the downregulation of flagellar assembly-related genes and defective of flagellum. ⑧ AS was capable of significantly enhancing the antibacterial activities of antibiotics against E. coli, via inhibition of the efflux pumps. ⑨ AS could be developed as an MCR-1 inhibitor, which may work synergistically with the EDTA chelation to inhibit MCR-1 and contribute to reverse the COL resistance of mcr-1-harboring Salmonella strains. FC: fold change.
Tables
Table 1
The antibacterial activities of COL, AS, and EDTA against the tested strains after single and double combinations.
| Strains | mcr-1 | MICs (mg/L) | ||||||||||
|---|---|---|---|---|---|---|---|---|---|---|---|---|
| Alone | COL + AS | COL + EDTA | ||||||||||
| COL | AS | EDTA | 1/4AS | 1/8AS | 1/16AS | Fold change | 1/4EDTA | 1/8EDTA | 1/16EDTA | Fold change | ||
| JS | - | 0.25 | 1250 | 125 | 0.0625 | 0.125 | 0.125 | 2–4 | 0.25 | 0.25 | 0.25 | 0 |
| S34 | - | 0.125 | 1250 | 125 | 0.008 | 0.015 | 0.125 | 0–16 | 0.015 | 0.03 | 0.0625 | 2–8 |
| S16 | - | 4 | 1250 | 125 | 0.25 | 0.25 | 4 | 0–16 | 2 | 2 | 4 | 0–2 |
| S20 | - | 2 | 1250 | 125 | 0.015 | 0.015 | 2 | 0–133 | 0.25 | 2 | 2 | 0–8 |
| S13 | + | 2 | 1250 | 125 | 0.25 | 0.25 | 2 | 0–8 | 1 | 2 | 2 | 0–2 |
| S30 | + | 4 | 1250 | 125 | 0.25 | 0.25 | 2 | 2–16 | 2 | 2 | 2 | 2 |
| E16 | + | 2 | 1250 | 500 | 0.0625 | 0.25 | 2 | 0–32 | 0.5 | 0.5 | 1 | 2–4 |
| M15 | - | >64 | 1250 | >1000 | >64 | >64 | >64 | 0 | >64 | >64 | >64 | 0 |
| P01 | - | >64 | 1250 | >1000 | >64 | >64 | >64 | 0 | >64 | >64 | >64 | 0 |
-
AS, artesunate; COL, colistin; MIC, minimum inhibitory concentration.
Table 2
The antibacterial activities of COL against the tested strains after single and triple combinations.
| Strains | mcr-1 | MICs (mg/L) | Fold change | ||||||||
|---|---|---|---|---|---|---|---|---|---|---|---|
| COL alone | COL + 1/4 AS + EDTA | COL + 1/8 AS + EDTA | |||||||||
| 1/4EDTA | 1/8EDTA | 1/16EDTA | 1/32EDTA | 1/4EDTA | 1/8EDTA | 1/16EDTA | 1/23EDTA | ||||
| JS | - | 0.25 | 0.015 | 0.125 | 0.125 | 0.125 | 0.03 | 0.25 | 0.25 | 0.25 | 0–17 |
| S34 | - | 0.125 | 0.008 | 0.015 | 0.015 | 0.015 | 0.02 | 0.0625 | 0.125 | 0.125 | 0–16 |
| S16 | - | 4 | 0.015 | 0.03 | 0.0625 | 0.0625 | 0.0625 | 0.125 | 0.125 | 0.5 | 8–267 |
| S20 | - | 2 | 0.0625 | 0.125 | 0.125 | 0.125 | 0.25 | 0.5 | 0.5 | 0.5 | 4–32 |
| S13 | + | 2 | 0.015 | 0.125 | 0.25 | 0.25 | 0.0625 | 0.25 | 0.5 | 0.5 | 4–133 |
| S30 | + | 4 | 0.015 | 0.0625 | 0.0625 | 0.125 | 0.125 | 0.125 | 0.25 | 0.5 | 8–266.6 |
| E16 | + | 2 | 0.00003 | 0.002 | 0.25 | 0.5 | 0.004 | 0.015 | 0.25 | 1 | 2–66,667 |
| M15 | - | >64 | 32 | 32 | >64 | >64 | 32 | 32 | >64 | >64 | 0–2 |
| P01 | - | >64 | >64 | >64 | >64 | >64 | >64 | >64 | >64 | >64 | 0 |
-
AS, artesunate; COL, colistin; .
Table 3
Minimum inhibitory concentration (MIC) values of colistin (COL) against S16 and S30 strains after the addition of exogenous cations.
| Strains | Cations(100 mg/L) | MICs (mg/L) | |||
|---|---|---|---|---|---|
| COL | AC | EC | AEC | ||
| S16 (mcr-1-) | Control | 4 | 0.25 | 2 | 0.125 |
| Na+ | 4 | 0.25 | 2 | 0.125 | |
| K+ | 4 | 0.25 | 2 | 0.125 | |
| Ca2+ | 4 | 0.25 | 2 | 0.125 | |
| Mg2+ | 8 | 0.5 | 4 | 0.25 | |
| Mn2+ | 4 | 0.25 | 2 | 0.125 | |
| Zn2+ | 4 | 0.25 | 2 | 0.125 | |
| S30 (mcr-1+) | Control | 4 | 0.25 | 2 | 0.125 |
| Na+ | 4 | 0.25 | 2 | 0.125 | |
| K+ | 4 | 0.25 | 2 | 0.125 | |
| Ca2+ | 4 | 0.25 | 2 | 0.125 | |
| Mg2+ | 8 | 0.5 | 4 | 0.25 | |
| Mn2+ | 4 | 0.25 | 2 | 0.125 | |
| Zn2+ | 4 | 0.25 | 2 | 0.125 | |
Table 4
Minimum inhibitory concentration (MIC) values of colistin (COL) against S16 and S30 strains after the addition of exogenous LPS.
| Strains | Drug | MICs (mg/L) | |||
|---|---|---|---|---|---|
| +0 LPS | +4 LPS | +32 LPS | +512 LPS | ||
| S16 (mcr-1-) | COL | 4 | 4 | 8 | 64 |
| AC | 0.25 | 0.5 | 2 | 32 | |
| EC | 2 | 2 | 2 | 32 | |
| AEC | 0.125 | 0.5 | 2 | 32 | |
| S30 (mcr-1+) | COL | 4 | 4 | 16 | 64 |
| AC | 0.25 | 0.5 | 4 | 64 | |
| EC | 2 | 4 | 16 | 64 | |
| AEC | 0.125 | 0.5 | 4 | 64 | |
Table 5
Minimum inhibitory concentration (MIC) values of colistin against S16 strain after the overexpression of different genes.
| Genes | L-Ara | MICs (mg/L) | ||
|---|---|---|---|---|
| AC | EC | AEC | ||
| cheA | — | 0.25 | 0.5 | 0.125 |
| + | 0.25 | 2 | 4 | |
| cheY | — | 0.25 | 2 | 0.125 |
| + | 0.5 | 2 | 0.125 | |
| STMDT2-34621 | — | 0.25 | 1 | 0.125 |
| + | 0.5 | 1 | 0.25 | |
| aer | — | 0.25 | 1 | 0.125 |
| + | 0.25 | 1 | 0.125 | |
| fliD | — | 0.25 | 1 | 0.25 |
| + | 0.5 | 1 | 0.5 | |
| fliT | — | 0.25 | 1 | 0.125 |
| + | 0.25 | 1 | 0.125 | |
| opuBB | — | 0.25 | 1 | 0.125 |
| + | 0.25 | 1 | 0.125 | |
| gltI | — | 0.25 | 1 | 0.125 |
| + | 0.25 | 1 | 0.125 | |
| dppB | — | 0.25 | 1 | 0.125 |
| + | 0.25 | 1 | 0.125 | |
| dppC | — | 0.25 | 1 | 0.125 |
| + | 0.25 | 1 | 0.125 | |
| spvD | — | 0.25 | 1 | 0.125 |
| + | 1 | 1 | 0.5 | |
Table 6
Minimum inhibitory concentration (MIC) values of colistin against S30 strain after the incubation of polypeptides.
| Strains | Drug | MICs (mg/L) | ||
|---|---|---|---|---|
| Control | +Pu | +Pm | ||
| S30 (mcr-1+) | AC | 0.25 | 2 | 0.25 |
| AEC | 0.125 | 1 | 1 | |
-
Pu and Pm indicate the unmutated and mutated peptide at THR 283, SER 284, and TYR 287 sites, respectively.
Additional files
-
Supplementary file 1
Supplementary tables.
(a) Sequences of primers used in this study. (b) The antibacterial activities of COL, AS, and EDTA against the tested strains after single and double combinations. (c) The antibacterial activities of COL against the tested strains after single and triple combinations. (d) The MICs of different antimicrobial drugs against the S16 and S30.
- https://cdn.elifesciences.org/articles/99130/elife-99130-supp1-v1.docx
-
MDAR checklist
- https://cdn.elifesciences.org/articles/99130/elife-99130-mdarchecklist1-v1.docx
Download links
A two-part list of links to download the article, or parts of the article, in various formats.
Downloads (link to download the article as PDF)
Open citations (links to open the citations from this article in various online reference manager services)
Cite this article (links to download the citations from this article in formats compatible with various reference manager tools)
Artesunate, EDTA, and colistin work synergistically against MCR-negative and -positive colistin-resistant Salmonella
eLife 13:RP99130.
https://doi.org/10.7554/eLife.99130.3


