Proteomic landscape of tunneling nanotubes reveals CD9 and CD81 tetraspanins as key regulators
- Membrane Traffic and Pathogenesis Unit, Department of Cell Biology and Infection, CNRS 18 UMR 3691, Institut Pasteur, Université Paris Cité, France
- Sorbonne Université, ED394 - Physiologie, Physiopathologie et Thérapeutique, France
- Proteomics Platform, Mass Spectrometry for Biology Unit, CNRS USR 2000, Institut Pasteur, France
- Centre d’Immunologie et des Maladies Infectieuses, Inserm, CNRS, Sorbonne Université, CIMI-Paris, France
- Ultrastructural BioImaging Core Facility (UBI), C2RT, Institut Pasteur, Université Paris Cité, France
Figures
Figure 1 with 1 supplement
Validation of the purification procedures.
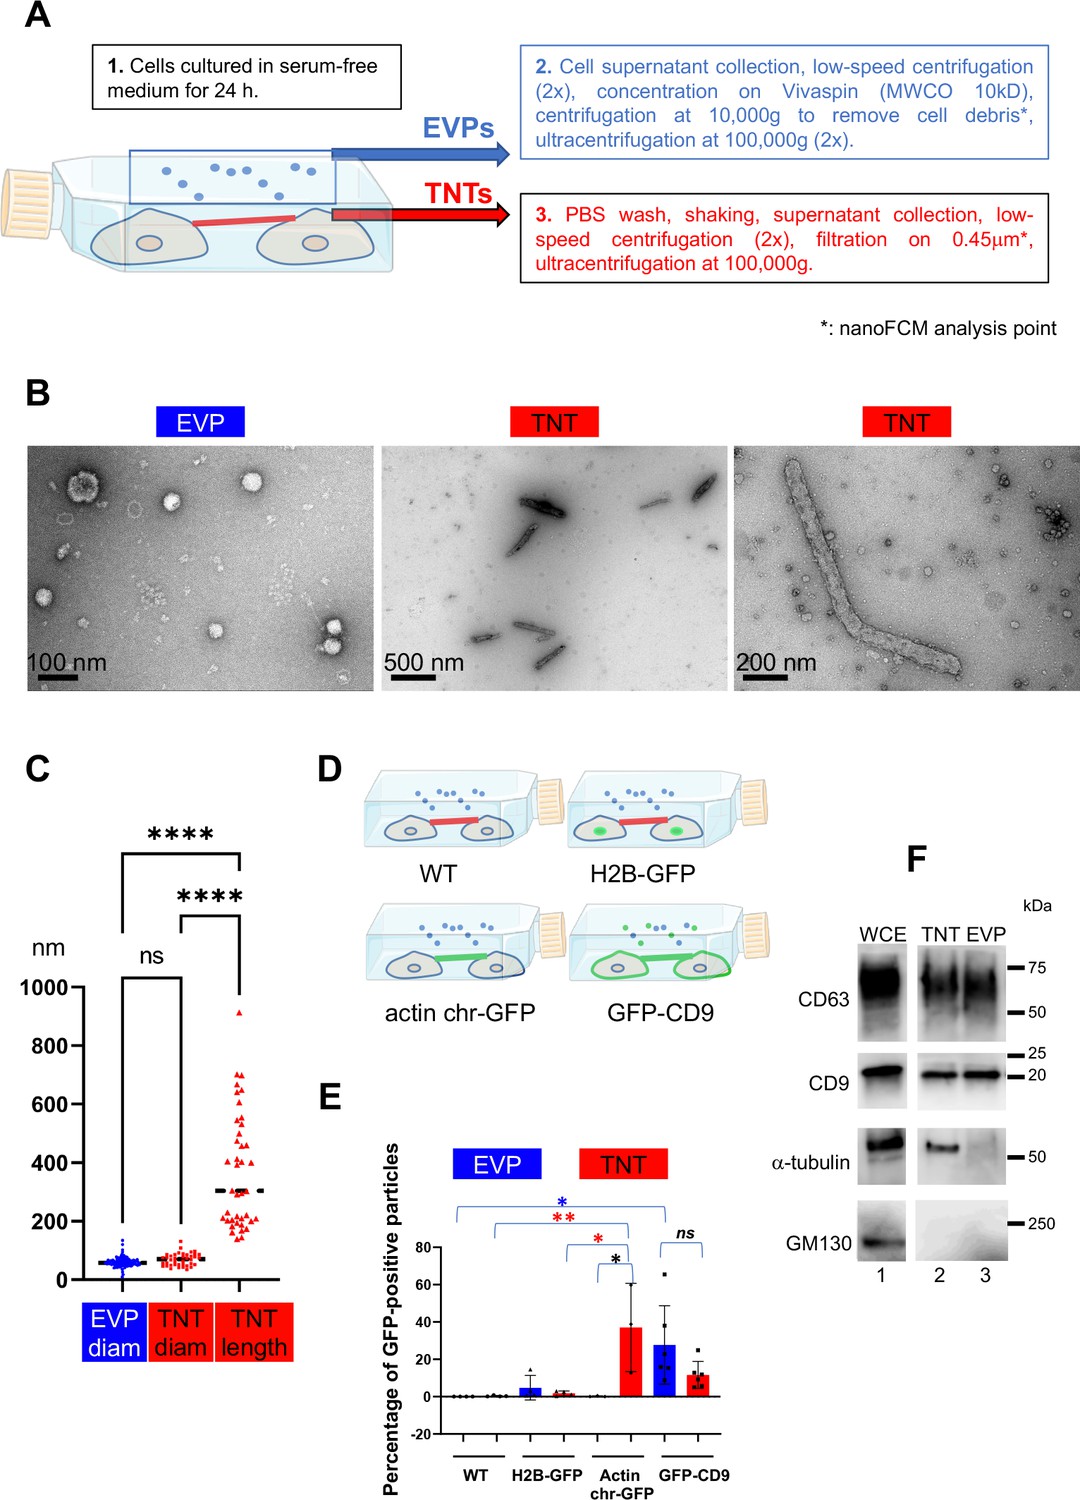
(A) Workflow for tunneling nanotube (TNT) vs. extracellular vesicles and particle (EVP) purification. EVPs were purified from cell culture supernatant, and TNTs from the remaining attached cell supernatant after shaking. * indicates the fraction used for nano-flow cytometry (NanoFCM) analysis. (B) Representative pictures of negative staining and transmission electron microscopy from EVP and TNT fractions as indicated. Scale bars are 100, 500, and 200 nm, respectively. (C) Violin plot of the size distribution of EVP diameters (124 vesicles) and TNT diameters and lengths (40 objects), line is the median. EVP and TNT diameter means are 60 and 69 nm, respectively, TNT lengths extend from 140 to 912 nm, mean of 372 nm. Statistical analysis is one-way Anova with Tukey post hoc correction. Ns, non-significant, ****p<0.0001. (D) Schematic representation of stable cell lines where green color indicates the location of GFP-tagged protein: H2B-GFP (nuclear), actin chromobody-GFP (actin cytoskeleton including TNTs) and GFP-CD9 (cell surface, TNTs, EVPs). (E) Scatter dot plot representing the mean percentage (with SD) of GFP-positive particles analyzed by nanoFCM. Statistical analysis of three independent experiments to 6 for GFP-CD9 (oneway Anova with Tukey post-hoc correction) show the following respective p-values (from top): blue*: 0.0252, red**: 0.0089, red*: 0.0131, black*: 0.0161. Means values are (from left to right): 0.01, 0.3, 4.8, 1.75, 0.16, 37.07, 27.7 and 11.6. (F) Western blot of whole cell extracts (WCE) (20 μg, corresponding to around 0.1×10⁶ cells), TNT, and EVP fractions (both from 10 106 cells) prepared from the same cells, blotted with CD63, CD9, α-tubulin and GM130 specific antibodies. White lane indicates that intervening lanes of the same gel (and same exposure) have been spliced out.
-
Figure 1—source data 1
Uncropped and labeled western blots (WBs) for Figure 1F.
- https://cdn.elifesciences.org/articles/99172/elife-99172-fig1-data1-v1.zip
-
Figure 1—source data 2
Raw unedited western blots (WBs) for Figure 1F.
- https://cdn.elifesciences.org/articles/99172/elife-99172-fig1-data2-v1.zip
Figure 1—figure supplement 1
Characterization of tunneling nanotubes (TNTs) in U2OS cells.
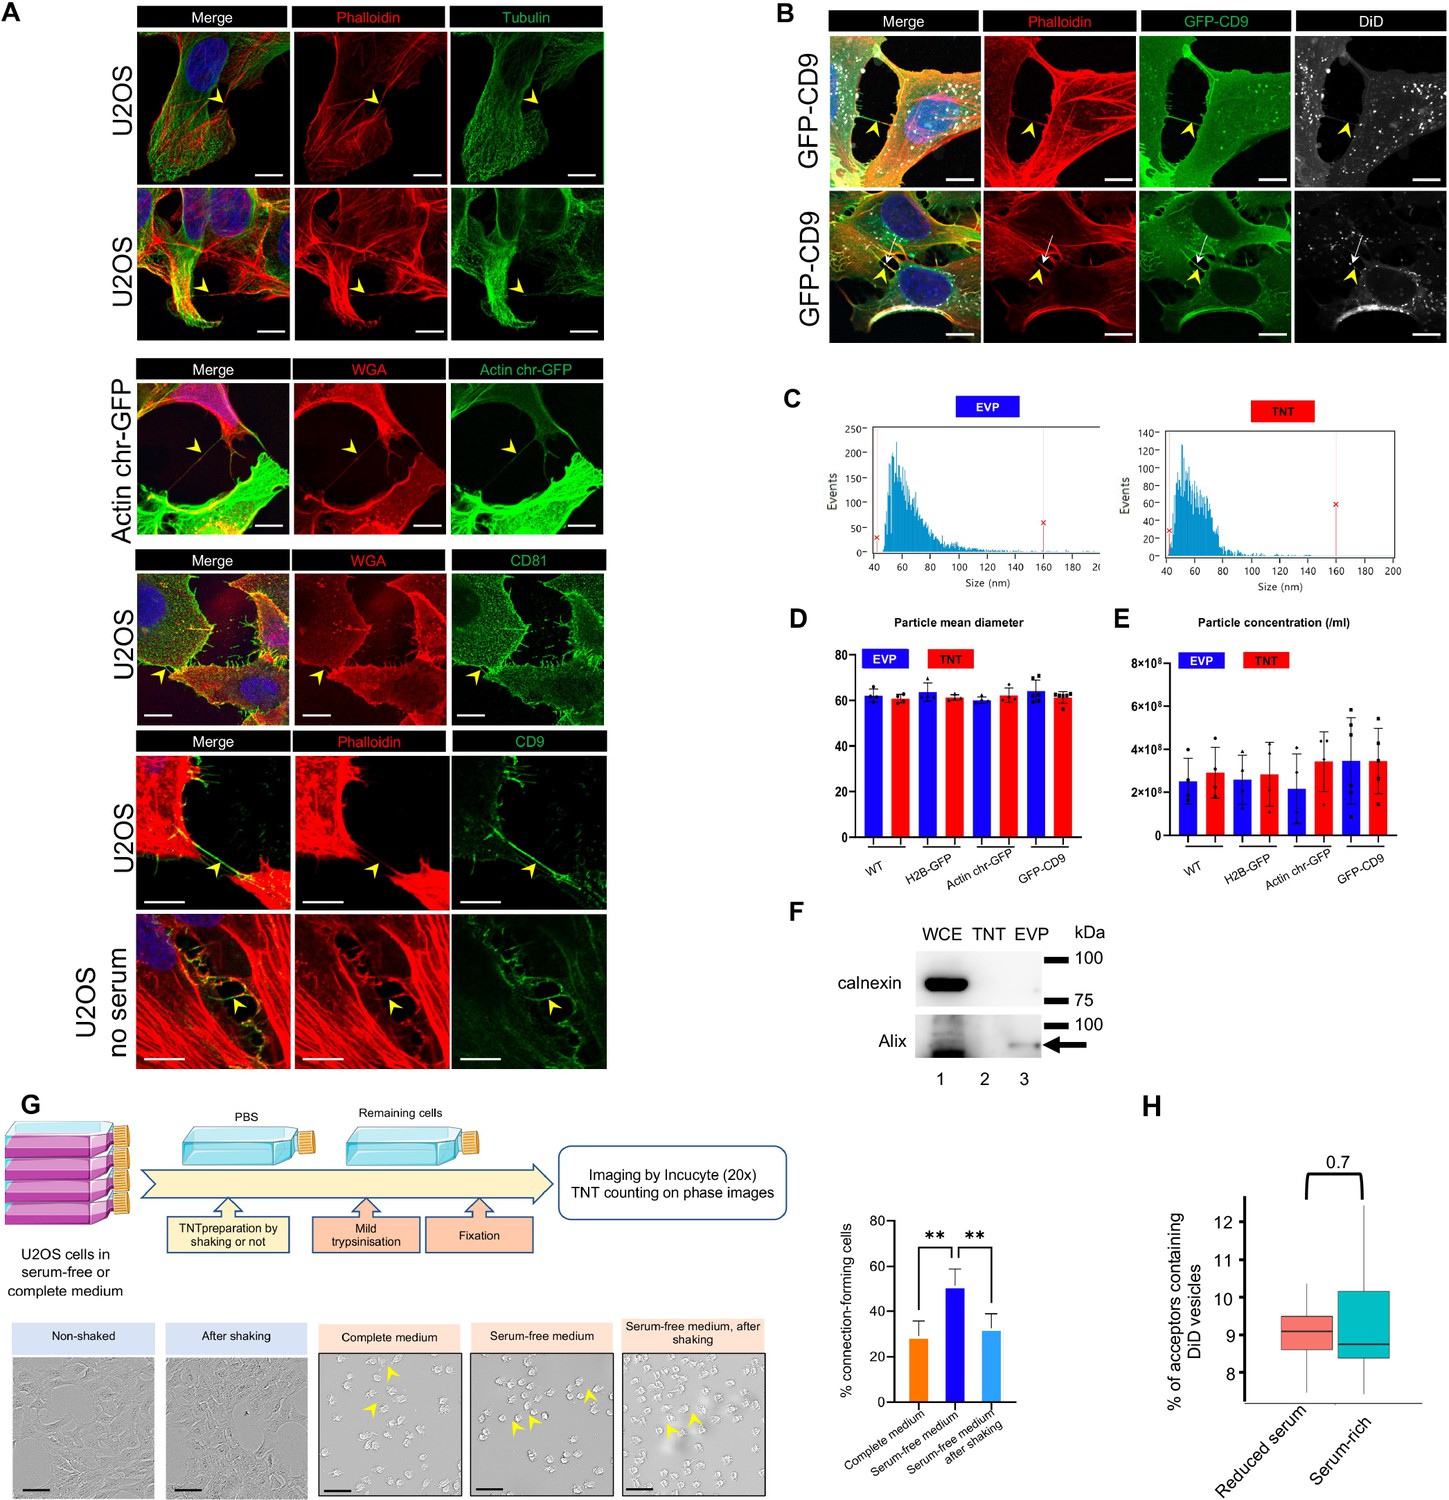
(A) Representative immunofluorescence of TNTs in U2OS cells, expressing actin (stained with phalloidin, red in the two first lanes) without or with tubulin (green, lanes 1 and 2). Actin-chromodoby-GFP is also expressed in TNTs (lane 3). Lanes 4–6 show representative images of CD81 and CD9 in TNTs of U2OS cells. In lane 6, cells were grown for 24 hr in the absence of serum before fixation. WGA (wheat germ agglutinin in red) labels the cell surface of these non-permeabilized cells. The images in lanes 1–6 are respectively projections of 1, 3, 3, 1, 2 and 1 slices of each stack. The yellow arrowheads point to TNTs, connecting two cells and not attached to the substrate. The scale bars are 10 μm. (B) Two examples of TNTs in GFP-CD9 expressing U2OS cells. TNTs are identified as containing actin (phalloidin in red), and DiD labels intracellular vesicles, sometimes found inside TNT as in the second lane (white arrow). The yellow arrowheads point to TNTs, scale bars are 10 μm. (C) Representative examples of the size distribution of extracellular vesicles and particles (EVPs) and TNTs fractions. (D) Scatter dot plot representing mean size diameter of particles (with SD) of EVP and TNT fractions, depending on each cell line. At least four independent experiments were analyzed, each dot being one of them. No statistical difference was observed. Over 18 samples from all cell lines, the mean particle diameter was 62.7 nm (SD: 3.8) for EVPs, and 61.4 nm (SD 2.2) for TNTs. (E) Scatter dot plot representing mean particle concentration (with SD) of EVP and TNT fractions, depending on each cell line. At least four independent experiments were analyzed, each dot being one of them. No statistical difference was observed. (F) Representative western blots from three independent preparations of whole cell extracts (WCE) (40 μg of proteins), TNT, and EVP fractions (from about 20 106 cells), using the indicated antibodies successively. (G) Effect of shaking on U2OS (or actin chromobody-GFP expressing U2OS cells) cells and connections. The top diagram summarizes the flow of experiments aimed at visualizing and counting the connections between cells. Pictures were acquired using Incucyte (20 x magnification) on flasks either with or without shaking in serum-free medium (first two pictures), or after mild trypsinization of cells grown either in complete, or in serum-free medium, or remaining cells after shaking (pictures 3 to 5). Scale bars are 100 μm, and arrowheads point to examples of cell-to-cell connections. The graph represents the percentage of connection-forming cells. Statistical analysis of four independent experiments was done by one-way Anova with Tukey post hoc correction (**p=0.0052 and 0.0085 respectively). (H) U2OS cells are able to transfer vesicles when cultured in serum-rich or reduced serum-containing medium for 24 hr. Actin chromo body-GFP expressing U2OS cells were challenged with DiD for 30 min to label vesicles, next cocultured with mcherry-expressing U2OS as acceptors for 18 hr in a complete or serum-free medium. Analysis was performed by FACS, boxplot shows the percentage of acceptor cells positive for DiD (means respectively at 9.4 and 8.9%), and statistical analysis is a pairwise comparison from three independent experiments (p=0.7).
-
Figure 1—figure supplement 1—source data 1
Uncropped and labeled western blots (WBs) for Figure 1—figure supplement 1F.
- https://cdn.elifesciences.org/articles/99172/elife-99172-fig1-figsupp1-data1-v1.zip
-
Figure 1—figure supplement 1—source data 2
Raw unedited western blots (WBs) for Figure 1—figure supplement 1F.
- https://cdn.elifesciences.org/articles/99172/elife-99172-fig1-figsupp1-data2-v1.zip
Figure 2 with 1 supplement
Analysis of the TNTome.
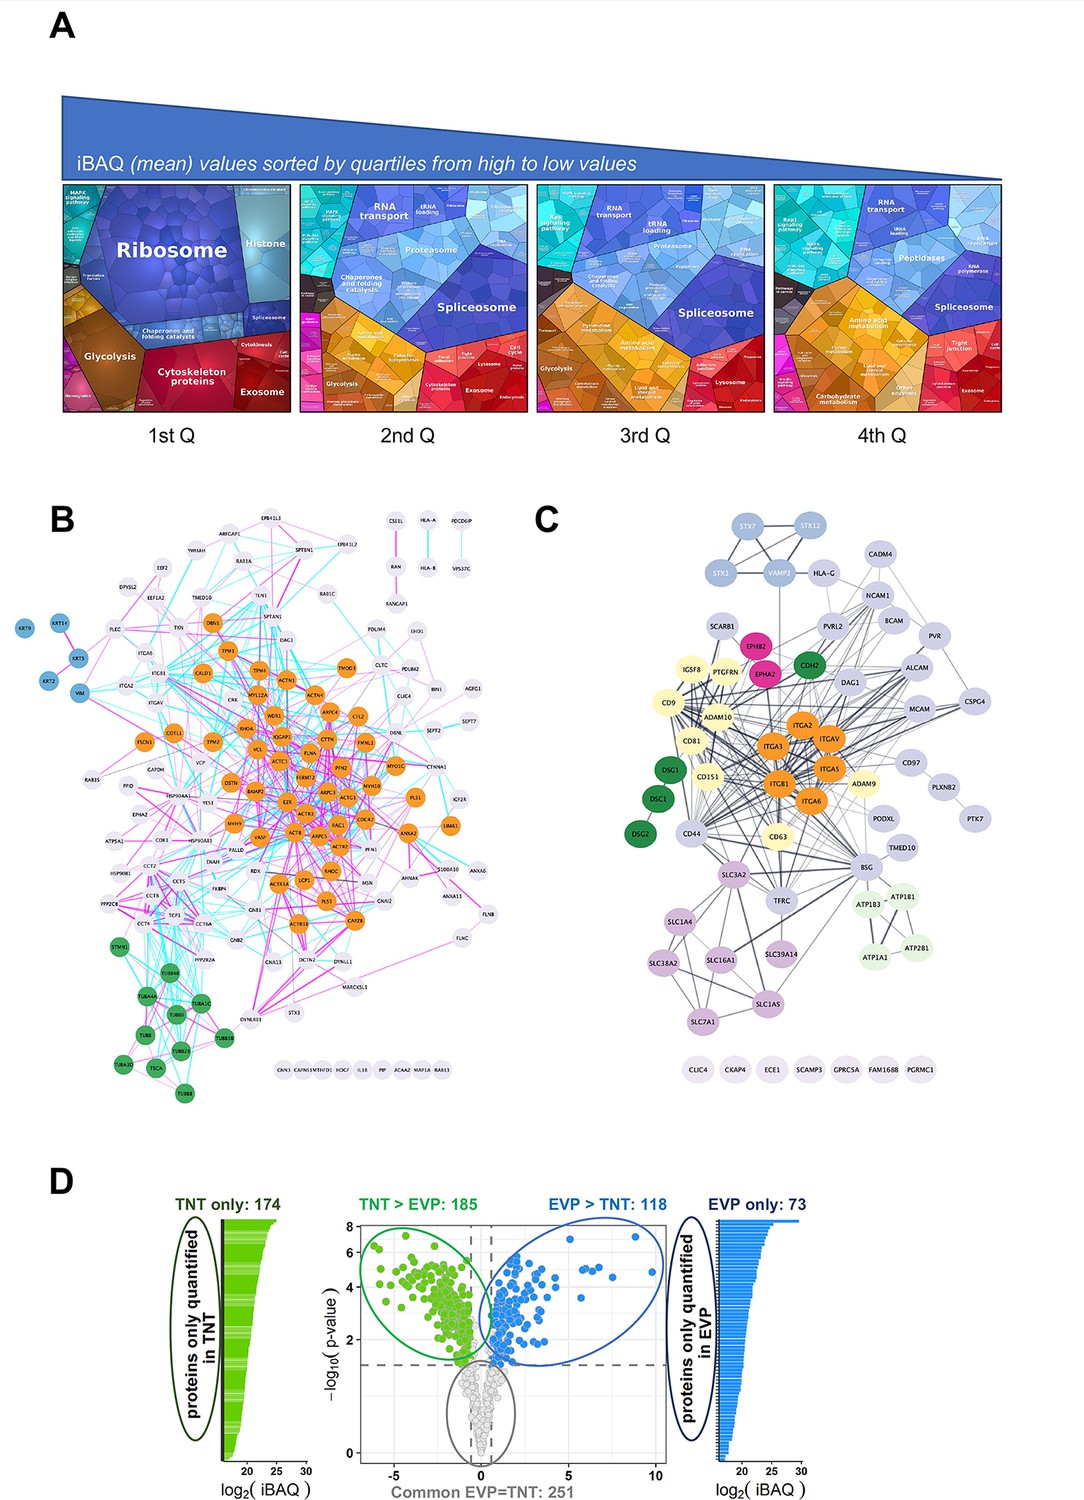
(A) Proteomap of the 1177 proteins of the TNTome, sorted in four quartiles depending on their mean iBAQ. Protein accession and mean iBAQ were used to create ProteoMap, analyzed according to Gene Ontology. (B) STRING physical association network for the cytoskeleton-related proteins listed in Supplementary file 2. Color groups were created using Cytoscape. Green are microtubule-related proteins, blue are intermediate filaments, and orange are actin-interacting proteins. Blue and pink edges show physical interactions based on databases and experiments respectively. (C) Full STRING functional association network for integral surface membrane proteins of TNTome, based on Supplementary file 3. Orange are Integrin proteins, red are Ephrin receptors, dark green are Cadherins, light green are Sodium/potassium transporting ATPase ions channels, purple are monocarboxylate and amino acids transporters, and yellow are tetraspanin-related proteins. (D) Volcano plot of the mass spectrometry analysis based on the four extracellular vesicles and particle (EVP) and tunneling nanotube (TNT) preparations, showing the maximum log2(Fold-change) in the x-axis measured between TNT and EVP fractions and the corresponding -log10 (p-value) in the y-axis. Dashed lines indicate differential analysis quadrants with log2 (Fold-change)=0.58 and false discovery rate FDR = 1%. Common EVP = TNT is non-significantly different (FDR >0.05) with FC >1.5, and FC <1.5. Each quadrant is named above and the number of identified proteins is indicated. Left and right are proteins non-overlapping in both fractions: TNT-only and EVP-only. Note that in EVP-only fraction, 10 proteins were found in TNTome (based on 12 experiments) and should therefore be removed. For the TNT proteins, only the proteins also present in the TNTome have been counted.
Figure 2—figure supplement 1
Comparison of TNTome with Integrin adhesome and other cell proteins.
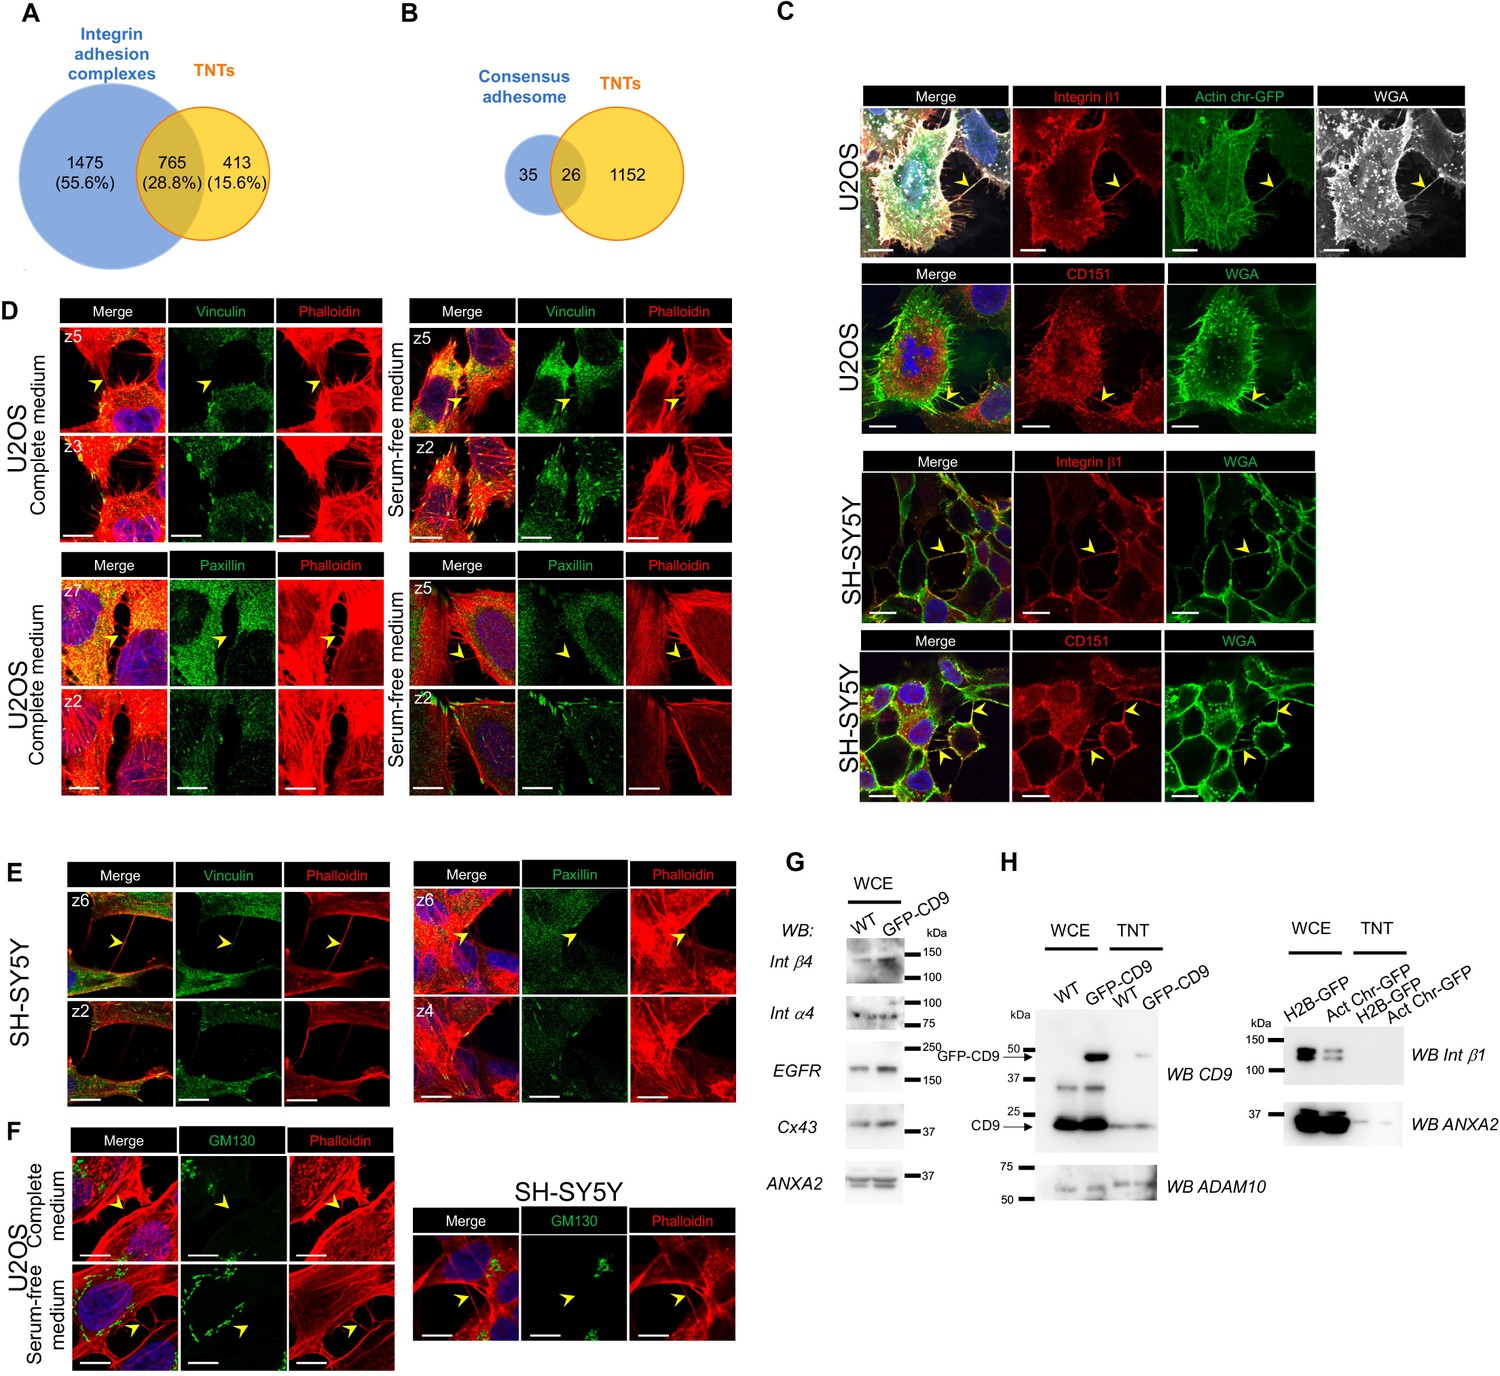
(A) Venn diagram showing common and exclusive proteins between Integrin adhesion complexes (blue circle) and tunneling nanotubes (TNTs) (yellow circle). The percentages refer to total proteins. (B) Venn diagram showing common and exclusive proteins between consensus adhesome (blue circle) and TNTs (yellow circle). (C) Representative immunofluorescence pictures showing expression of Integrin b1 and CD151 in TNTs of U2OS and SH-SY5Y as indicated on the left. Each picture is one upper slice of the stack, TNTs are further characterized by actin presence (actin chromobody-GFP, first lane) or wheat germ agglutinin (WGA) labeling. The yellow arrowheads point to TNTs, scale bars are 10 μm. (D) Representative immunofluorescence pictures showing labeling of Vinculin and Paxillin in U2OS cells cultured in complete medium or serum-free medium for 24 hr before fixation, as indicated on the left. For each labeling, the bottom slice of the stack is shown on the bottom row (z number), upper slice shows a TNT, pointed with the yellow arrowhead. Red is phalloidin staining, blue is DAPI in merge pictures; scale bars are 10 μm. (E) Representative immunofluorescence pictures showing labeling of Vinculin and Paxillin in SY-SY5Y cells, as in D. (F) Representative immunofluorescence pictures showing labeling of GM130 in U2OS cells (left, complete or serum-free medium), and SH-SY5Y cells. The yellow arrowheads point to TNTs, scale bars are 10 μm. (G) Expression of TM proteins in U2OS whole cell extracts (WCE), which are not in TNTome. WB from wild-type (WT) or GFP-CD9 expressing cells, incubated with the following antibodies as indicated on the left: Integrin b4 (Int b4), a4 (Int a4), EGFR and Connexin 43 (Cx43). Annexin A2 (ANXA2) is used as a loading control. WCE from all cell lines have been tested three times, two WCE are shown. (H) Comparative expression of proteins in WCE and TNTs from various U2OS cell lines. Left, CD9, GFP-CD9, and ADAM10 are compared in WT and GFP-CD9 expressing U2OS cells (using non-reducing gels). Right, Int b1 and ANXA2 are compared in H2B-GFP and Actin chromobodies-expressing cells (gels in reducing conditions).
-
Figure 2—figure supplement 1—source data 1
Uncropped and labeled western blots (WBs) for Figure 2—figure supplement 1G.
- https://cdn.elifesciences.org/articles/99172/elife-99172-fig2-figsupp1-data1-v1.zip
-
Figure 2—figure supplement 1—source data 2
Raw unedited western blots (WBs) for Figure 2—figure supplement 1G.
- https://cdn.elifesciences.org/articles/99172/elife-99172-fig2-figsupp1-data2-v1.zip
-
Figure 2—figure supplement 1—source data 3
Uncropped and labeled western blots (WBs) for Figure 2—figure supplement 1H.
- https://cdn.elifesciences.org/articles/99172/elife-99172-fig2-figsupp1-data3-v1.zip
-
Figure 2—figure supplement 1—source data 4
Raw unedited western blots (WBs) for Figure 2—figure supplement 1H.
- https://cdn.elifesciences.org/articles/99172/elife-99172-fig2-figsupp1-data4-v1.zip
Figure 3 with 4 supplements
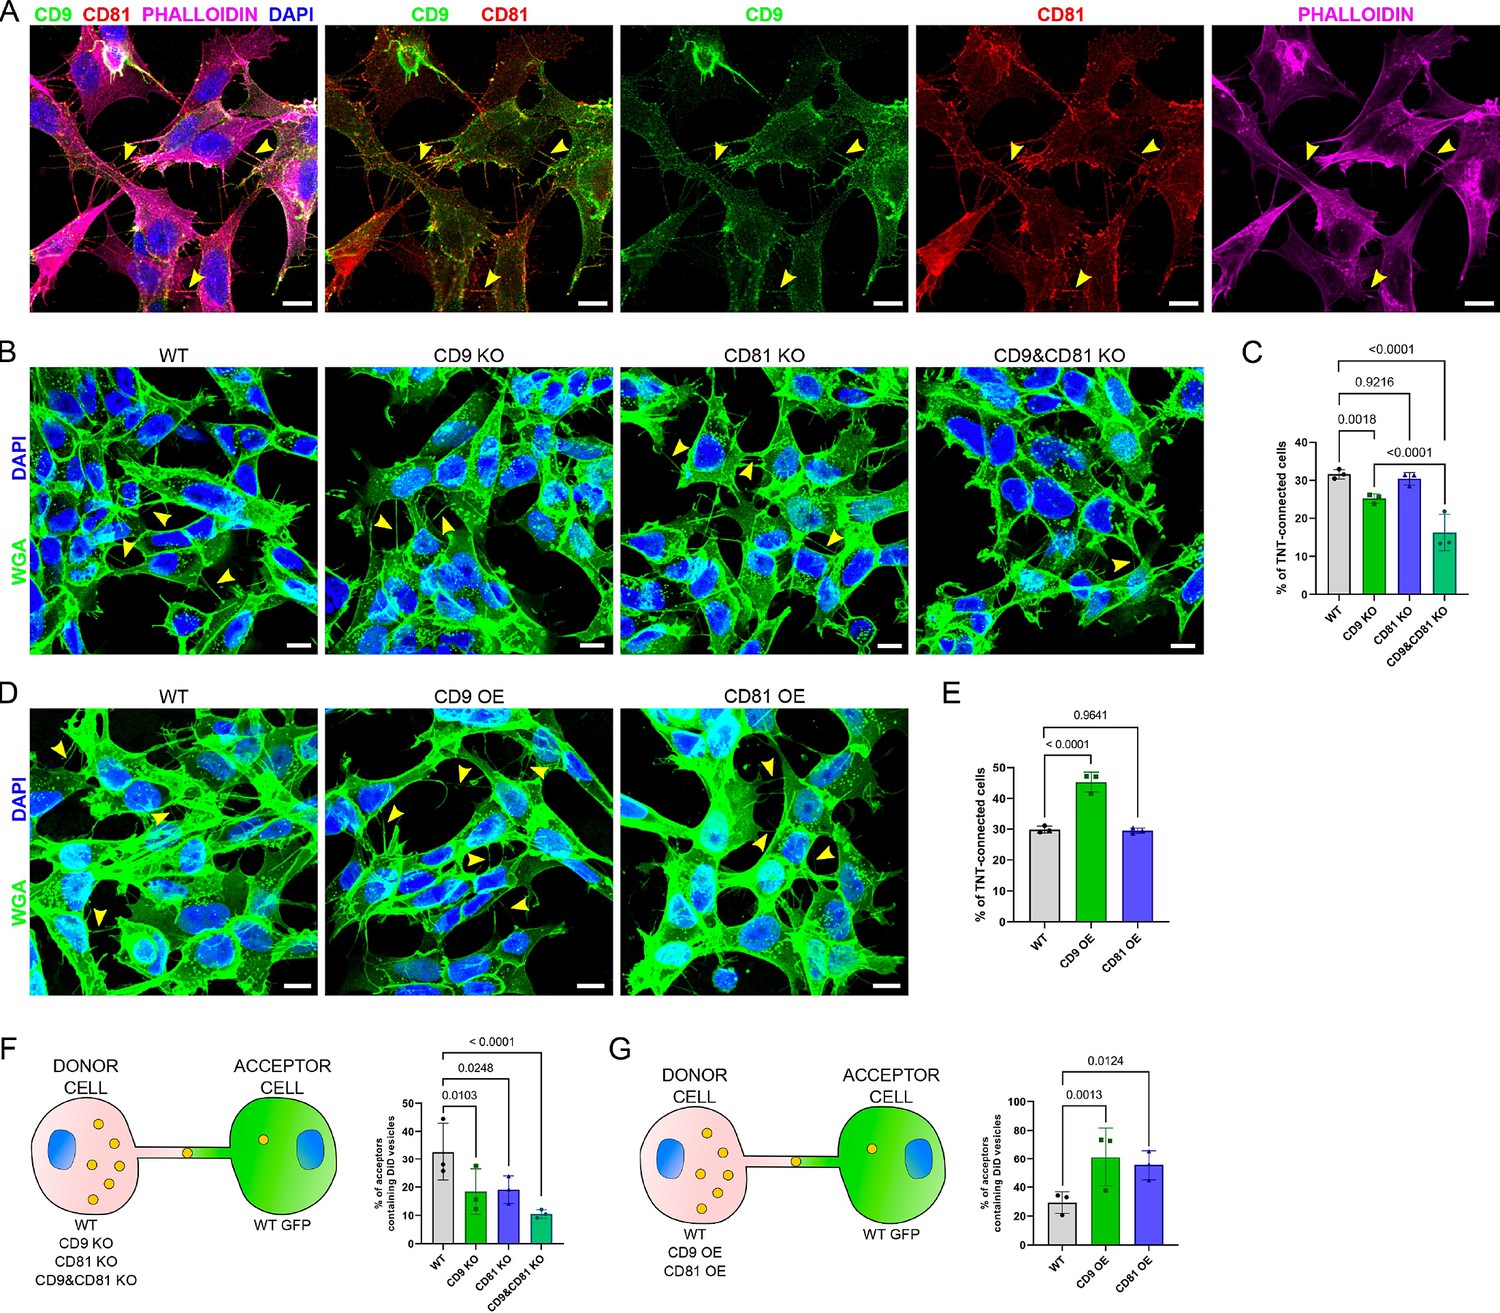
Expression of CD9/CD81 in tunneling nanotubes (TNTs) and effects of their overexpression or invalidation.
(A) Immunofluorescence of CD9 (green) and CD81 (red) in SH-SY5Y cells. Cells were also stained with phalloidin (magenta) and DAPI (blue) to visualize actin and nuclei. This representative image corresponds to the fourth to fifth slices of a stack comprising 11 slices (1 being at the bottom). In A, B, and D, yellow arrowheads point to TNTs that are visible in the shown pictures, however, more TNTs were counted over the whole stack, which were not annotated on the figure. Scale bars correspond to 10 µm. (B) Representative images of TNT-connected cells in wild-type (WT), CD9 KO, CD81 KO, and CD9 and CD81 KO cells (max projection of 4–7 upper slices, z-step 0.4 µm), stained with WGA-488 (green) to label the membrane and DAPI (blue) to label the nuclei. (C) Graph of the percentage of TNT-connected cells in the different cells, from three independent experiments. Mean and standard deviation (SD) are: WT = 31.6 ± 1.25; CD9 KO = 25.2 ± 1.24; CD81 KO = 30.4 ± 1.65; CD9 and CD81 KO = 16.3 ± 4.81. p-values are indicated above the brackets in all graphs. (D) Representative images (max projection of 5–7 upper slices, z-step 0.4 μm) of TNT-connected cells in WT, CD9 OE, and CD81 OE cells, stained as in B. (E) Graph of the percentage of TNT-connected cells in the indicated cells from three independent experiments. Mean ± SD are: WT = 29.8 ± 1.11; CD9 OE = 45.3 ± 3.17; CD81 OE = 29.5 ± 0.84. (F) Vesicle transfer assay from donor cells knock-out (KO) of CD9 and CD81, as schematized on the left. Graphs are percentage of acceptor cells containing DiD vesicles from three independent experiments. Mean ± SD are: WT = 32.7 ± 10.25; CD9 KO = 18.4 ± 8; CD81 KO = 19.1 ± 4.86; CD9 and CD81 KO = 10.5 ± 1.52. (G) Vesicle transfer assay from donor cells OE CD9 or CD81, as schematized on the left. Graphs are percentage of acceptor cells containing DiD vesicles from three independent experiments. Mean ± SD are: WT = 29.3 ± 7.45; CD9 OE = 61.3 ± 20.44; CD81 OE = 55.6 ± 10.31.
Figure 3—figure supplement 1
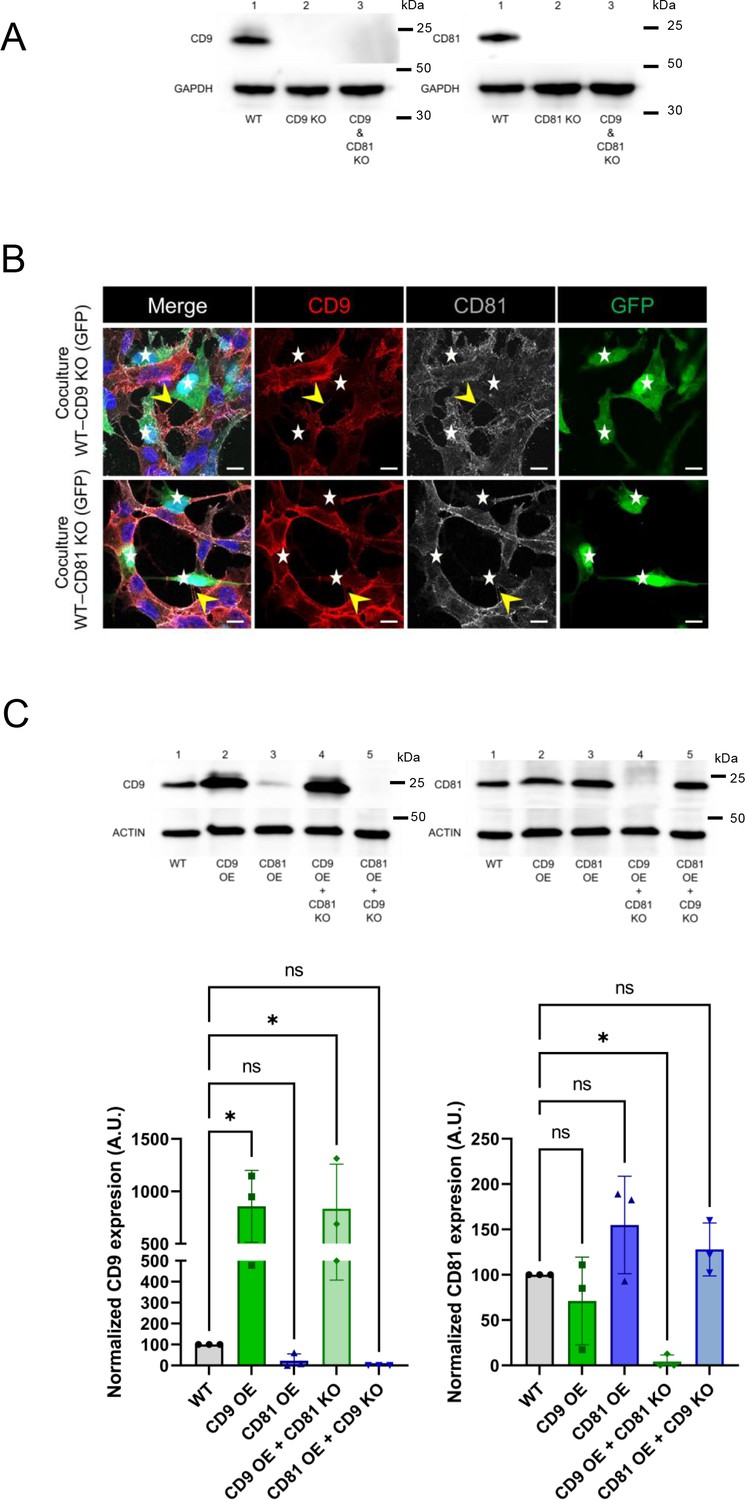
Characterization of cells knock-out (KO) and overexpression (OE) for CD9 or CD81.
(A) Representative western blot (WB) of the tetraspanin KO experiments blotted with CD9 (top left blot) or CD81 (top right blot) and GAPDH-specific antibodies sequentially. Lines of the top left blot correspond to 1: WT cells; 2: CD9 KO cells; 3: CD9 and CD81 KO cells. Lines of the top right blot correspond to 1: WT cells; 2: CD81 KO cells; 3: CD9 and CD81 KO cells. (B) Representative immunofluorescence of coculture of WT SH-SY5Y cells with either CD9 KO cells (first row) or CD81 KO cells (second row), both expressing GFP. Anti-CD9 antibodies are in red (Alexa 546 secondary antibodies), and anti-CD81 (Alexa 633 secondary antibodies) are in grey. KO cells (expressing GFP) are indicated by white stars, yellow arrowheads show tunneling nanotubes (TNTs), and scale bars are 10 μm. (C) Quantification of the total amount of CD9 or CD81 from various cell extracts, blotted with CD9 (left blot) or CD81 (right blot) and actin-specific antibodies sequentially. Lines of the left blot correspond to 1: WT cells; 2: CD9 OE cells; 3: CD81 OE cells; 4: CD9 OE + CD81 KO cells; CD81 OE + CD9 KO cells. Lines of the right blot correspond to 1: WT cells; 2: CD9 OE cells; 3: CD81 OE cells; 4: CD9 OE + CD81 KO cells; CD81 OE + CD9 KO cells. The graphs below show the relative expression of CD9 (bottom left) or CD81 (bottom right) in arbitrary units (A.U.). Bottom left: normalized expression of CD9 in WT cells (100%), CD9 OE cells (857.1%±343.5), CD81 OE cells (23.1%±32.7), CD9 OE +CD81 KO cells (833.4%±425.7) and CD81 OE + CD9 KO cells (0%±0) corresponding to the measurement of three3 independent WBs. Bottom right: normalized expression of CD81 in WT cells (100%), CD9 OE cells (71.1%±48.4), CD81 OE cells (154.9%±53.7), CD9 OE + CD81 KO cells (4.3%±7.4) and CD81 OE + CD9 KO cells (128%±29.3) corresponding to the measurement of three independent WBs. Statistical analysis was performed using Anova with Dunnett posthoc test (ns: p>0.05, *p<0.05).
-
Figure 3—figure supplement 1—source data 1
Uncropped and labeled western blots (WBs) for Figure 3—figure supplement 1A.
- https://cdn.elifesciences.org/articles/99172/elife-99172-fig3-figsupp1-data1-v1.zip
-
Figure 3—figure supplement 1—source data 2
Raw unedited western blots (WBs) for Figure 3—figure supplement 1A.
- https://cdn.elifesciences.org/articles/99172/elife-99172-fig3-figsupp1-data2-v1.zip
-
Figure 3—figure supplement 1—source data 3
Uncropped and labeled western blots (WBs) for Figure 3—figure supplement 1C.
- https://cdn.elifesciences.org/articles/99172/elife-99172-fig3-figsupp1-data3-v1.zip
-
Figure 3—figure supplement 1—source data 4
Raw unedited western blots (WBs) for Figure 3—figure supplement 1C.
- https://cdn.elifesciences.org/articles/99172/elife-99172-fig3-figsupp1-data4-v1.zip
Figure 3—figure supplement 2
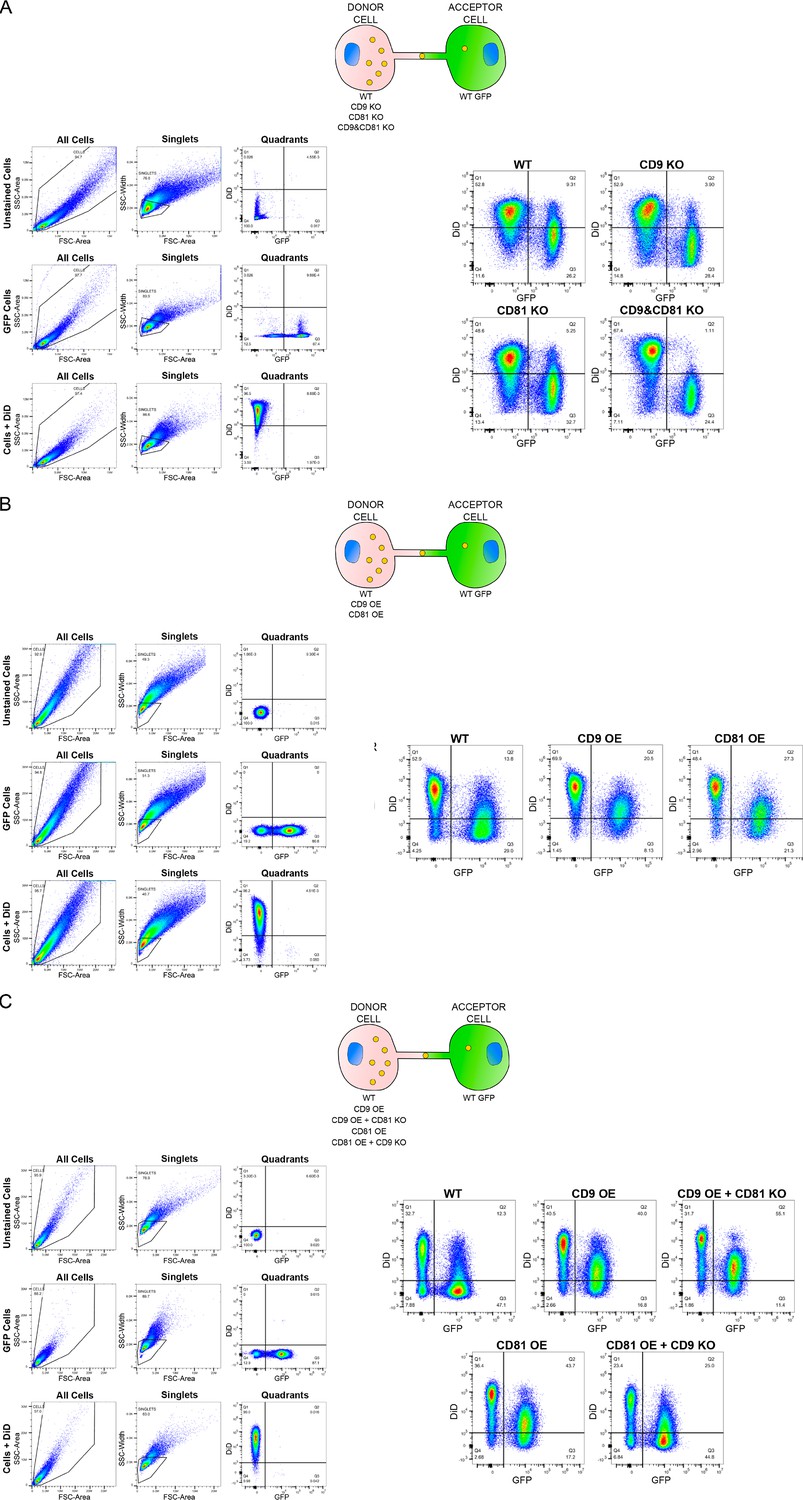
Gate strategy and representative results of all the cocultures.
Schematics of the cocultures are on top of each panel. Gates strategies are framed in blue: wild-type (WT) unstained cells, GFP cells, and DiD + cells were gated to select cells and exclude cellular debris, plotting SSC-Area (Y-axis) with FSC-Area (X-axis) (All Cells). Within the All Cells gate, we selected for single cells to exclude doublets, plotting SSC-Width (Y-axis) with FSC-Area (X-axis) (Singlets). Within the Singlets gate, the quadrants for DiD (Y-axis) and GFP (X-axis) were placed according to the position of the negative or positive populations. Framed in orange are representative plots of the signal of DiD-labeled vesicles (Y-axis) and GFP-labeled acceptor cells (X-axis). The second quadrant (Q2) represents the percentage of double positive cells and thus the acceptor cells that have received vesicles. (A) Coculture of tetraspanins knock-out (KO) cells used as donors (WT, CD9 KO, CD81 KO, and CD9 and CD81 KO) loaded with DiD to stain the vesicles with GFP WT cells. (B) Coculture between tetraspanin overexpression (OE) cells (WT, CD9 OE, CD81 OE) used as donors and WT GFP cells used as acceptors. (C) Coculture between tetraspanin OE + KO cells used as donors (WT, CD9 OE, CD9 OE + CD81 KO, CD81 OE and, CD81 OE + CD9 KO) loaded with DiD to stain the vesicles and WT GFP cells used as acceptors.
Figure 3—figure supplement 3
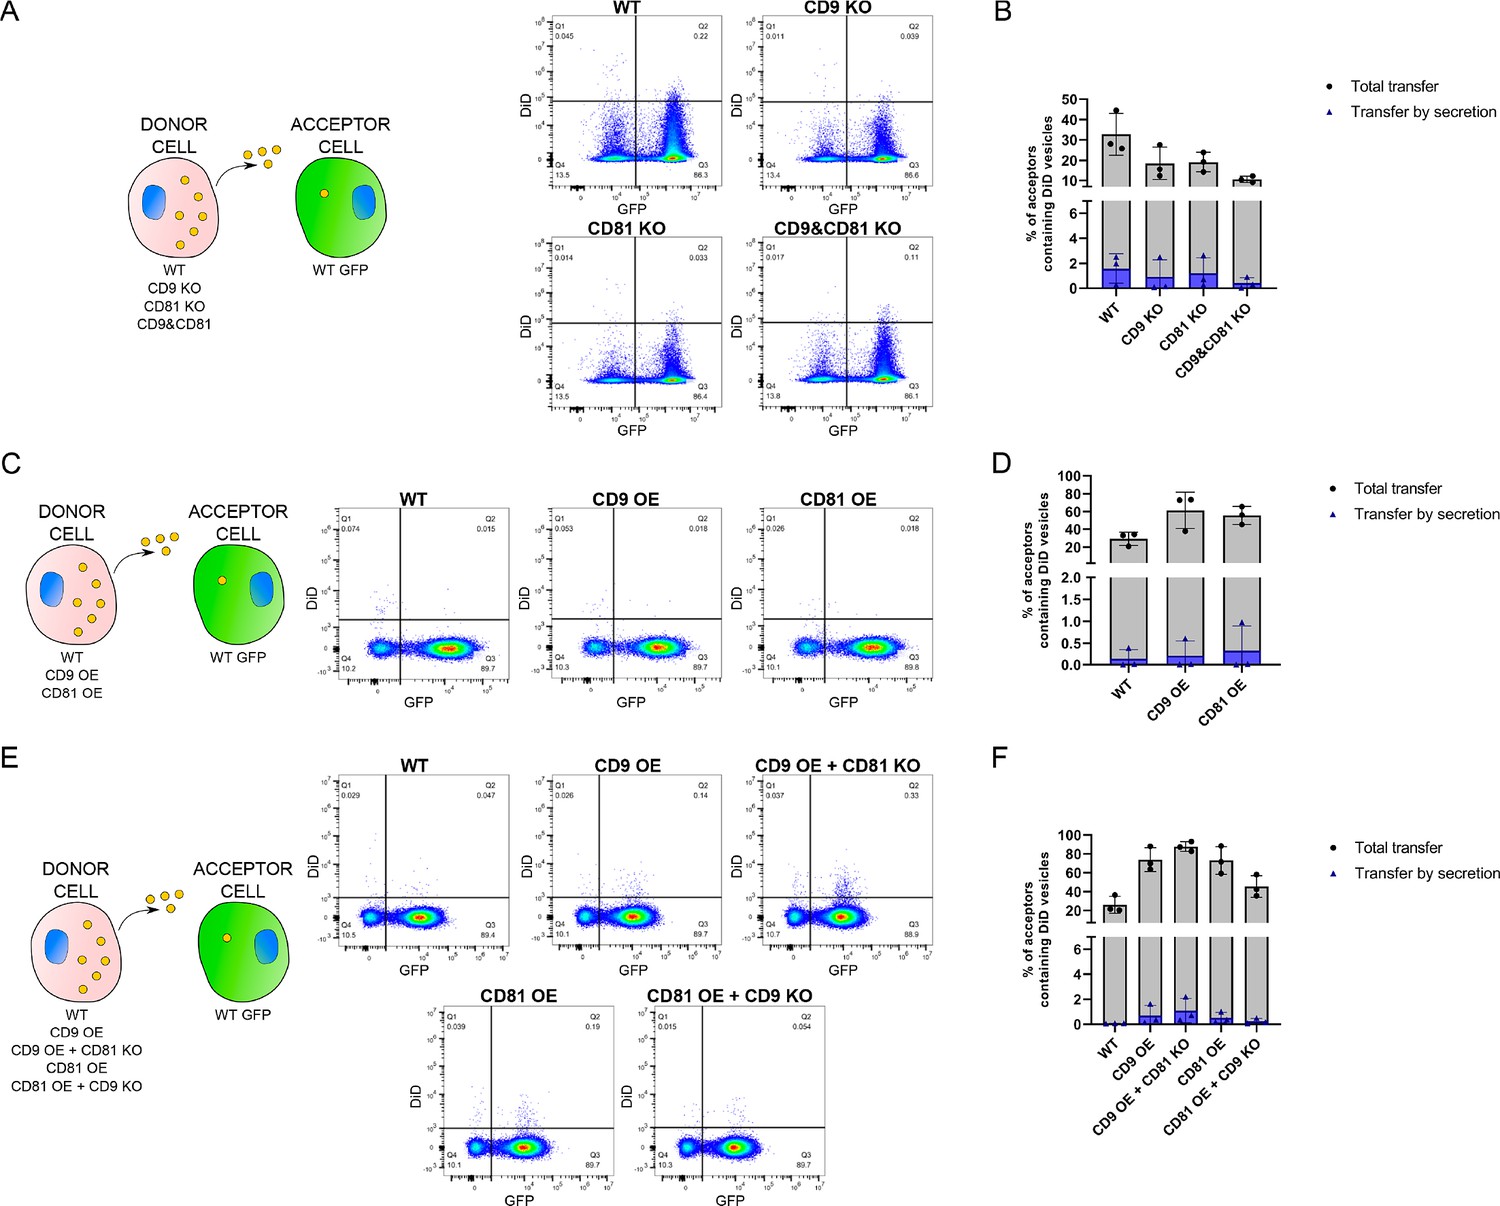
Measurement of transfer by secretion in all the coculture experiments.
Schematics of all experiments are shown on the left. (A) Secretion control in the coculture between tetraspanin knock-out (KO) cells used as donors loaded with DiD to stain the vesicles and wild-type (WT) GFP cells used as acceptors. Representative plots between the signal of DiD-labeled vesicles (Y-axis) and GFP-labeled acceptor cells (X-axis) of vesicle transfer by secretion in cells: WT, CD9 KO, CD81 KO and CD9 and CD81 KO. The second quadrant (Q2) represents the percentage of double positive cells and thus the acceptor cells that have received vesicles. (B) Graph showing the percentage of acceptor cells containing DiD vesicles from the coculture with tetraspanin KO cells used as donors, total and secretion-dependent. Total transfer is the same as in Figure 3F, the percentage of transfer by secretion is shown as always minor and not significantly different between conditions. For secretion, mean and standard deviation of the percentage of acceptor cells containing DiD vesicles are: WT = 1.6 ± 1.18; CD9 KO = 0.9 ± 1.38; CD81 KO = 1.2 ± 1.26; CD9 and CD81 KO = 0.4 ± 0.44 for N=3. (C) Secretion control in the coculture between tetraspanin OE cells used as donors loaded with DiD to stain the vesicles and WT GFP cells used as acceptors. Representative plots between the signal of DiD-labeled vesicles (Y-axis) and GFP-labeled acceptor cells (X-axis) of vesicle transfer by secretion in cells: WT, CD9 OE, and CD81 OE. The second quadrant (Q2) represents the % of double positive cells and thus the acceptor cells that have received vesicles. (D) Graph corresponding to the % of acceptor cells containing DiD vesicles from the coculture with tetraspanin OE cells used as donors, total and secretion-dependent. Total transfer is the same as in Figure 3G, the percentage of transfer by secretion is shown as always minor and not significantly different between conditions. For secretion, mean and standard deviation of the % of acceptor cells containing DiD vesicles: WT = 0.14 ± 0.22; CD9 OE = 0.21 ± 0.34; CD81 OE = 0.33 ± 0.56 for N=3. (E) Secretion control in the coculture between tetraspanin OE + KO cells used as donors loaded with DiD to stain the vesicles and WT GFP cells used as acceptors. Representative plots between the signal of DiD-labeled vesicles (Y-axis) and GFP-labeled acceptor cells (X-axis) of vesicle transfer by secretion in cells: WT, CD9 OE, CD9 OE + CD81 KO, CD81 OE and CD81 OE + CD9 KO. The second quadrant (Q2) represents the percentage of double positive cells and thus the acceptor cells that have received vesicles. (F) Graph corresponding to the percentage of acceptor cells containing DiD vesicles from the coculture with tetraspanin OE + KO cells, total and secretion-dependent. Total transfer is the same as in Figure 5C, the percentage of transfer by secretion is shown as always minor and not significantly different between conditions. For secretion, mean and standard deviation of the percentage of acceptor cells containing DiD vesicles: WT = 0.07 ± 0.02; CD9 OE = 0.71 ± 0.80; CD9 OE + CD81 KO=1.09 ± 0.97; CD81 OE = 0.52 ± 0.42; CD81 OE + CD9 KO=0.24 ± 0.22 for N=3.
Figure 3—figure supplement 4
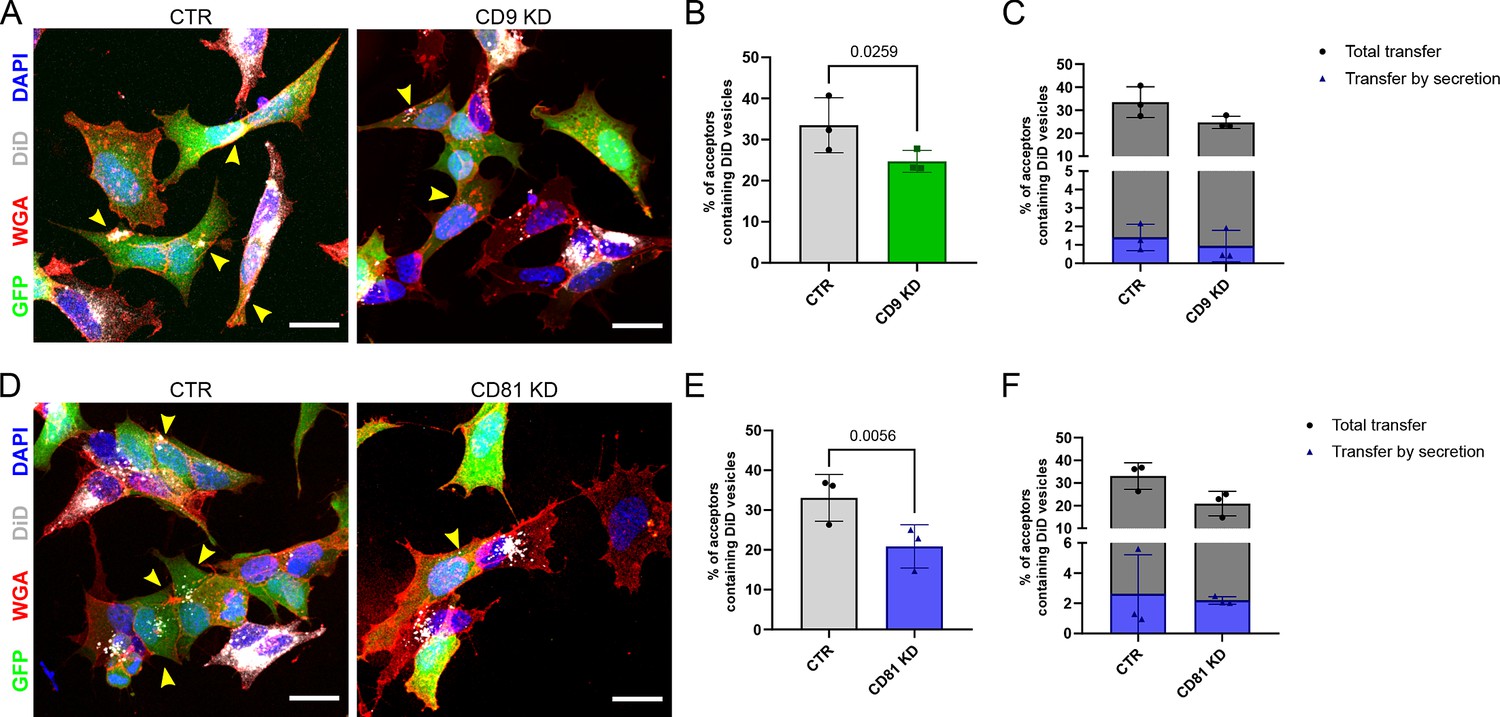
Coculture of DiD-treated wild-type (WT), CD9KD or CD81KD donor cells with GFP-expressing cells as acceptor, and analysis of transfer by microscopy.
(A) Representative confocal micrograph of the cocultures between KD control cells (CTR), or the KD of CD9 (CD9 KD). Human siRNA for CD9 (sequence: GAGCATCTTCGAGCAAGAA) or non-targeting siRNA (CTR from Origene) were transiently transfected into cells using Lipofectamine RNAimax (Invitrogen), in accordance with the manufacturer’s instructions. Experiments were performed 48 hr following transfection. CTR or CD9 KD cells were used as donors and therefore loaded with DiD (white) to stain the vesicles and they were mixed in a ratio 1:1 with acceptors cells that were expressing GFP (green). 24 hr later, cells were fixed and stained with WGA (red) to stain the membranes and DAPI (blue) to stain the nuclei. Yellow arrowheads mark acceptor cells containing DiD-vesicles. The scale bars correspond to 10 μm. (B) Graphs of the coculture represented in A, show the percentage of acceptor cells containing DiD vesicles corresponding to the total transfer from three independent experiments. Mean ± SD are: CTR = 33.5 ± 6.68; CD9 KD = 24.7 ± 2.68. (C) The same graph as in B correspondis to the % of acceptor cells containing DiD vesicles of the coculture represented in A, including the part due to transfer by secretion. Secretion-dependent transfer is minor and not significantly different between the conditions, mean ± SD are: CTR = 1.4 ± 0.72; CD9 KD = 0.92 ± 0.86 for N=3. (D) Representative confocal micrograph of the cocultures between KD control cells (CTR) or the KD of CD81 (CD81 KD). siRNA sequence targeting human CD81 is: GCACCAAGUGCAUCAAGUA. The experiment was performed as described in A. CTR or CD81 KD cells were used as donors and therefore loaded with DiD (white) to stain the vesicles and they were mixed in a ratio 1:1 with acceptors cells that were expressing GFP (green). Yellow arrowheads mark acceptor cells containing DiD-vesicles. The scale bars correspond to 10 μm. (E) Graphs of the coculture represented in D, showing the percentage of acceptor cells containing DiD vesicles corresponding to the total transfer from 3 independent experiments. Mean ± SD are: CTR = 33.1 ± 5.87; CD81 KD = 20.9 ± 5.44. (F) Same graph as in E corresponding to the % of acceptor cells containing DiD vesicles, including the part due to transfer by secretion of the coculture represented in D. Secretion-dependent transfer is minor and not significantly different between the conditions, mean ± SD are: CTR = 2.6 ± 2.6; CD81 KD = 2.2 ± 0.25 for N=3.
Figure 4
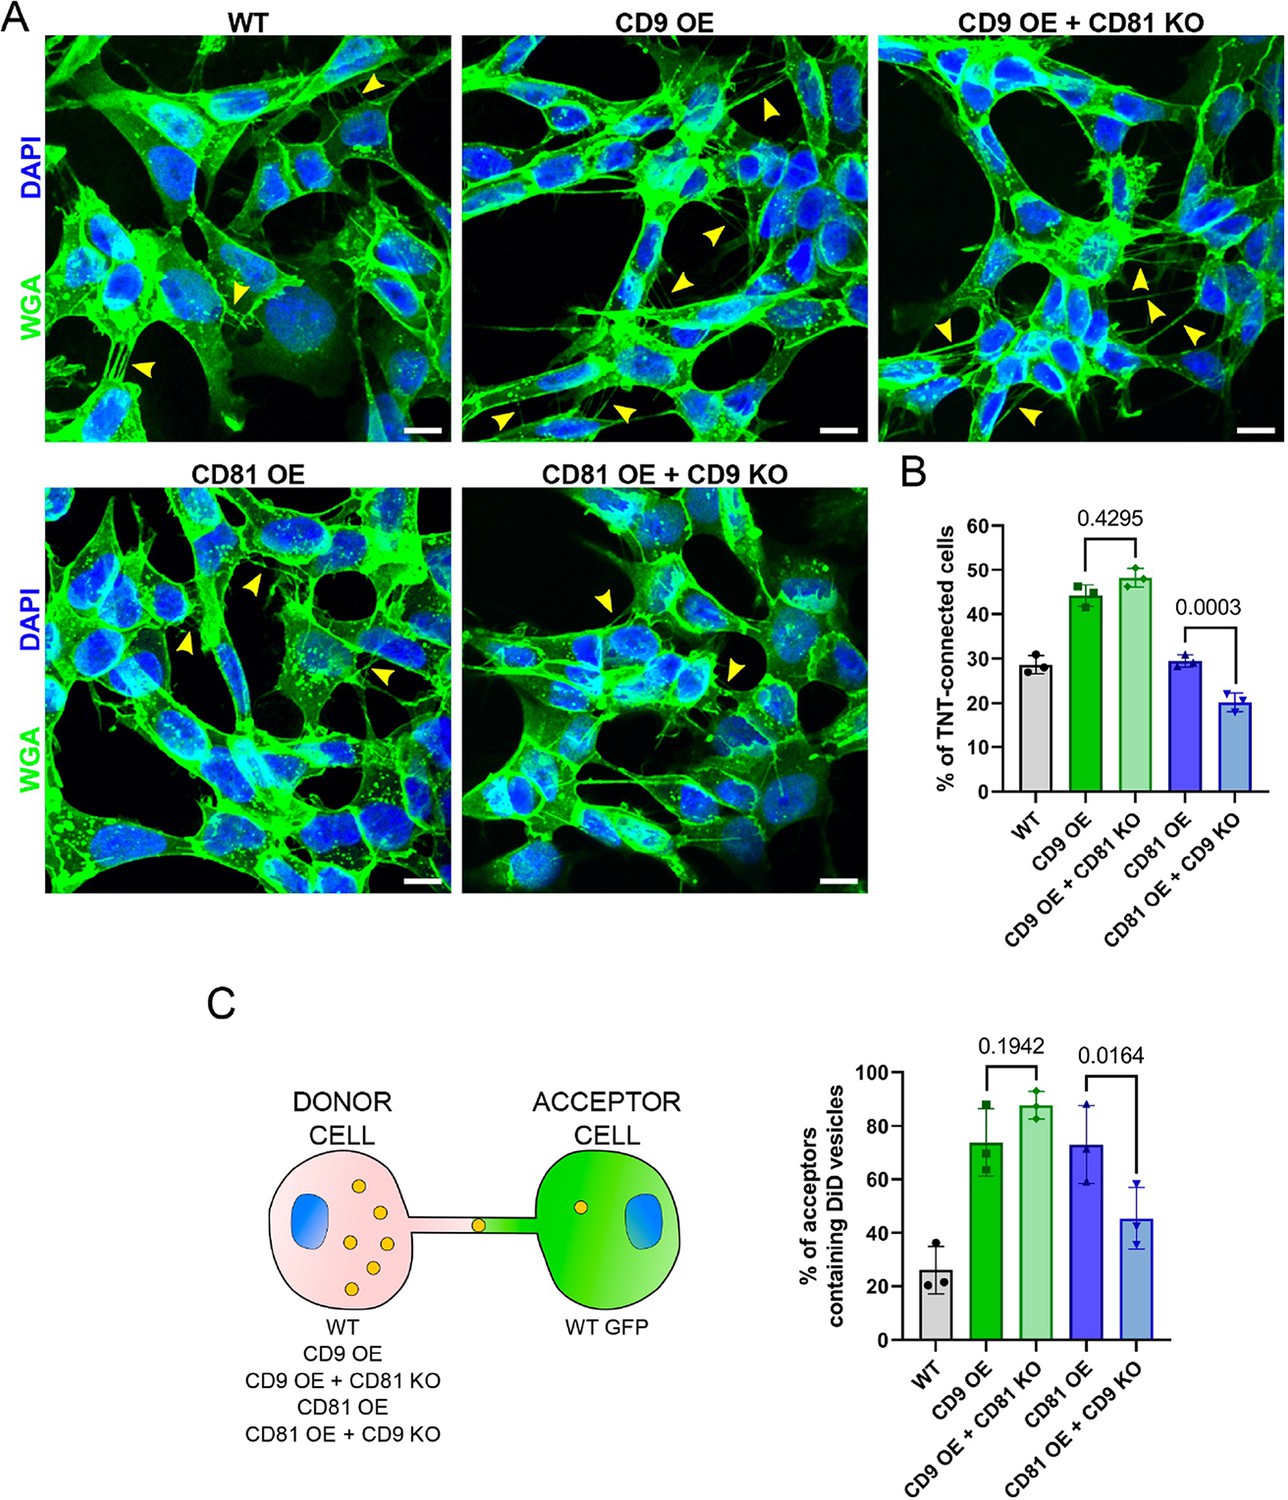
CD9 and CD81 act successively in the formation of tunneling nanotubes (TNTs).
(A) Representative images of wild-type (WT), CD9 OE, CD9 OE + CD81 KO, CD81 OE, and CD81 OE + CD9 knock-out (KO) cells, stained with wheat germ agglutinin (WGA)-488 (green) and DAPI (blue). Yellow arrowheads show TNTs. Scale bars correspond to 10 µm. (B) Graph of the percentage of TNT-connected cells in the tetraspanin overexpression (OE) + KO cells. Mean ± SD (N=3) are: WT = 28.6 ± 2.05; CD9 OE = 44.2 ± 2.4; CD9 OE + CD81 KO=48.2 ± 2.16; CD81 OE = 29.5 ± 1.36; CD81 OE + CD9 KO=20.2 ± 2.09. p-values are above the brackets. (C) Coculture between tetraspanin OE + KO cells used as donors and WT GFP cells used as acceptors, as schematized on the left. The graph shows the percentage of acceptor cells containing DiD vesicles. Mean ± SD from three independent experiments: WT = 26.1 ± 8.94; CD9 OE = 73.8 ± 12.64; CD9 OE + CD81 KO=87.7 ± 5.11; CD81 OE = 73 ± 14.60; CD81 OE + CD9 KO=45.4 ± 11.53.
Figure 5 with 1 supplement
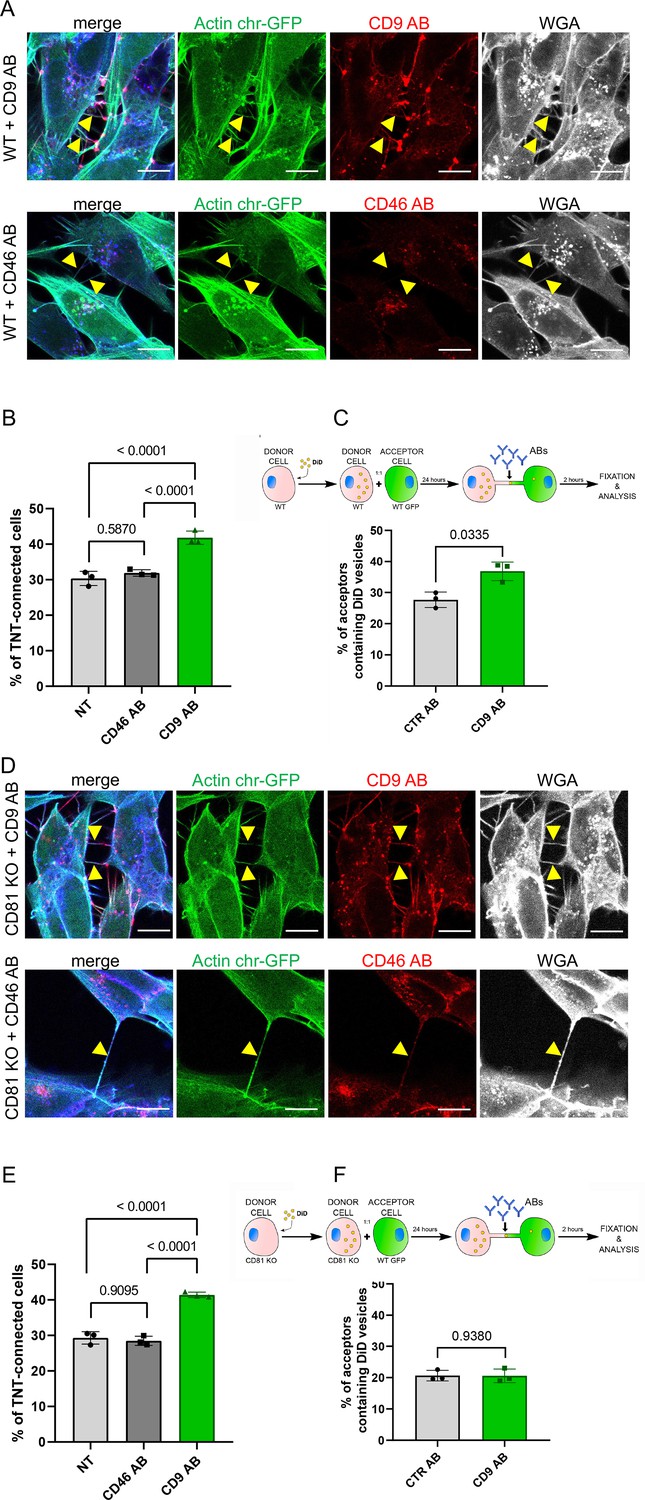
CD9 and CD46 antibody treatment in wild-type (WT) and CD81 knock-out (KO) cells.
(A) Representative confocal images of Actin chromo body-GFP expressing WT cells, treated for 3 hr with either anti-CD9 antibody coupled to Alexa Fluor 568 (upper row), or with anti-CD46 antibody coupled to to Alexa Fluor 594 (second row). Alexa-647 coupled wheat germ agglutinin (WGA) and DAPI were added post-fixation. The images correspond to a maximal projection of three or four slices of the z-stack encompassing the tunneling nanotubes (TNTs) indicated with yellow arrowheads. The scale bars correspond to 10 µm. (B) Graph of the percentage of TNT-connected cells in NT, CD46 AB, or CD9 AB treatment in WT cells. Mean percentages ± SD (N=3) are 30.4, 31.9 and 41.8, p-values resulting from statistical analysis are indicated above the brackets. (C) Top, schematic of the antibody treatment experiment after coculture of WT SH-SY5Y donor cells (DiD in yellow circles to stain the vesicles) and WT GFP-labeled acceptor cells, treated with control antibodies (CTR AB) or with antibodies anti-CD9 (CD9 AB) for an additional 2 hr. Graph represents the percentage of acceptor cells containing DiD vesicles of the cocultures of WT cells with CTR AB or CD9 AB treatment. Mean ± SD (N=3) are: CTR AB = 27.7 ± 2.48; CD9 AB = 36.8 ± 3.03. (D) Representative confocal images as in A except that CD81 KO cells were used. (E) Graph of the percentage of TNT-connected cells in NT, CD46 AB, or CD9 AB treatment in CD81 KO cells. Mean percentages ± SD (N=3) are 29.3, 28.5 and 41.4, p-values resulting from statistical analysis are indicated above the brackets. (F) Top, schematic of the antibody treatment experiment after coculture of CD81 KO SH-SY5Y donor cells (DiD in yellow circles to stain the vesicles) and WT GFP-labeled acceptor cells, treated with control antibodies (CTR AB) or with antibodies anti-CD9 (CD9 AB) for an additional 2 hr. Graph represents the percentage of acceptor cells containing DiD vesicles, mean percentages ± SD (N=3) are: CTR AB = 20.6 ± 1.67; CD9 AB = 20.6 ± 2.16.
Figure 5—figure supplement 1
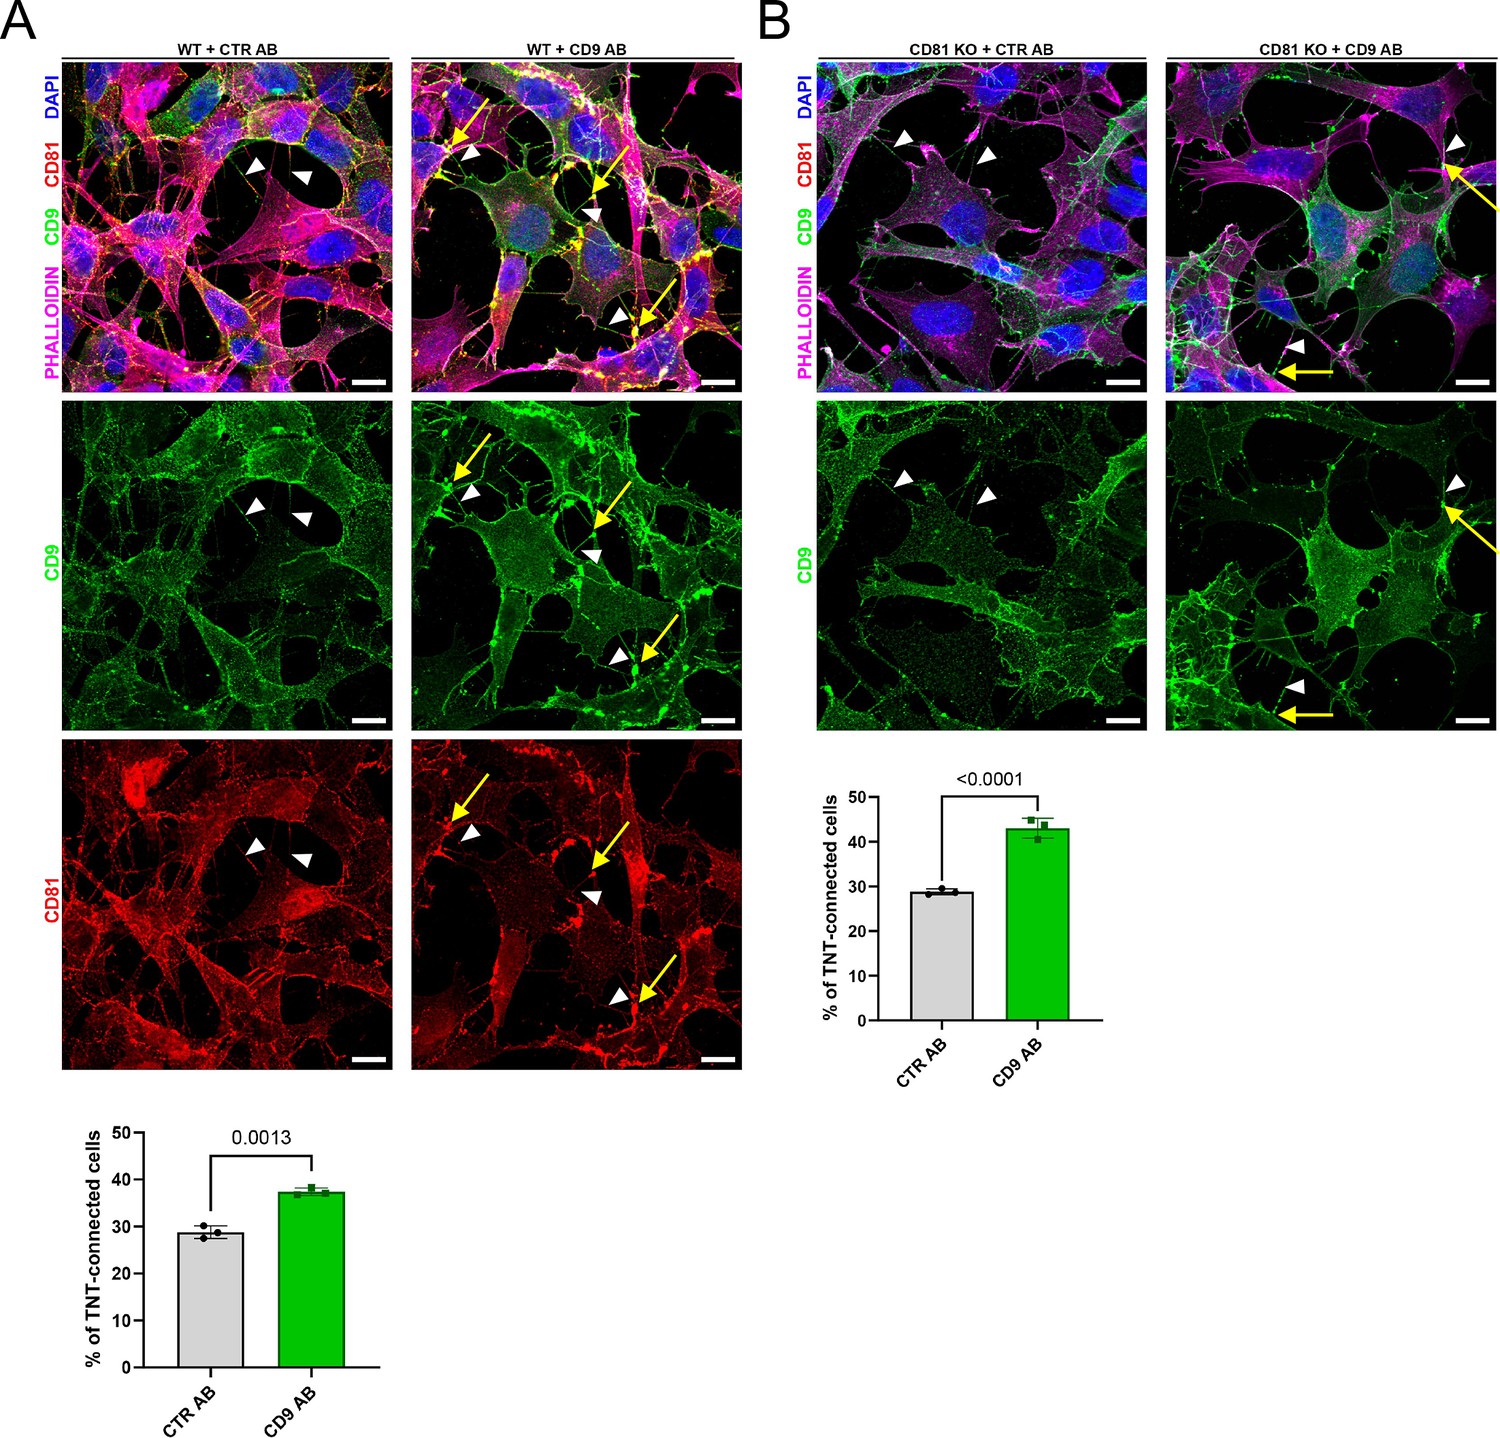
CD9 vs. CTR antibody treatment in wild-type (WT) and CD81 knock-out (KO) cells.
(A) Immunofluorescence of CD9 (green) and CD81 (red) in SH-SY5Y WT cells treated with control antibodies (CTR AB) or with antibodies anti-CD9 (CD9 AB) for 2 hr followed by PFA fixation and incubation with anti-CD81 (for CD9 AB samples) or anti-CD81 +anti-CD9 (for CTR AB samples) and appropriate fluorescent secondary antibodies. This representative image corresponds to the third to fourth slices of a stack comprising 12 slices for CTR AB and to the third to fourth slices of a stack comprising 11 slices for CD9 AB. Cells were also stained with phalloidin (magenta) and DAPI (blue) to visualize actin and nuclei respectively. White arrowheads show tunneling nanotubes (TNTs), and yellow arrows highlight the CD9 and CD81 clustering areas. The scale bars correspond to 10 μm. Below is the graph of the percentage of TNT-connected cells. Mean ± SD (N=3) are: CTR AB = 28.8 ± 1.32; CD9 AB = 37.4 ± 0.80. (B) Immunofluorescence of CD9 (green) in SH-SY5Y CD81 KO cells treated with control antibodies (CTR AB) or with antibodies anti-CD9 (CD9 AB) for 2 hr followed by PFA fixation and incubation with anti-CD9 (for CTR AB samples) and appropriate fluorescent secondary antibodies. This representative image corresponds to the third to fourth slices of a stack comprising 10 slices for CTR AB and to the fifth to six slices of a stack comprising 12 slices for CD9 AB. Cells were also stained with phalloidin (magenta) and DAPI (blue) to visualize actin and nuclei respectively. White arrowheads show TNTs, and yellow arrows highlight the CD9 clustering area Scale bars are 10 μm. Below is the graph of the percentage of TNT-connected cells. Mean ± SD (N=3): CTR AB = 28.8 ± 0.68; CD9 AB = 43 ± 2.23.
Figure 6 with 6 supplements
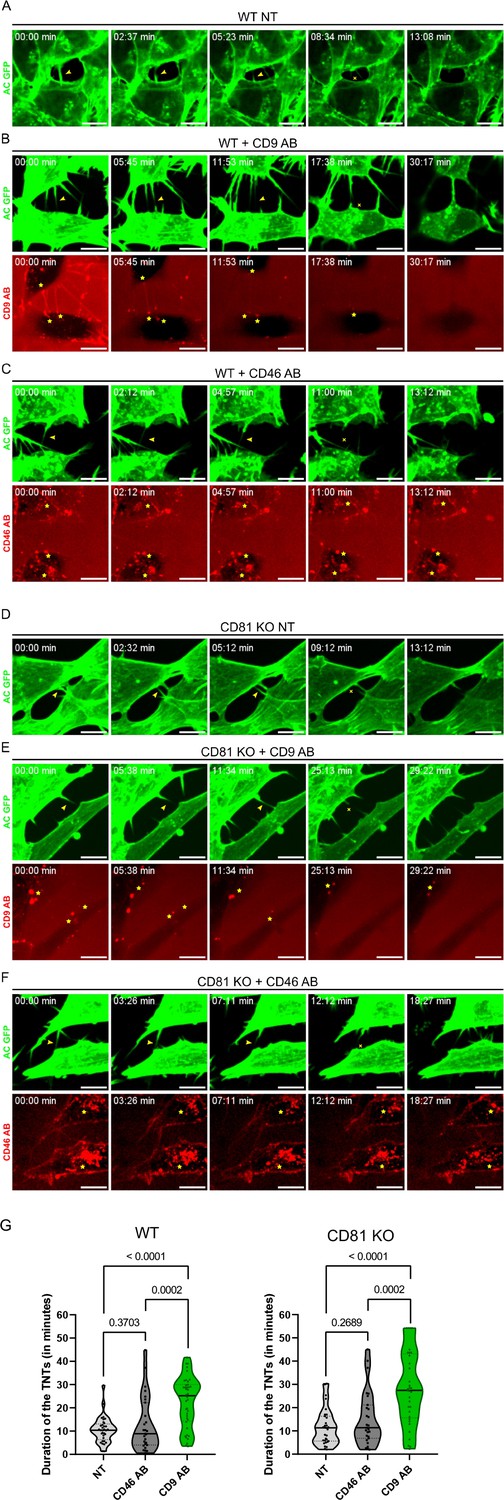
Stabilization of tunneling nanotubes (TNTs) by CD9 AB.
(A) Representative snapshots of a TNT over time from Figure 6—video 1, corresponding to non-treated wild-type (WT) SH-SY5Y cells (WT NT). In A-F, green panels correspond to the signal of actin chromobody-GFP (AC GFP). Yellow arrowheads in the green panels are pointing to TNTs and the yellow crosses mark the breakage/dissociation of the TNT. Yellow stars in red panels mark the accumulation of CD9 AB (at the base/tip of the TNTs) or CD46 AB (intracellularly). Scale bars correspond to 10 µm. (B) Representative snapshots of TNTs over time from Figure 6—video 2, corresponding to WT SH-SY5Y cells treated with 10 µg/mL of CD9 specific antibody (WT + CD9 AB). Red panel corresponds to the signal of the CD9 antibody coupled to Alexa Fluor 568. (C) Representative snapshots of TNTs over time from Figure 6—video 3, corresponding to WT SH-SY5Y cells treated with 10 µg/mL of CD46 specific antibody (WT + CD46 AB), coupled to Alexa Fluor 594 (red panel). (D) Representative snapshots of a TNT over time from Figure 6—video 4, corresponding to non-treated CD81 KO SH-SY5Y cells (CD81 KO NT). (E) Representative snapshots of TNTs over time from Figure 6—video 5, corresponding to CD81 KO SH-SY5Y cells treated with 10 µg/mL of CD9 specific antibody (CD81 KO +CD9 AB), coupled to Alexa Fluor 568. (F) Representative snapshots of TNTs over time from Figure 6—video 6, corresponding to CD81 KO SH-SY5Y cells treated with 10 µg/mL of CD46 specific antibody (CD81 KO +CD46 AB) coupled to Alexa Fluor 594. (G) Average duration of TNTs in WT (left) or CD81 KO cells (right), measured by live imaging from three independent experiments, and represented in Violin plots (with the line at the median). Left: The mean lifetime of 33 TNTs in WT non-treated (NT) cells was 10.5 min (±5.59), and 12.8 min (±11.68) in 27 TNTs measured for WT cells treated with CD46 AB, while for WT cells treated with CD9 AB the average duration of the 40 TNTs measured was 22.6 min (±10.87). Right: mean lifetime of TNTs in CD81 KO non-treated (NT) cells, CD81 KO cells treated with CD46 AB, and CD81 KO cells treated with CD9 AB. The average lifetime of 31 TNTs in CD81 KO NT cells was 11.7 min (±7.78), 15.3 min (±11.70) in 27 TNTs in CD81 KO cells treated with CD46 AB, while the average duration of 33 TNTs in CD81 KO cells treated with CD9 AB was also 28.2 min (±15.66). Statistical analysis was performed using one-way Anova with Holm-Sidak’s multicomparison test.
Figure 6—video 1
Representative video of the stability measurement of tunneling nanotubes (TNTs) in wild-type (WT) SH-SY5Y cells non-treated with any antibody.
The persistence of pre-established TNTs was evaluated using time-lapse microscopy. Cells were expressing actin-chromobody (AC)-GFP to mark the actin (in green) and therefore to enable visualization of the TNTs. The interval between frames is 8.3 s, max projection of the 14 upper slices (step size 0.4 µm) is shown. The scale bar represents 10 µm. See also Figure 6A.
Figure 6—video 2
Representative time-lapse microscopy video of tunneling nanotubes (TNTs) in SH-SY5Y WT cells as in Figure 6—video 1, except that cells were treated with 10 µg/mL of CD9-Alexa 568 antibody.
Time 0 of the video is 1 hr after the addition of the antibody. The interval between frames is 23 s, max projection of the eight upper slices (step size 0.4 µm) is shown. The scale bar represents 10 µm. See also Figure 6B.
Figure 6—video 3
Representative time-lapse microscopy video of tunneling nanotubes (TNTs) in SH-SY5Y wild-type (WT) cells treated with 10 µg/mL of CD46 antibody, as in Figure 6—video 2.
Time 0 of the video is 1 hr after the addition of the antibody, the interval between frames is 33 s, max projection of the 16 upper slices (step size 0.4 µm) is shown. The scale bar represents 10 µm. See also Figure 6C.
Figure 6—video 4
Representative time-lapse microscopy video of tunneling nanotubes (TNTs) in SH-SY5Y CD81 KO cells non-treated with any antibody, as in Figure 6—video 1.
The interval between frames is 8 s, max projection of the 11 upper slices (step size 0.4 µm) is shown. The scale bar represents 10 µm. See also Figure 6D.
Figure 6—video 5
Representative time-lapse microscopy video of tunneling nanotubes (TNTs) in SH-SY5Y CD81 KO cells treated with 10 µg/mL of CD9 antibody, as in Figure 6—video 2.
Time 0 of the video is 2 hr after the addition of the antibody. The interval between frames is 17.8 s, max projection of the 15 upper slices (step size 0.4 µm) is shown. The scale bar represents 10 µm. See also Figure 6E.
Figure 6—video 6
Representative time-lapse microscopy video of tunneling nanotubes (TNTs) in SH-SY5Y CD81 KO cells treated with 10 µg/mL of CD46 antibody.
Time 0 of the video is 2 hr after the addition of the antibody. The interval between frames is 18.8 s, max projection of the 16 upper slices (step size 0.4 µm) is shown. The scale bar represents 10 µm. See also Figure 6F.
Figure 7 with 3 supplements
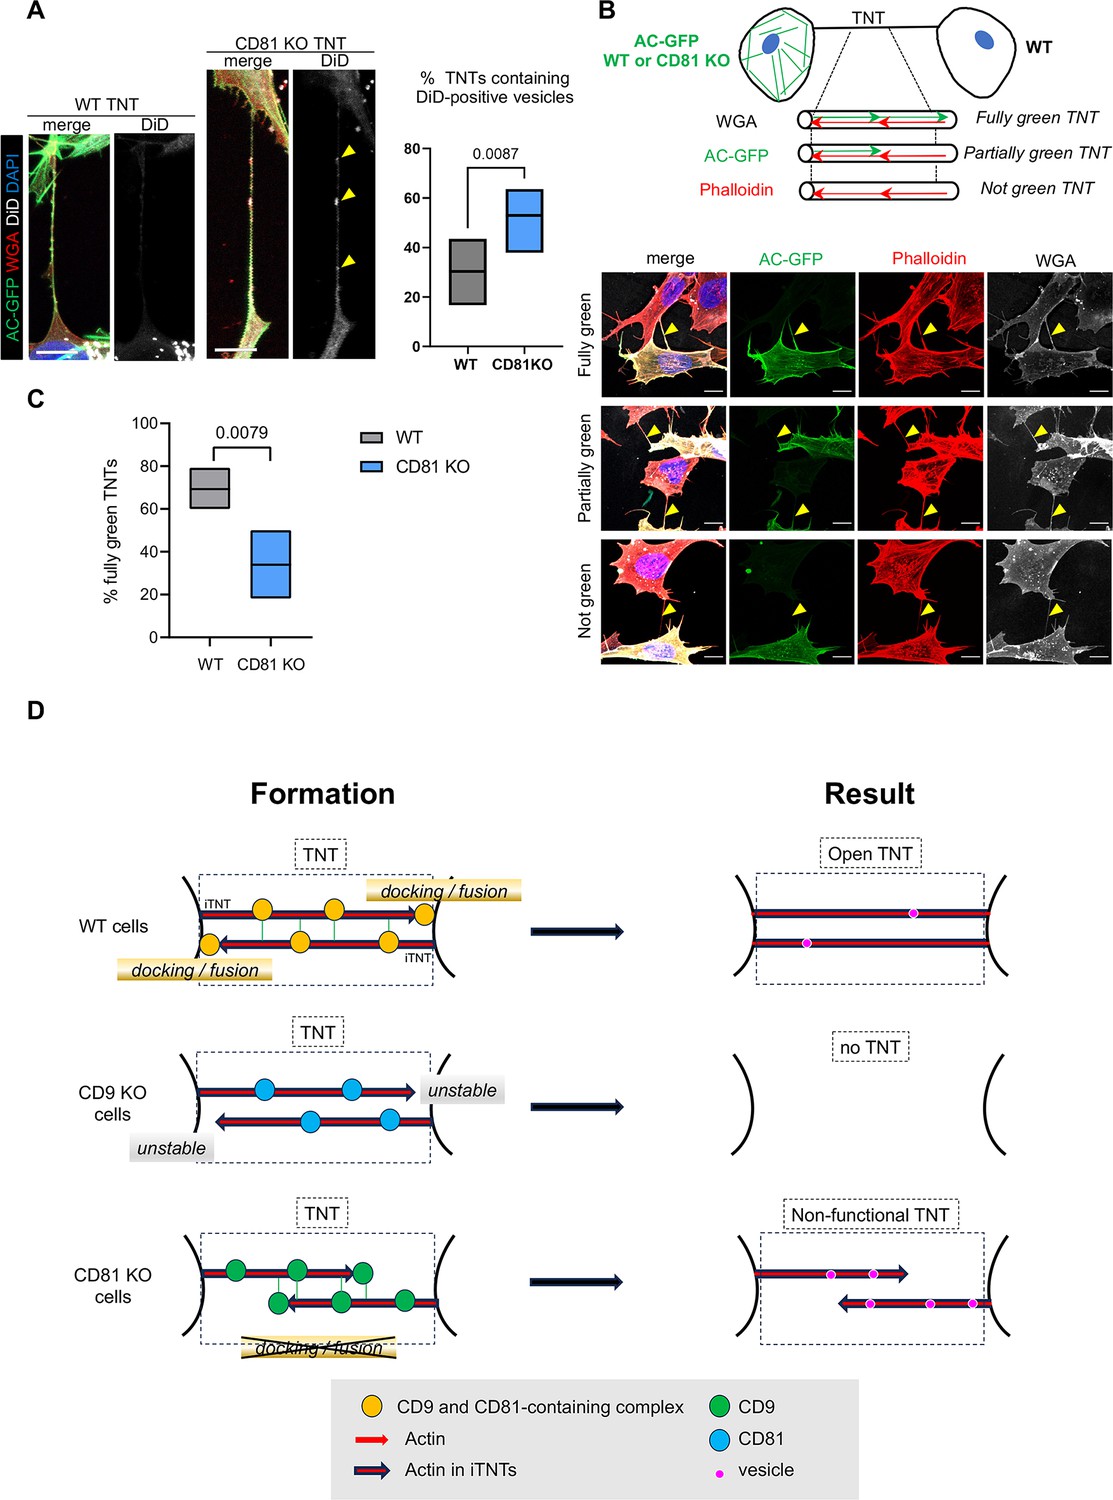
Completion of tunneling nanotubes (TNTs) by CD81.
(A) DiD vesicles in TNTs from wild-type (WT) or CD81 KO cells. Actin chromobody-expressing SH-SY5Y cells, either WT or CD81 KO, were challenged with DiD for 30 min and fixed to preserve TNTs after 8 or 24 hr. After additional wheat germ agglutinin (WGA) staining, TNTs (above 10 µm in length) were identified by confocal microscopy using a WGA channel, and classified according to their content in DiD vesicles. Left is shown representative examples of long TNTs containing (projection of 12 slices of 0.19 µm) or not (projection of 7 slices) DiD-positive vesicles, from CD81 knock-out (KO) and WT cells respectively. Scale bars are 10 µm, and yellow arrowheads point to DiD-positive vesicles in the TNT. The floating bar graph on the right shows the percentage of TNTs that contain DiD-positive vesicles from six independent experiments (min to max results, line at means (30.3 and 53.0), medians are 33.4 and 53.7). Statistical analysis is the Mann-Whitney test, p-value is above the brackets. TNT number per experiment: 21, 23, 19 (8 hr of treatment), 6, 30, 41 (24 hr of treatment) for WT cells; 22, 17, 29 (8 hr of treatment), 17, 22, 29 (24 hr of treatment) for CD81KO cells. See also Figure 7—videos 1–3. (B) Coculture of actin chromobody-GFP-expressing cells (WT or CD81 KO) with WT cells. After fixation, cells were additionally labeled with WGA (Alexa 647, in white) and Phalloidin-Rhodamin (red). TNTs were identified by confocal imaging and classified as schematized above the diagrams: fully green when red and green signals overlapped throughout the structure (exemplified in the first row of pictures), partially or not green when green signal was interrupted or not present at all in the TNTs (exemplified in second and third rows respectively). First and third rows are maximal projections of six and seven slices (of 0.19 µm) encompassing the TNT of WT-WT coculture, the second row is a maximal projection of five slices of CD81 KO-WT coculture. Yellow arrowheads point to TNTs. Scale bars are 10 µm. (C) Quantification of the percentage of fully green TNTs in the cocultures of panel B, from five independent experiments (approximately 20 TNTs per condition and experiment, in total 91 and 92 analyzed TNTs from WT-WT and CD81 KO-WT cocultures respectively). Floating bars are min to max results, line at means (69.3 and 34%), medians are 66.7 and 27.8%, and statistical analysis was the Mann-Whitney test. (D) Working model of CD9/CD81 roles on TNT formation. TNTs (black dotted-line frame) are made up of iTNTs, supported by actin (red arrows). In WT cells, CD9 and CD81 are present on growing iTNT (probably together with additional interactors, indicated as a yellow circle), and CD9 stabilizes them. At the junction between iTNT and the opposing cell membrane, CD81 participates in membrane docking/ fusion, which results in the full completion of an open, functional TNT (right panel). When cells are treated with CD9AB, the active complexes are further enriched/stabilized, and more TNTs are stabilized. In CD9 KO cells, growing iTNTs are not stabilized, resulting in the decrease of TNT number. In CD81 KO cells, CD9-containing complexes (green circles) are still active for stabilization of iTNTs but anchoring of the iTNTs to opposite cell/fusion is no longer induced by CD81, resulting in apparent, but non-functional TNTs, in which vesicles (purple circles) are trapped.
Figure 7—video 1
Time-lapse microscopy video of DiD-labeled vesicles (purple) passing from one cell to another through a tunneling nanotube (TNT) in SH-SY5Y WT cells expressing actin chromobody-GFP (green).
Contrary to Figure 6—videos 1–6, cells were cultured in the absence of phenol red for Figure 7—videos 1–3. The interval between frames is 30 s, max projection of the nine upper slices (step size 0.2 µm) is shown. The white arrowhead points to a DiD positive vesicle passing from one cell to the other through the TNT. The scale bar represents 15 µm. See also Figure 7A.
Figure 7—video 2
Time-lapse microscopy video of DiD-labeled vesicles (purple, white arrowhead) entering from one cell into a tunneling nanotube (TNT), and next trapped into the TNT (yellow arrowhead) or at the junction of TNT with cell (white arrowhead) in SH-SY5Y CD81 KO cells expressing actin chromobody-GFP (green).
The interval between frames is 15 s, max projection of the 10 upper slices (step size 0.2 µm) is shown. The scale bar represents 15 µm. See also Figure 7A.
Figure 7—video 3
Time-lapse microscopy video of DiD-labeled vesicles (purple) in SH-SY5Y CD81 knock-out (KO) cells expressing actin chromobody-GFP (green) culture.
The white arrowhead indicates the point beyond which the vesicles cannot go in the tunneling nanotube (TNT). The yellow arrowhead points to a vesicle moving to the middle of the TNT, unable to go any further and moving backward. The scale bar represents 15 µm. See also Figure 7A.
Tables
Appendix 1—key resources table
| Reagent type (species) or resource | Designation | Source or reference | Identifiers | Additional information |
|---|---|---|---|---|
| Cell line (Homo sapiens) | U2OS | ATCC | HTB-96 | From osteosarcoma |
| Cell line (H. sapiens) | SH-SY5Y | gift from Simona Paladino (Department of Molecular Medicine and Medical Biotechnology, University of Naples Federico II, Naples, Italy) | From neuroblastoma | |
| Cell line (H. sapiens) | HEK 293T | Used for lentiviral production | ||
| Transfected construct (H. sapiens) | H2B-GFP | Addgene | #11680 | Human histone H2B (H2BC11 Human) |
| Transfected construct (Alpaca) | AC-GFP | Chromotek | pAC-TagGFP | mammalian expression vector encoding the cytoskeleton marker Actin-VHH fused to green fluorescent protein TagGFP2 |
| Transfected construct (H. sapiens) | GFP-CD9 | This paper: The TRIP∆3-EF1α-CD9 plasmid was constructed by inserting the human CD9cDNA sequence in the TRIP∆3-EF1α vector (A generous gift from Anne Dubart-Kupperschmitt); Sirven et al., 2001 | Lentiviral vector backbone | |
| Transfected construct (HIV-1) | pCMVR8,74 | Addgene | #22036 | From Trono lab, 2nd generation lentiviral packaging plasmid. |
| Transfected construct (VSV) | pMDG2 | Addgene | #12259 | From Trono lab, VSV-G envelope expressing plasmid |
| Transfected construct (H. sapiens) | lentiCRISPRv2 targeting human CD9 | CD9 target: GAATCGGAGCCATAGTCCAA | lentiCRISPRv2: Addgene #52961 | Lentiviral vector |
| Transfected construct (H. sapiens) | lentiCRISPRv2 targeting human CD81 | CD81 target: AGGAATCCCAGTGCCTGCTG | lentiCRISPRv2: Addgene #52961 | Lentiviral vector |
| Antibody | Mouse monoclonal anti-CD9 IgG1 TS9 | Le Naour et al., 2006 | TS9 Diaclone: #857.750.000 | IF (1:1000), WB (1:1000) |
| Antibody | Mouse monoclonal anti-CD46 | Lozahic et al., 2000 | Live (1/100) | |
| Antibody | Secondary goat polyclonal antibodies- Alexa fluor | In vitrogen (Thermo Fisher Scientific) | Various references | IF (1/1000) |
| Antibody | Mouse monoclonal anti-CD81 IgG2a | Charrin et al., 2001 | Diaclone: # 857.780.000 | IF (1:1000), WB (1:1000) |
| Antibody | Mouse monoclonal anti ITGB1 IgG1 | Le Naour et al., 2006 | IF (1:500) | |
| Antibody | Mouse monoclonal anti-CD151 IgG1 | Charrin et al., 2001 | Merck Millipore # MABT59 | IF (1:500) |
| Antibody | Mouse monoclonal anti-vinculin | Sigma | #V9264 | IF (1/1000) |
| Antibody | Rabbit polyclonal anti-paxillin | Santa-Cruz | #Sc-5574 | IF (1/1000) |
| Antibody | Purified Mouse monoclonal anti-GM130 IgG1 | BD transduction laboratories | BD 610823 | IF (1/1000) WB (1/1000) |
| Antibody | Mouse monoclonal anti-CD63 IgG1 | Charrin et al., 2001 | TS63 | WB (1/1000) |
| Antibody | Mouse monoclonal anti-ADAM10 11G2 | Arduise et al., 2008 | Diaclone: #857.800.000 | WB (1/1000) |
| Antibody | Rabbit polyclonal anti-alpha GAPDH | Sigma | #G9545 | WB (1/1000) |
| Antibody | Mouse monoclonal anti-actin, clone C4 | MP Biomedicals | SKU: 0869100-CF | WB (1/1000) |
| Antibody | Mouse monoclonal anti-alpha tubulin | Sigma | #T9026 | WB (1/2000) |
| Antibody | Rabbit polyclonal anti-ITGB1, ITGB4, ITGA4 | Cell Signaling | #4749 | WB (1/1000) |
| Antibody | Rabbit monoclonal anti-EGFR | Cell Signaling | #4267 | WB (1/1000) |
| Antibody | Rabbit polyclonal anti-Cx43 /GJA1 | Sigma | #C6219 | WB (1/3000) |
| Antibody | Mouse monoclonal anti-ANXA2 | Proteintech | #66035 | WB (1/2000) |
| Antibody | Mouse monoclonal anti-Alix, clone 3A9 | Biorad | #MCA2493 | WB (1/1000) |
| Antibody | Rabbit polyclonal anti-calnexin | Enzo | #SPA-860 | (WB 1/1000) |
| Sequence-based reagent | siRNA: non-targeting control | Origene | #SR30004 | |
| Sequence-based reagent | small double stranded RNA oligonucleotides targeting human CD9 | Silvie et al., 2006 | GAG CAT CTT CGA GCA AGA A- | |
| Sequence-based reagent | small double stranded RNA oligonucleotides targeting human CD81 | Silvie et al., 2006 | CAC GTC GCC TTC AAC TGT A- | |
| Commercial assay or kit | Lipofectamine RNAiMAX | Invitrogen | Transfection of siRNAs | |
| Commercial assay or kit | Lipofectamine 2000 | Invitrogen | Transfection of plasmids in SH-SY5Y cells | |
| Commercial assay or kit | Fugene HD | Promega | #E2311 | Transfection of plasmids in HEK293T and U2OS cells |
| Commercial assay or kit | Lenti-X Concentrator | TakaraBio | #631232 | |
| Commercial assay or kit | VivaSpin 20 | Cytiva | #28932360 | MWCO 10 kD |
| Software, algorithm | ProteoMap | https://www.proteomaps.net/; Liebermeister et al., 2014 | ||
| Software, algorithm | DAVID | https://david.ncifcrf.gov/; Sherman et al., 2022 | ||
| Software, algorithm | STRING | https://string-db.org/; Szklarczyk et al., 2021 | RRID:SCR_005223 | |
| Software, algorithm | Cytoscape | https://cytoscape.org/ | RRID:SCR_003032 | |
| Software, algorithm | ICY | https://icy.bioimageanalysis.org/ | RRID:SCR_010587 | |
| Software, algorithm | PHOTOSHOP v23.5.5 | Adobe Systems | RRID:SCR_014199 | EVP diameter quantification |
| Software, algorithm | R package imp4p | https://rdrr.io/cran/imp4p/man/imp4p-package.html; Giai Gianetto, 2021 | ||
| Other | DAPI stain | Invitrogen | D1306 | (1 µg/mL) |
| Other | WGA, Alexa Fluor-conjugated | Invitrogen | (1/400) |
Additional files
-
Supplementary file 1
The full TNTome (1177 proteins), from 12 independent samples, proteins were conserved when present in more than 9 replicates, ranked in four quartiles (from higher to lower mean iBAQ) represented in different colors (orange Q1, green Q2, pink Q3, blue Q4).
iBAQ of each sample is indicated for each protein. GO terms are indicated in the last columns.
- https://cdn.elifesciences.org/articles/99172/elife-99172-supp1-v1.xlsx
-
Supplementary file 2
Cytoskeleton-associated proteins of the TNTome.
Proteins identified by GO term analysis (cellular components), except those associated to proteasome, RNA and mitochondria, are ranked according to their quartile assignment (orange Q1, green Q2, pink Q3, blue Q4).
- https://cdn.elifesciences.org/articles/99172/elife-99172-supp2-v1.xlsx
-
Supplementary file 3
Membrane-related proteins identified by GO term analysis (cellular components).
Mitochondrial and other organelles membrane proteins have been discarded from GO analysis. Tab 1 lists all membrane and membrane-associated proteins, tab 2 only the integral membrane proteins, ranked according to their quartile assignment (orange Q1, green Q2, pink Q3, blue Q4) and from more abundant to less abundant. Integrins, Ephrin receptors, Cadherins, and tetraspanin-related proteins are highlighted, respectively in orange, red, dark green and yellow as indicated in tab2.
- https://cdn.elifesciences.org/articles/99172/elife-99172-supp3-v1.xlsx
-
Supplementary file 4
Comparison of TNTome and Integrin adhesion complexes shows the common elements in integrin adhesion complexes (2240 proteins according to Horton et al., 2015) and in TNTome: 765 proteins listed in alphabetical order of the gene name (yellow background).
On the right (blue background) are the 413 elements included exclusively in TNTome. Tab2 shows the 26 common elements in consensus adhesome (Horton et al., 2015) and TNTome.
- https://cdn.elifesciences.org/articles/99172/elife-99172-supp4-v1.xlsx
-
Supplementary file 5
TNT-only proteins.
Tab 1 (total) shows the 174 proteins present in TNT preparations and absent from extracellular vesicles and particles (EVPs). Tab2 (constitutive) shows the 89 tunneling nanotube (TNT)-only proteins without proteins described as mitochondrial, nuclear, ER or RNA-related. In yellow background are cytoskeleton-related proteins (20%).
- https://cdn.elifesciences.org/articles/99172/elife-99172-supp5-v1.xlsx
-
Supplementary file 6
Overlapping proteins between tunneling nanotubes (TNTs) and extracellular vesicles and particles (EVPs).
Tab1 (TOT TNT >EVP) shows the proteins more abundant in TNTs compared to EVPs, cleaned of nuclear, mitochondrial or RNA-related described proteins in tab2 (TNT >EVP). In yellow background are cytoskeleton-related proteins (29%). Tab7 shows the proteins present in EVPs and not in TNTs (except for the 10 proteins in grey background that were in the full TNTome).
- https://cdn.elifesciences.org/articles/99172/elife-99172-supp6-v1.xlsx
-
Supplementary file 7
Common proteins between TNTome and protrusions from hCAD cells described in Gousset et al., 2019.
The 190 proteins present in two samples of hCAD (mouse CAD cells treated with H2O2) were converted to their human ortholog, next compared to the 1177 proteins of Supplementary file 1.
- https://cdn.elifesciences.org/articles/99172/elife-99172-supp7-v1.xlsx
-
Supplementary file 8
Excel spreadsheet containing, in separate sheets, the underlying numerical data and statistical analysis for Figure panels 1C, 1E, 3C, 3E, 3F, 3G, 4B, 4C, 5B, 5C, 5E, 5F, 6G, 7A, 7C, S1D, S1E, S1G, S1H, S3C, S5B, S5D, S5F, S6B, S6C, S6E, S6F, S7A, S7B.
- https://cdn.elifesciences.org/articles/99172/elife-99172-supp8-v1.xlsx
-
MDAR checklist
- https://cdn.elifesciences.org/articles/99172/elife-99172-mdarchecklist1-v1.docx
Download links
A two-part list of links to download the article, or parts of the article, in various formats.
Downloads (link to download the article as PDF)
Open citations (links to open the citations from this article in various online reference manager services)
Cite this article (links to download the citations from this article in formats compatible with various reference manager tools)
Proteomic landscape of tunneling nanotubes reveals CD9 and CD81 tetraspanins as key regulators
eLife 13:RP99172.
https://doi.org/10.7554/eLife.99172.2


