Cyclic di-GMP as an antitoxin regulates bacterial genome stability and antibiotic persistence in biofilms
- The State Key Laboratory Breeding Base of Basic Science of Stomatology & Key Laboratory of Oral Biomedicine Ministry of Education, School & Hospital of Stomatology, Medical Research Institute, Wuhan University, China
- Frontier Science Center for Immunology and Metabolism, Wuhan University, China
- Translational Medicine Research Center, North Sichuan Medical College, China
- Center for Life Sciences, School of Life Sciences, Yunnan University, China
- Taikang Center for Life and Medical Sciences, Wuhan University, China
- Department of Immunology, Hubei Province Key Laboratory of Allergy and Immunology, State Key Laboratory of Virology and Medical Research Institute, Wuhan University School of Basic Medical Sciences, China
Figures
Figure 1 with 1 supplement
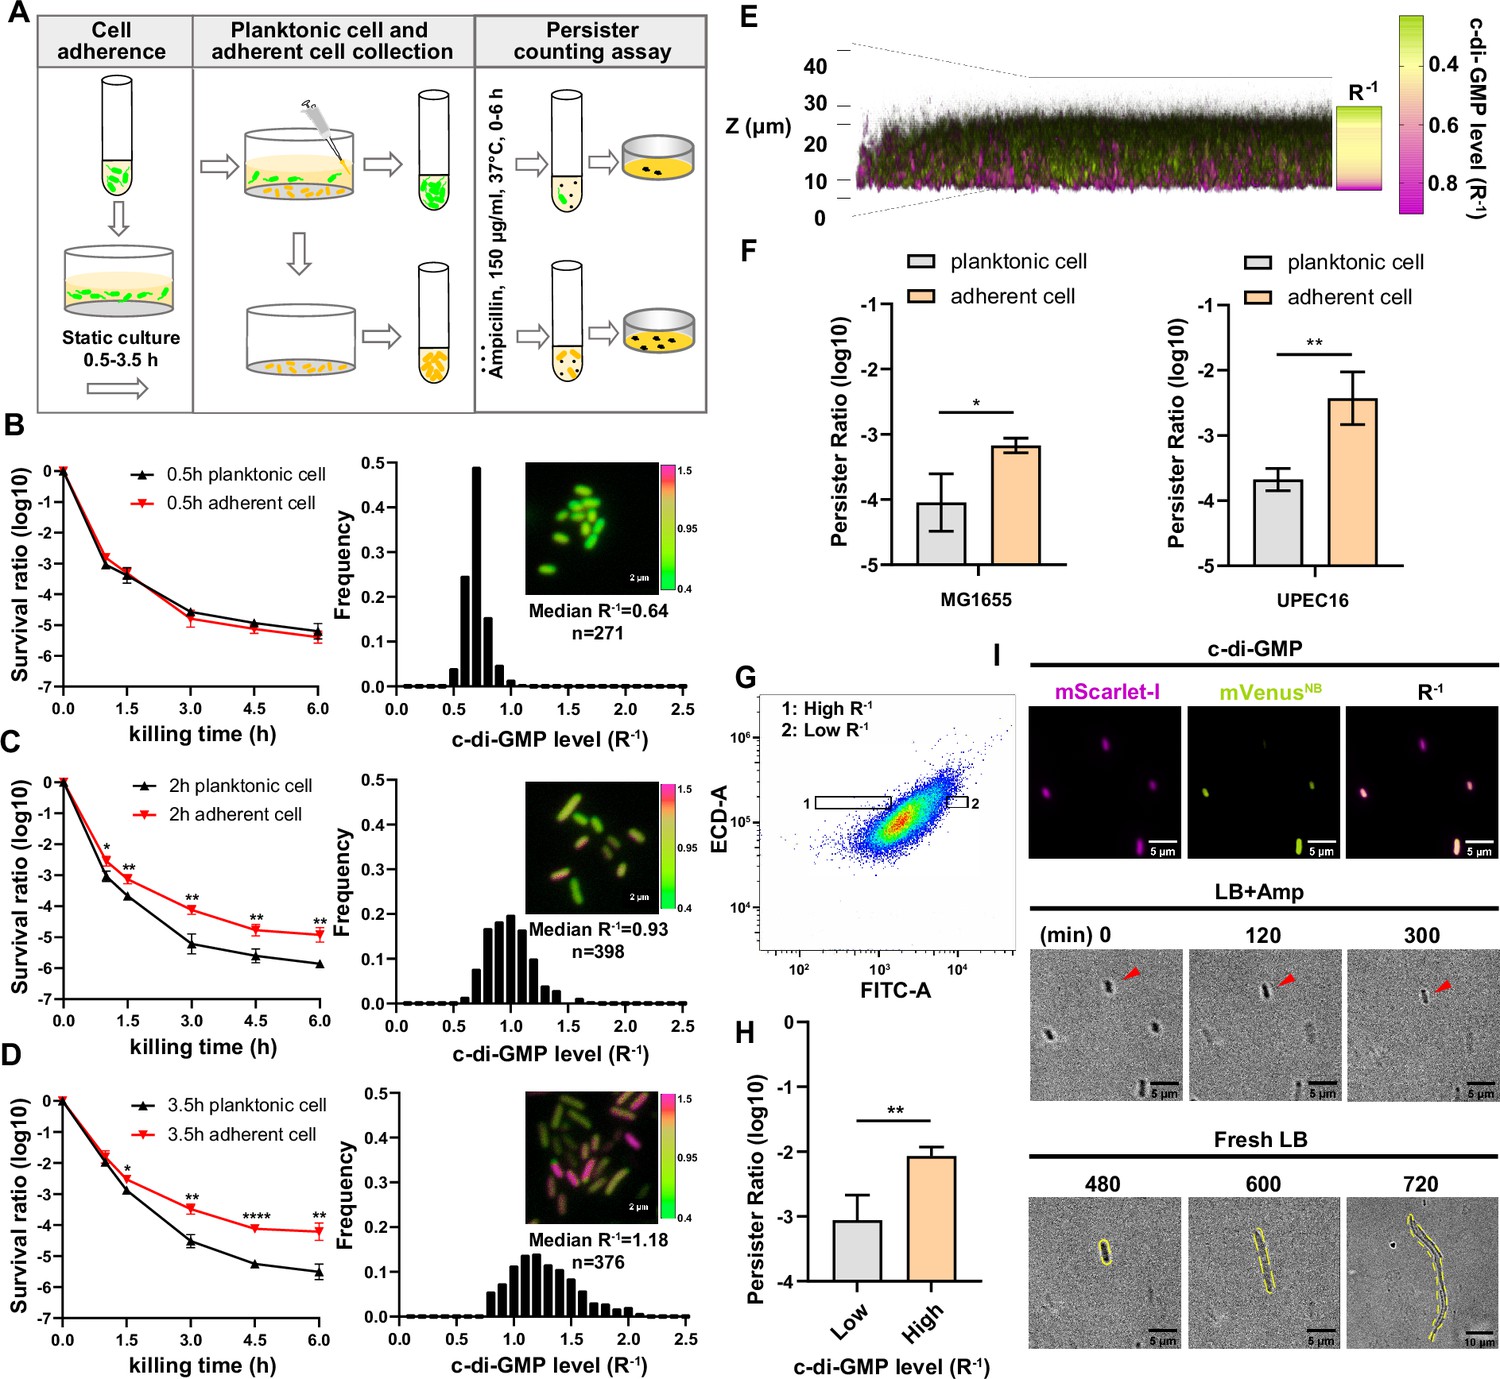
Cell adhesion promotes elevation of c-di-GMP levels and persister formation.
(A) Schematic overview of the static biofilm system designed to investigate intrinsic factors influencing persister cell formation during the early stages of biofilm development. (B–D) Left panel: the biphasic killing curves of planktonic cell subpopulation and surface-adherent cell subpopulation from static biofilm system at the culture time of 0.5 hr (B), 2 hr (C) or 3.5 hr (D), respectively (n=3). Right panel: Frequency distribution of c-di-GMP levels (R–1 score) within the surface-adherent subpopulation from the same static biofilm system and time points. Insert fluorescent images provide representative illustrations of c-di-GMP levels in adherent cells, measured using the c-di-GMP sensor system (Figure 1—figure supplement 1B) integrated into E. coli cells. Scale bar, 2 μm. R–1 score was determined using the fluorescent intensity of mVenusNB and mScarlet-I in the system. (E) Spatial heterogeneity in c-di-GMP levels (R–1 score) within a 24 hr static biofilm in MG1655 strain captured through confocal microscopy. (F) The persister ratio in planktonic cell subpopulation and surface-adherent cell subpopulation collected from the 24 hr static biofilms (ampicillin, 150 μg/ml, 3 hr at 37 °C with shaking at 220 rpm) (n=3). (G–H) The persister ratio (n=4) (H) in High-R–1 or Low-R–1 subpopulations sorted from the 24 hr static biofilms in MG1655 strain (ampicillin, 150 μg/ml, 3 hr at 37 °C with shaking at 220 rpm) (G). (I) Representative time-lapse images of the persister assay using cells with different R–1 values. The MG1655 cells resuspended from 24 hr a static biofilm were imaged on a gel pad, and subsequently treated with LB broth containing 150 μg/ml ampicillin, imaged over 6 hr at 35 °C and then allowed to resuscitate in fresh LB. Scale bar, 5/10 μm, as indicated. Error bars represent standard deviations of biological replicates. Significance was ascertained by two-tailed Student’s t test. Statistical significance is denoted as *p<0.05, **p<0.01, ***, p<0.001, ****, p<0.0001.
-
Figure 1—source data 1
Related to Figure 1.
- https://cdn.elifesciences.org/articles/99194/elife-99194-fig1-data1-v1.xlsx
Figure 1—figure supplement 1

A c-di-GMP biosensor was used in UPEC16 strain.
(A) The phylogenetic analysis has revealed that UPEC16 shares close genetic relatedness with well-characterized UPEC reference strains such as CFT073 and UTI89. (B) Schematic overview of c-di-GMP sensor. The design of c-di-GMP biosensor is based on fluorescent protein mVenusNB, with MrkH inserted between residues Y145 and N146. Conformational changes in MrkH, induced upon binding to c-di-GMP, result in reduced fluorescence of the c-di-GMP sensor. A red fluorescent protein mScarlet-I is co-expressed under the regulation of the proC promoter. (C–E) Frequency distribution of c-di-GMP levels (R–1 score) within the planktonic subpopulation from the static biofilm system harboring c-di-GMP biosensor at 0.5 hr (C), 2 hr (D), 3.5 hr (E).
-
Figure 1—figure supplement 1—source data 1
Related to Figure 1—figure supplement 1.
- https://cdn.elifesciences.org/articles/99194/elife-99194-fig1-figsupp1-data1-v1.xlsx
Figure 2
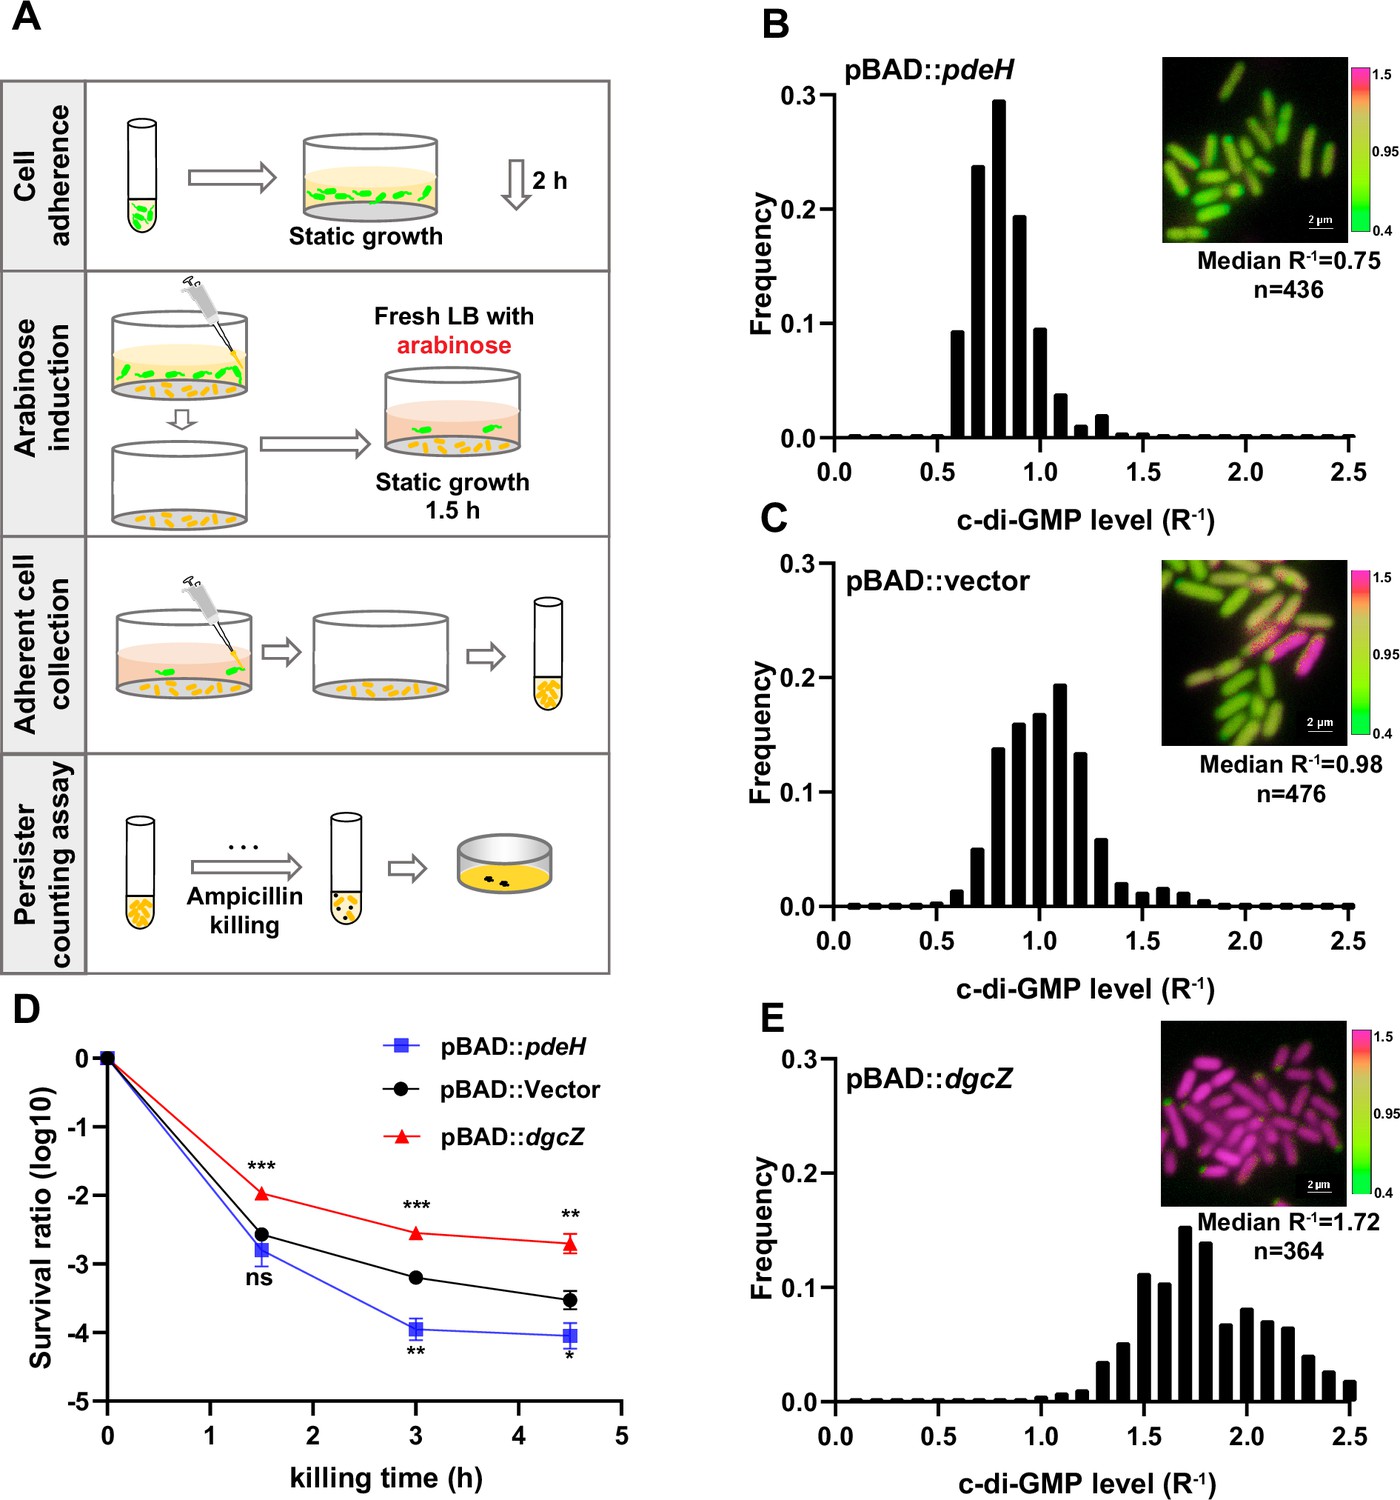
High c-di-GMP levels promote persister formation.
(A) Schematic overview illustrating the manipulation of c-di-GMP levels in surface-adherent cell subpopulations for persister ratio determination. (B–C, E) Frequency distribution of c-di-GMP levels (R–1 score) within the surface-adherent subpopulation from strains overexpressing either PdeH (pBAD::pdeH) (B) or DgcZ (pBAD::dgcZ) (E), along with a vector control (pBAD::vector) (C). Cells preparation followed the procedure depicted in (A). Insert fluorescent images provide representative illustrations of c-di-GMP levels in adherent cells, measured using the c-di-GMP sensor system (Figure 1—figure supplement 1B) integrated into different stains. Scale bar, 2 μm. (D) Biphasic killing curves of the surface-adherent subpopulations from (A) (n=3). Error bars represent standard deviations of biological replicates. Significance was ascertained by two-tailed Student’s t test. Statistical significance is denoted as *p<0.05, **p<0.01, ***p<0.001.
-
Figure 2—source data 1
Related to Figure 2.
- https://cdn.elifesciences.org/articles/99194/elife-99194-fig2-data1-v1.xlsx
Figure 3 with 2 supplements
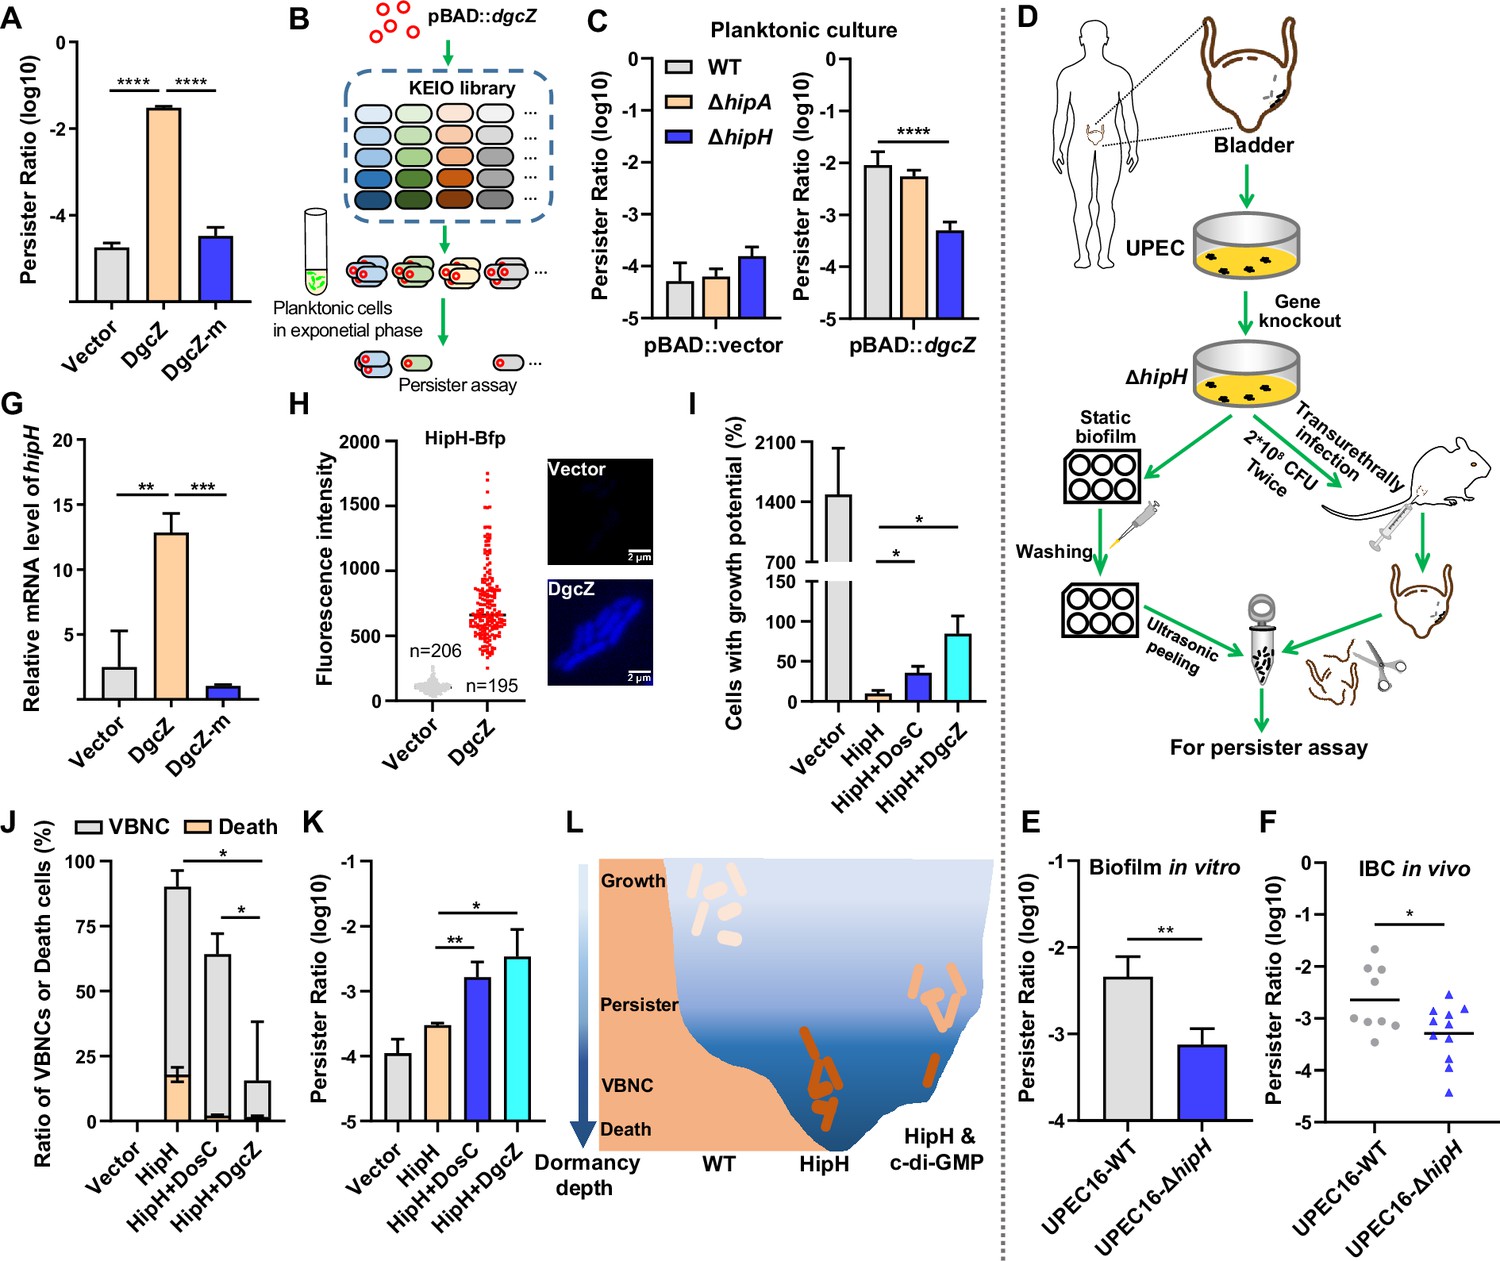
HipH and c-di-GMP as a TA-like system.
(A) Determination of persister ratios in MG1655 strains overexpressing DgcZ or DgcZ-m (G206A, G207A, E208Q), with 0.002% arabinose induction for 2 hr in the pBAD plasmid. Persister counting was performed following antibiotic killing (ampicillin, 150 μg/ml, 3 hr at 37 °C with shaking at 220 rpm) (n=3). (B) Schematic overview illustrating the screening of downstream targets of c-di-GMP by using E. coli Keio Knockout Collection, the screen was conducted in the presence of high levels of c-di-GMP by inducing the expression of DgcZ with 0.002% arabinose for 2 hr. (C) Identification of HipH as the downstream target of c-di-GMP in persister formation in Keio strains. Left panel: persister assay performed without high levels of c-di-GMP (pBAD-vector); Right panel: persister assay performed in the presence of high levels of c-di-GMP (pBAD-dgcZ) (ampicillin, 150 μg/ml, 3 hr at 37 °C with shaking at 220 rpm) (n=9). (D) Schematic overview of clinical UPEC16 isolation, genetic modification, and in vitro or in vivo biofilm culture. (E) Antibiotic killing (ampicillin, 150 μg/ml, 3 hr at 37 °C with shaking at 220 rpm) and persister counting assay for in vitro biofilm cells (n=3). (F) Antibiotic killing (ampicillin, 150 μg/ml, 3 hr at 37 °C with shaking at 220 rpm) and persister counting assay for in vivo IBC cells (n=9 for WT, n=11 for ΔhipH). (G) Relative expression level of hipH in MG1655 strains under different levels of cellular c-di-GMP, determined by RT-qPCR and normalized to the levels of 16 S rRNA. DgcZ and DgcZ-m were induced by 0.002% arabinose for 2 hr in the pBAD plasmid (n=3). (H) Fluorescence intensity of HipH fused to BFP in MG1655 strains under varying levels of cellular c-di-GMP. DgcZ was induced by 0.002% arabinose for 2 hr using the pBAD plasmid. The inserted fluorescent images provide representative illustrations of HipH-BFP. Scale bar, 2 μm. (I–K) Detection of the ratio of cells with growth potential (I), VBNCs or death cells (J) and persisters (K) in MG1655 strains overexpressing HipH alone, or overexpressing HipH and DosC together, or overexpressing HipH and DgcZ together, induced by 0.002% arabinose for 4 hr. Persister counting performed followed antibiotic killing (ampicillin, 150 μg/ml, 3 hr at 37 °C with shaking at 220 rpm) (n=3). (L) Schematic representation of the dormancy depth controlled by HipH and c-di-GMP, and the relationship with cell state. Error bars represent standard deviations of biological replicates. Significance was ascertained by two-tailed Student’s t test (ACEFGHK) or Two-way ANOVA (I–J). Statistical significance is denoted as *p<0.05, **p<0.01, ***, p<0.001; ****, p<0.0001.
-
Figure 3—source data 1
Related to Figure 3.
- https://cdn.elifesciences.org/articles/99194/elife-99194-fig3-data1-v1.xlsx
Figure 3—figure supplement 1

UPEC16 infection of mouse bladder.
(A) Quantification of intracellular bacterial communities (IBC) count per slide within the epithelial cells lining the bladder lumen infected by UPEC16-WT or UPEC16-ΔhipH. (n=6). (B) Histological examinations of H&E stained UPEC16-WT or UPEC16-ΔhipH infected bladder tissue sections. Representative images of IBC were indicated by red arrows.
-
Figure 3—figure supplement 1—source data 1
Related to Figure 3—figure supplement 1.
- https://cdn.elifesciences.org/articles/99194/elife-99194-fig3-figsupp1-data1-v1.xlsx
Figure 3—figure supplement 2
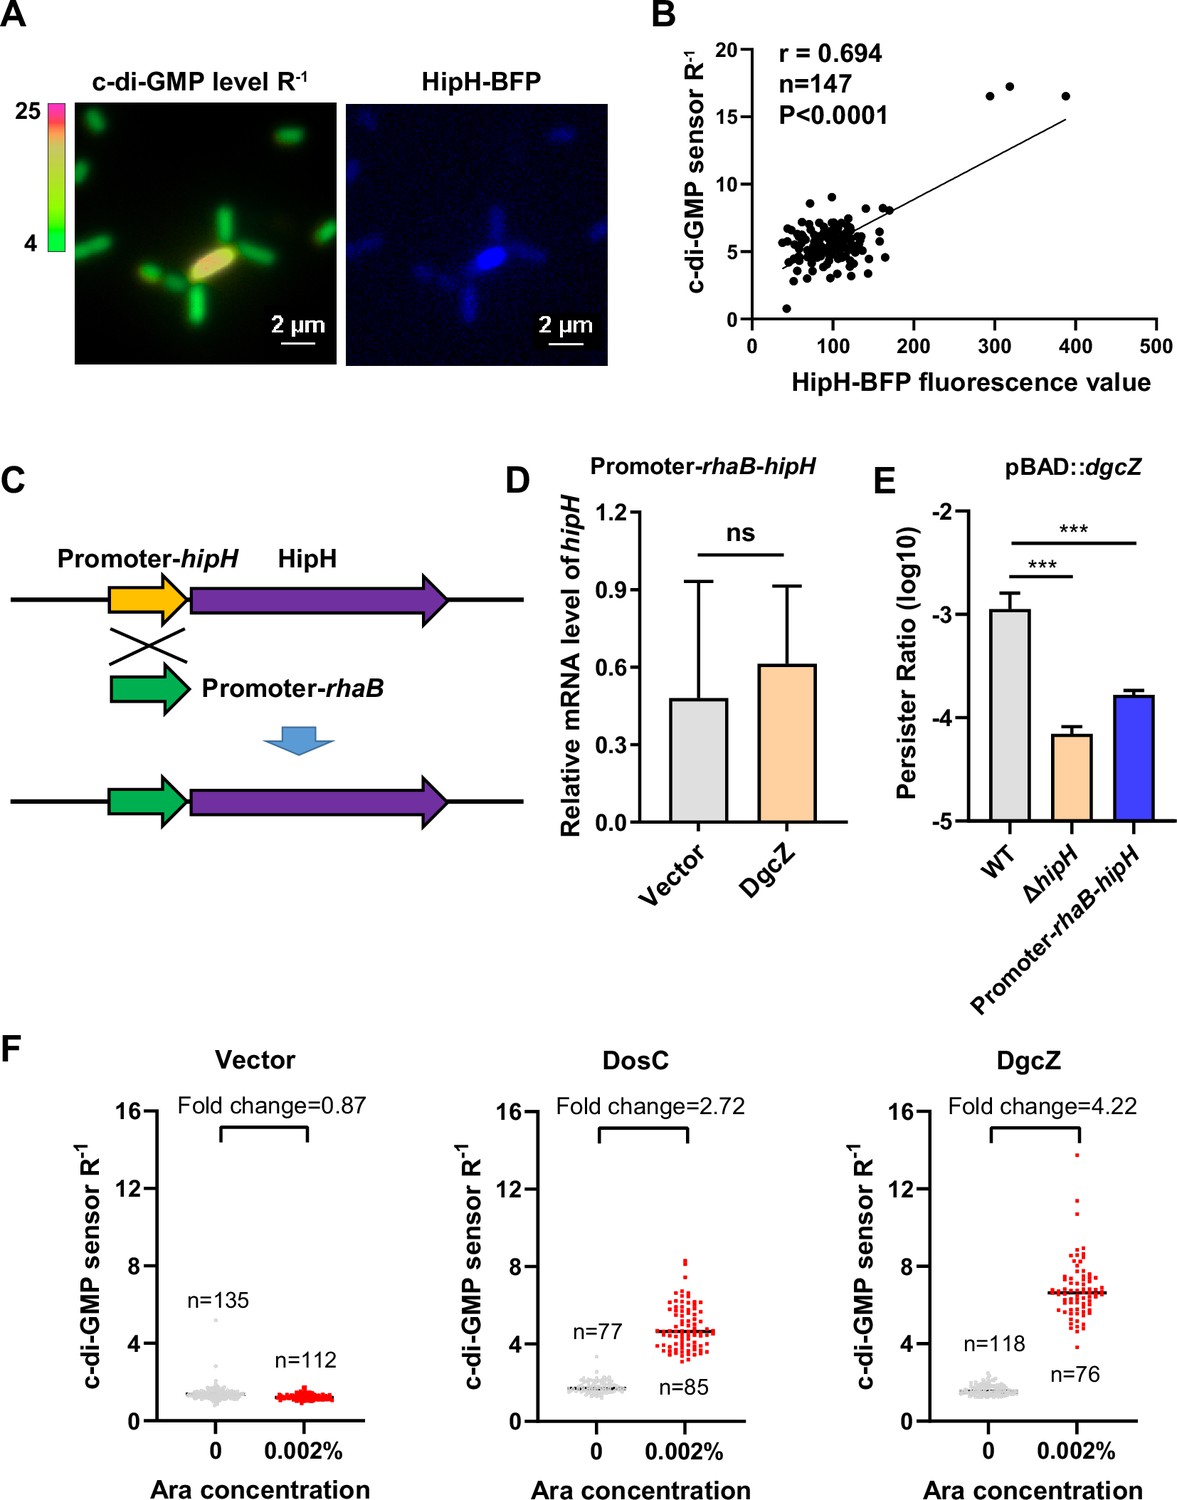
The correlation between the levels of c-di-GMP and HipH.
(A) Representative fluorescent images showing HipH-BFP fluorescence and c-di-GMP level R–1. UPEC16 strain with the c-di-GMP sensing system and BFP-labeled HipH were cultured statically five-hours in microtiter dishes. Scale bar, 2 μm. (B) Correlation analysis between HipH-BFP fluorescence values and c-di-GMP level R–1 scores from (A). (C) Schematic representation of the promoter modification of the hipH gene. (D) Relative expression level of hipH in BW25113 Promoter-rhaB-hipH strain under varying levels of cellular c-di-GMP, determined by RT-qPCR and normalized to the levels of 16 S rRNA. DgcZ was induced by 0.002% arabinose for 2 hr using the pBAD plasmid (n=3). (E) Determination of persister ratios in BW25113 strains overexpressing DgcZ with 0.002% arabinose induction for 2 hr using the pBAD plasmid. Persister counting was performed following antibiotic treatment (ampicillin, 150 μg/ml, 3 hr at 37 °C with shaking at 220 rpm) (n=3). (F) Determination of relative cellular concentrations of c-di-GMP by c-di-GMP sensing system in MG1655 cells overexpressing DosC or DgcZ, with 0.002% arabinose induction for 2 hr. Error bars represent standard deviations of biological replicates. Significance was ascertained by two-tailed Student’s t test. Statistical significance is denoted as ****, p<0.0001.
-
Figure 3—figure supplement 2—source data 1
Related to Figure 3—figure supplement 2.
- https://cdn.elifesciences.org/articles/99194/elife-99194-fig3-figsupp2-data1-v1.xlsx
Figure 4 with 1 supplement
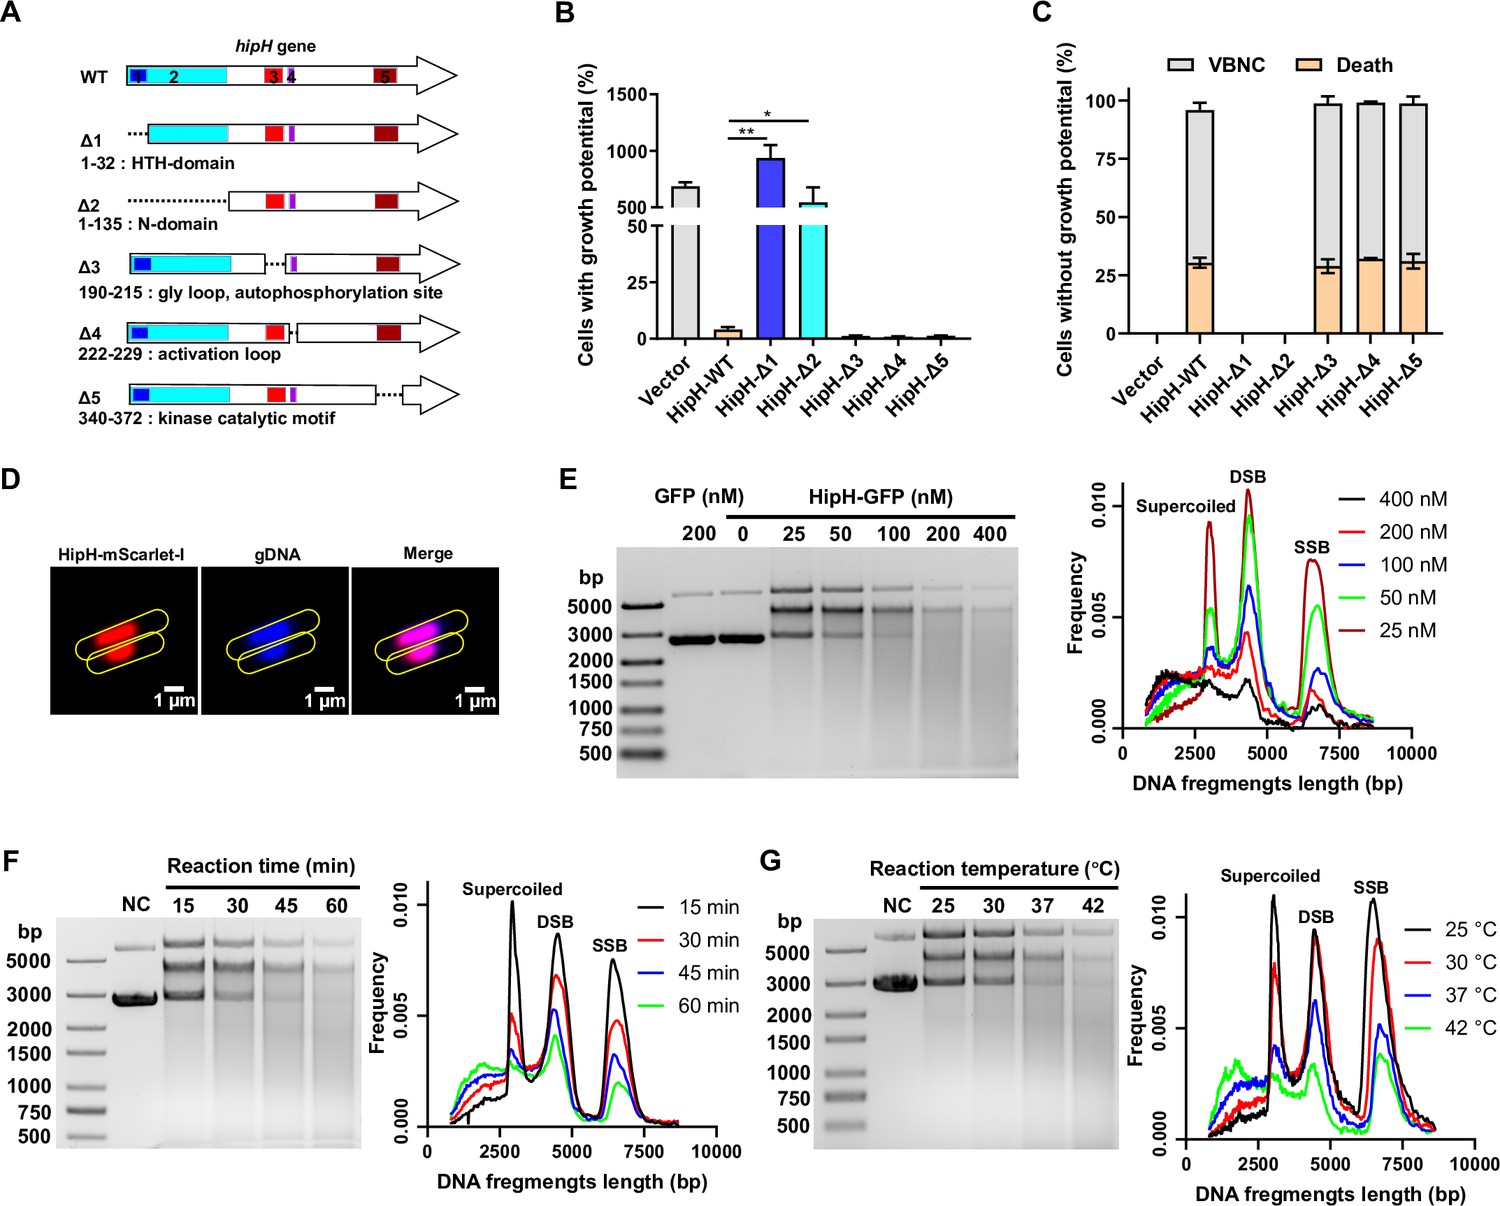
HipH is a deoxyribonuclease exerting genotoxic effects.
(A) Structure analysis of HipH protein and Schematic representation of truncated mutants illustrating key structural domains. (B–C) Detection of the ratio of cells with growth potential (B) and VBNCs or death cells (C) in MG1655 strains overexpressing different truncated HipH mutants, induced by 0.002% arabinose for 3 hr (n=3). (D) Subcellular localization of HipH in MG1655 strain. HipH was fused with mScarlet-I and induced by 0.002% arabinose for 2 hr. The gDNA was stained with Hoechst 33258 for 15 min at room temperature. Scale bar, 1 μm. (E–G) Left panel: in vitro DNA cleavage assay using 500 ng supercoiled plasmid DNA, (E) with varying concentrations of HipH-GFP (0, 25, 50, 100, 200, or 400 nM), with purified GFP protein as control; (F) with different durations of reaction time (15, 30, 45, and 60 min); (G) with different reaction temperature (25, 30, 37, and 42°C). If not specified, 200 nM of HipH-GFP was added to each reaction. ‘NC’, negative control, indicates supercoiled plasmid without addition of HipH-GFP. Molecular weight markers from top to bottom are 5000, 3000, 2000, 1500, 1000, 750, 500 (bp). Right panel: illustration of the relationship between the length of DNA fragments and their ratio to total DNA, as indicated in the corresponding upper panel. SSB, single-strand break; DSB, double strand break. Error bars represent standard deviations of biological replicates. Significance was ascertained by Two-way ANOVA. Statistical significance is denoted as *p<0.05, **p<0.01.
-
Figure 4—source data 1
Related to Figure 4.
- https://cdn.elifesciences.org/articles/99194/elife-99194-fig4-data1-v1.xlsx
Figure 4—figure supplement 1

HipH induced genome instability.
(A) The cells length was detected in MG1655 strains which overexpressed HipH induced by 0.002% arabinose for 2 hr under a light microscope. (B) The relative mRNA level of some SOS response genes, recA, sulA and tisB, were detected by qPCR in MG1655 strains which overexpressed HipH or HipH-ΔHTH induced by 0.002% arabinose for 3 hr. The mRNA level was normalized by 16 S rRNA level (n=3). (C) The ratio of cells with growth potential in different strains, WT: overexpressing HipH in BW25113 WT. ΔrecA: overexpressing HipH in BW25113 ΔrecA strain (n=3). HipH was induced by 0.002% arabinose for 2 hr. (D) The ratio of cells with growth potential were detected in MG1655 strains which overexpressed HipH induced by 0.002% arabinose and overexpressed RecG induced by 1 mM IPTG for 2 hr (n=3). Error bars represent standard deviations of biological replicates. Significance was ascertained by two-tailed Student’s t test (A–B) or Two-way ANOVA (C–D). Statistical significance is denoted as *p<0.05, **p<0.01. ***, p<0.001; ****, p<0.0001.
-
Figure 4—figure supplement 1—source data 1
Related to Figure 4—figure supplement 1.
- https://cdn.elifesciences.org/articles/99194/elife-99194-fig4-figsupp1-data1-v1.xlsx
Figure 5 with 1 supplement
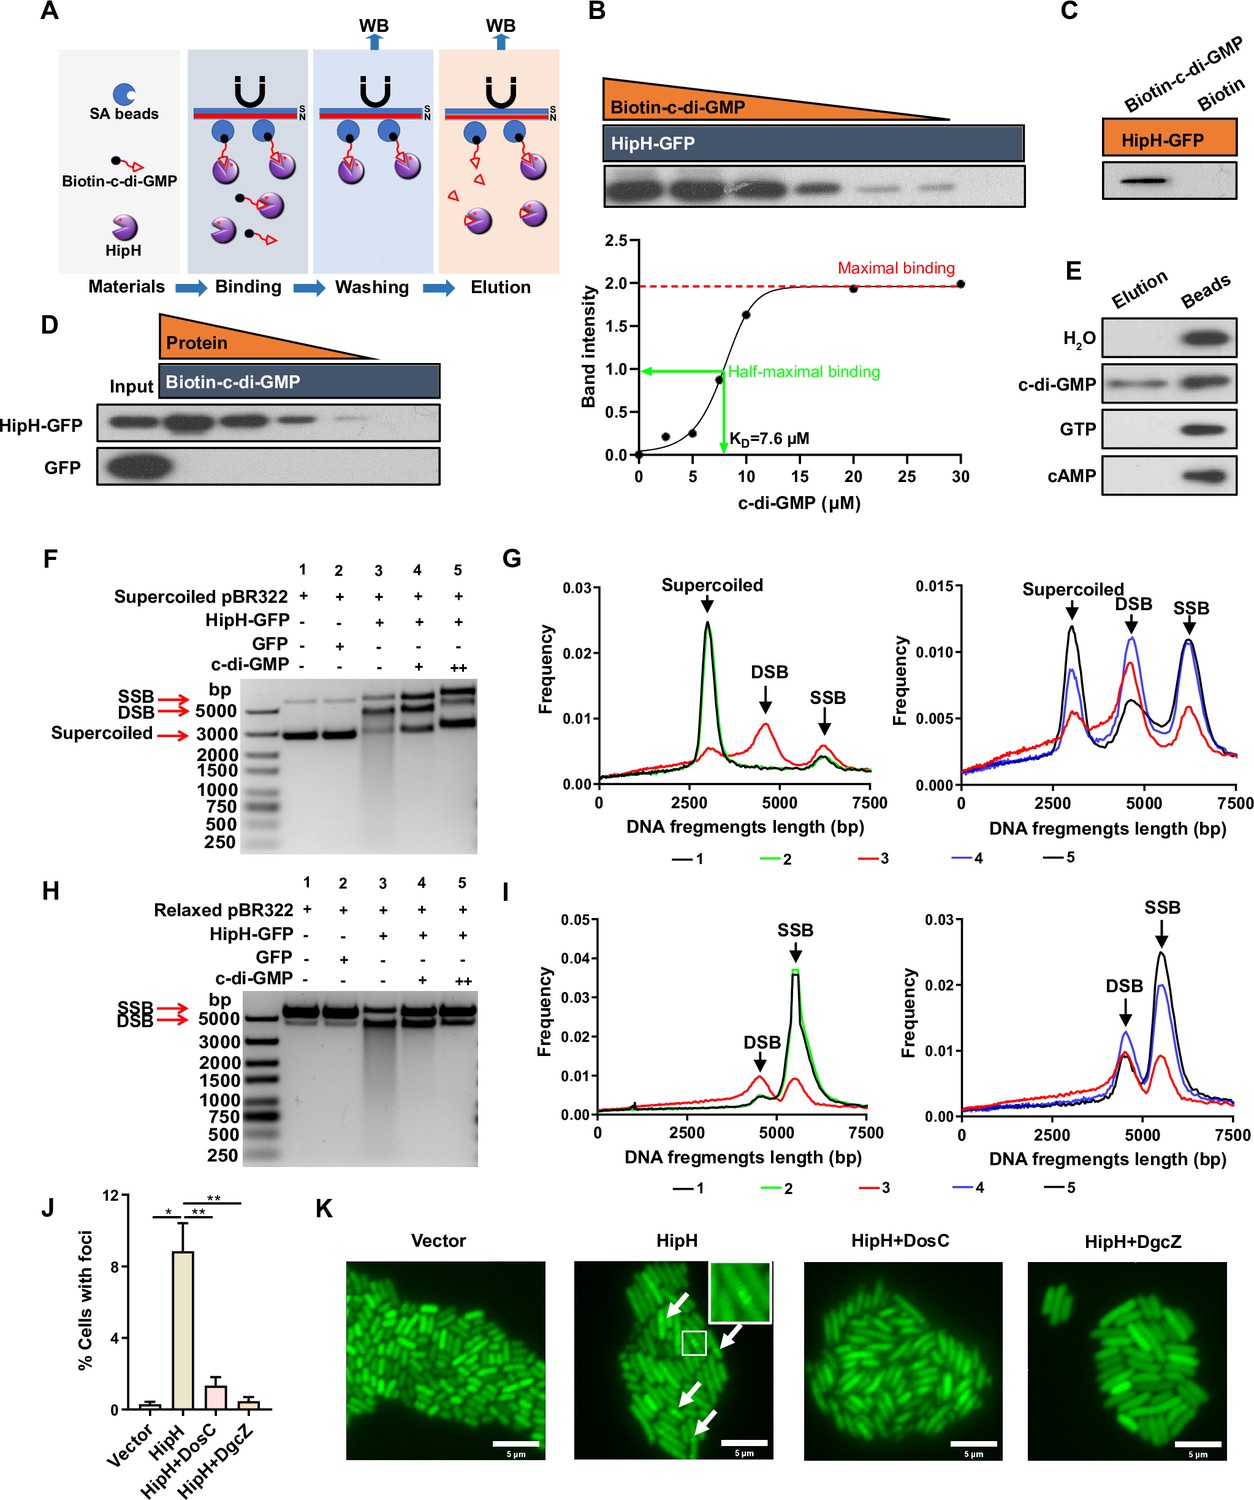
c-di-GMP acts as an antitoxin to repress HipH DNA cleavage activity.
(A) Schematic representation of the biotin-c-di-GMP pull-down assay for HipH protein. (B–E) Identification of the interaction between c-di-GMP and HipH using the biotinylated c-di-GMP pull-down assay. (B) Upper panel: 1.5 μM purified HipH-GFP-His and biotin-c-di-GMP were added in gradient concentrations (30, 20, 10, 7.5, 5, 2.5, 0 μM). Bottom panel: the intensity of bound protein, obtained by analyzing the immunoblot shown in the upper panel using ImageJ, relative to the concentrations of c-di-GMP used in the pull-down assays. (C) 0.3 μM purified HipH-GFP-His and 20 μM biotin-c-di-GMP or biotin were added. (D) Purified HipH-GFP-His or GFP-His was added in gradient concentrations (1.5, 0.75, 0.375, 0.19, 0 μM), and 20 μM biotin-c-di-GMP was added. 0.5 μg protein was used as the input sample. (E) 2 mM c-di-GMP, cAMP, or GTP were used to elute HipH-GFP-His from SA beads, as well as HipH-GFP-His/biotin-c-di-GMP complexes prepared from the pull-down reaction mix containing 1.5 μM purified HipH-GFP-His and 20 μM biotin-c-di-GMP. (F–I) In vitro DNA cleavage assay using 500 ng supercoiled plasmid DNA (F–G) or relaxed plasmid DNA (H–I).'+’ indicated 1.67 mM c-di-GMP and ‘++’ indicated 5 mM c-di-GMP. 200 nM HipH-GFP-His or GFP-His was used in Cleavage reaction at 37 °C for 1 hr. Molecular weight markers from top to bottom are 5000, 3000, 2000, 1500, 1000, 750, 500, 250 (bp). (G) and (I) represent the relationship between the length of DNA fragments and their ratio to total DNA, as shown in B and D, respectively. SSB: single-strand break (relaxed plasmid DNA); DSB: double-strand break. (J) Statistic analysis of the ratio of cells with Gam-GFP foci in different MG1655 strains: overexpressing HipH alone, or HipH with DosC, or HipH with DgcZ (n=3). (K) Representative images of cells expressing Gam-GFP in the aforementioned different strains. Scale bar, 5 μm. Error bars represent standard deviations of biological replicates. Significance was ascertained by Two-way ANOVA. Statistical significance is denoted as *p<0.05, **p<0.01.
-
Figure 5—source data 1
PDF containing original scans of the dot blot related to Figure 5B–E.
- https://cdn.elifesciences.org/articles/99194/elife-99194-fig5-data1-v1.pdf
-
Figure 5—source data 2
Related to Figure 5.
- https://cdn.elifesciences.org/articles/99194/elife-99194-fig5-data2-v1.xlsx
Figure 5—figure supplement 1

c-di-GMP binding inhibits HipH DNA cleavage activity.
(A) Lysates from cells overexpressing HipH-His or mCherry-His was added in gradient concentrations (0, 15, 30, 60, 120, 240 μg), with biotin-c-di-GMP was added at a constant concentration (8 μM). (B) Lysates from cells overexpressing HipH-His was added at a constant concentration (240 μg), and biotin-c-di-GMP was added in gradient concentrations (0, 0.5, 1, 2, 4, 8 μM). (C) Left panel: In vitro DNA cleavage assay using 500 ng of supercoiled plasmid DNA. A concentration of 200 nM HipH-GFP-His was employed in the cleavage reaction at 37 °C for 1 hr. Subsequently, 5 mM c-di-GMP, 2.5 mM cAMP, 5 mM GTP, or 200 nM HipB-His were added to the cleavage reaction. Molecular weight markers from top to bottom are 5000, 3000, 2000, 1500, 1000, 750, 500, 250, 100 (bp). Right panel: Illustration of the relationship between the length of DNA fragments and their ratio to total DNA.
-
Figure 5—figure supplement 1—source data 1
PDF containing original scans of the dot blot related to Figure 5—figure supplement 1A, B.
- https://cdn.elifesciences.org/articles/99194/elife-99194-fig5-figsupp1-data1-v1.pdf
-
Figure 5—figure supplement 1—source data 2
Related to Figure 5—figure supplement 1.
- https://cdn.elifesciences.org/articles/99194/elife-99194-fig5-figsupp1-data2-v1.xlsx
Figure 6

Schematic overview of the mechanism underlying c-di-GMP induced persister formation in biofilms.
In biofilms, cell-surface adhesion triggers an increase of intracellular c-di-GMP levels. Elevated intracellular c-di-GMP levels inducing the expression of HipH. The HipH protein is a deoxyribonuclease which induces DNA double-strand break. Acting as an antitoxin, c-di-GMP mitigates the genotoxicity of HipH.
Tables
Appendix 1—key resources table
| Reagent type (species) or resource | Designation | Source or reference | Identifiers | Additional information |
|---|---|---|---|---|
| Strain, strain background (Escherichia coli) | MG1655 | Yale Genetic Stock Center | CGSC#6300 | |
| Strain, strain background (Escherichia coli) | BW25113 | Yale Genetic Stock Center | CGSC#7636 | |
| Strain, strain background (Escherichia coli) | UPEC16 | First Affiliated Hospital of Kunming Medical University | National Genomics Data Center under the accession number "GWHERGI00000000" | |
| Strain, strain background (Escherichia coli) | BW25113 KEIO library | Dharmacon (GE life sciences) | Cat#OEC4988 | |
| Strain, strain background (Escherichia coli) | UPEC16 p15A::c-di-GMP-sensor | This paper | Figure Legends and Materials and methods section | |
| Strain, strain background (Escherichia coli) | UPEC16 Δara pBAD::vector p15A::c-di-GMP-sensor | This paper | Figure Legends and Materials and methods section | |
| Strain, strain background (Escherichia coli) | UPEC16 Δara pBAD::pdeH p15A::c-di-GMP-sensor | This paper | Figure Legends and Materials and methods section | |
| Strain, strain background (Escherichia coli) | UPEC16 Δara pBAD::dgcZ p15A::c-di-GMP-sensor | This paper | Figure Legends and Materials and methods section | |
| Strain, strain background (Escherichia coli) | UPEC16 p15A::c-di-GMP-sensor P-hipH-bfp | This paper | Figure Legends and Materials and methods section | |
| Strain, strain background (Escherichia coli) | UPEC16 ΔhipH | This paper | Figure Legends and Materials and methods section | |
| Strain, strain background (Escherichia coli) | MG1655 p15A::c-di-GMP-sensor | This paper | Figure Legends and Materials and methods section | |
| Strain, strain background (Escherichia coli) | MG1655 Δara pBAD::vector p15A::c-di-GMP-sensor | This paper | Figure Legends and Materials and methods section | |
| Strain, strain background (Escherichia coli) | MG1655 Δara pBAD::dosC p15A::c-di-GMP-sensor | This paper | Figure Legends and Materials and methods section | |
| Strain, strain background (Escherichia coli) | MG1655 Δara pBAD::dgcZ p15A::c-di-GMP-sensor | This paper | Figure Legends and Materials and methods section | |
| Strain, strain background (Escherichia coli) | MG1655 Δara hipH-bfp pBAD::vector | This paper | Figure Legends and Materials and methods section | |
| Strain, strain background (Escherichia coli) | MG1655 Δara hipH-bfp pBAD::dgcZ | This paper | Figure Legends and Materials and methods section | |
| Strain, strain background (Escherichia coli) | MG1655 Δara pBAD::dgcZ (or dgcZ-m) | This paper | Figure Legends and Materials and methods section | |
| Strain, strain background (Escherichia coli) | MG1655 Δara pBAD::hipH-His (or hipH mutants) | This paper | Figure Legends and Materials and methods section | |
| Strain, strain background (Escherichia coli) | MG1655 Δara pBAD::hipH-mScarlet-I | This paper | Figure Legends and Materials and methods section | |
| Strain, strain background (Escherichia coli) | MG1655 Δara pBAD::gfp-His | This paper | Figure Legends and Materials and methods section | |
| Strain, strain background (Escherichia coli) | MG1655 Δara pBAD::hipH-gfp-His | This paper | Figure Legends and Materials and methods section | |
| Strain, strain background (Escherichia coli) | MG1655 Δara pBAD::hipB-His | This paper | Figure Legends and Materials and methods section | |
| Strain, strain background (Escherichia coli) | MG1655 Δara pBAD::mCherry-His | This paper | Figure Legends and Materials and methods section | |
| Strain, strain background (Escherichia coli) | MG1655 Δara pBAD::hipH p15A-T5::vector | This paper | Figure Legends and Materials and methods section | |
| Strain, strain background (Escherichia coli) | MG1655 Δara pBAD::hipH p15A-T5::recG | This paper | Figure Legends and Materials and methods section | |
| Strain, strain background (Escherichia coli) | MG1655 Δara pBAD::Vector, p15A::gam-GFP & ara-hipH | This paper | Figure Legends and Materials and methods section | |
| Strain, strain background (Escherichia coli) | MG1655 Δara pBAD::dosC, p15A::gam-GFP & ara-hipH | This paper | Figure Legends and Materials and methods section | |
| Strain, strain background (Escherichia coli) | MG1655 Δara pBAD::dgcZ, p15A::gam-GFP & ara-hipH | This paper | Figure Legends and Materials and methods section | |
| Strain, strain background (Escherichia coli) | BW25113 keio mutants pBAD::dgcZ | This paper | Figure Legends and Materials and methods section | |
| Strain, strain background (Escherichia coli) | BW25113 pBAD::hipH | This paper | Figure Legends and Materials and methods section | |
| Strain, strain background (Escherichia coli) | BW25113 ΔrecA pBAD::hipH | This paper | Figure Legends and Materials and methods section | |
| Strain, strain background (Escherichia coli) | BW25113 Promoter-rhaB-hipH pBAD::dgcZ | This paper | Figure Legends and Materials and methods section | |
| Antibody | Anti-His-tag-mAb (Mouse Monoclonal) | MBL | Cat#D291-3, RRID: AB_10597733 | WB (1:1000) |
| Antibody | HRP-Goat Anti-Mouse IgG (H+L) (Goat polyclonal) | ABclonal | Cat#AS003; RRID: AB_2769851 | WB (1:10000) |
| Recombinant DNA reagent | p15A::c-di-GMP-sensor | This paper | p15A ori | |
| Recombinant DNA reagent | pBAD::vector | This paper | Arabinose-induction | |
| Recombinant DNA reagent | pBAD::pdeH | This paper | Arabinose-induction | |
| Recombinant DNA reagent | pBAD::dgcZ (or dgcZ-m) | This paper | Arabinose-induction | |
| Recombinant DNA reagent | P-hipH-bfp | This paper | hipH native promoter induction | |
| Recombinant DNA reagent | pBAD::dosC | This paper | Arabinose-induction | |
| Recombinant DNA reagent | pBAD::hipH-His (or hipH mutants) | This paper | Arabinose-induction | |
| Recombinant DNA reagent | pBAD::hipH-mScarlet-I | This paper | Arabinose-induction | |
| Recombinant DNA reagent | pBAD::gfp-His | This paper | Arabinose-induction | |
| Recombinant DNA reagent | pBAD::hipH-gfp-His | This paper | Arabinose-induction | |
| Recombinant DNA reagent | pBAD::mCherry-His | This paper | Arabinose-induction | |
| Recombinant DNA reagent | p15A::gam-GFP & ara-hipH | This paper | Tetracycline induction for Gam-GFP, Arabinose-induction for HipH | |
| Recombinant DNA reagent | p15A-T5::vector | This paper | T5 promoter-Lac-induction | |
| Recombinant DNA reagent | p15A-T5::recG | This paper | T5 promoter-Lac-induction | |
| Sequence-based reagent | recA-QP1 | This paper | PCR primers | CTGCTGATCTTCATCAACCA |
| Sequence-based reagent | recA-QP2 | This paper | PCR primers | AACAGAGGCGTAGAATTTCAG |
| Sequence-based reagent | sulA-QP1 | This paper | PCR primers | GGGCTTATCAGTGAAGTTGTC |
| Sequence-based reagent | sulA-QP2 | This paper | PCR primers | GGCTAATCTGCATTACTTTCGT |
| Sequence-based reagent | tisB-QP1 | This paper | PCR primers | ATGAACCTGGTGGATATCGC |
| Sequence-based reagent | tisB-QP2 | This paper | PCR primers | TTACTTCAGGTATTTCAGAACAGC |
| Sequence-based reagent | hipH-QP1 | This paper | PCR primers | GATTACTGCACAACACCCTG |
| Sequence-based reagent | hipH-QP2 | This paper | PCR primers | GAAGAACCCACAATTTCTCCTG |
| Sequence-based reagent | 16S-QP1 | This paper | PCR primers | TAGAATTCCAGGTGTAGCGG |
| Sequence-based reagent | 16S-QP2 | This paper | PCR primers | GGGTATCTAATCCTGTTTGCTC |
| Peptide, recombinant protein | HipH-GFP-His | This paper | Figure Legends and Materials and methods section | |
| Peptide, recombinant protein | GFP-His | This paper | Figure Legends and Materials and methods section | |
| Commercial assay or kit | 2×MultiF Seamless Assembly Mix | ABclonal | Cat#RK21020 | |
| Chemical compound, drug | Biotin | Thermo Fisher | Cat#29129 | |
| Chemical compound, drug | Streptavidin Magnetic Beads | Thermo Fisher | Cat#88816 | |
| Chemical compound, drug | 2'-Biotin-16-c-di-GMP | BIOLOG | Cat#B098 | |
| Chemical compound, drug | cycle di-GMP | APExBIO | Cat#B7839 | |
| Chemical compound, drug | Arabinose | Sigma | Cat#V900920 | |
| Chemical compound, drug | IPTG | Sangon Biotech | Cat# A600168 | |
| Chemical compound, drug | Anhydrotetracycline | MedChemExpress | Cat#HY-118660 | |
| Chemical compound, drug | Ampicillin | Sangon Biotech | Cat#A610028 | |
| Chemical compound, drug | Chloramphenicol | Sangon Biotech | Cat#A600118 | |
| Chemical compound, drug | Gentamicin | Sangon Biotech | Cat#A620217 | |
| Chemical compound, drug | Kanamycin | Sangon Biotech | Cat#A600286 | |
| Software, algorithm | Fiji | GitHub | https://fiji.sc/; RRID:SCR_002285 | |
| Software, algorithm | FlowJo | Treestar, Inc | https://www.flowjo.com/ |
Additional files
Download links
A two-part list of links to download the article, or parts of the article, in various formats.
Downloads (link to download the article as PDF)
Open citations (links to open the citations from this article in various online reference manager services)
Cite this article (links to download the citations from this article in formats compatible with various reference manager tools)
Cyclic di-GMP as an antitoxin regulates bacterial genome stability and antibiotic persistence in biofilms
eLife 13:RP99194.
https://doi.org/10.7554/eLife.99194.3


