Confirmation of HLA-II associations with TB susceptibility in admixed African samples
- DSI-NRF Centre of Excellence for Biomedical Tuberculosis Research, South African Medical Research Council Centre for Tuberculosis Research, Division of Molecular Biology and Human Genetics, Faculty of Medicine and Health Sciences, Stellenbosch University, South Africa
- Centre for Bioinformatics and Computational Biology, Stellenbosch University, South Africa
Figures
Figure 1
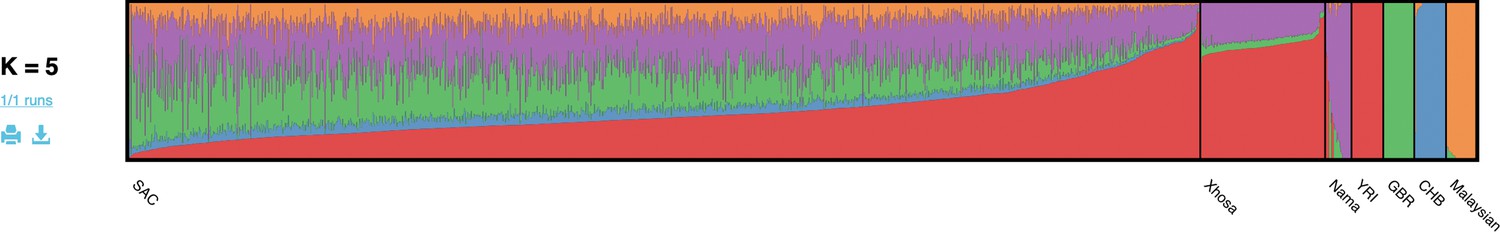
Genome-wide ancestral proportions of all individuals in the merged dataset.
Ancestral proportions for each individual are plotted vertically with different colours representing different contributing ancestries.
Figure 2
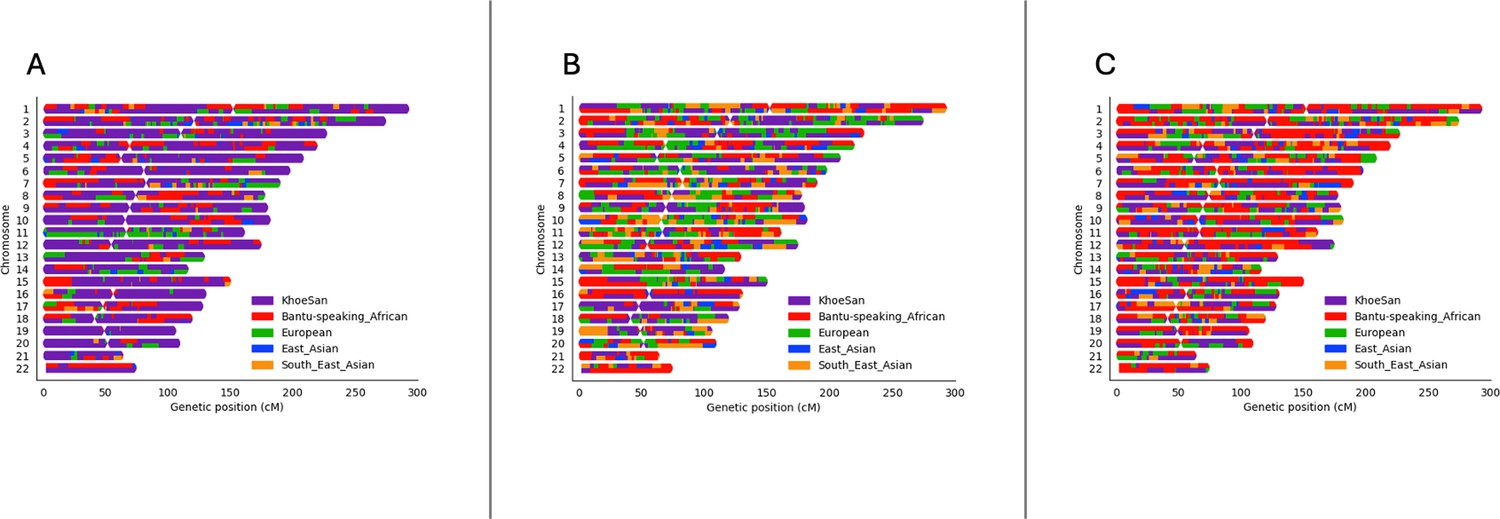
Local ancestry karyograms of three admixed individuals from the SAC population.
Each admixed individual (A, B and C) has unique local ancestry patterns generated by admixture among geographically distinct ancestral population groups.
Figure 3 with 1 supplement
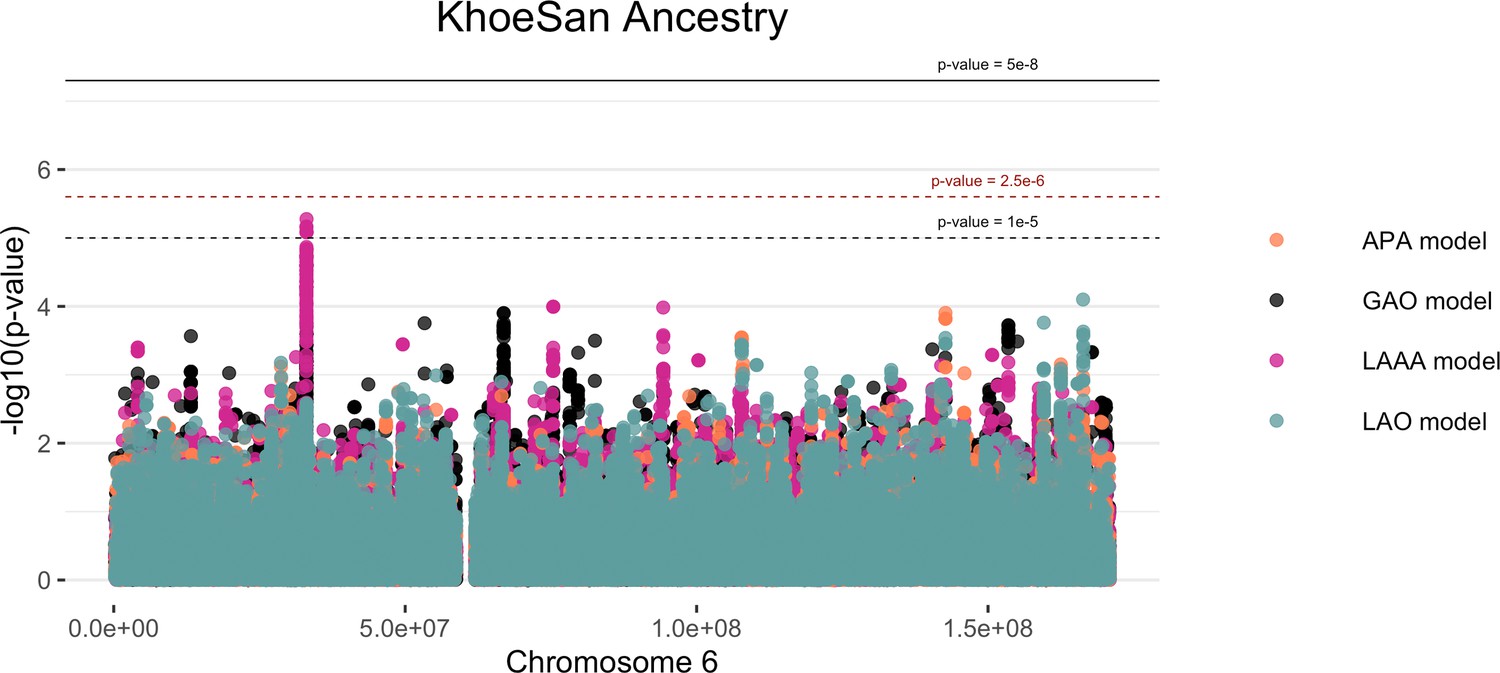
Log transformation of association signals obtained for KhoeSan ancestry whilst using the LAAA model on chromosome 6.
The thresholds for genome-wide significance (p-value = 5 x 10⁻⁸) and suggestive significance (p-value = 1 x 10⁻⁵) and the significance threshold for admixture mapping (p-value = 2.5 x 10⁻⁶) are shown. The four different models are represented in black (global ancestry only - GAO), blue (local ancestry effect - LAO), orange (ancestry plus allelic effect - APA), and pink (local ancestry adjusted allelic effect - LAAA).
Figure 3—figure supplement 1

QQ-plot of expected p-values and observed p-values for the association signals obtained for Khoisan ancestry located on chromosome 6.
Figure 4
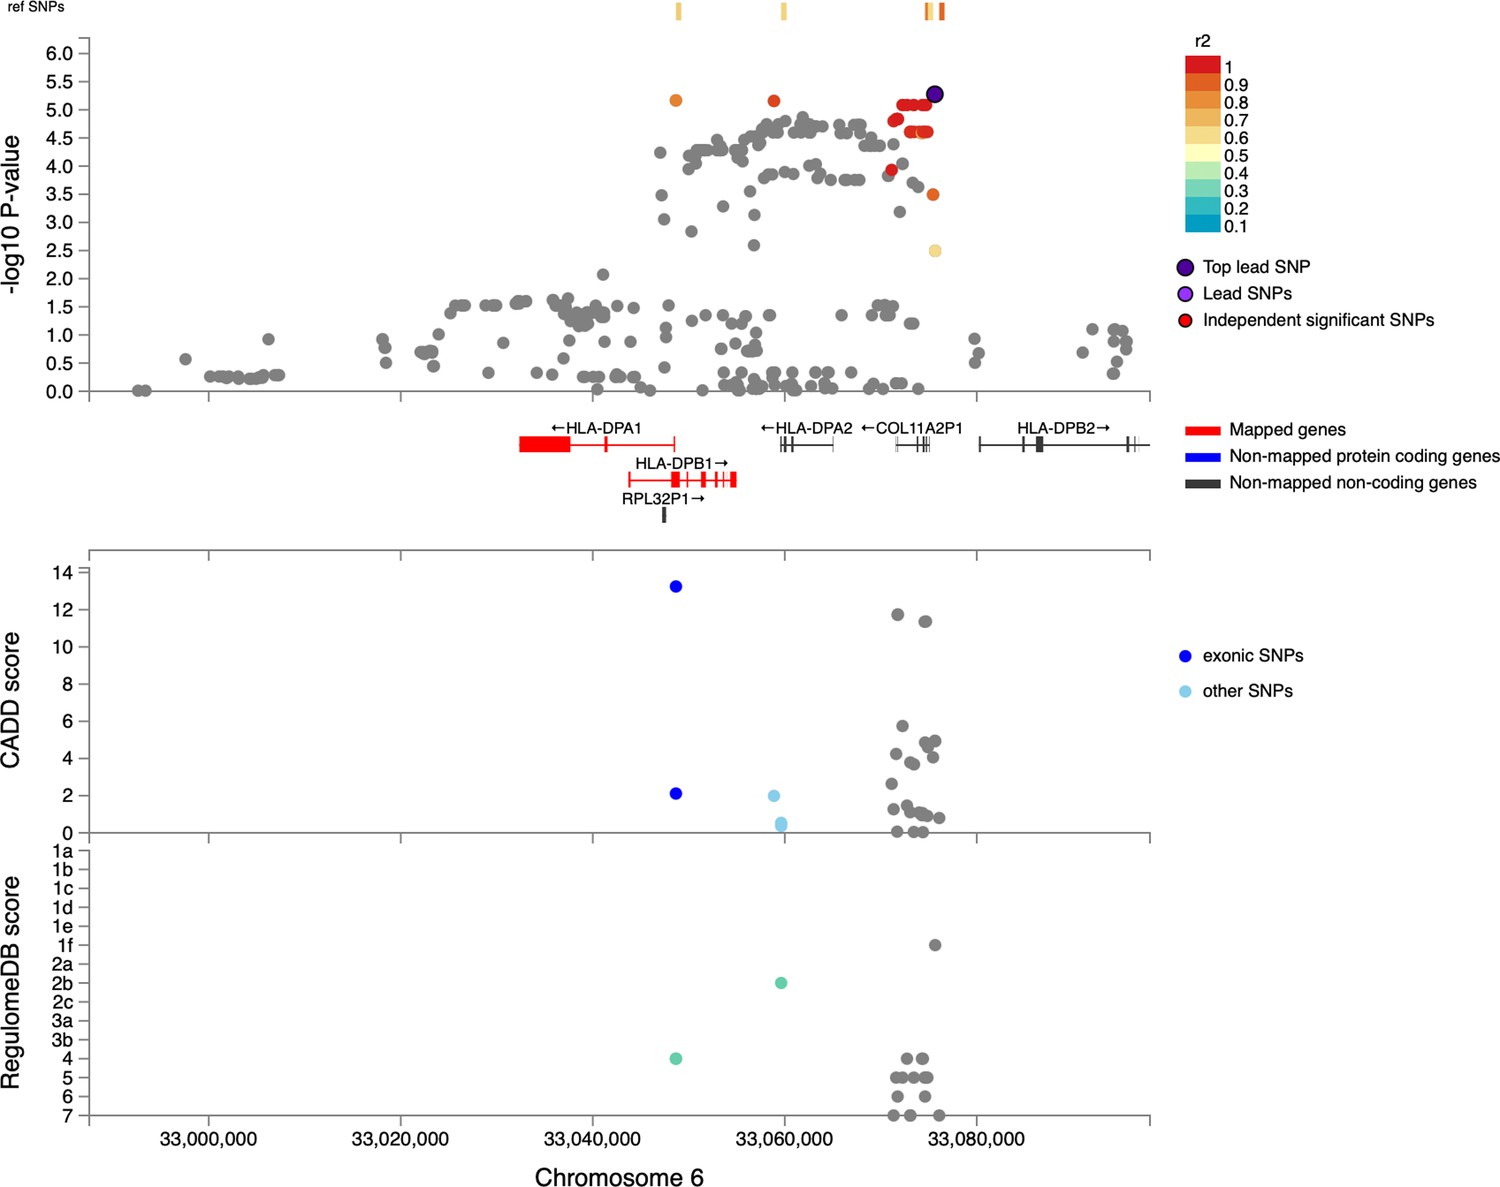
Regional plot indicating the nearest genes in the region of the lead variant (rs3117230) observed on chromosome 6.
SNPs in linkage disequilibrium (LD) with the lead variant are coloured red/orange. The lead variant is indicated in purple. Functional protein-coding genes are coded in red and non-functional (pseudo-genes) are indicated in black.
Figure 5

A schematic diagram of the location of HLA-II genes associated with TB susceptibility.
Genes in red were identified by the ITHGC. Genes in blue were identified by this study.
Tables
Table 1
Suggestive associations (p-value <1e–5) for the LAAA analysis adjusting for KhoeSan local ancestry on chromosome 6.
| Position | Marker name | Ref | Alt | AltFreq | OR (95% CI) | SE | p-value (x10–6) | Gene | Location | Imputed/typed | INFO score |
|---|---|---|---|---|---|---|---|---|---|---|---|
| 33075635 | rs3117230 | A | G | 0.370 | 0.437 (0.306; 0.624) | 0.182 | 5.292 | HLA-DPB1 | Intergenic | Genotyped | NA |
| 33048661 | rs1042151 | A | G | 0.325 | 0.437 (0.305; 0.627) | 0.184 | 6.806 | HLA-DPB1 | Exonic | Imputed | 0.992 |
| 33058874 | rs2179920 | C | T | 0.369 | 0.445 (0.313; 0.633) | 0.180 | 6.960 | HLA-DPB1 | Intergenic | Genotyped | NA |
| 33072266 | rs2064478 | C | T | 0.371 | 0.447 (0.313; 0.637) | 0.181 | 8.222 | HLA-DPB1 | Intergenic | Imputed | 1 |
| 33072729 | rs3130210 | G | T | 0.371 | 0.447 (0.313; 0.637) | 0.181 | 8.222 | HLA-DPB1 | Intergenic | Imputed | 0.999 |
| 33073440 | rs2064475 | G | A | 0.371 | 0.447 (0.313; 0.637) | 0.181 | 8.222 | HLA-DPB1 | Intergenic | Imputed | 1 |
| 33074348 | rs3117233 | T | C | 0.371 | 0.447 (0.313; 0.637) | 0.181 | 8.222 | HLA-DPB1 | Intergenic | Imputed | 1 |
| 33074707 | rs3130213 | G | A | 0.371 | 0.447 (0.313; 0.637) | 0.181 | 8.222 | HLA-DPB1 | Intergenic | Imputed | 0.970 |
-
Ref, reference allele; Alt, alternate allele; AltFreq, alternate allele frequency; OR, odds ratio; SE, standard error.
Table 2
Summary of the datasets included in analysis.
| Dataset | Genotyping platform | Self-reported ethnicity | Cases/controls | Reference |
|---|---|---|---|---|
| RSA(A) | Affymetrix 500 k | SAC | 642/91 | Daya et al., 2013 |
| RSA(M) | MEGA array 1.1 M | SAC | 555/440 | Schurz et al., 2018; Swart et al., 2021 |
| RSA(TANDEM) | H3Africa array | SAC and Bantu-speaking African | 161/133 | Swart et al., 2022b |
| RSA(NCTB) | H3Africa array | SAC | 49/111 | Oyageshio et al., 2023 |
| RSA(Worcester) | H3Africa array | SAC | 61 cases | Unpublished |
| RSA(Xhosa) | Whole genome sequencing | IsiXhosa | 44/120 | Unpublished |
Table 3
Ancestral populations included for global ancestry deconvolution.
| Population | n | Source |
|---|---|---|
| European (British – GBR) | 40 | 1000 Genomes (1000 G) phase 3 (Auton et al., 2015) |
| East Asian (Chinese – CHB) | 40 | 1000 G phase 3 |
| Bantu-speaking African (Yoruba – YRI) | 40 | 1000 G phase 3 |
| Southeast Asian (Malaysian) | 38 | Singapore Sequencing Malay Project (SSMP) (Wong et al., 2013) |
| KhoeSan (Nama) | 33 | African Genome Variation Project (AGVP/ADRP) (Gurdasani et al., 2015) |
Additional files
-
MDAR checklist
- https://cdn.elifesciences.org/articles/99200/elife-99200-mdarchecklist1-v1.docx
-
Supplementary file 1
Summary statistics for two variants within 800 base pairs of the ITHGC lead SNP 167 (rs28383206) on chromosome 6 for the LAAA analysis adjusting for KhoeSan and Bantu-speaking African local 168 ancestry.
- https://cdn.elifesciences.org/articles/99200/elife-99200-supp1-v1.xlsx
-
Supplementary file 2
The number of individuals and variants across all array datasets following genotype QC.
- https://cdn.elifesciences.org/articles/99200/elife-99200-supp2-v1.xlsx
-
Supplementary file 3
Summary of the age, sex and ancestral proportions for individuals in the merged cohort.
- https://cdn.elifesciences.org/articles/99200/elife-99200-supp3-v1.xlsx
-
Supplementary file 4
Summary statistics of the results for chromosome 6 whilst using the local ancestry adjusted allelic (LAAA) model whilst adjusting for KhoeSan ancestry.
- https://cdn.elifesciences.org/articles/99200/elife-99200-supp4-v1.xlsx
Download links
A two-part list of links to download the article, or parts of the article, in various formats.
Downloads (link to download the article as PDF)
Open citations (links to open the citations from this article in various online reference manager services)
Cite this article (links to download the citations from this article in formats compatible with various reference manager tools)
Confirmation of HLA-II associations with TB susceptibility in admixed African samples
eLife 13:RP99200.
https://doi.org/10.7554/eLife.99200.4


