Structural and dynamic impacts of single-atom disruptions to guide RNA interactions within the recognition lobe of Geobacillus stearothermophilus Cas9
- Department of Molecular Biology, Cell Biology and Biochemistry, Brown University, United States
- Departments of Bioengineering and Chemistry, University of California, Riverside, United States
- Brown University Transgenic Mouse and Gene Targeting Facility, United States
- Brown University RNA Center, United States
Figures
Figure 1 with 4 supplements
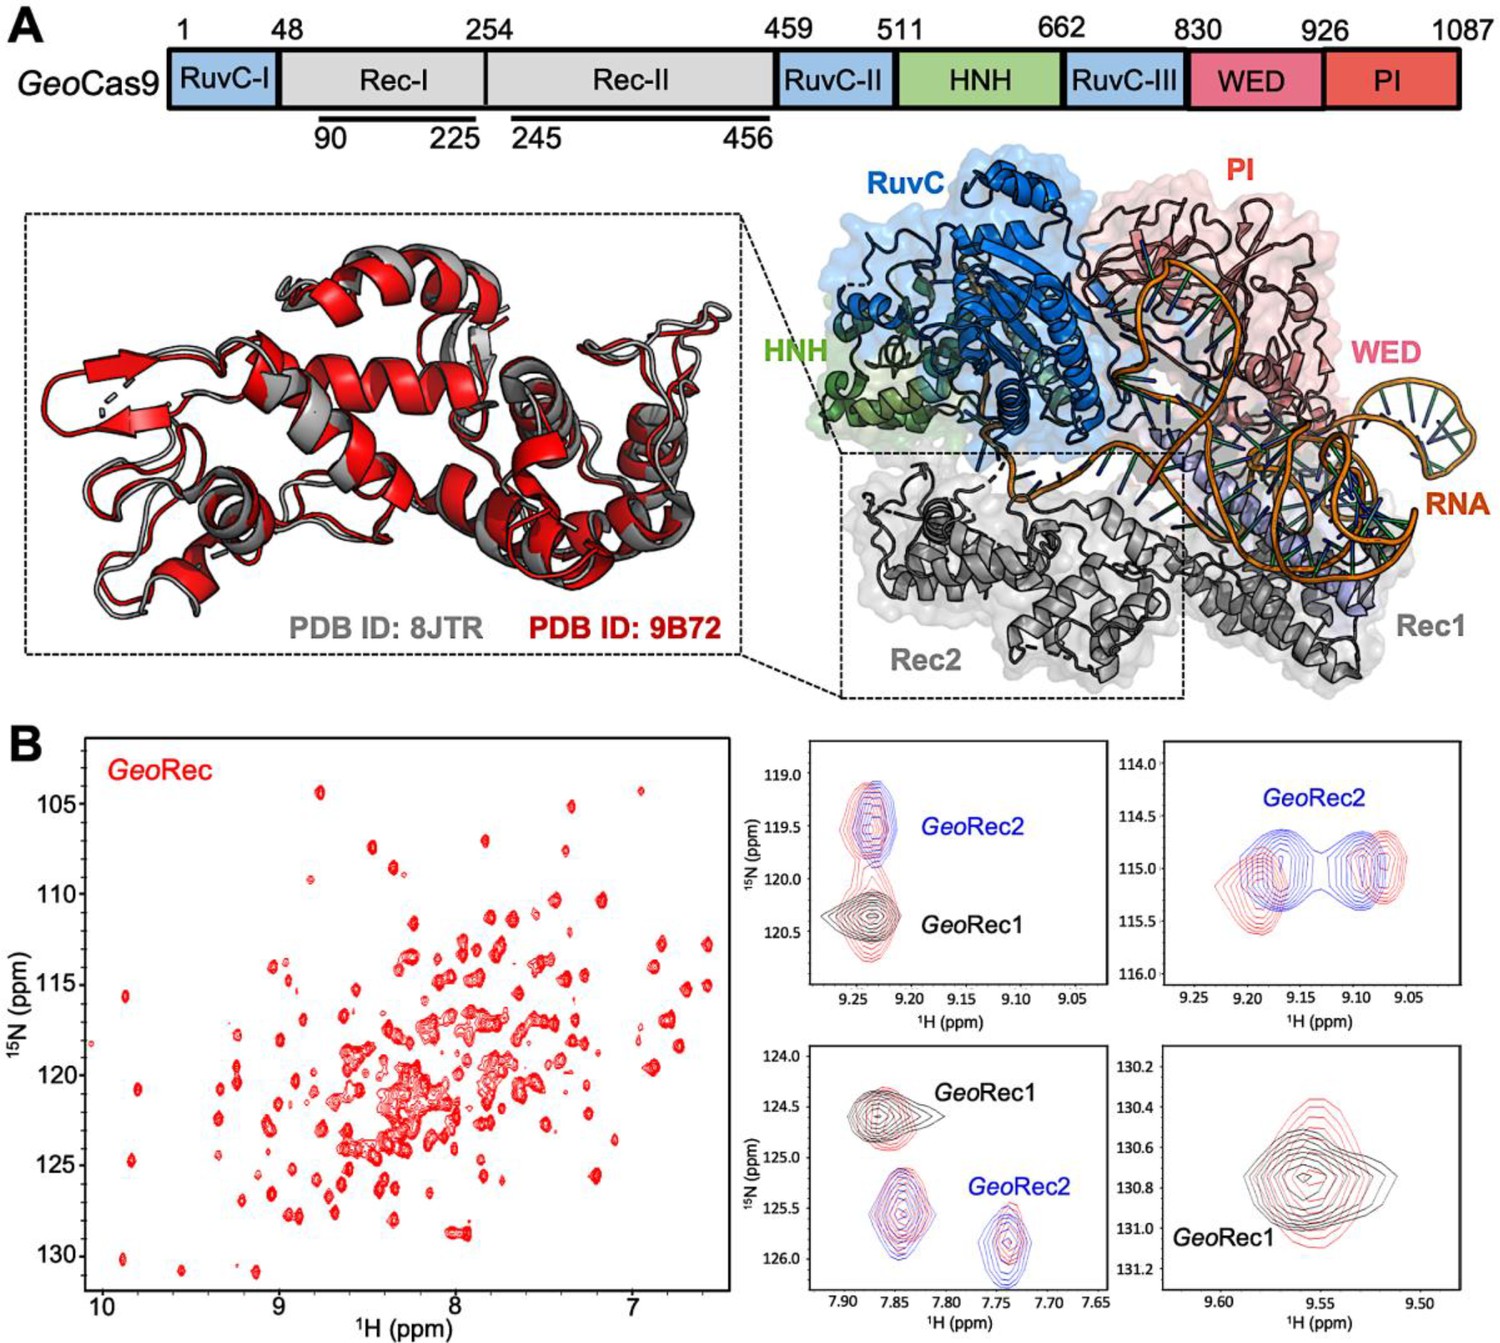
Architecture of GeoCas9 and the GeoRec domain.
(A) Arrangement of GeoCas9 domains across the primary sequence. The cryo-EM structure of GeoCas9 in complex with gRNA (PDB: 8JTR) shows poor resolution of HNH. The GeoRec2 domain from PDB: 8JTR (gray) is overlaid with our X-ray structure of GeoRec2 (red, PDB: 9B72). (B) 1H15N TROSY HSQC NMR spectrum of GeoRec collected at 850 MHz. Overlays of this spectrum with resonances from spectra of GeoRec1 (black) and GeoRec2 (blue) demonstrate a structural similarity between the isolated subdomains and intact GeoRec.
Figure 1—figure supplement 1
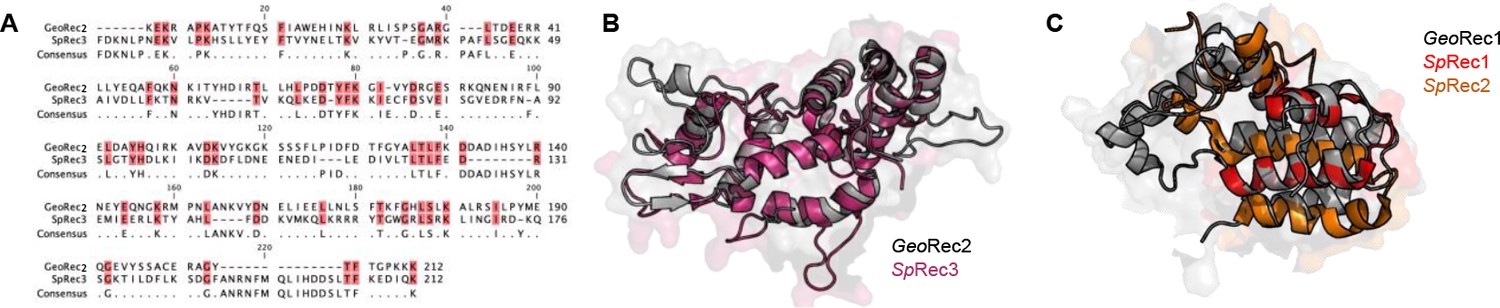
Sequence and structure analysis of GeoRec and SpyRec.
(A) Sequence alignment of GeoRec2 and SpyRec3. Conservedresidues are highlighted pink and are listed as consensus. (B) Overlay of the GeoRec2 X-raycrystal structure (gray) with SpyRec3 from full-length SpyCas9 (pink, PDB: 4UN3). (C) Overlayof the GeoRec1 structure derived from full-length GeoCas9 modeled with Alphafold2 (gray)with the homologous portion of SpyRec1and SpyRec2 from SpyCas9 (PDB: 4UN3) in red andorange, respectively.
Figure 1—figure supplement 2
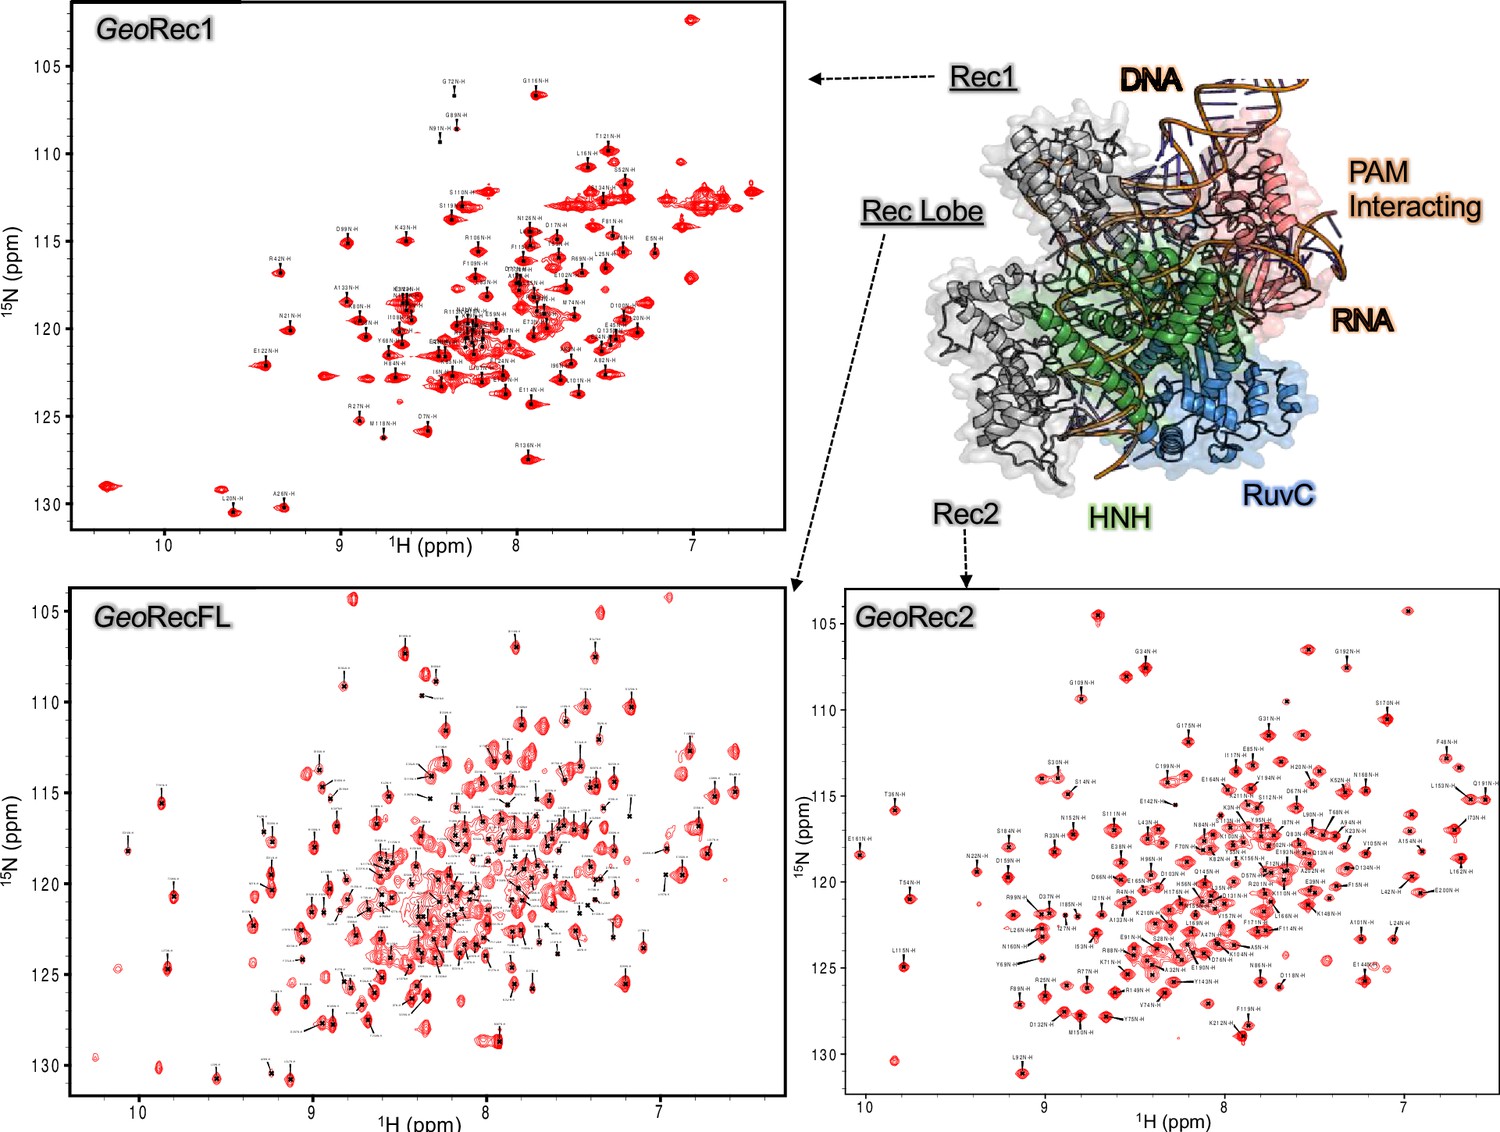
Assigned 1H-15N TROSY HSQC spectrum of GeoRec1 (top left), GeoRec (bottom left), and GeoRec2 (bottom right).
Figure 1—figure supplement 3
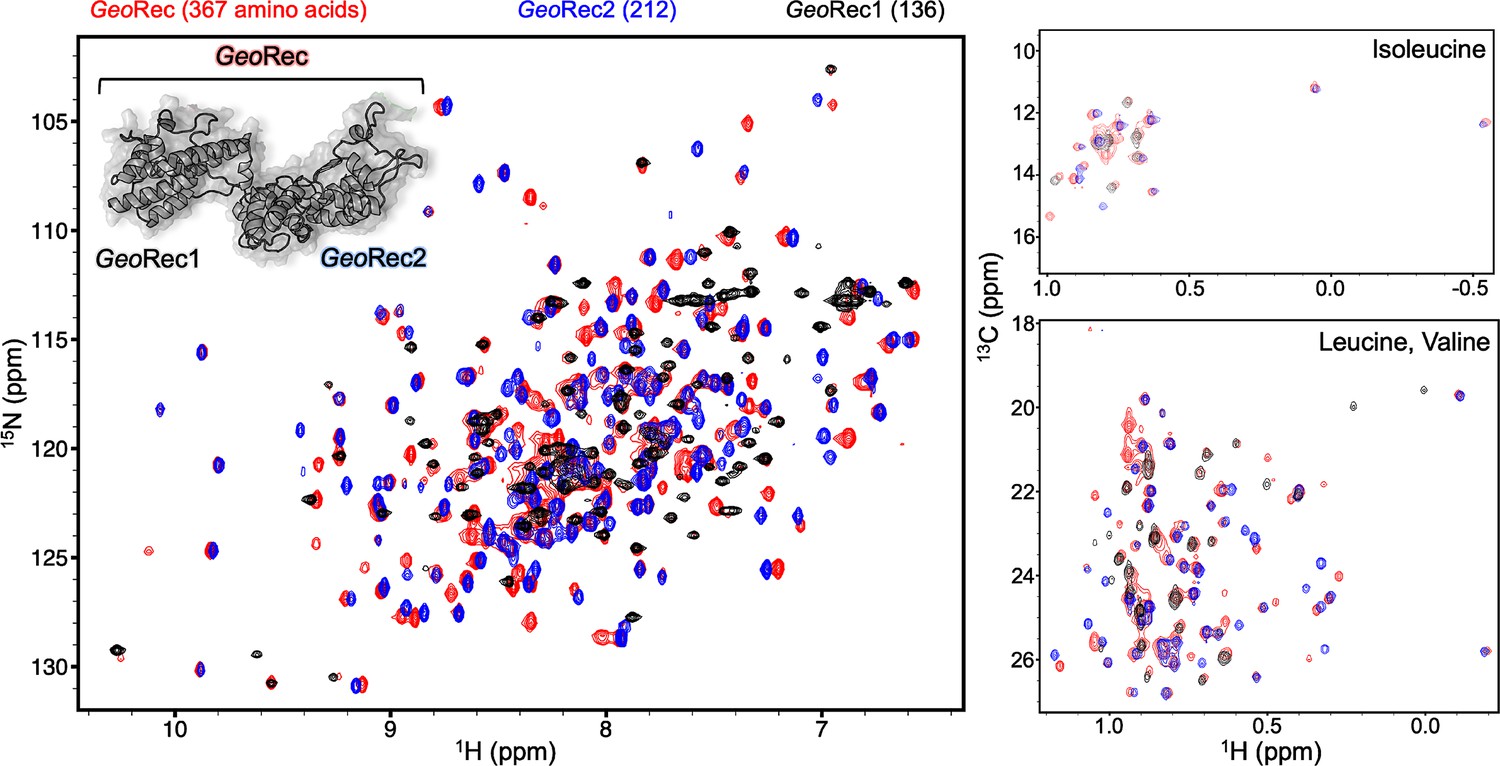
The dumbbell shape of GeoRec is composed of the GeoRec1and GeoRec2 subdomains.
Overlay of 1H-15N TROSY HSQC spectra of GeoRec (red), GeoRec1(black), and GeoRec2 (blue) collected at 850 MHz shows that spectra of isolated GeoRec subdomains overlay nicely with the spectrum of GeoRec. The number of amino acids that makeup each construct are indicated above the spectrum. Overlaid 1H-13CH3 ILV-methyl spectra of GeoRec (red), GeoRec1 (black), and GeoRec2 (blue), show a similar property of thesubdomains.
Figure 1—figure supplement 4
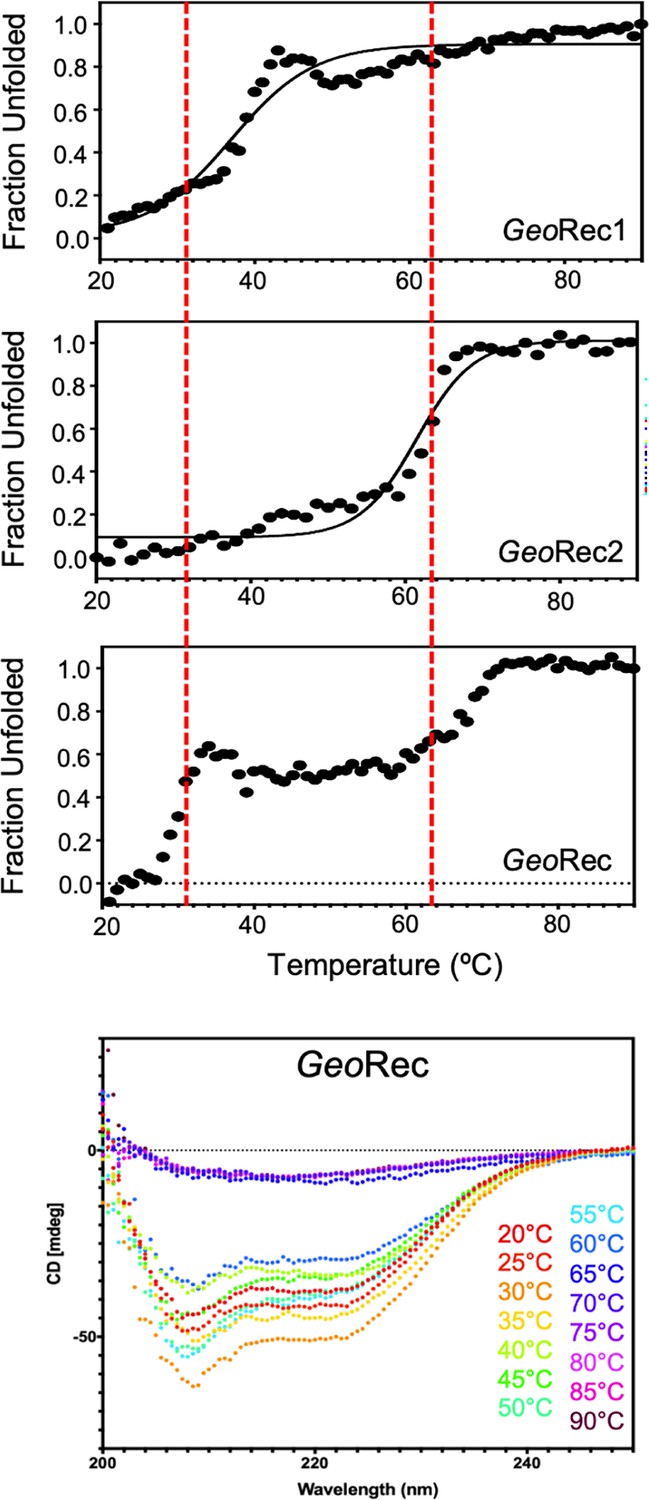
Temperature-dependent CD unfolding profiles of GeoRec1, GeoRec2, and GeoRec reveal that the unfolding profile of the individual subdomains are conserved within that of GeoRec.
CD spectra spanning 200 – 250 nm at increasing temperatures (20-90 °C, bottom) show a gradual loss of GeoRec secondary structure to ~60 °C, followed by an abrupt and complete unfolding at 65 °C, beyond the Tm of GeoRec2. The Tm of GeoRec1 and 2 were determined by fitting the CD data as described in the Materials and methods. The red dashed lines indicate the Tm values of GeoRec1 and GeoRec2, to guide the interpretation of the full-length GeoRec unfolding profile.
Figure 2 with 2 supplements
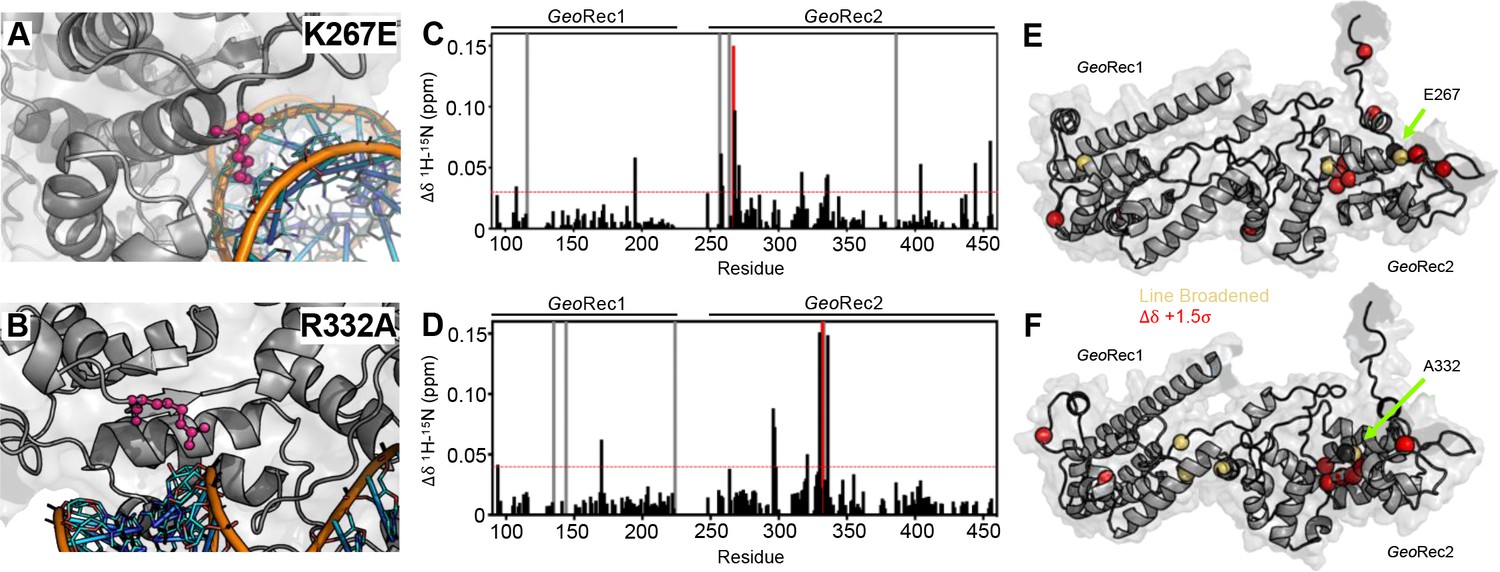
Impact of single-point mutations on the GeoRec structure.
(A, B) Sites of selected mutations within GeoRec2, K267, and R332, are highlighted as purple sticks directly facing the RNA and DNA modeled from NmeCas9 (PDB ID: 6JDV), allowing for prediction of the binding orientation within GeoCas9. NMR chemical shift perturbations caused by the K267E (C) or R332A (D) mutations are plotted for each residue of GeoRec. Gray bars denote sites of line broadening, the blue bar denotes an unassigned region of GeoRec corresponding to the native Rec1-Rec2 linker, and the red bar indicates the mutation site. The red dashed line indicates 1.5σ above the 10% trimmed mean of the data. Chemical shift perturbations 1.5σ above the 10% trimmed mean are mapped onto K267E (E) and R332A (F) GeoRec (red spheres). Resonances that have broadened beyond detection are mapped as yellow spheres and the mutation sites are indicated by a black sphere and green arrow.
Figure 2—figure supplement 1
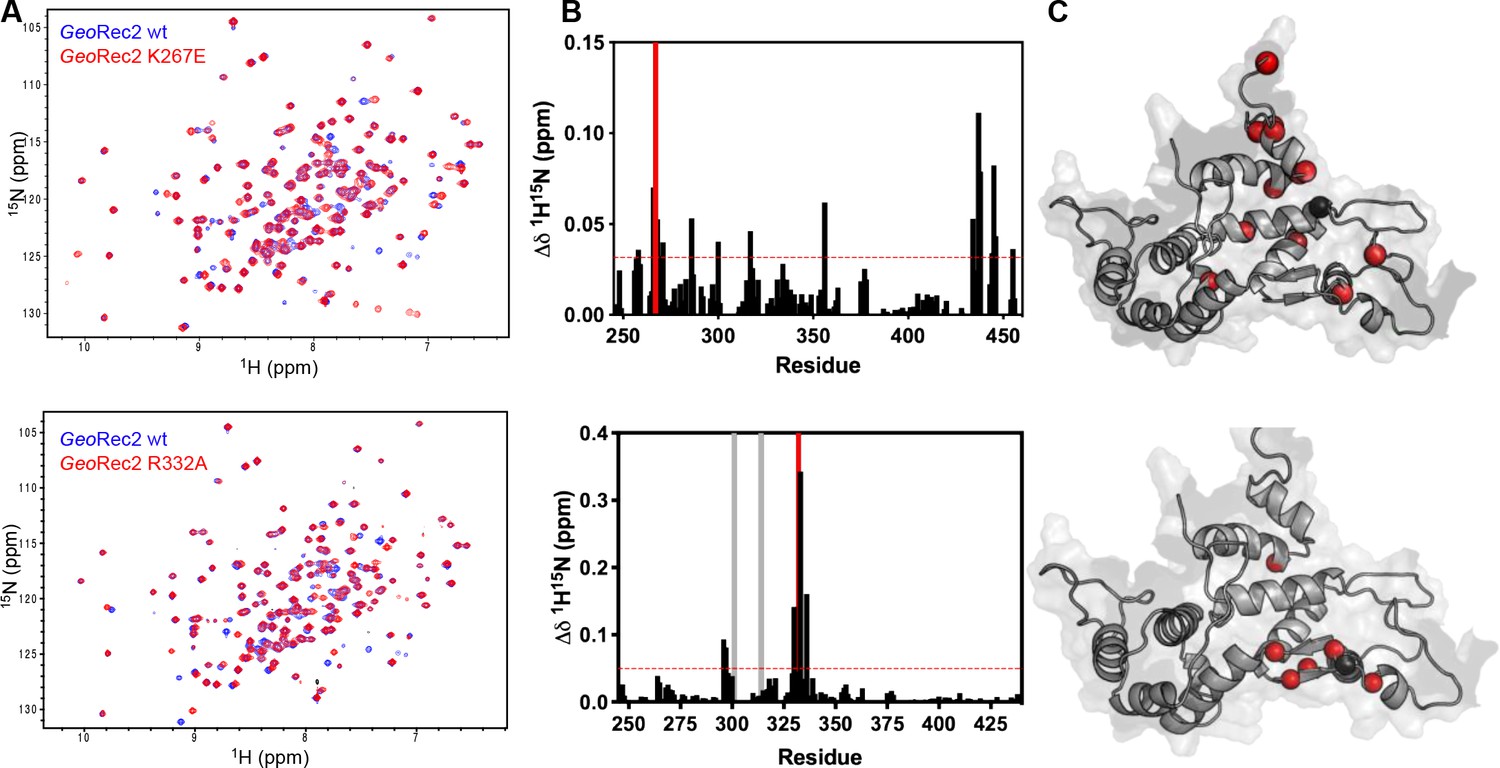
Local impact of mutations on GeoRec2.
(A) 600 MHz 1H15N TROSY HSQC spectra of WT GeoRec2 (blue) overlaid with K267E GeoRec2 (red, top) and R332A GeoRec2 (red, bottom). (B) Chemical shift perturbations caused by K267E (top) or R332A (bottom) mutations are plotted for each residue. Resonances broadened beyond detection are marked with gray bars. The mutation site is marked with a red bar. (C) Chemical shift perturbations >1.5σ of the 10% trimmed mean of all shifts are shown as red spheres on the GeoRec2. The mutation site is shown as black sphere.
Figure 2—figure supplement 2
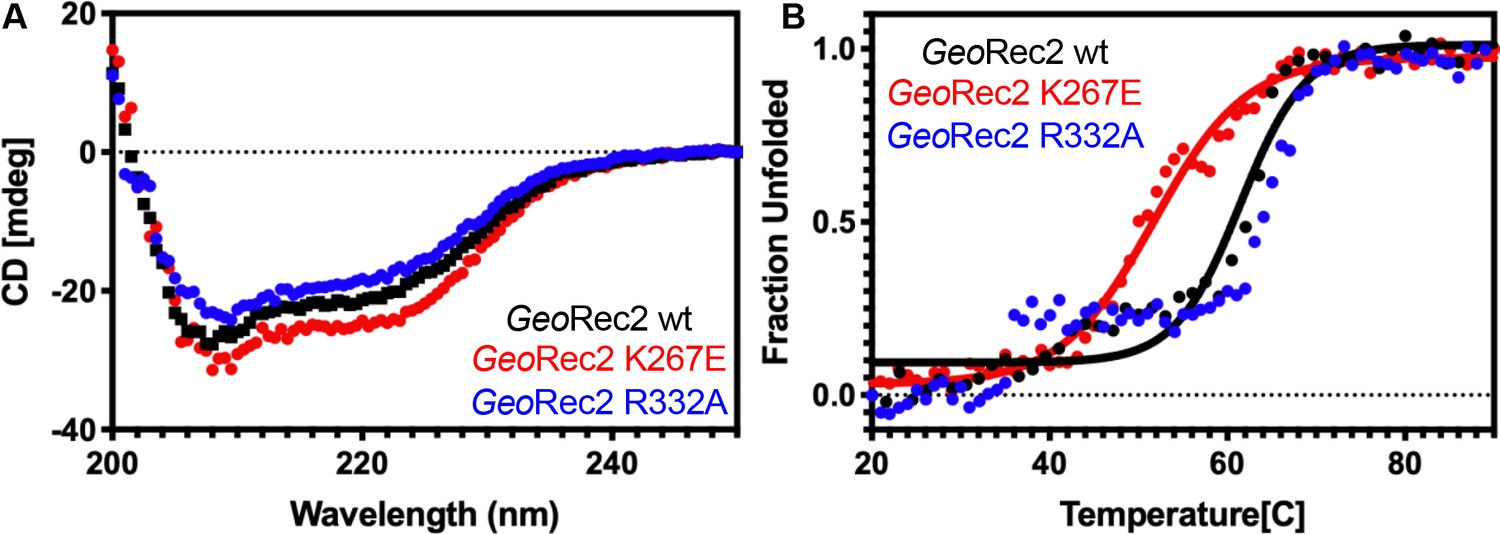
Secondary structure and stability of WT GeoRec2 and variants.
(A) Raw CD spectra of WT GeoRec2 (black), K267E GeoRec2 (red), and R332A GeoRec2 (blue). (B) Temperature-dependent CD spectra reveal that K267E GeoRec2 unfolds at a lower temperature (~55 °C, red) than WT GeoRec2 (~62 °C, black). R332A GeoRec2 undergoes a smaller unfolding event around 40 °C before completely unfolding ~62 °C (blue). The data were fit as described in the Materials and methods.
Figure 3 with 4 supplements
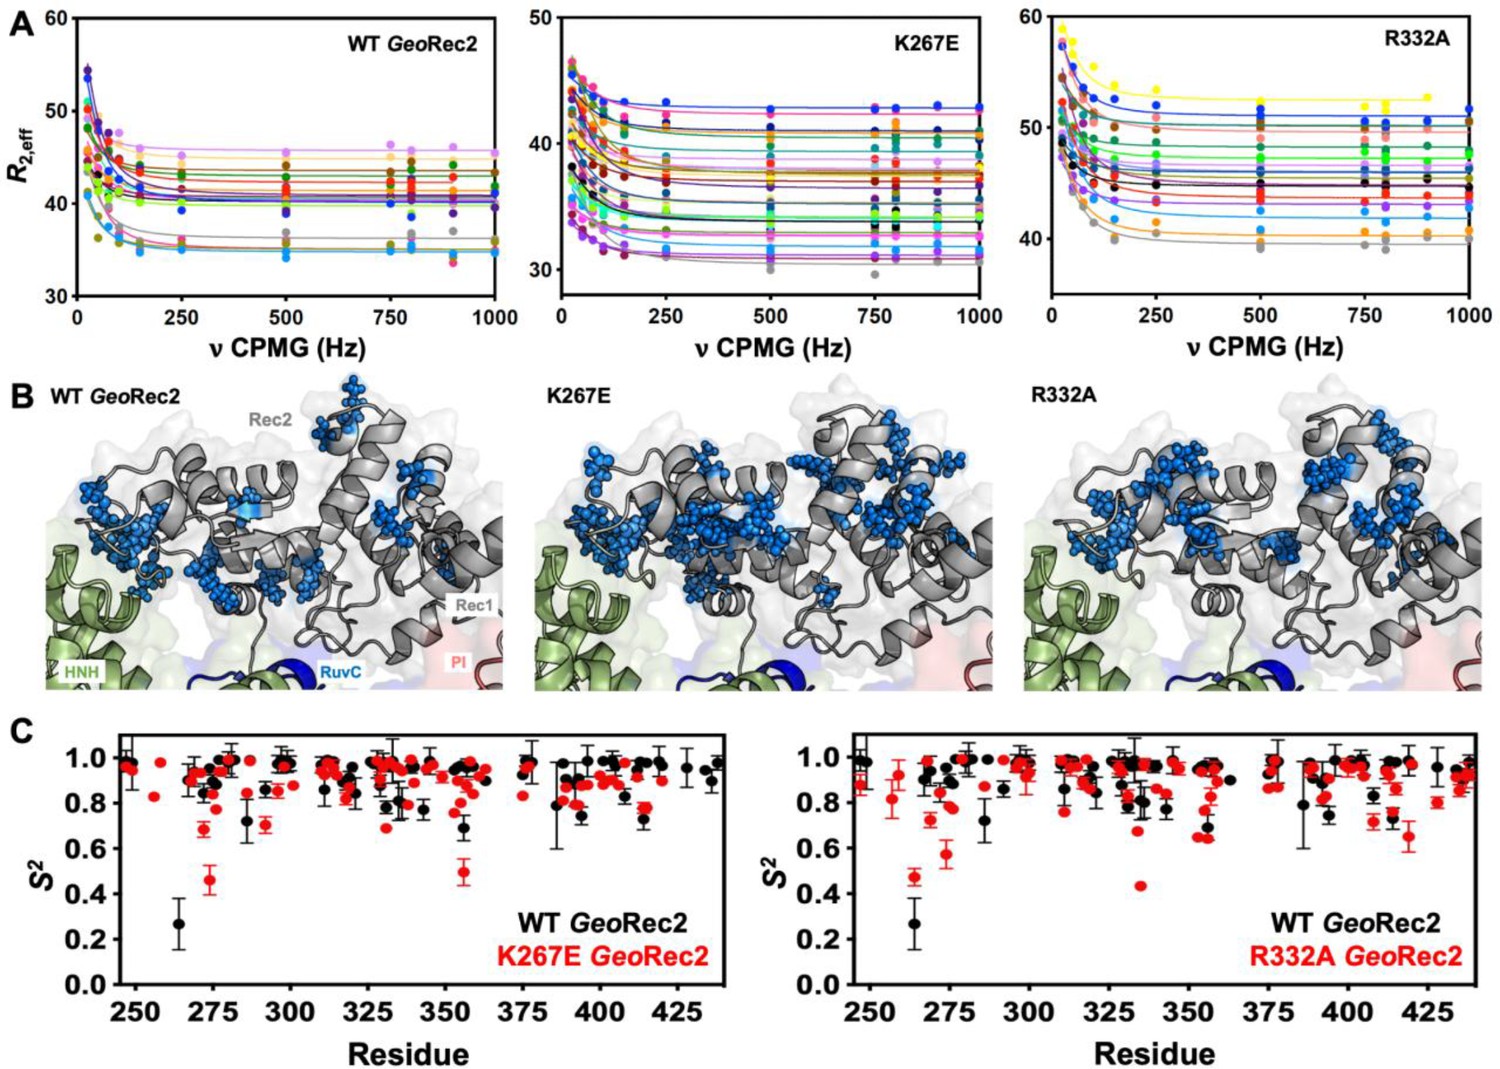
Single-point mutations enhance millisecond motions of GeoRec2.
(A) CPMG relaxation dispersion profiles of all residues with evidence of μs-ms motion, fit to a global kex of 147±41 s–1 (WT GeoRec2, left), 376±89 s–1 (K267E GeoRec2, center), and 142±28 s–1 (R332A GeoRec2, right) collected at 25 °C and 600 MHz. Residues are colored in accordance with Supplementary file 1. Relaxation dispersion profiles for individual resonances are shown in Figure 3—figure supplements 2–4. (B) Sites exhibiting CPMG relaxation dispersion in (A) are mapped to GeoRec as blue spheres. Adjacent domains within the cryo-EM structure of GeoCas9 are also shown. (C) Per-residue NMR order parameters of WT (black), K267E, and R332A (red, separate plots) GeoRec.
Figure 3—figure supplement 1
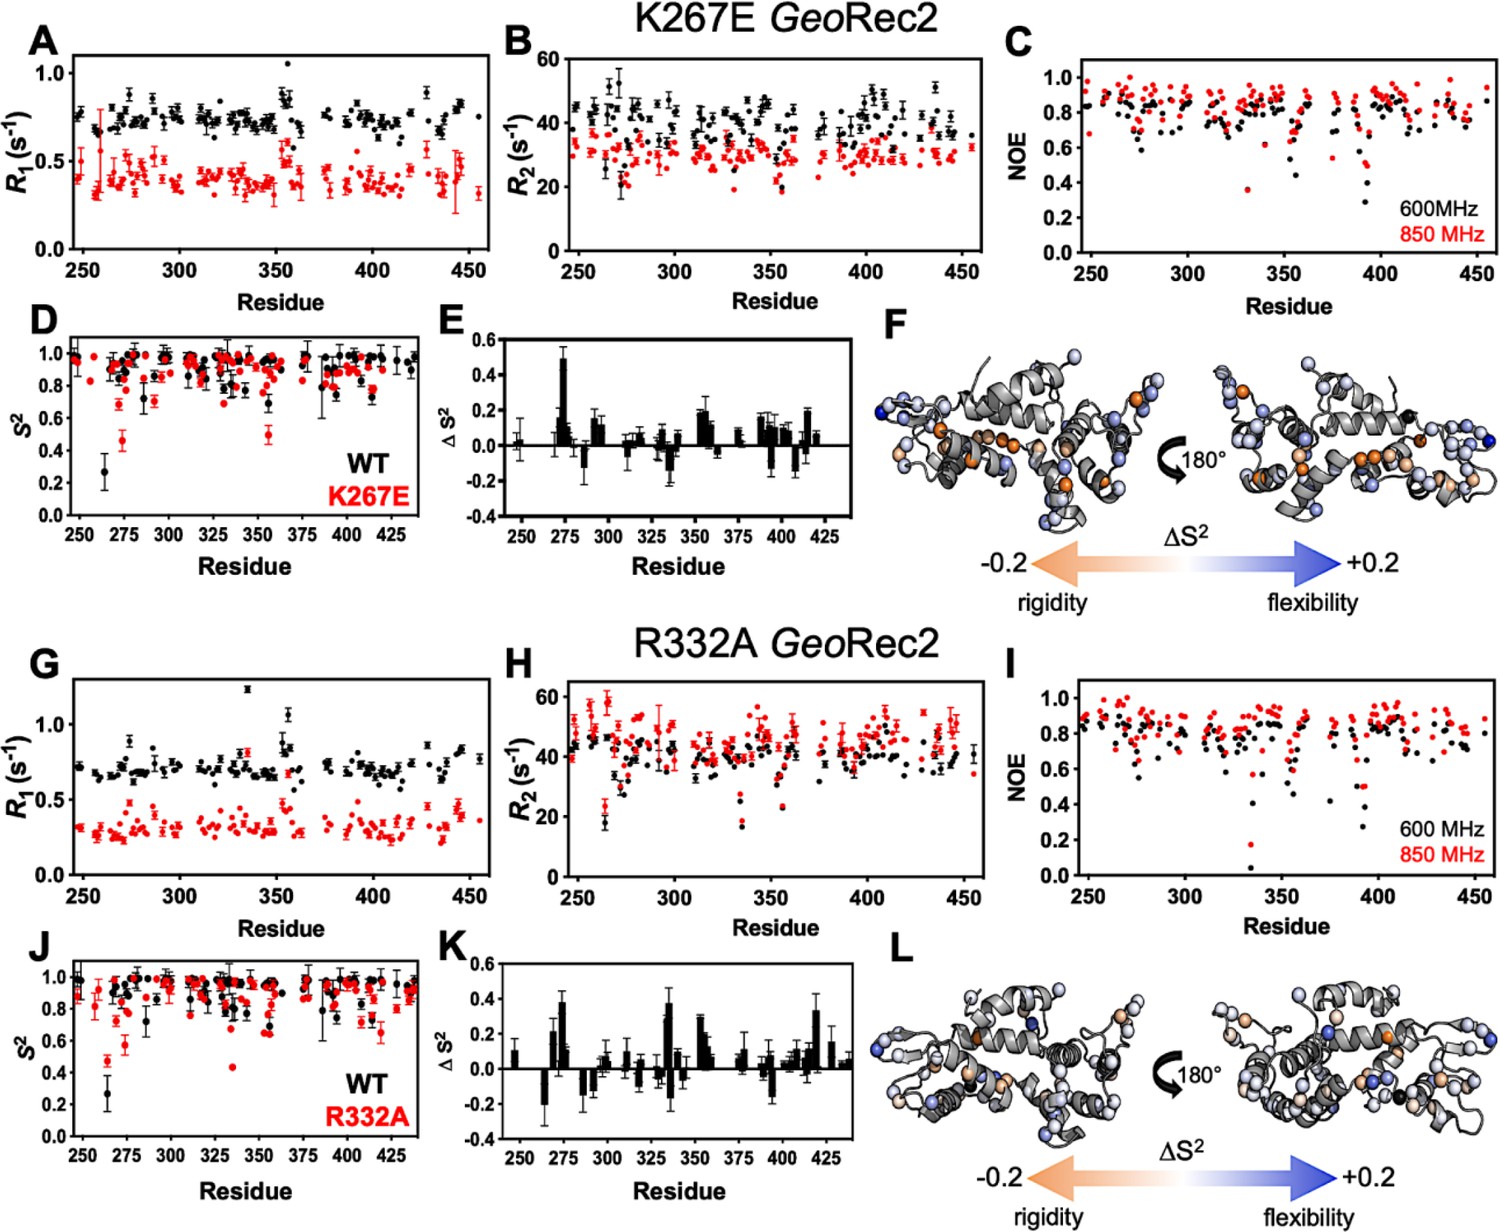
Effect of single-point mutations on fast timescale motions in GeoRec2.
R1 (A), R2 (B), and 1H-[15N] NOE (C) values for K267E GeoRec2 measured by NMR at 600 MHz (black) and 850 MHz (red). (D) Order parameters (S2) for K267E GeoRec2 determined from Model-free analysis of R1, R2, and 1H-[15N] NOE measurements (red) overlaid with S2 values of WT GeoRec2 (black). ∆S2 (plotted as WT – mutant) for K267E GeoRec2 (E), where a negative or positive values correspond to suppressed or heightened ps-ns flexibility of that site, respectively. K267E ∆S2 values are mapped onto the GeoRec2 X-ray crystal structure in (F). R1 (G), R2 (H), and 1H-[15N] NOE (I) values for R332A GeoRec2 measured by NMR at 600 MHz (black) and 850 MHz (red). (J) Order parameters (S2) for R332A GeoRec2 (red) overlaid with S2 values of WT GeoRec2 (black). ∆S2 (plotted as WT – mutant) for R332A GeoRec2 (K) band R332A ∆S2 values are mapped onto the GeoRec2 X-ray crystal structure in (L).
Figure 3—figure supplement 2
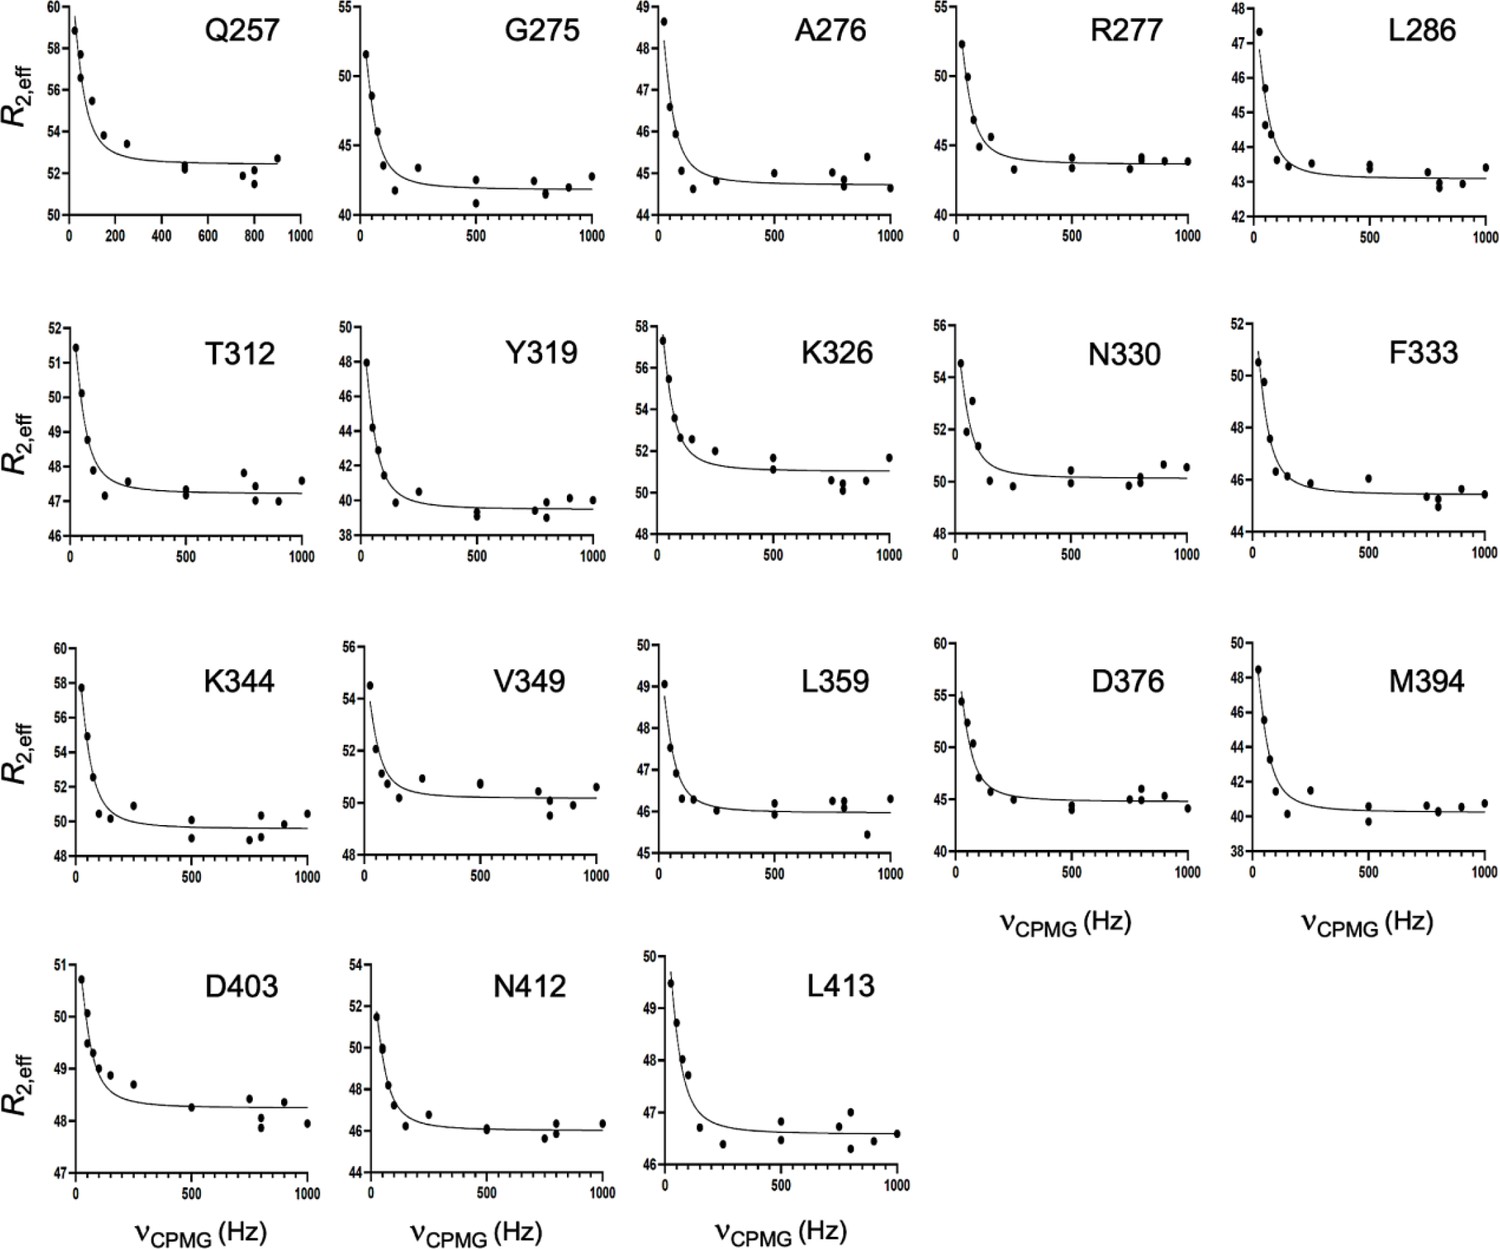
CPMG relaxation dispersion curves collected at 25 °C and 600 MHz for WT GeoRec2.
A global fit of all dispersion curves was determined to be superior based on the Akaike Information Criterion.
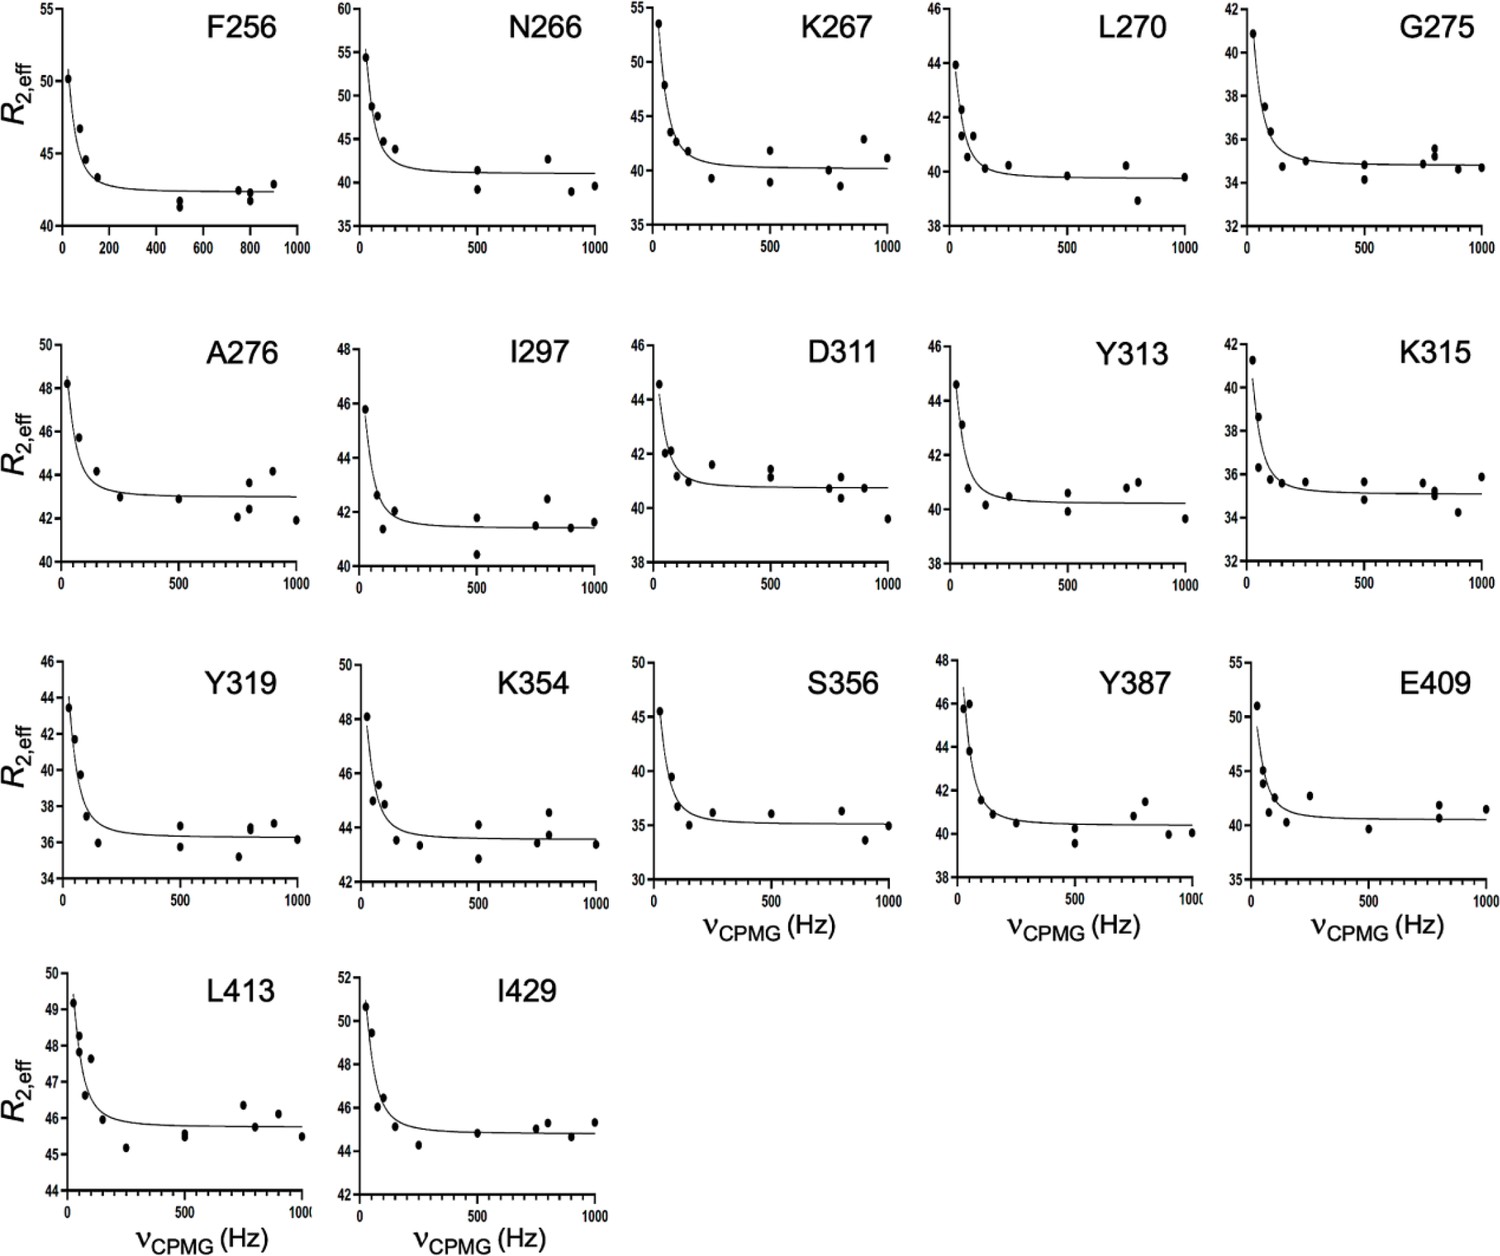
Figure 3—figure supplement 3
CPMG relaxation dispersion curves collected at 25 °C and 600 MHz for K267E GeoRec2.
A global fit of all dispersion curves was determined to be superior based on the Akaike Information Criterion.
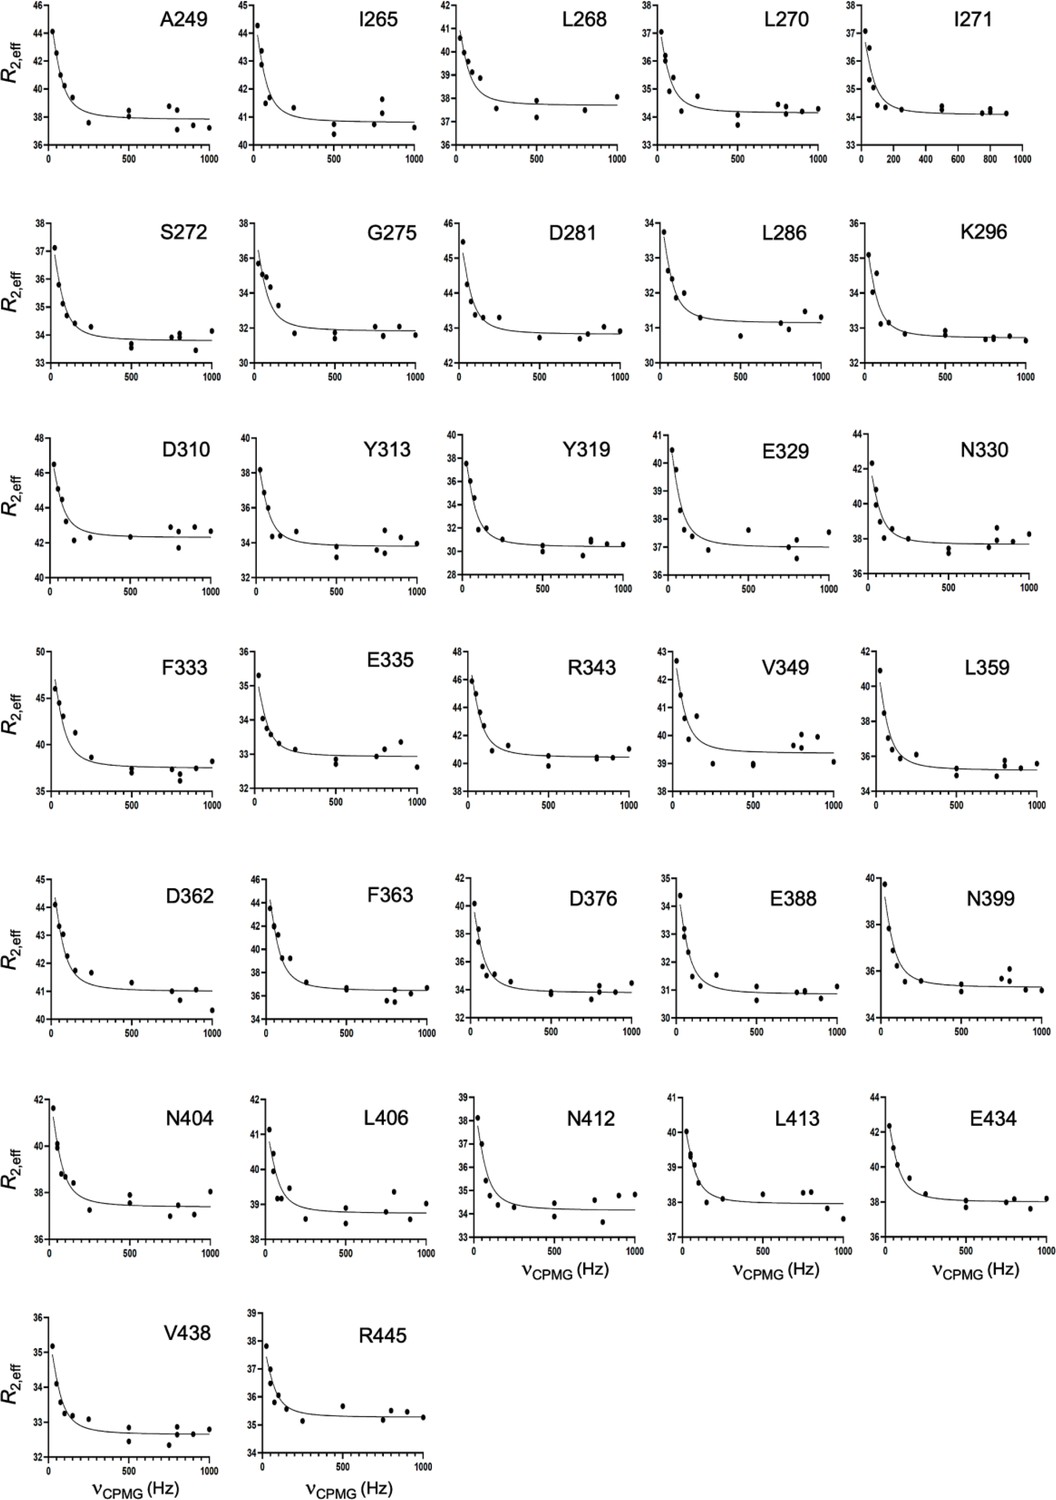
Figure 3—figure supplement 4
CPMG relaxation dispersion curves collected at 25 °C and 600 MHz for R332A GeoRec2.
A global fit of all dispersion curves was determined to be superior based on the Akaike Information Criterion.
Figure 4 with 4 supplements
Mutations diminish the interaction between GeoRec and RNA.
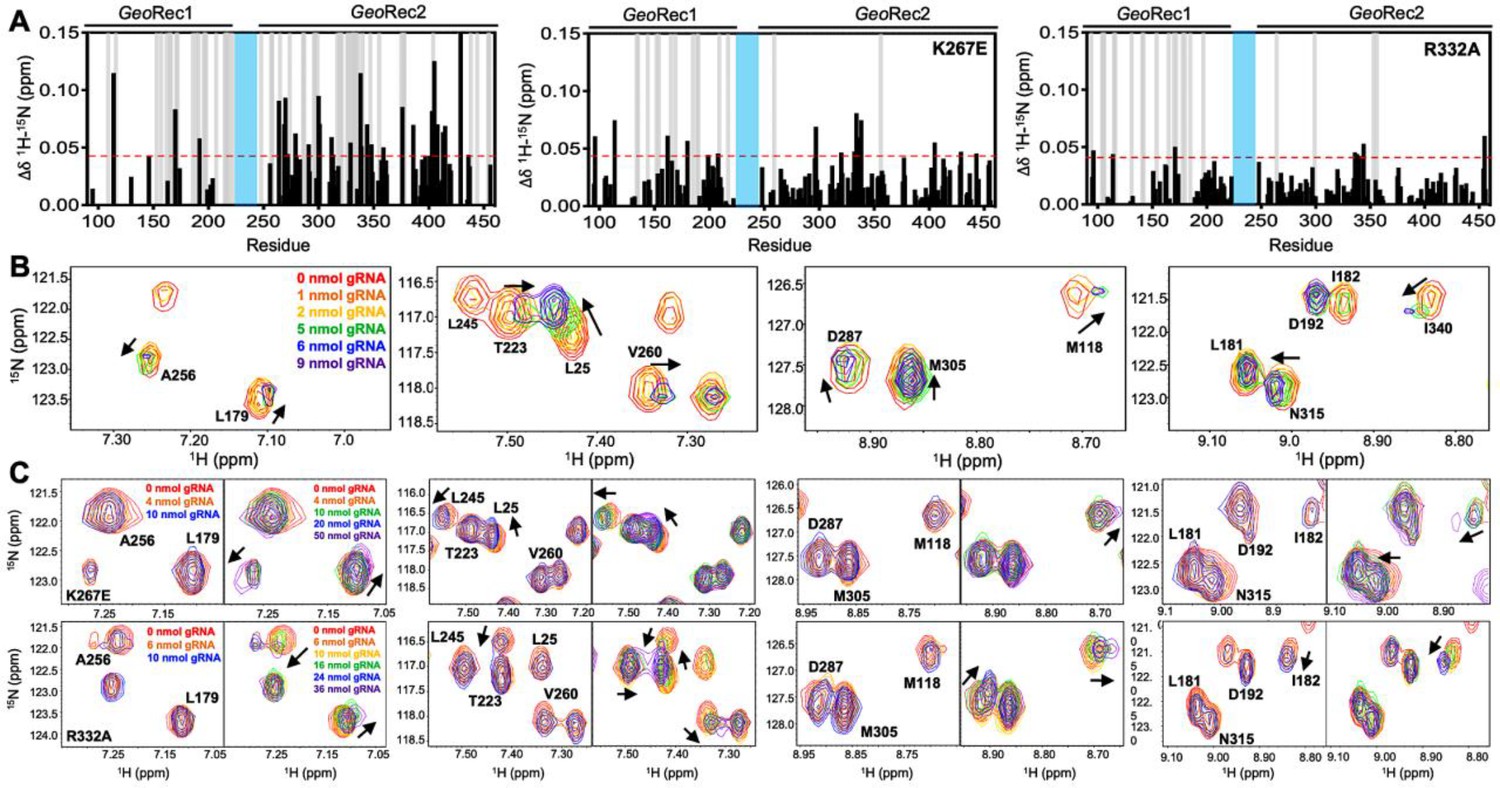
(A) NMR chemical shift perturbations caused by RNA binding to WT, K267E, and R332A GeoRec. Gray bars denote sites of line broadening, and the blue bar denotes an unassigned region of GeoRec corresponding to the flexible Rec1-Rec2 linker. The red dashed line indicates 1.5σ above the 10% trimmed mean of the data. (B) Representative NMR resonance shifts caused by titration of a 39nt portion of the full gRNA into WT GeoRec. (C) NMR titration of 39nt RNA into K267E (top) and R332A (bottom) GeoRec. The left panel of each pair demonstrates that minimal change in NMR chemical shift or resonance intensity is apparent at RNA concentrations mimicking the WT titration. The right panel of each pair depicts the titration over a threefold wider concentration range of RNA, where shifts and line broadening are visible. Representative resonances are colored by increasing RNA concentration in the legend.
Figure 4—figure supplement 1
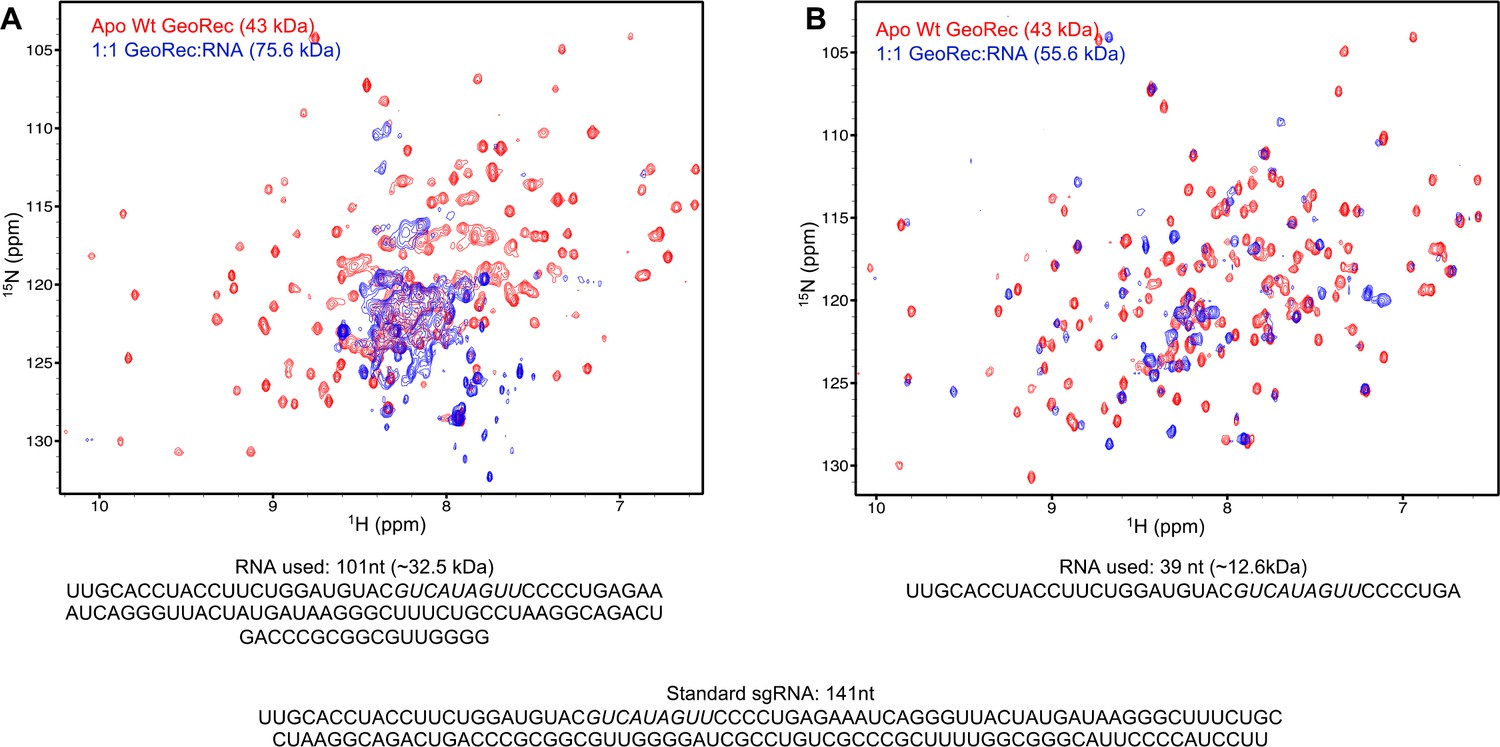
850 MHz 1H15N TROSY HSQC NMR spectra of apo-GeoRec (red) and GeoRec in complex with either a 101-nt.
(A) or 39-nt portion of the full gRNA (B) at a 1:1 molar ratio (blue). The RNA sequence used in each NMR binding experiment is shown below each spectrum, along with the full-length gRNA sequence.
Figure 4—figure supplement 2
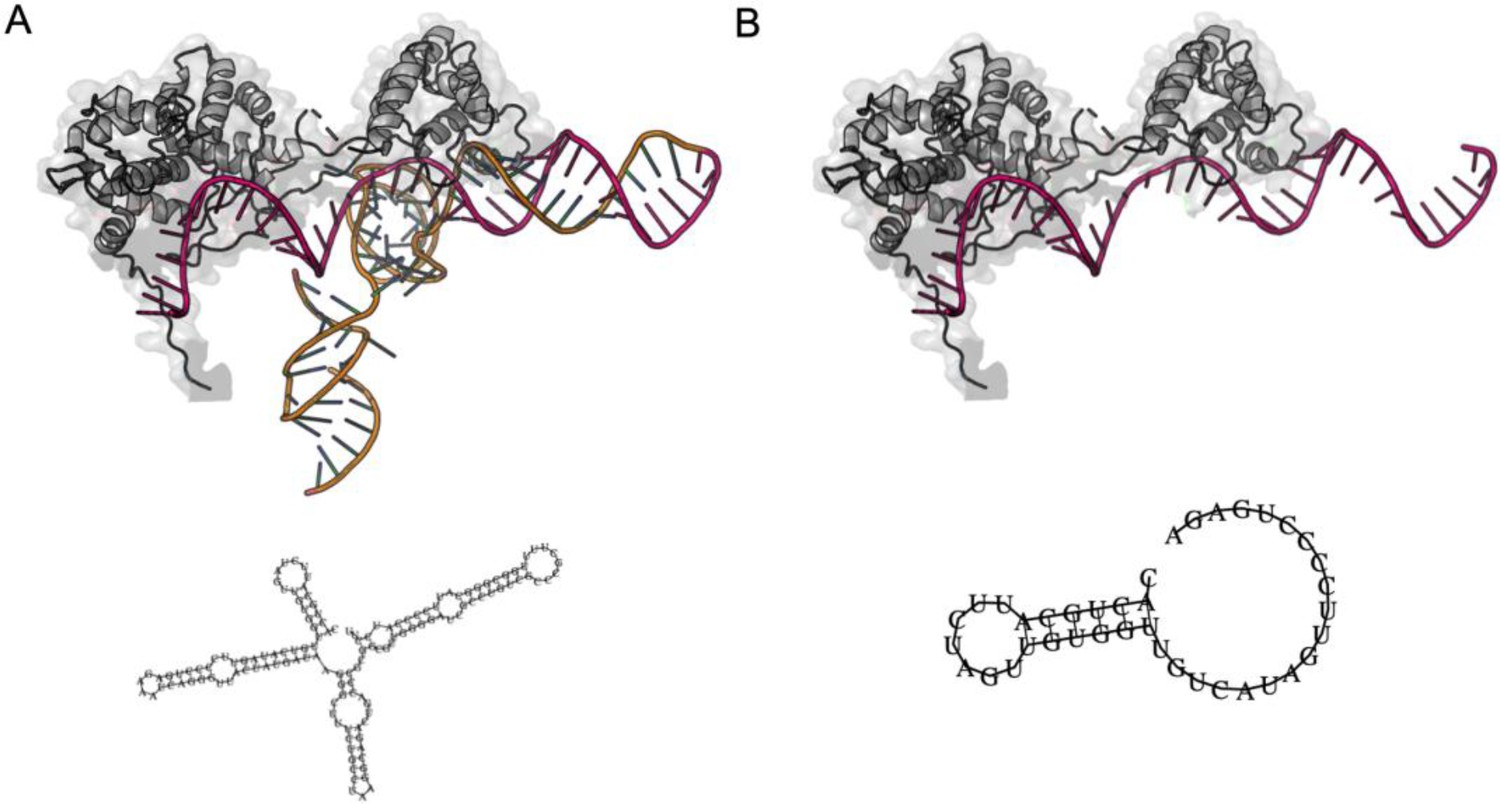
Structures of full-length.
(A) and truncated (B) GeoCas9 gRNAs used in this work, based on the cryo-EM structure PDB: 8UZA. The 2D structure cartoons below each representation were predicted from sequence by the RNAfold web server (http://rna.tbi.univie.ac.at/cgi-bin/RNAWebSuite/RNAfold.cgi) maintained by the Institute for Theoretical Chemistry, University of Vienna.
Figure 4—figure supplement 3
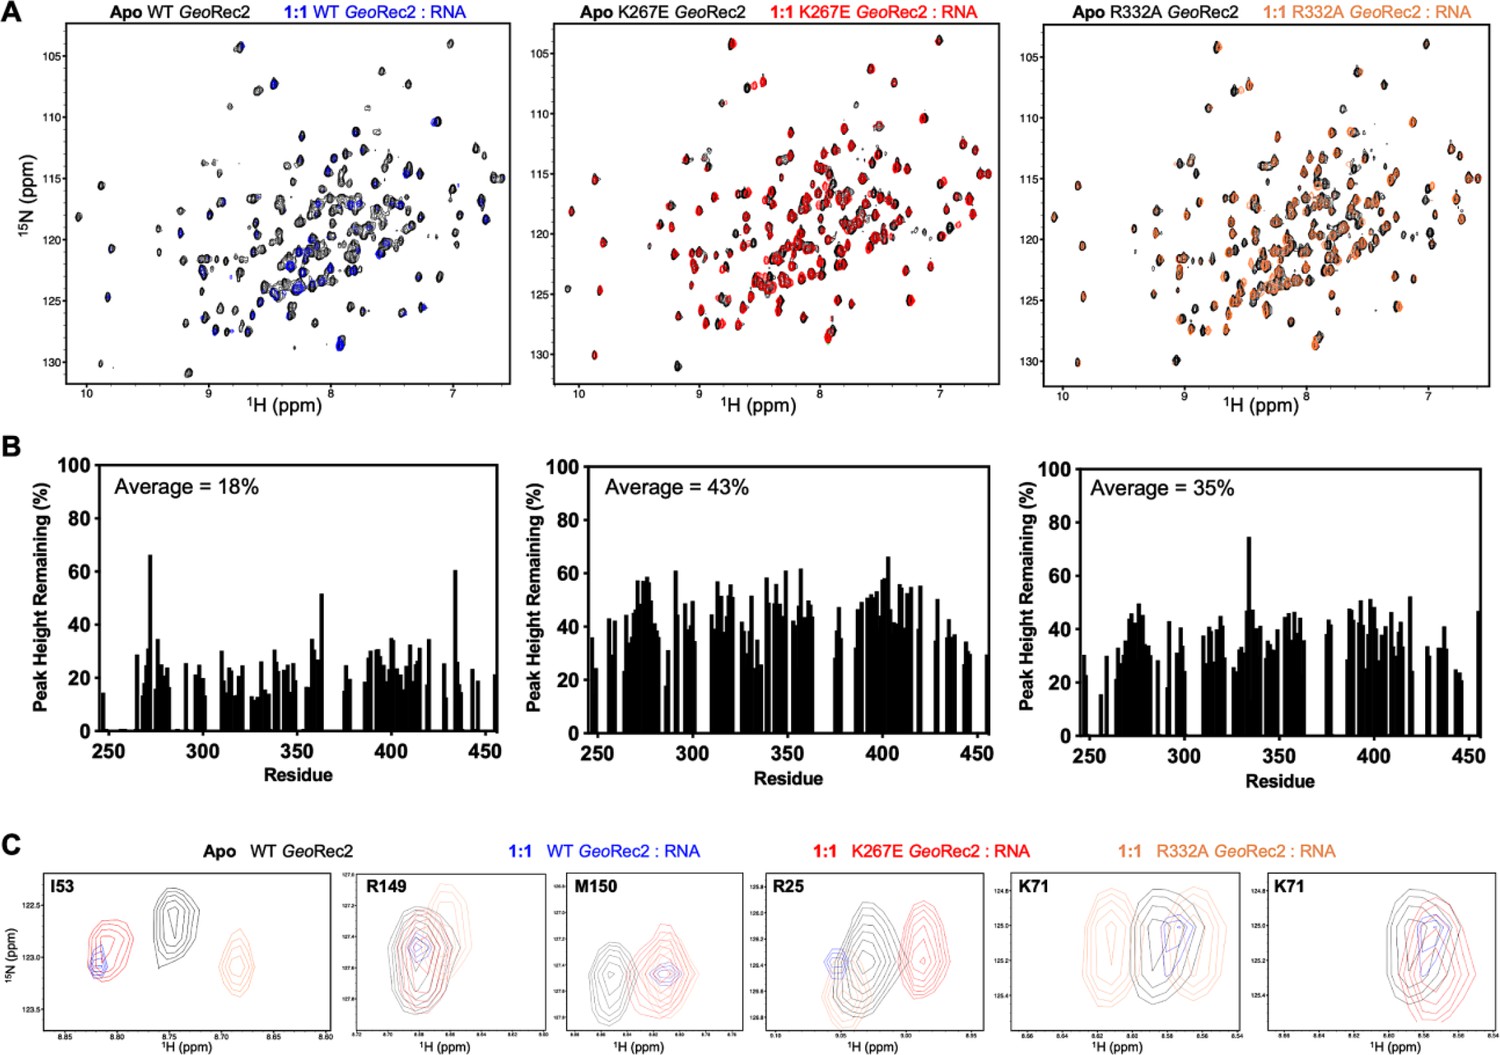
RNA-induced structural perturbations to WT and variant GeoRec2.
(A) 1H15N TROSY HSQC NMR spectral overlays of apo (black) and RNA-bound WT (blue), K267E (red), and R332A (orange) GeoRec2. (B) Perresidue residual peak heights after addition of equimolar RNA to WT (left), K267E (center), and R332A (right) GeoRec2. (C) NMR snapshots of apo WT GeoRec2 (black) and gRNA-bound WT (blue), K267E (red), and R332A (orange) GeoRec2, highlighting unique RNA-induced structural perturbations of each variant.
Figure 4—figure supplement 4
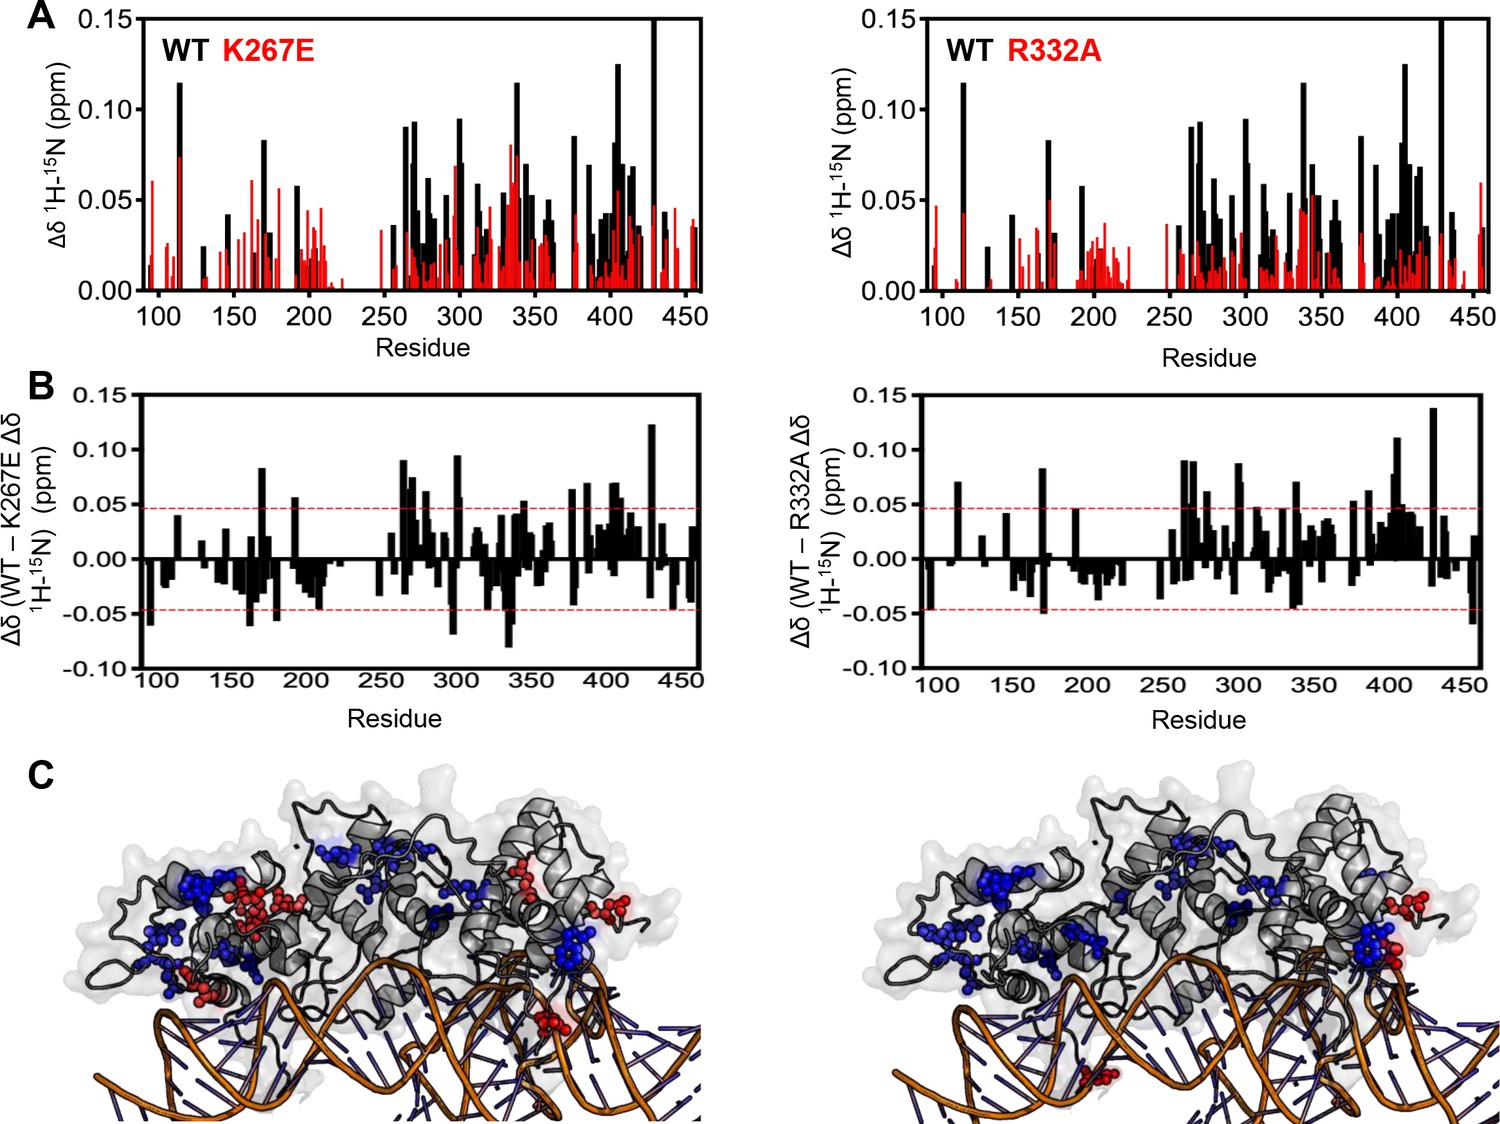
Analysis of RNA-induced chemical shift perturbations in WT GeoRec2 and variants.
(A) RNA-induced NMR chemical shift perturbations to WT GeoRec (black) overlaid with those of K267E (left) and R332A (right) GeoRec, each in red. Similar plots are also found in Figure 1D and Figure 4B of the main text. (B) The difference in RNA-induced chemical shift perturbation (Δδ WT – mutant) comparing WT and K267E GeoRec (left), and WT and R332A GeoRec (right). The red dashed lines indicate 1σ above and below the 10% trimmed mean of all shifts. (C) Chemical shift perturbations +1.0σ above the trimmed mean of all data are mapped onto GeoRec as blue spheres, while perturbations -1.0σ are mapped onto GeoRec as red spheres, representing key residues influencing RNA interactions.
Figure 5 with 1 supplement
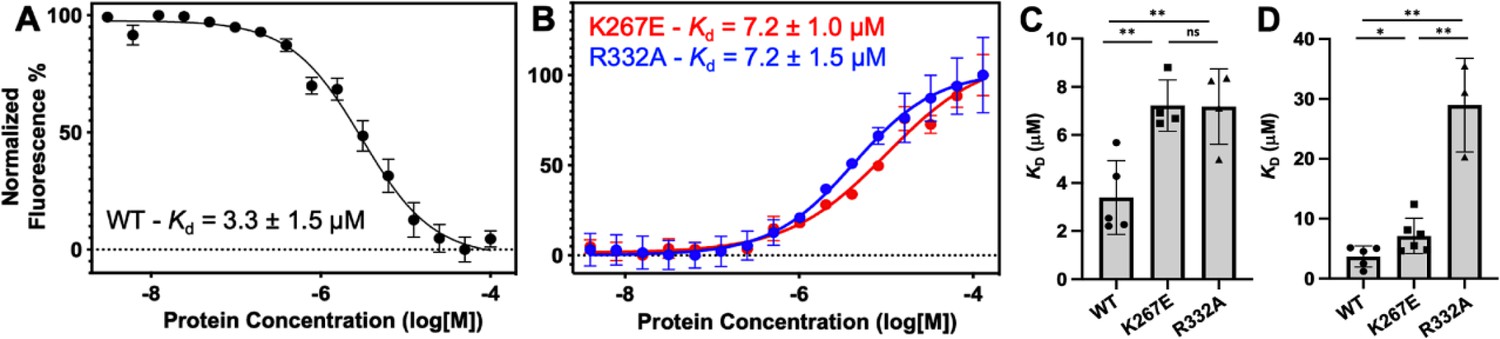
Representative MST-derived profiles of WT.
(A), K267E, and R332A (B) GeoRec binding to a Cy5-labeled 39nt portion of a gRNA, yielding Kd = 3.3 ± 1.5 µM, Kd = 7.2 ± 1.0 µM and Kd = 7.2 ± 1.5 µM, respectively. Bar graphs comparing Kd values across n≥3 technical replicate samples are shown for Tnnt2 RNA (C) and 8UZA RNA from a recent cryo-EM structure (D). *p<0.05, **p<0.004.
Figure 5—figure supplement 1
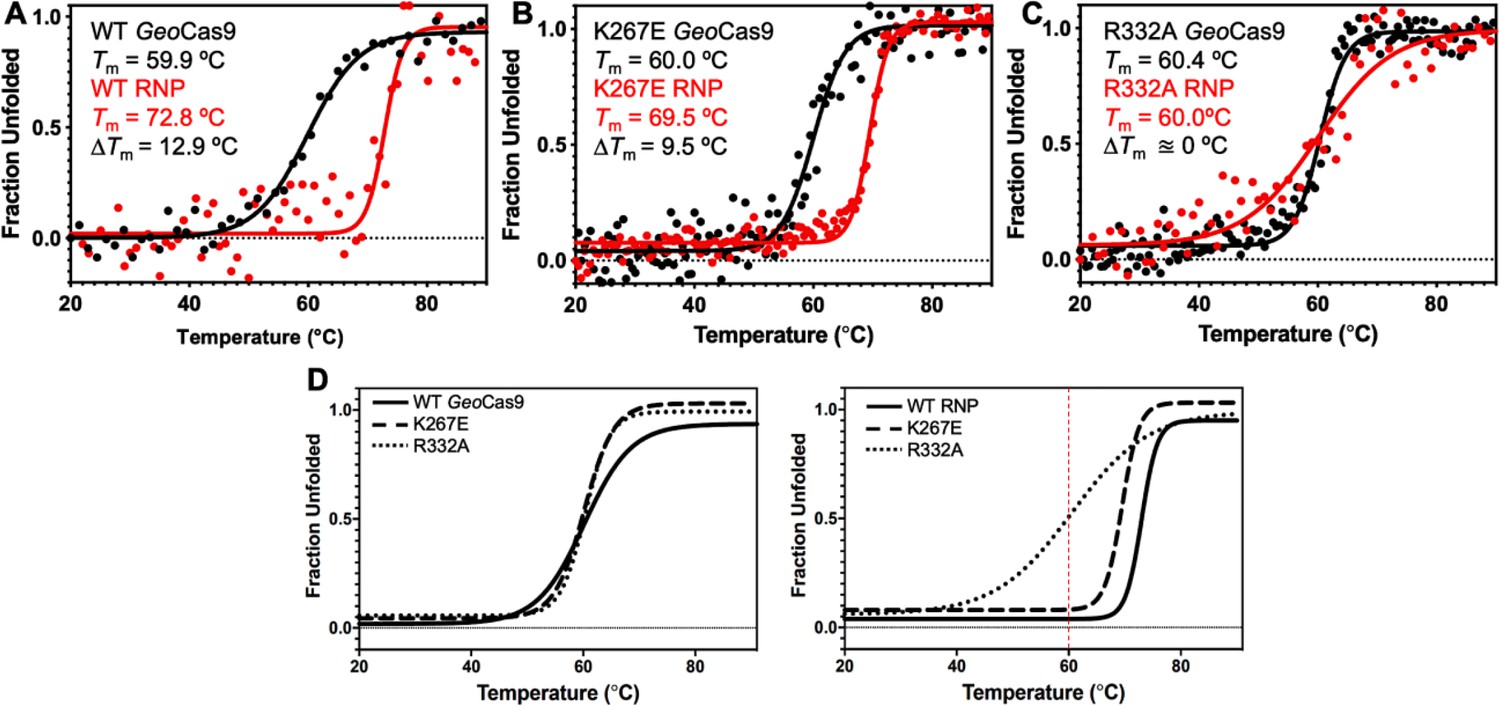
Stabilizing effect of gRNA on GeoCas9.
(A) CD spectroscopic unfolding profiles of WT GeoCas9 (black) reveal a marked gRNA-dependent stabilization (red). The Tm of each state is inset, as is the ΔTm. The same CD profiles for K267E GeoCas9 (B) highlights a weaker stabilization and ΔTm upon gRNA binding, while those of R332A GeoCas9 (C) show virtually no difference in Tm between apo and RNP samples. (D) Fitted denaturation profile overlays of apo WT (black line), K267E (dashed line), and R332A (dotted line) GeoCas9 (left) and RNP complexes (141nt gRNA, right). The red dashed line denotes the Tm of the apo proteins, which are nearly identical. All data were fit as described in the Materials and Methods.
Figure 6 with 1 supplement
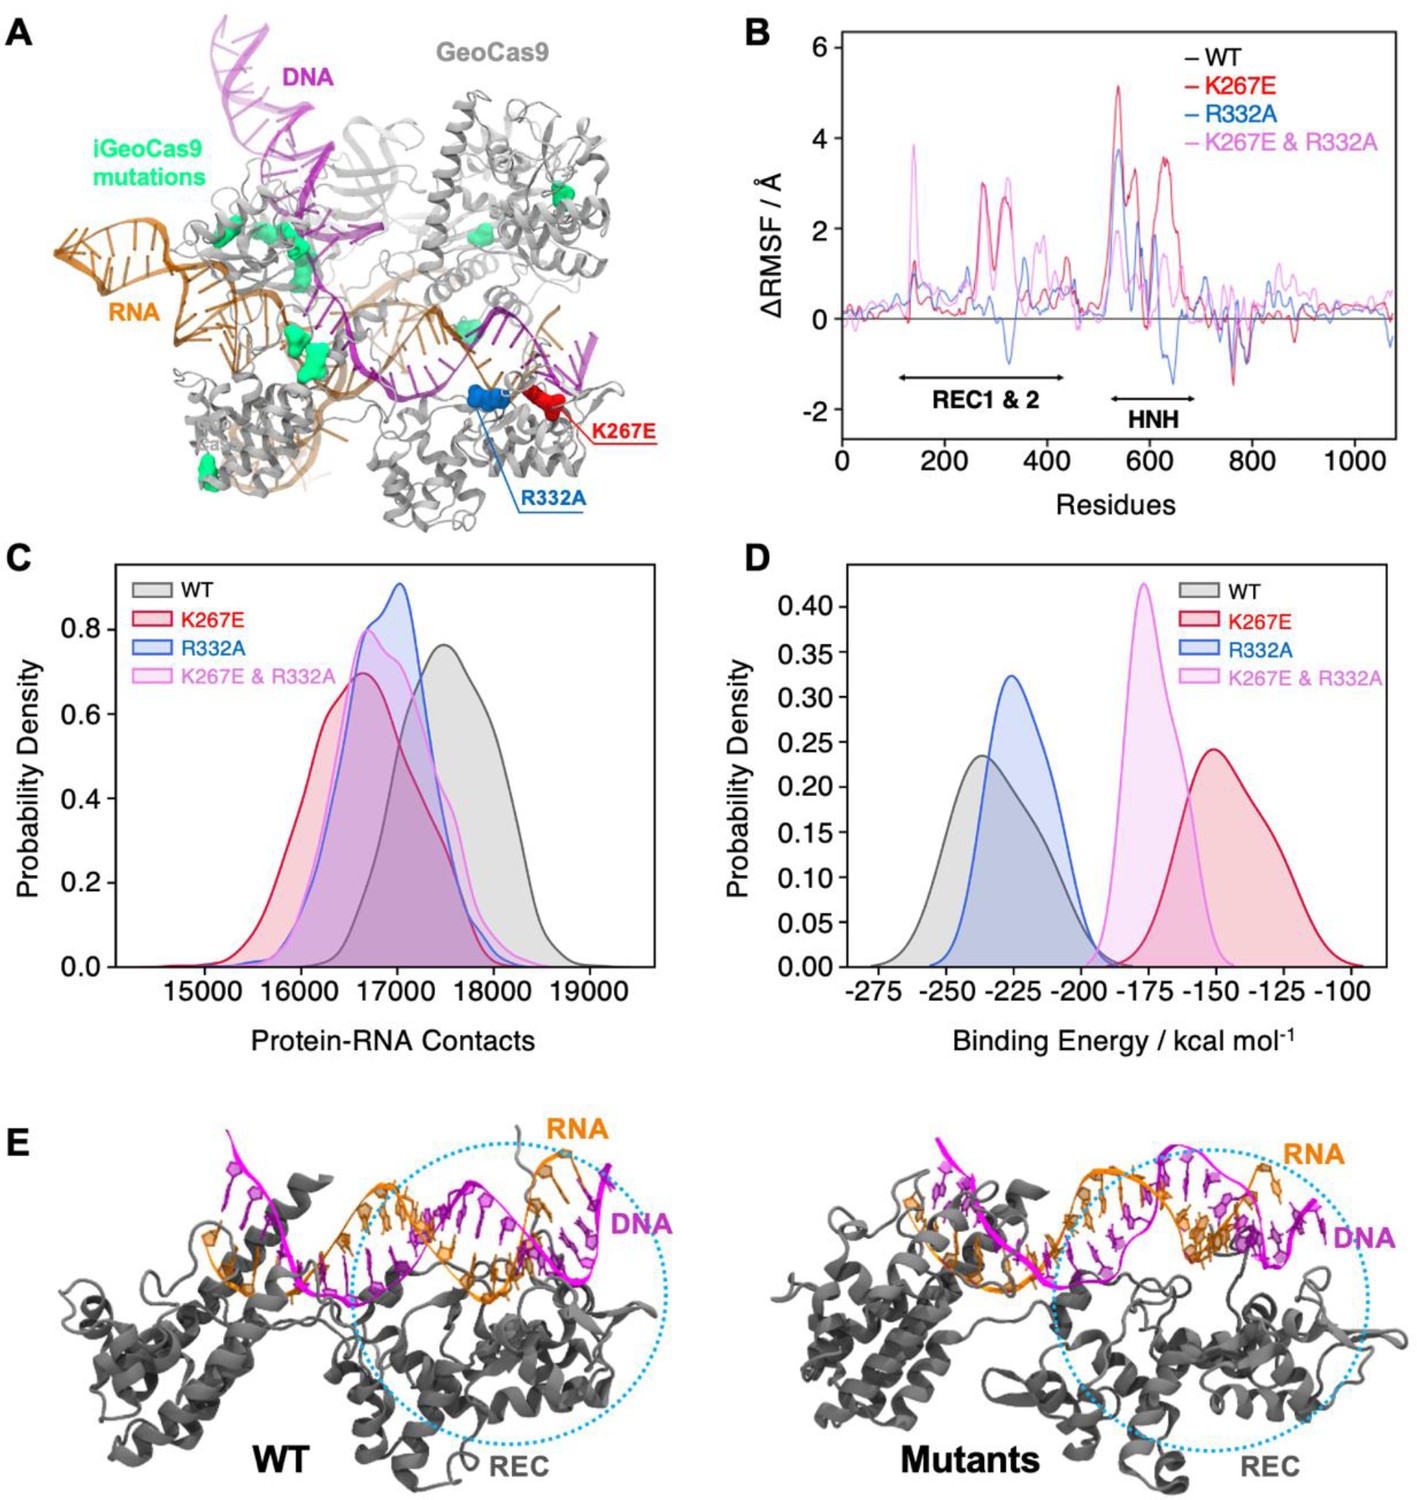
Effects of mutations in full-length GeoCas9 revealed by MD simulations.
(A) The structure of GeoCas9 (PDB: 8UZA, protein in gray) bound to gRNA (orange) and DNA (magenta) is shown. Mutations studied include K267E (red), R332A (blue), and the 10 mutations of iGeoCas9 (lime green), all highlighted in surface representation. (B) Differential root-mean-square fluctuations (∆RMSF) of protein residues computed between WT GeoCas9 and the K267E (red), R332A (blue), and double mutant (pink). (C) Distribution of protein-RNA contacts for WT and GeoCas9 variants computed over the 6 μs simulation ensemble. (D) Comparison of gRNA binding free energy to the Rec domain in WT GeoCas9 and variants. (E) Representative snapshots from MD simulations illustrating structural changes in Rec-gRNA association in WT GeoCas9 (left) and variants (right).
Figure 6—figure supplement 1
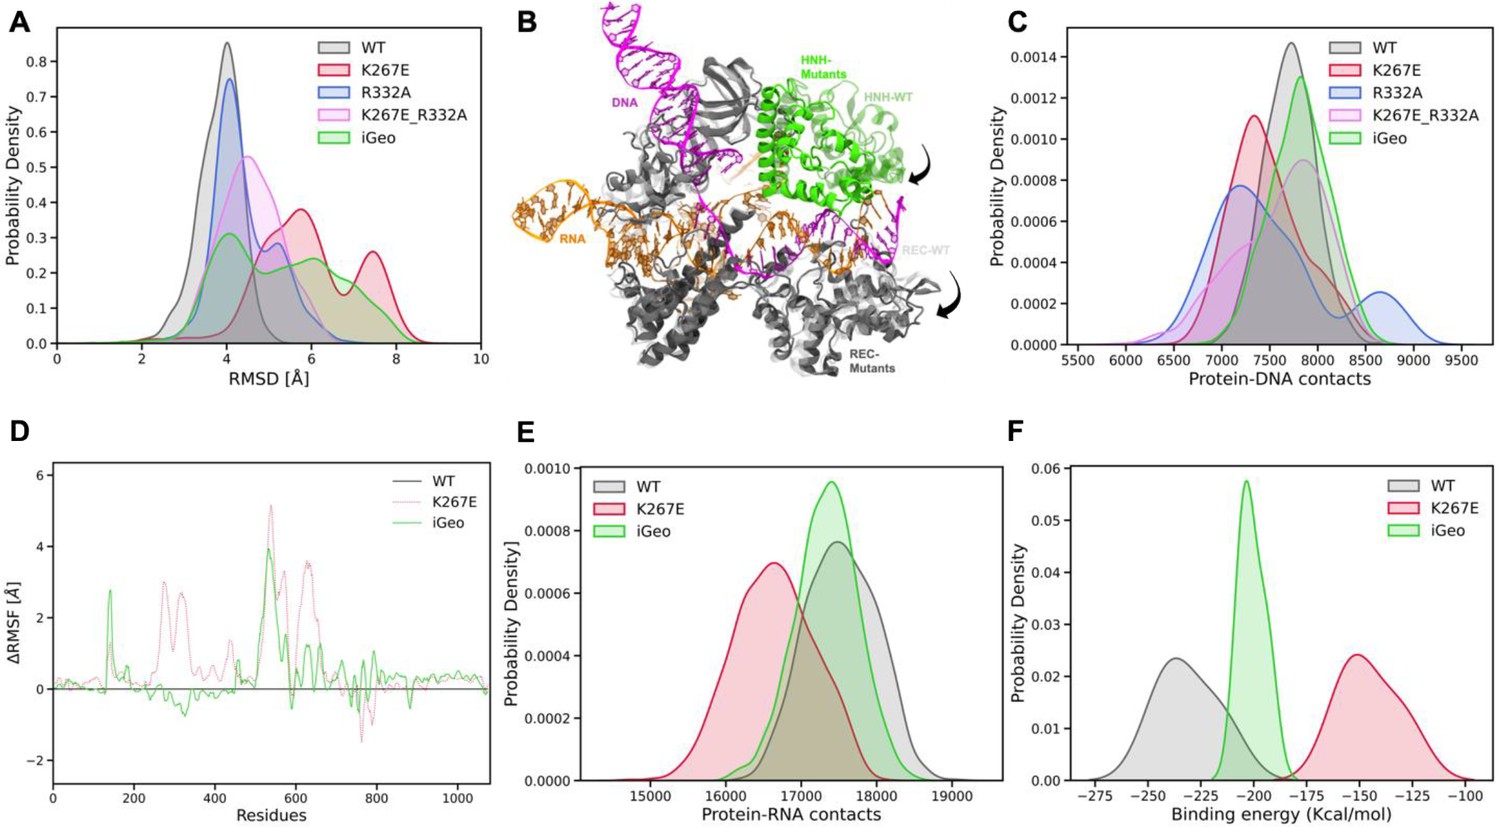
Analysis of MD simulations.
(A) Root-mean-square deviation (RMSD) distribution of WT (gray), K267E (red), R332A (blue), K267E/R332A double mutant (pink) and iGeoCas9 (green). (B) Conformational changes in the HNH and Rec domains of the mutant systems (black arrows), compared to WT GeoCas9. (C) Distribution of protein-DNA contacts for WT and mutants computed over the 6 μs ensemble. (D) Differential RMSD (ΔRMSF) of the protein residues computed between the WT GeoCas9 and K267E (red) and iGeoCas9 (green). (E) Distribution of protein-RNA contacts for WT, K267E and iGeoCas9 computed over the 6 μs ensemble. (F) Comparison of binding free energy of RNA with Rec domain of GeoCas9 between WT, K267E and iGeoCas9.
Figure 7 with 2 supplements
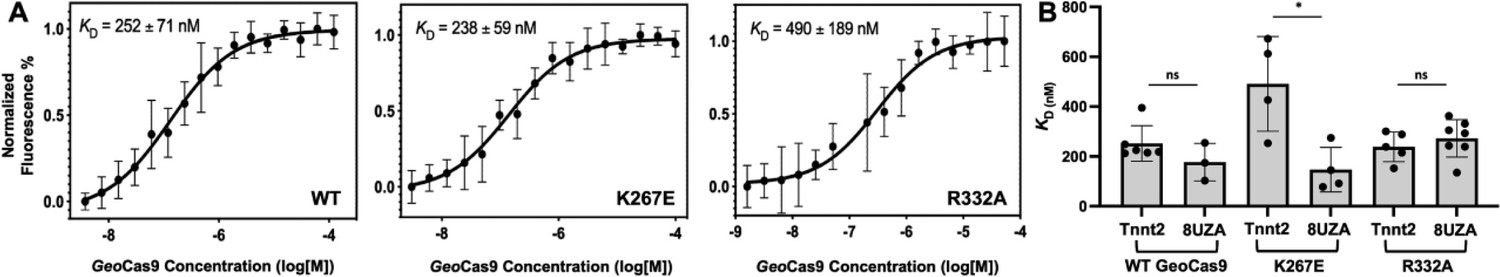
Binding affinities determined for two guide RNAs to GeoCas9.
(A) Representative MST-derived profiles of WT, K267E, and R332A GeoCas9 binding to a Cy5-labeled full-length Tnnt2 gRNA. (B) Bar graph comparing Kd values across n≥3 technical replicate samples are shown for Tnnt2 and 8UZA gRNA from a recent cryo-EM structure of GeoCas9. *p<0.01.
Figure 7—figure supplement 1
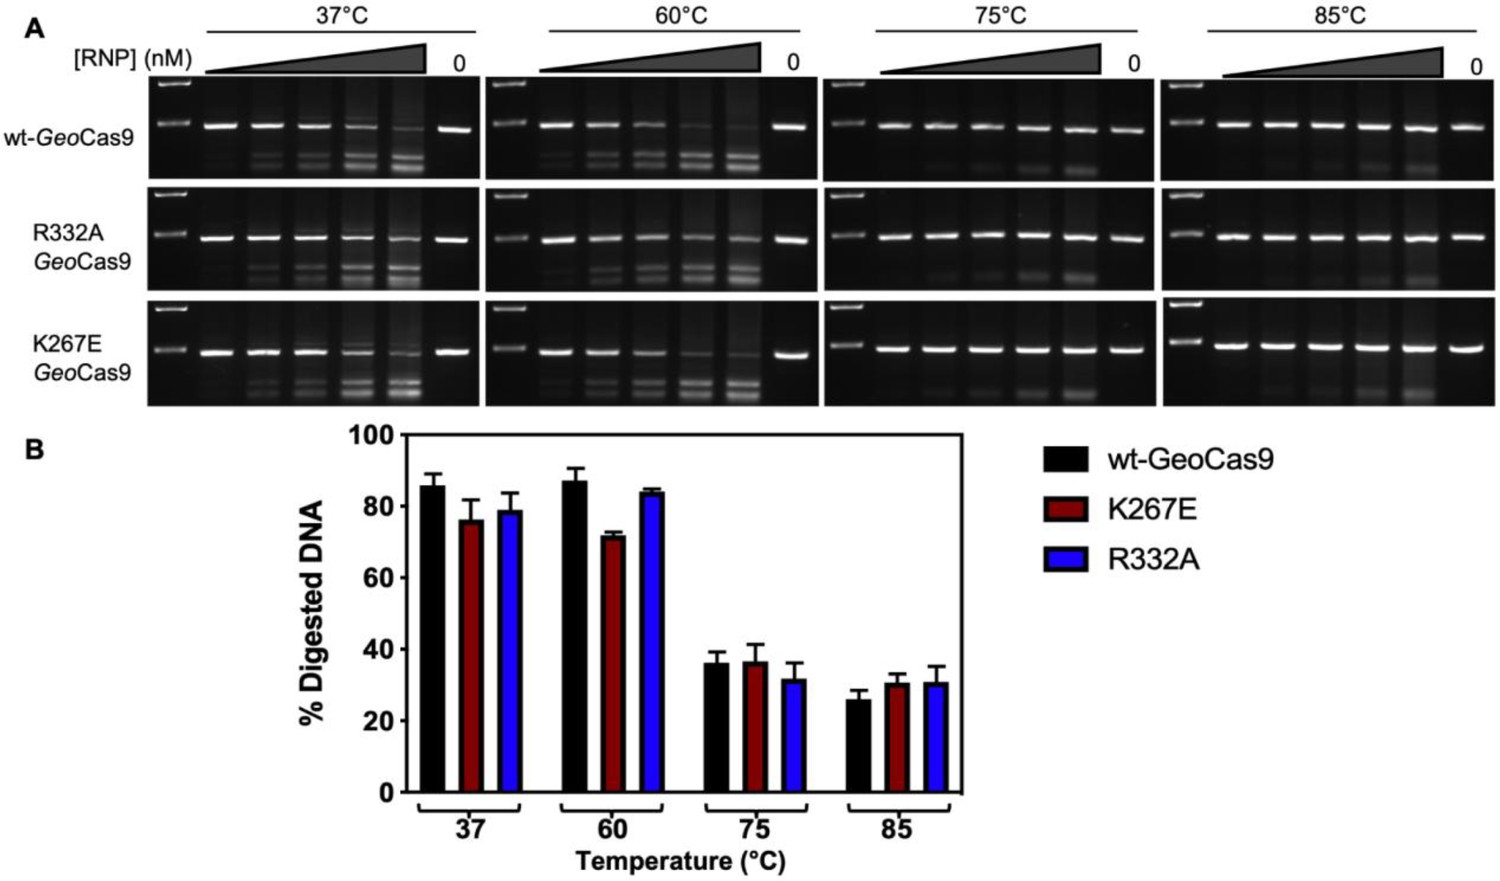
RNPs of varying concentrations of WT, K267E, or R332A GeoCas9 and gRNA were incubated at 37, 60, 75, or 85 °C for 30 min, after which the RNPs were used for individual cleavage reactions.
In vitro cleavage assays indicate no significant difference in temperature-dependent activity between WT, K267E, and R332A GeoCas9. (A) RNP concentration in each lane (left-to-right) is 100, 200, 300, 600, or 900 nM and 0 nM (control) at each temperature tested. Molecular weight markers on agarose gels (top-to-bottom) are 600 and 400 basepairs. (B) Graph quantifying the DNA band intensity measurements on the agarose gel (A) using ImageJ. Data plotted as mean ± SD of n=3 technical replciates.
-
Figure 7—figure supplement 1—source data 1
Raw gel image of DNA cleavage by WT GeoCas9, K267E GeoCas9, and R332A GeoCas9 at 37, 60, 75, and 85 °C.
- https://cdn.elifesciences.org/articles/99275/elife-99275-fig7-figsupp1-data1-v1.zip
-
Figure 7—figure supplement 1—source data 2
Raw gel image of DNA cleavage by WT GeoCas9, K267E GeoCas9, and R332A GeoCas9 at 37, 60, 75, and 85 °C, labelled.
- https://cdn.elifesciences.org/articles/99275/elife-99275-fig7-figsupp1-data2-v1.zip
Figure 7—figure supplement 2
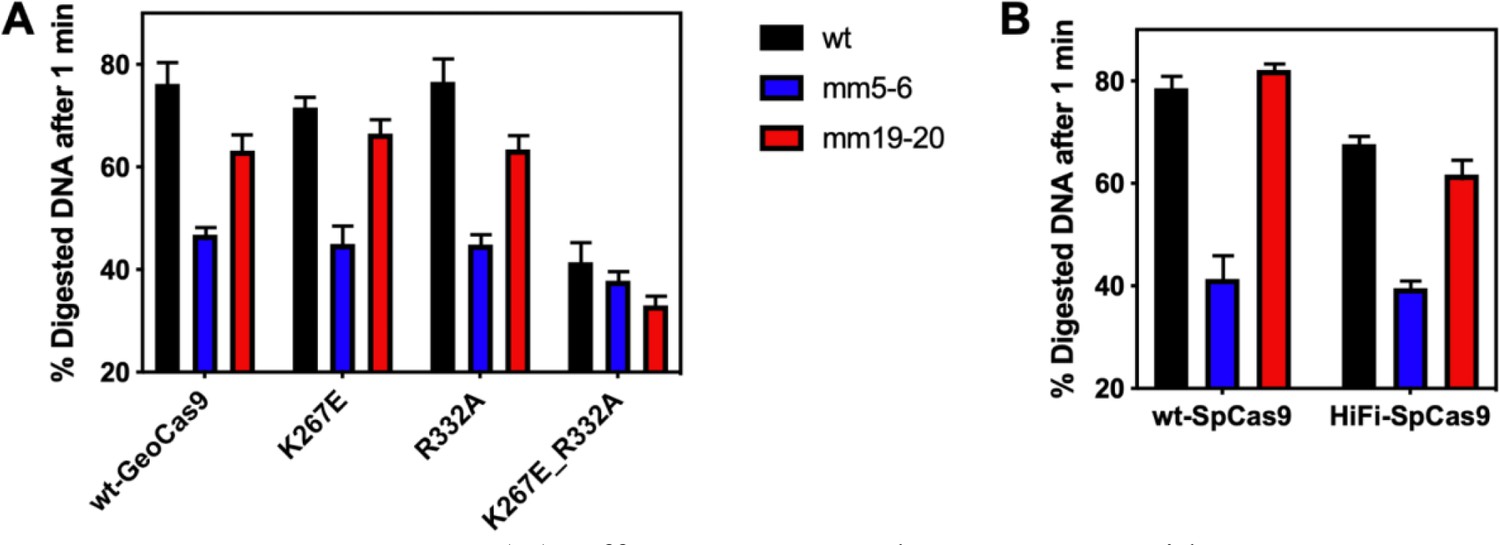
Assessment of off-target DNA cleavage by WT GeoCas9 and variants in vitro.
(A) Off-target in vitro cleavage assay with WT, K267E, R332A, and K267E/R332A GeoCas9. (B) Off-target in vitro cleavage assay with WT and HiFi SpyCas9. Data plotted as mean ± SD of n=3 technical replicates. Legend: WT = on-target DNA substrate at the mouse Tnnt2 gene locus. mm5-6 = off-target DNA with the 5th and 6th nucleotide mismatches from the PAM seed site. mm19-20 = off-target DNA with the 19th and 20th nucleotide mismatches from the PAM seed site. Full DNA sequences of the substrates for the GeoCas9 and SpyCas9 can be found in Supplementary file 3 and Supplementary file 4, respectively.
Additional files
-
Supplementary file 1
Residues fit to a global kex in 1H-15N CPMG relaxation dispersion analysis of WT, K267E, and R332A GeoRec2.
A very small number of other resonances displaying curved CPMG profiles could not be globally fit and were excluded from this list. In all samples (i.e. WT, K267E, and R332A), the global fit was found to be the best statistical model.
- https://cdn.elifesciences.org/articles/99275/elife-99275-supp1-v1.docx
-
Supplementary file 2
Guide RNA sequences used in GeoCas9 MST measurements.
The 39-nucleotide sequence of RNA used in MST and NMR studies of isolated GeoRec is underlined.
- https://cdn.elifesciences.org/articles/99275/elife-99275-supp2-v1.docx
-
Supplementary file 3
Nucleic acid sequences used in the GeoCas9 in vitro off-target assay.
The 23 base pair spacer sequence of gRNA is underlined. The spacer sequence within the DNA sequences is highlighted yellow, and the PAM are highlighted in blue.
- https://cdn.elifesciences.org/articles/99275/elife-99275-supp3-v1.docx
-
Supplementary file 4
DNA sequences used in the SpCas9 in vitro off-target assay.
Sites of mismatched DNA are highlighted in red.
- https://cdn.elifesciences.org/articles/99275/elife-99275-supp4-v1.docx
-
MDAR checklist
- https://cdn.elifesciences.org/articles/99275/elife-99275-mdarchecklist1-v1.docx
Download links
A two-part list of links to download the article, or parts of the article, in various formats.
Downloads (link to download the article as PDF)
Open citations (links to open the citations from this article in various online reference manager services)
Cite this article (links to download the citations from this article in formats compatible with various reference manager tools)
Structural and dynamic impacts of single-atom disruptions to guide RNA interactions within the recognition lobe of Geobacillus stearothermophilus Cas9
eLife 13:RP99275.
https://doi.org/10.7554/eLife.99275.4


