Systems genomics of salinity stress response in rice
- Center for Genomics and Systems Biology, New York University, United States
- Department of Nematology and Department of Botany & Plant Sciences, University of California, Riverside, United States
- Center for Plant Cell Biology, Institute for Integrative Genome Biology, University of California, Riverside, United States
- Department of Biology, University of Oxford, United Kingdom
- International Rice Research Institute, Philippines
- Department of Biological Sciences, Fordham University, United States
- Inari Agriculture Nv, Belgium
- Institute of Crop Science, University of the Philippines, Philippines
- New York Genome Center, United States
- International Center for Biosaline Agriculture, United Arab Emirates
- Département de Chimie, Université du Quebéc à Montréal, Canada
Figures
Figure 1 with 2 supplements
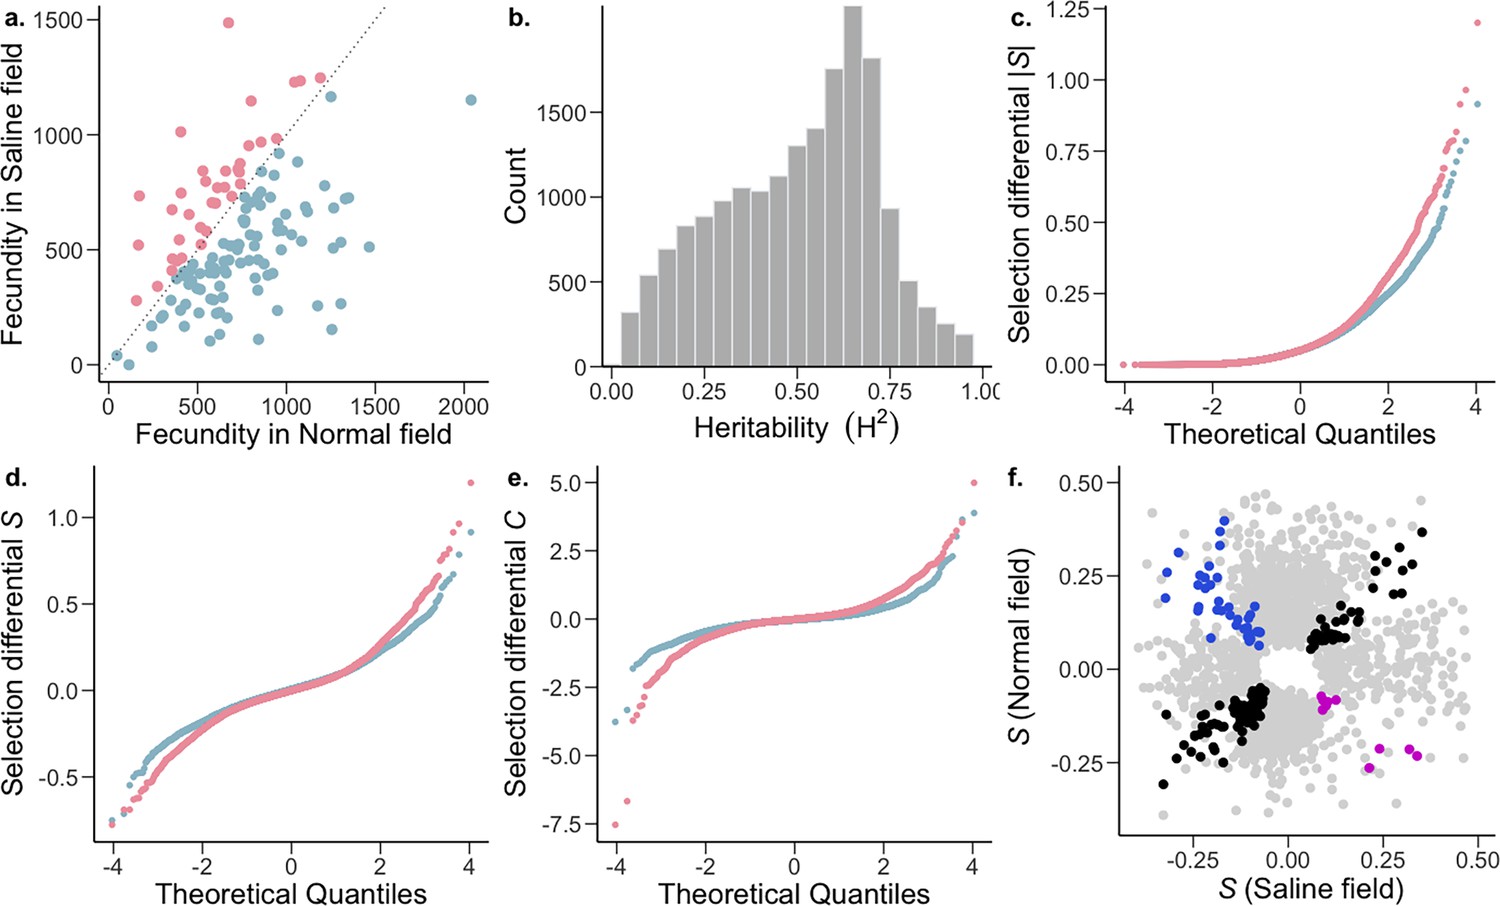
The strength and pattern of selection on heritable gene expression.
(a) The O. sativa ssp. indica populations showed higher average fitness in the normal (blue) and saline (pink) field (two-tailed paired t-test p=1.658 x 10⁻⁸) and fitness further showed a significant effects of genotype (G) and environment (E); genotype ×environment (G×E) was not significant. Analysis of variance (ANOVA) [G and E (p<0.001), G×E (p=0.49)]; n=130 accessions. (b) Broad-sense heritability (H2) distribution of Oryza sativa spp. indica transcripts. Two-way ANOVA, genotype FDR-adjusted q<0.001, n=130 accessions. (c–e) The strength of linear selection |S|, linear selection differentials (S), and quadratic selection differentials (C) for genome-wide gene expression in normal (blue) and saline (pink) conditions. X-axes represent a theoretical quantile for normal distribution with mean = 0 and standard deviation = 1. (f) Conditionally neutral (light gray), and antagonistically pleiotropic transcripts (blue and magenta represent beneficial expression in normal and saline conditions, respectively). Black represents transcripts experiencing selection in the same direction in both environments (expression is beneficial or detrimental in both environments).
Figure 1—figure supplement 1
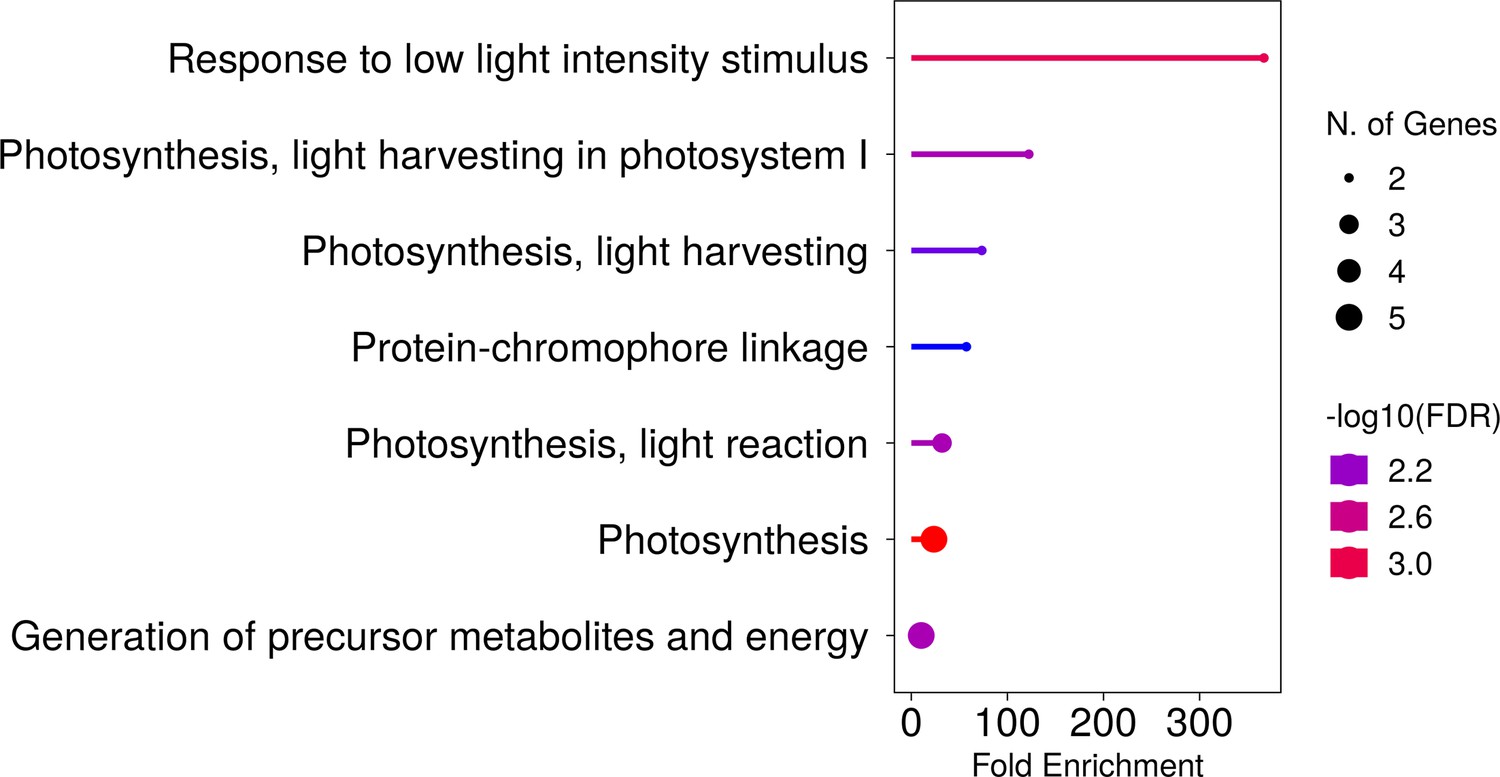
Pathway enrichment of the 51 antagonistically pleiotropic genes beneficial in normal conditions but detrimental in salinity stress conditions.
Enrichment statistics provided in Supplementary file 4.
Figure 1—figure supplement 2
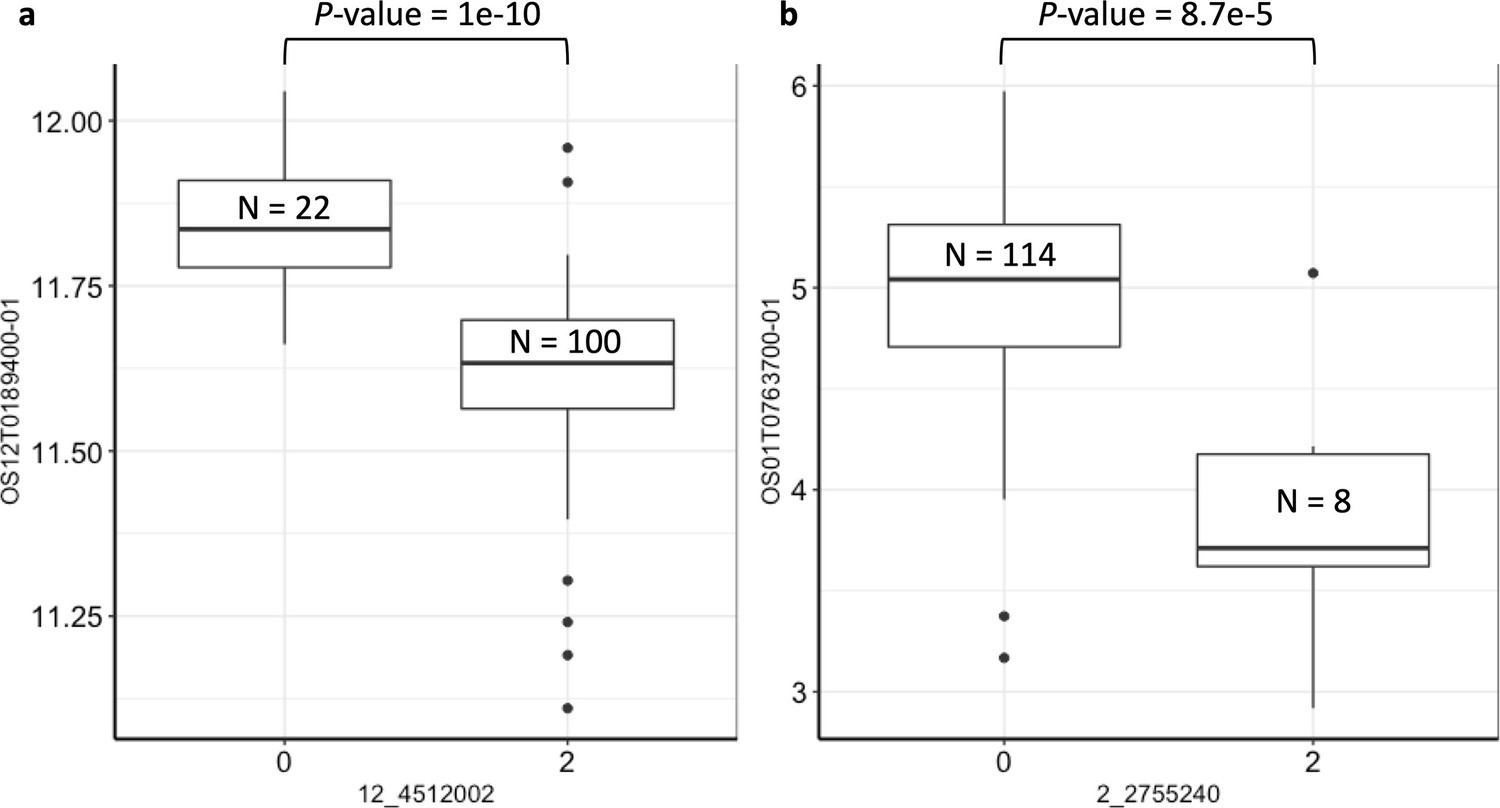
Boxplot representation of eQTLs for the two photosynthesis-related AP (antagonistically pleiotropic) genes beneficial in normal conditions.
(a) cis-eQTL (SNP = Chr12:4512002) for PSAN (OS12T0189400-01). (b) trans-eQTL (SNP = Chr02:2755240) for CRR7 (OS01T0763700-01). eQTL statistics provided in Supplementary file 10. X-axis represents the eQTL SNP haplotypes, y-axis represents normalized transcript expression in normal conditions. Numbers inside box plots represent the number of accessions in each group. p-value indicates the one-sided Wilcoxon-test significance.
Figure 2 with 1 supplement

Biological processes and pathways with differential responses to selection under saline conditions.
(a) GO biological processes under stronger selection in normal (blue) and saline conditions (pink). Error bars represent 95% confindence intervals. around the median. (b) Linear selection gradients (β), along with direct (D), indirect (I) and total (T) responses to selection on suites of transcripts in normal (blue) and saline conditions (pink).
Figure 2—figure supplement 1
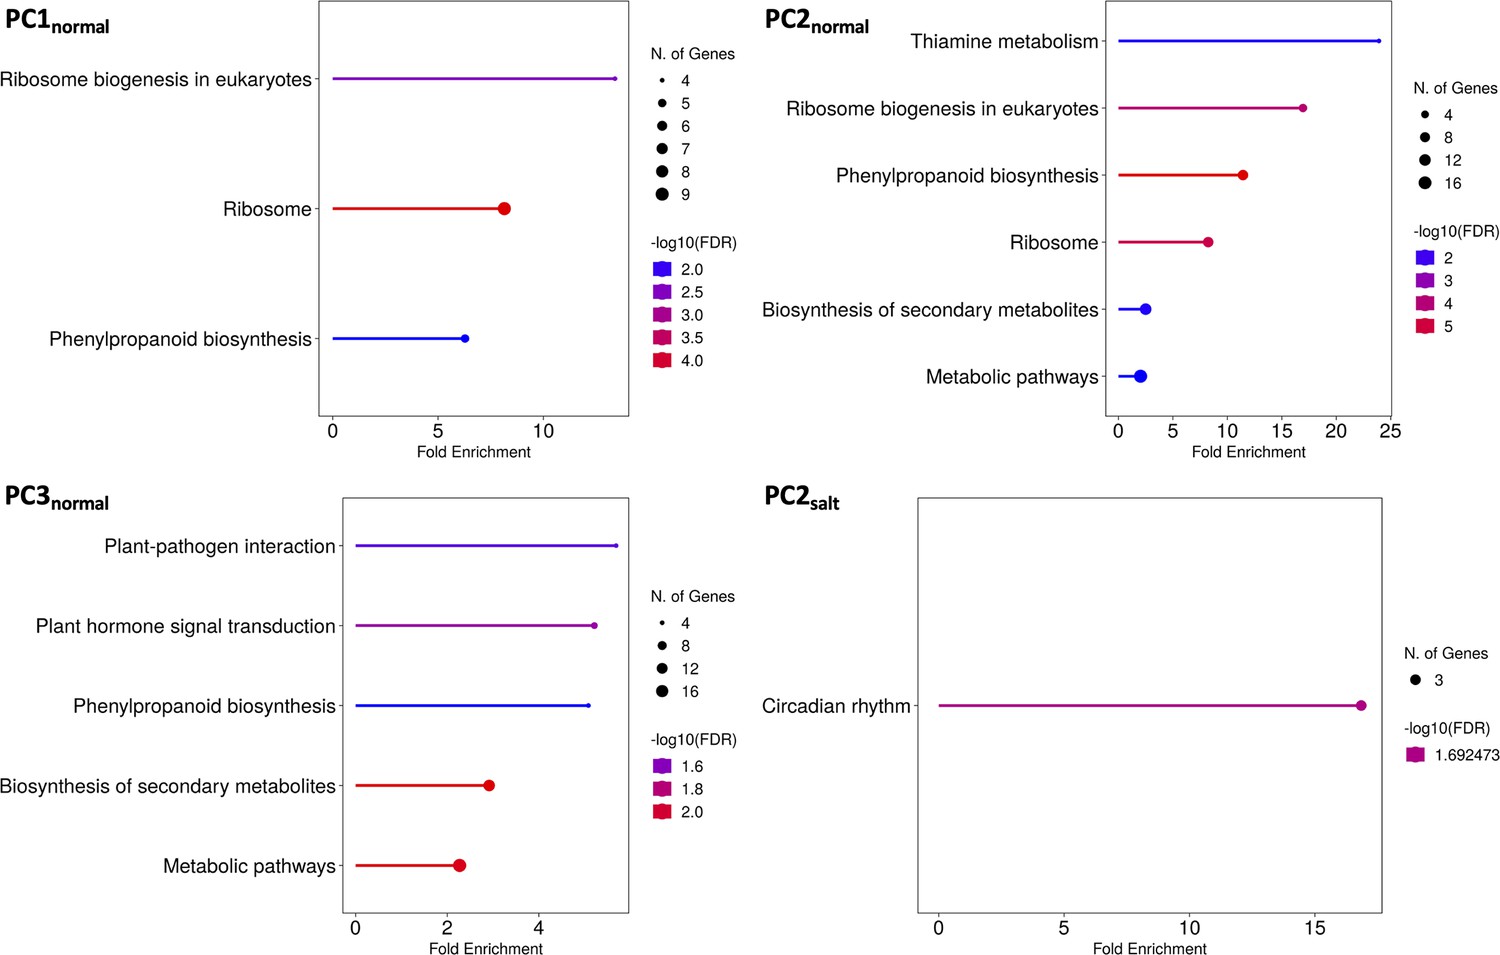
Enrichment of the suite of transcripts (1% tails of the distributions of transcripts’ loading values on principal components) with significant selection gradients in both normal and salinity stress conditions.
Figure 3
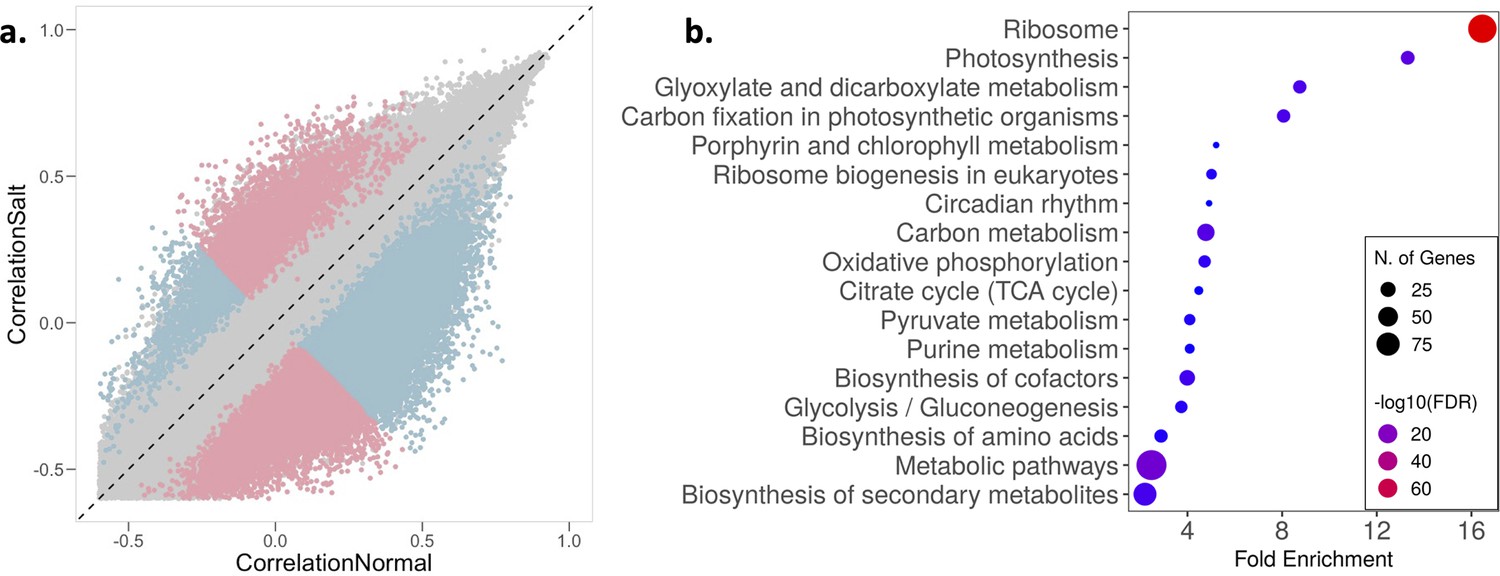
Salinity stress induces regulatory decoherence.
(a) Pearson correlation coefficients between pairs of transcripts (|S|>0.1 and expression greater than 0 in at least 50% individuals) in normal (x-axis) and saline conditions (y-axis). Pink and blue represent pairs with correlation stronger in saline and normal conditions, respectively; gray represents correlation that is not significantly different between conditions. (b) Enrichment of transcripts with significant pairs greater than the median (median significant pair per transcript = 12, n=853) involved in regulatory decoherence post salt exposure.
Figure 4 with 2 supplements
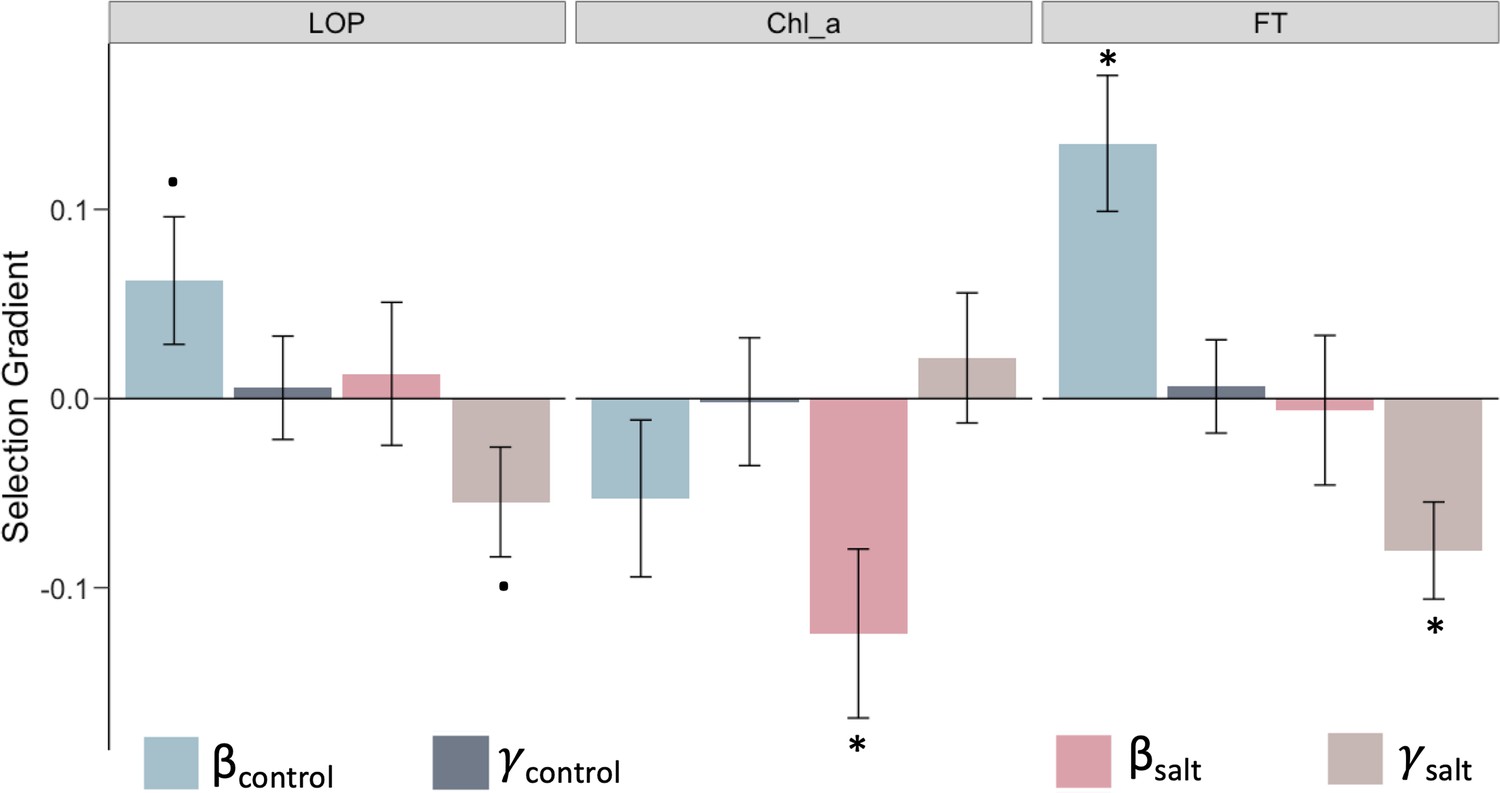
Traits with different selection profiles under salt stress.
Linear (β) and quadratic (γ) selection gradients on the traits LOP (leaf osmotic potential), Chl_a (chlorophyll a content), and FT (flowering time). Error bars represent mean ± SE (nnormal: 384; nsalt:365); dots and asterisks indicate significance of selection-gradient at two-sided unadjusted p<0.1 and p<0.05.
Figure 4—figure supplement 1
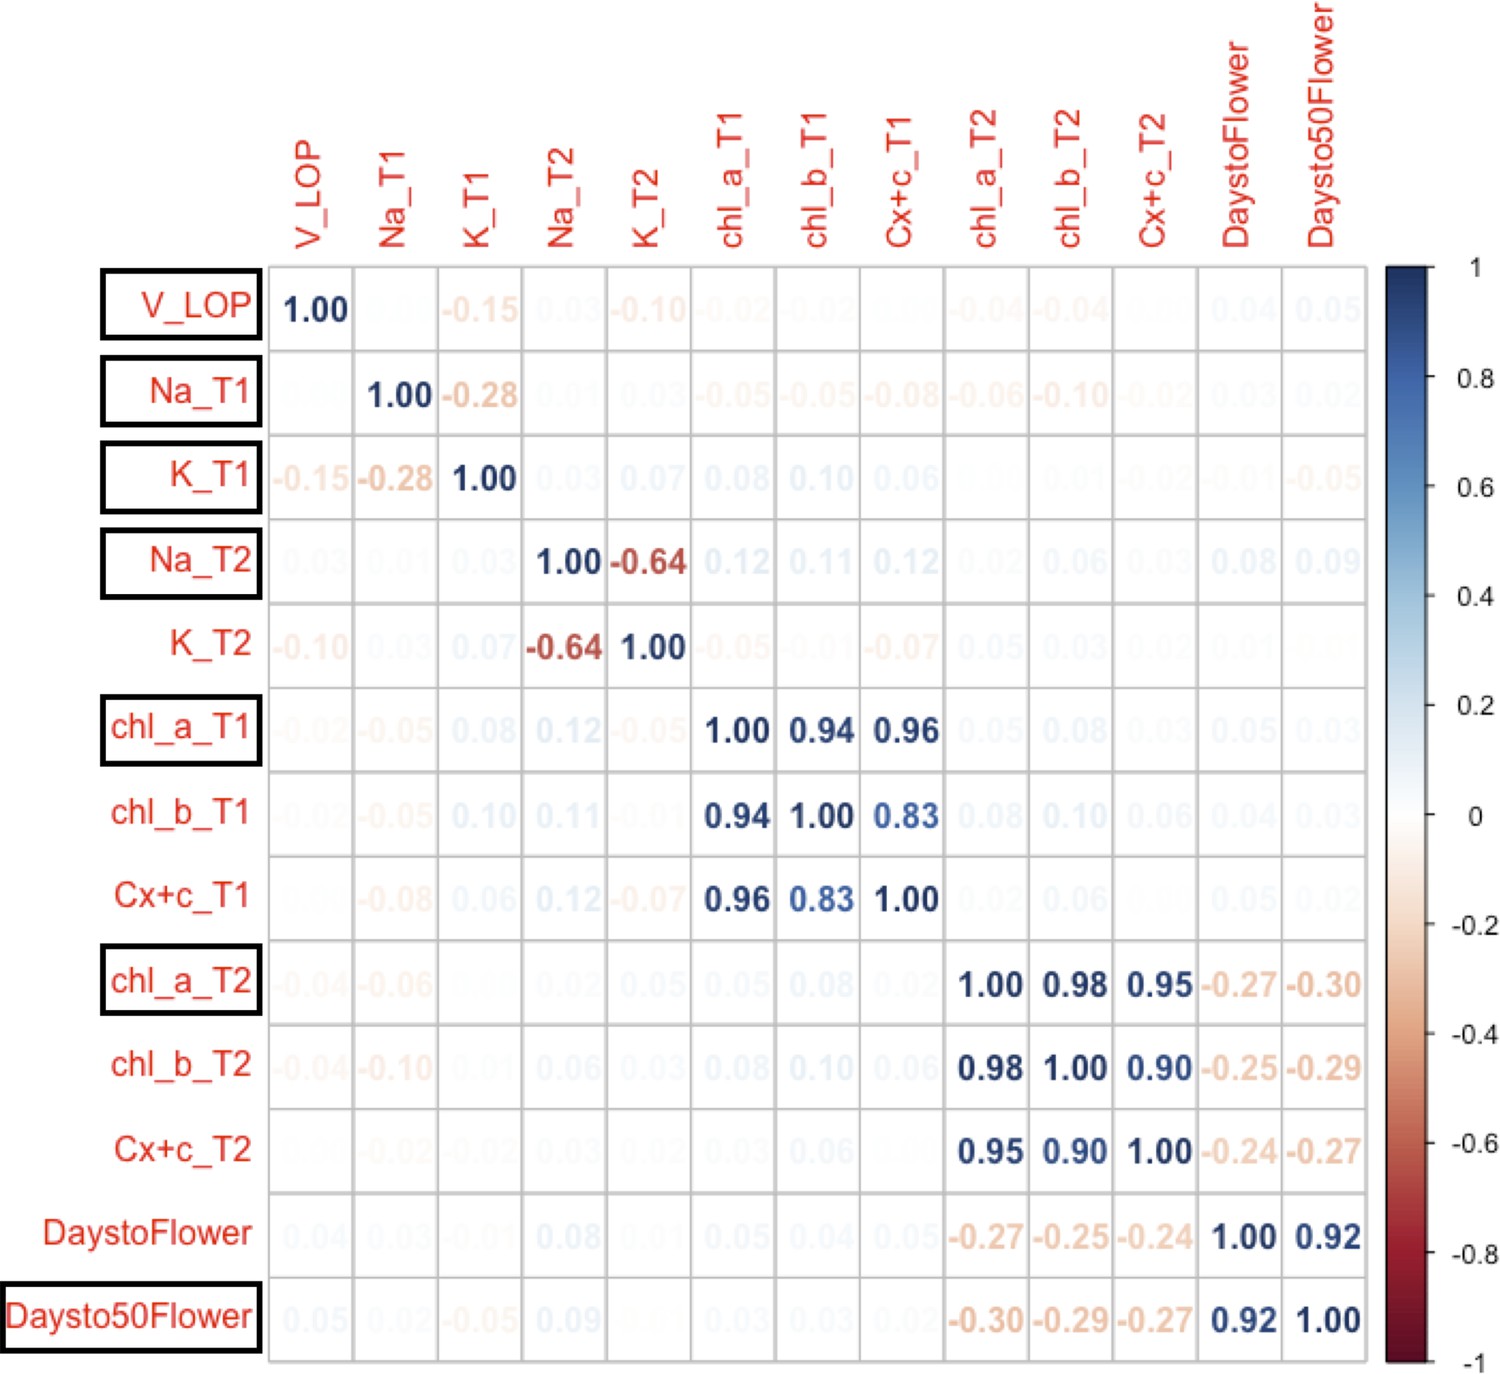
Correlation among functional traits in normal conditions.
Highlighted black boxes indicate the uncorrelated traits chosen for selection analyses. Numbers inside the boxes and the heatmap represent Pearson correlation coefficients. V_LOP: Leaf Osmotic Potential; Na: Sodium content; K: Potassium content; chl_a and chl_b: Chlorophyll a and b content, respectively; Cx +c: Total carotenoid content; DaystoFlower: First day of flowering; Daysto50Flower: Day on which 50% of plants in a plot flowered (focal plant and its nine neighboring plants); T1 and T2 represent vegetative and reproductive timepoints, respectively.
Figure 4—figure supplement 2
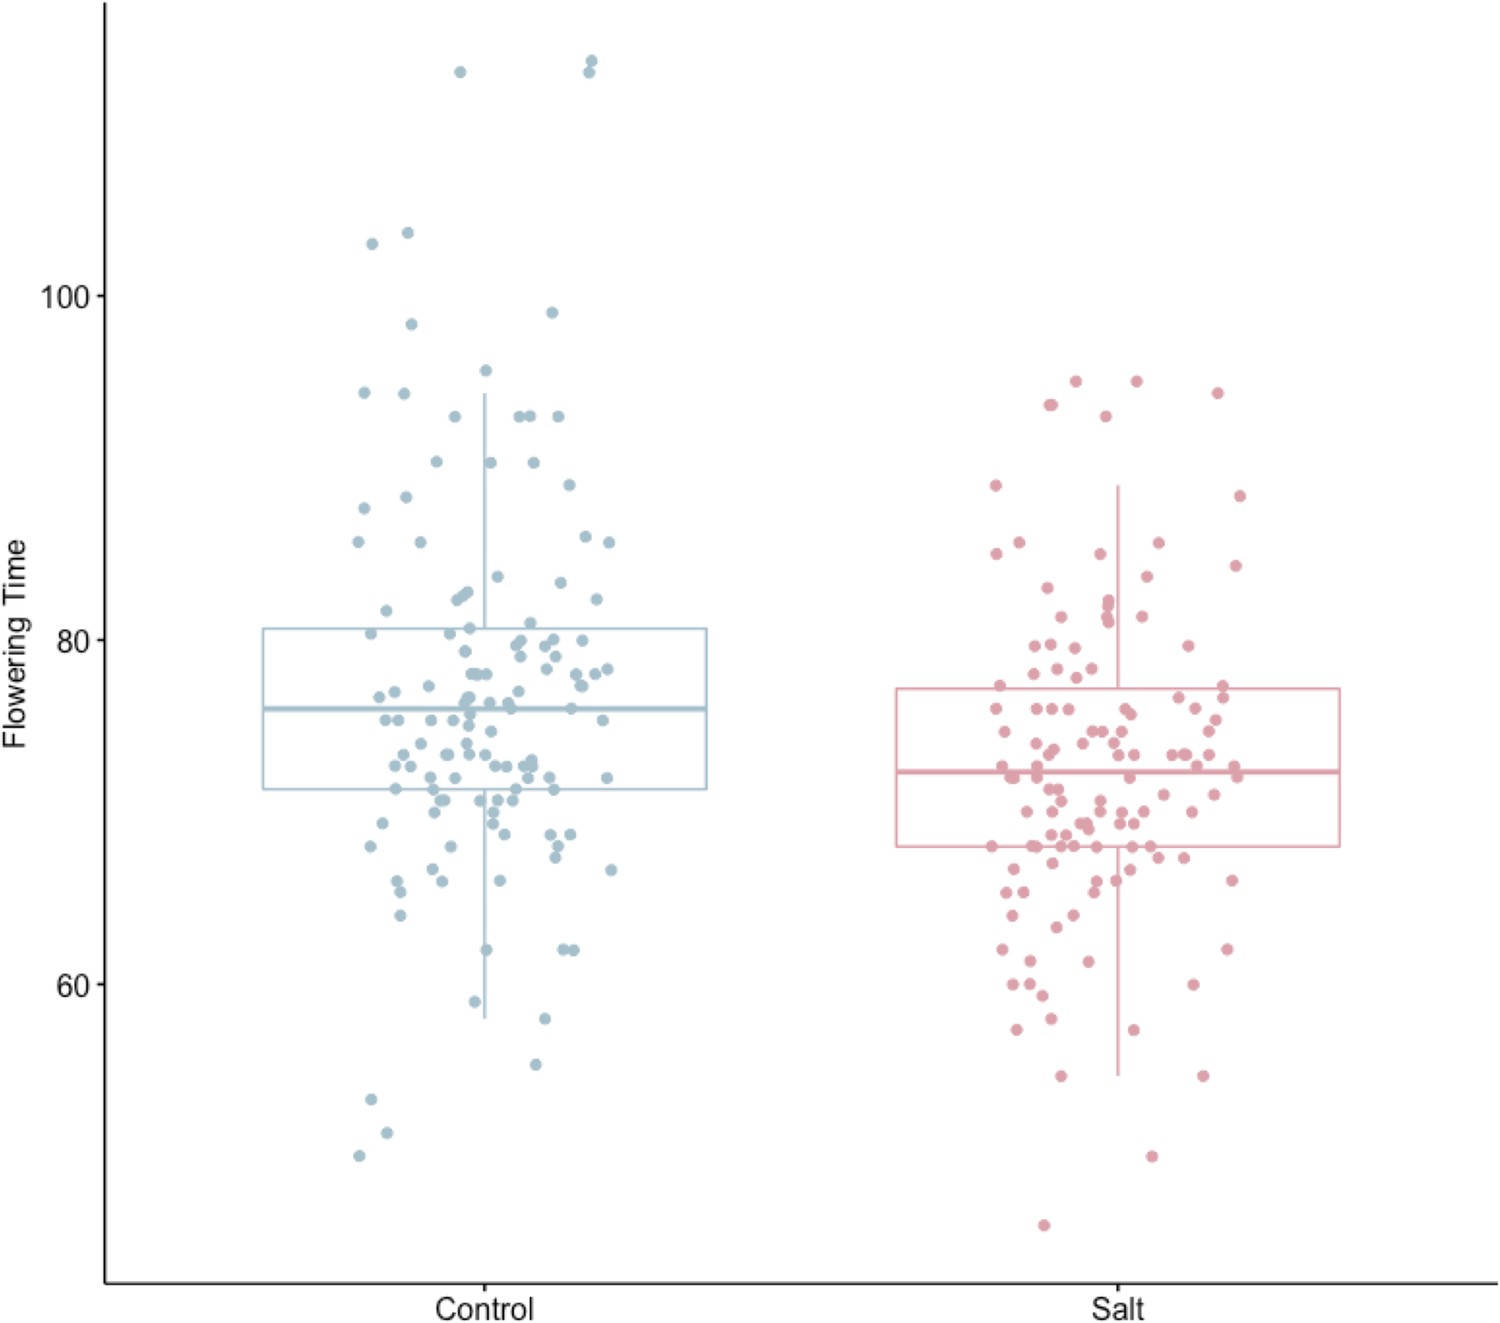
Distribution of flowering time (representing days to when 50% of plants in a plot flowered) in normal and salinity stress conditions.
Paired t-test (two-sided paired t-test p=0.001) showed significant reduction in flowering times after salt treatment, indicating earlier flowering saline conditions.
Figure 5 with 3 supplements
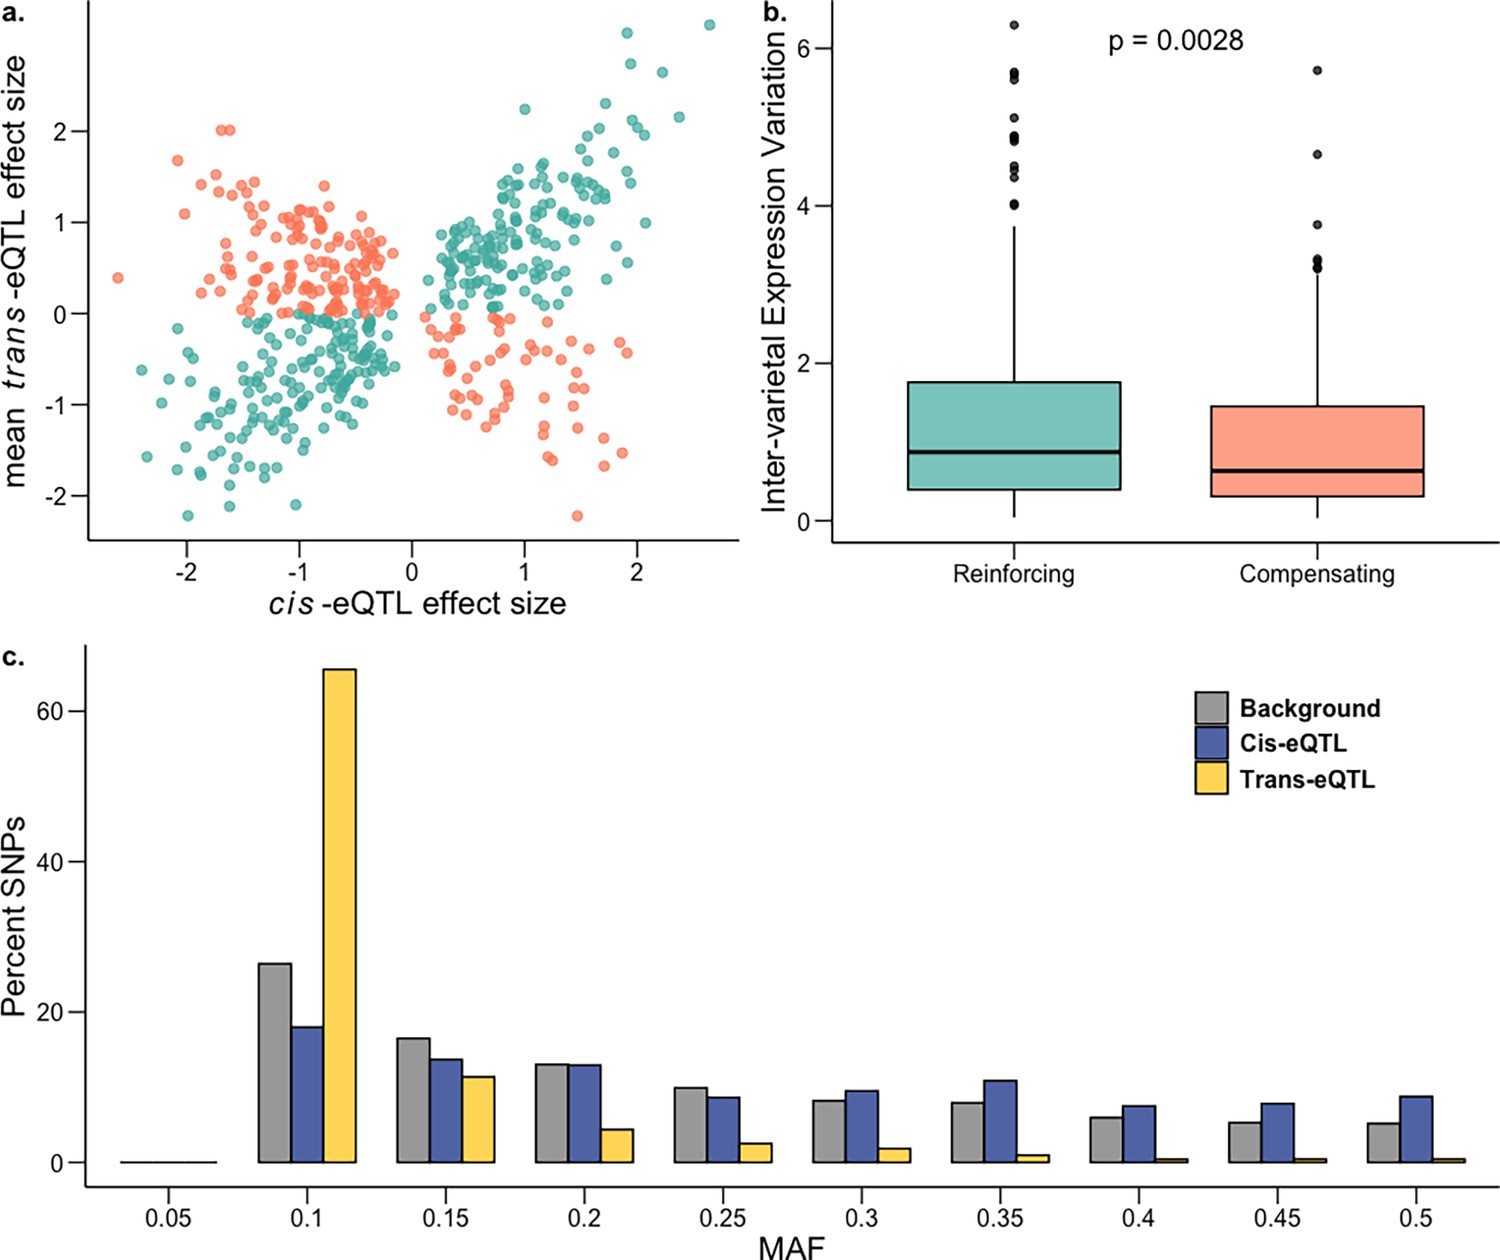
Genetic architecture of gene expression variation during salt stress.
(a) Effect sizes of genes with both cis and trans factors under saline conditions showing excess of reinforcing cis-trans (teal) in comparison to compensating cis-trans (salmon). (b) Inter-varietal variation in gene expression for genes under compensating control is significantly lower than for those under reinforcing control; one-sided Mann-Whitney p=0.0028. c, Frequency distribution of MAF (minor allele frequency) for cis-eQTLs (blue) and trans-eQTLs (yellow) in saline conditions against the genome-wide background (gray).
Figure 5—figure supplement 1
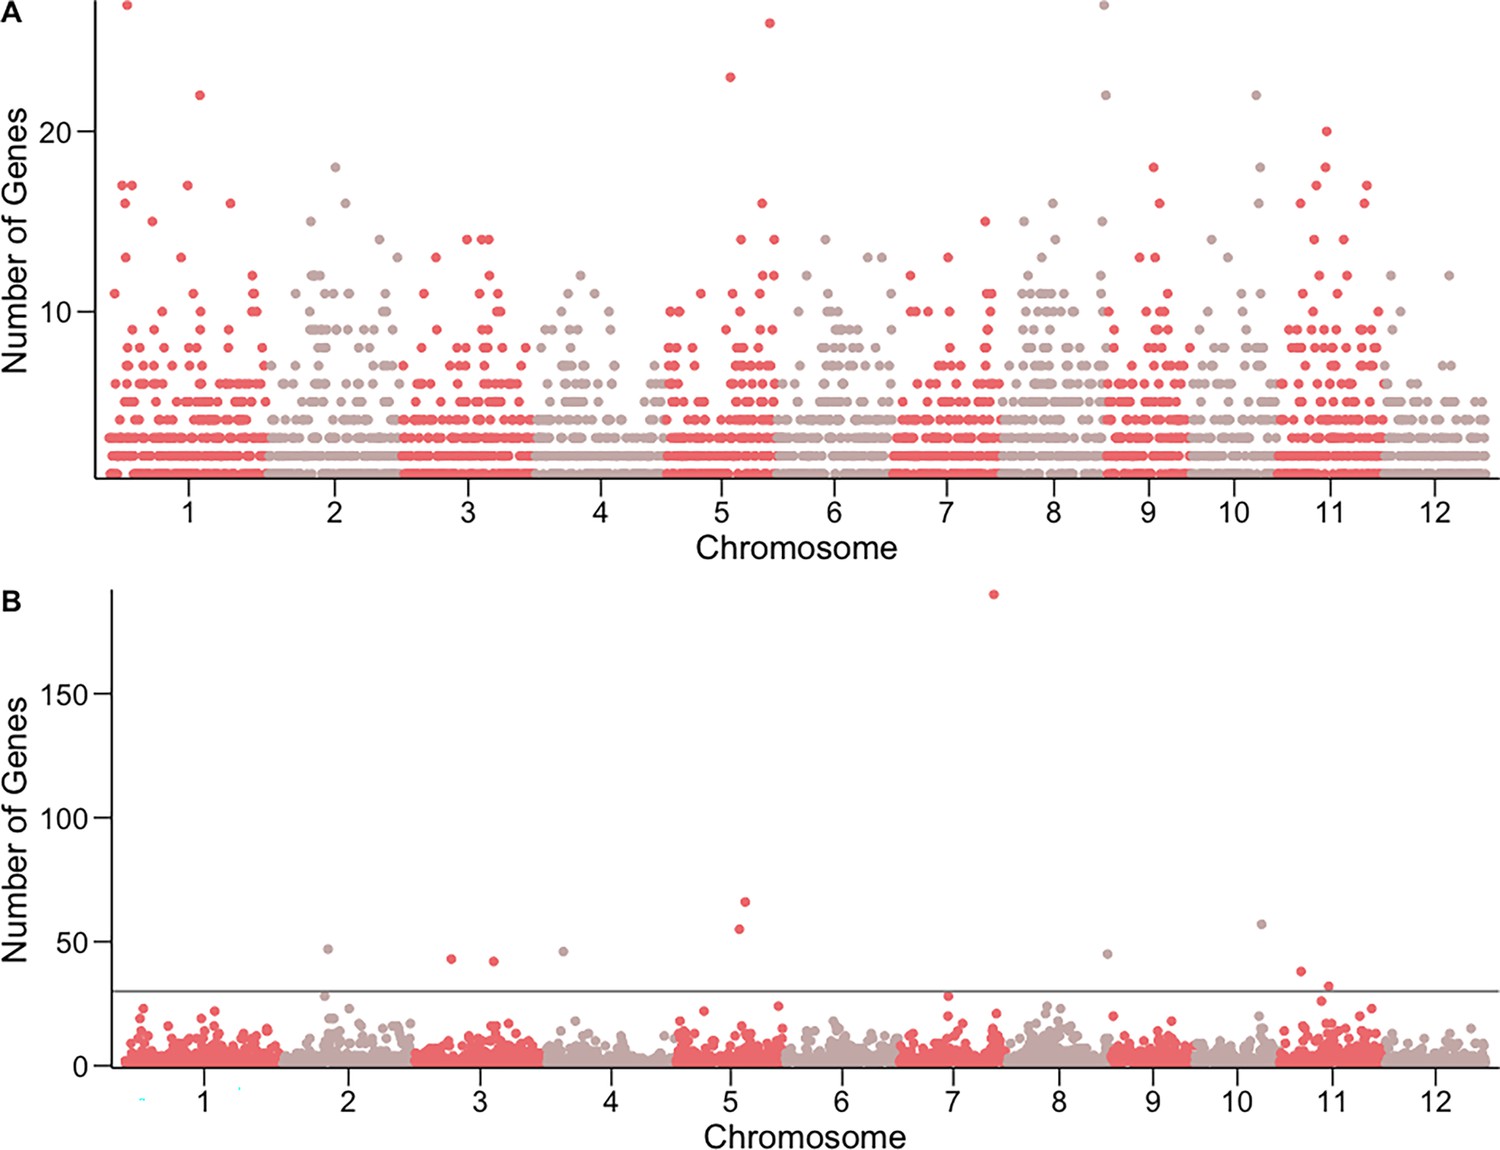
Trans-eQTL hotspots in normal (a) and salinity stress (b) conditions.
X-axes indicate genomic locations of 100 kb nonoverlapping windows for which the total numbers of unique genes regulated were calculated (Y-axis). Hotspots were defined as windows regulating expression of over 30 genes; there were 0 hotspots in normal conditions (max number of genes = 28), and 11 hotspots in saline conditions. Gray horizontal line represents the cutoff of 30 genes.
Figure 5—figure supplement 2
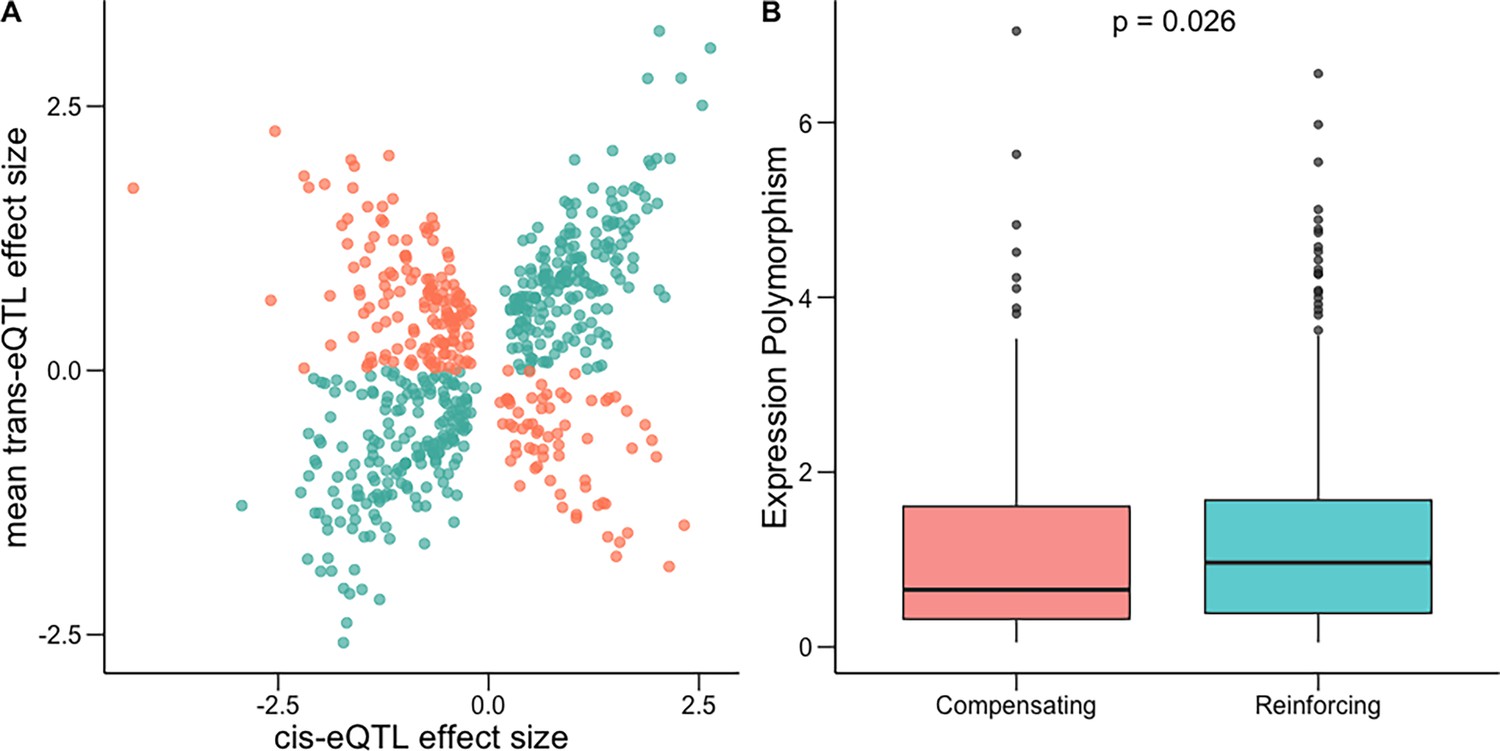
Compensating and reinforcing cis-trans effects in normal conditions.
(A) Effect sizes of genes with both cis and trans factors showing excess of cis-trans reinforcement (teal) in comparison to cis-trans compensation (salmon). (B) Inter-varietal differences in gene expression for genes under compensating control is significantly lower than that for genes under reinforcing control; one-sided Mann-Whitney p=0.026.
Figure 5—figure supplement 3
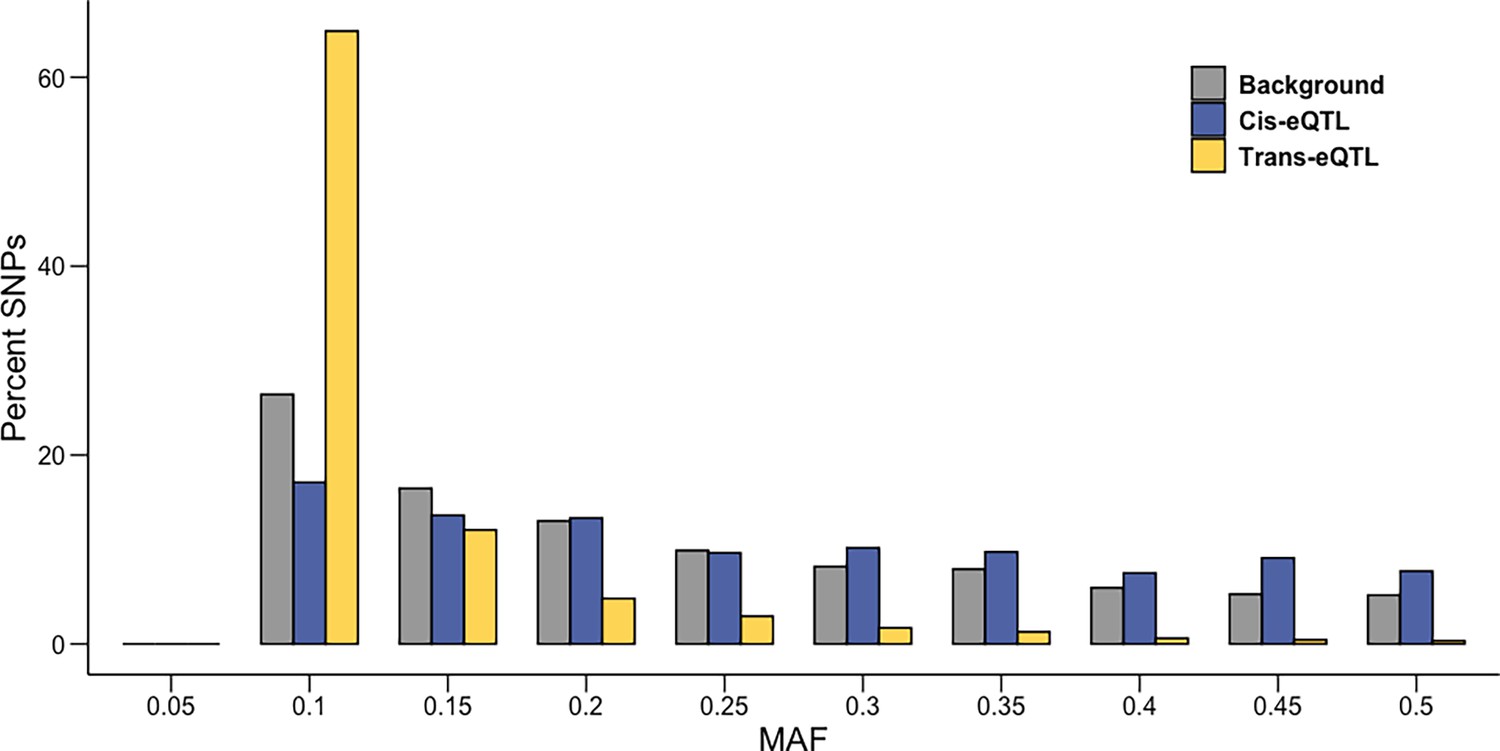
Frequency distribution of MAF (Minor Allele Frequency) for cis-eQTLs (blue) and trans-eQTLs (yellow) in normal conditions against the genome-wide background (gray).
Tables
Table 1
Summary statistics of selection on gene expression.
| Control | Salt | ||
|---|---|---|---|
| Median |S| | 0.0501 | 0.0507 | |
| S>0 | # Transcripts | 9654 | 8885 |
| Median S | 0.053 | 0.051 | |
| S<0 | # Transcripts | 8415 | 9133 |
| Median S | –0.047 | –0.050 | |
| C>0 | # Transcripts | 7175 | 8713 |
| Median C | 0.077 | 0.115 | |
| C<0 | # Transcripts | 10894 | 9304 |
| Median C | –0.096 | –0.111 | |
-
S and C represent the linear and quadratic selection differentials.
Additional files
-
MDAR checklist
- https://cdn.elifesciences.org/articles/99352/elife-99352-mdarchecklist1-v1.docx
-
Supplementary file 1
Systems genetics analysis of variance in the transcriptome of the Indica population in normal and salt conditions.
Abbreviations: TrID - TranscriptID; DF - Degrees of Freedom; SS - Sum of Squares; MS - Mean Sum of Squares; F - F-statistic value; p - p-value; FDR - False Discovery rate; H2 - Broad-sense heritability; G - Genotype; E - Environment; GE - Genotype-by-Environment; R - Residuals.
- https://cdn.elifesciences.org/articles/99352/elife-99352-supp1-v1.xlsx
-
Supplementary file 2
Summary statistic of selection on gene expression in the Indica population in normal and salt conditions.
Abbreviations: P-value: Two-sided Mann-Whitney U-test; S: Linear selection differential; C: Quadratic selection differential; μ and 𝜎 - mean- and variance-standardized selection differential.
- https://cdn.elifesciences.org/articles/99352/elife-99352-supp2-v1.xlsx
-
Supplementary file 3
Selection statistics of transcripts in normal and salt conditions.
Abreviations: TrID - TranscriptID; S - Linear Selection Differential; C -Quadratic Selection Differential; μ and 𝜎 - mean- and variance-standardized selection differential; tval - t-statistic associated with the estimation of seletion differentials; Pval - Pvalue associated with the estimation of selecion differentials; BonferroniPval - Bonferroni corrected Pvalue.
- https://cdn.elifesciences.org/articles/99352/elife-99352-supp3-v1.xlsx
-
Supplementary file 4
Conditionally neutral, Antagonistic Pleiotropic (CANP) transcripts and their enrichments.
Abbreviations: AP : Antagonistically Pleiotropic; FDR - False Discovery Rate.
- https://cdn.elifesciences.org/articles/99352/elife-99352-supp4-v1.xlsx
-
Supplementary file 5
Biological Pathways and Processes under selection.
Abbreviations: TrID - Transcript ID; Gene_id - Gene ID; GO_ID: Biology Gene Ontology (ID); S - Linear selection differential (raw) in the normal and saline field.
- https://cdn.elifesciences.org/articles/99352/elife-99352-supp5-v1.xlsx
-
Supplementary file 6
PCA analyses of transcripts in the normal and saline conditions with PCs explaining at least 0.5% variation in total gene expression.
- https://cdn.elifesciences.org/articles/99352/elife-99352-supp6-v1.xlsx
-
Supplementary file 7
Selection statistics of transcript PCs and its enrichment under normal and saline conditions.
KEGG Pathway Enrichment of the PCs with linear significant selection gradeient in either normal or saline conditions.
- https://cdn.elifesciences.org/articles/99352/elife-99352-supp7-v1.xlsx
-
Supplementary file 8
Evidence for salinity stress induced decoherence.
Unique transcripts along with its frequency with significantly different correlation between environments.
- https://cdn.elifesciences.org/articles/99352/elife-99352-supp8-v1.xlsx
-
Supplementary file 9
Linear and Quadratic Selection gradients and their associated statistics acting on the traits.
Abbreviations: Beta-Linear gradient; Gamma-Quadratic gradient; SE-Standard error; df-Degree of Freedom; tvalue and Pval - t-statistic value and P value associated with estimation of beta and gamma.
- https://cdn.elifesciences.org/articles/99352/elife-99352-supp9-v1.xlsx
-
Supplementary file 10
eQTLs in normal and saline environment.
leadSNP trans-eQTLs with FDR < 0.001 in the saline conditions. Abbreviations: SNPid-SNP ID; Chr-Chromosome SNP is persent on; Pos- Position on chromosome for the SNP; Gene-Gene regulated by SNP; Statistic and Pvalue- Statistic and P value assocaited with association analysis; FDR- False Discovery Rate; beta - Effect size of gene regulation by the SNP.
- https://cdn.elifesciences.org/articles/99352/elife-99352-supp10-v1.xlsx
-
Supplementary file 11
trans-eQTL hotspots idetified in the saline environment.
Abbreviations: HotspotID- Hotspot ID; Chr - Chromosome on which Hoptspot is present; StartPos and StopPos - Start and End chromosomal location of the hopspot; BinWidth-Size (in bp) of the hotspot; Nogenes_Salt- Number of genes regulated by SNPs in the hotspot region; RegulatedGeneID - ID of genes regulated by SNPs in the hotspot region.
- https://cdn.elifesciences.org/articles/99352/elife-99352-supp11-v1.xlsx
-
Supplementary file 12
cis-trans compesating vs reinforcing transcripts identified in normal and saline conditions.
Abbreviations: TrID - TranscriptID; mean cis-effect - mean effect of cis-regulatory variants; mean trans-effect - mean effect of trans-acting variants; Inter-varietal variation - inter-varietal variation in gene expression for the population; Group - Compensating/Reinforcing.
- https://cdn.elifesciences.org/articles/99352/elife-99352-supp12-v1.xlsx
-
Supplementary file 13
Information regarding the accessions used in this study.
Abbreviations: IRGC_ID_DNA_Source: IRGC ID of the accesion; Varietal Name: Common varietal name of the accession; Varietal Group: Subgroup the accession belongs to; SRA Bioproject ID: SRA ID where the genomic data for each accession is available.
- https://cdn.elifesciences.org/articles/99352/elife-99352-supp13-v1.xlsx
Download links
A two-part list of links to download the article, or parts of the article, in various formats.
Downloads (link to download the article as PDF)
Open citations (links to open the citations from this article in various online reference manager services)
Cite this article (links to download the citations from this article in formats compatible with various reference manager tools)
Systems genomics of salinity stress response in rice
eLife 13:RP99352.
https://doi.org/10.7554/eLife.99352.3


