A temporally restricted function of the dopamine receptor Dop1R2 during memory formation
- Department of Biology, University of Fribourg, Switzerland
Figures
Figure 1 with 1 supplement
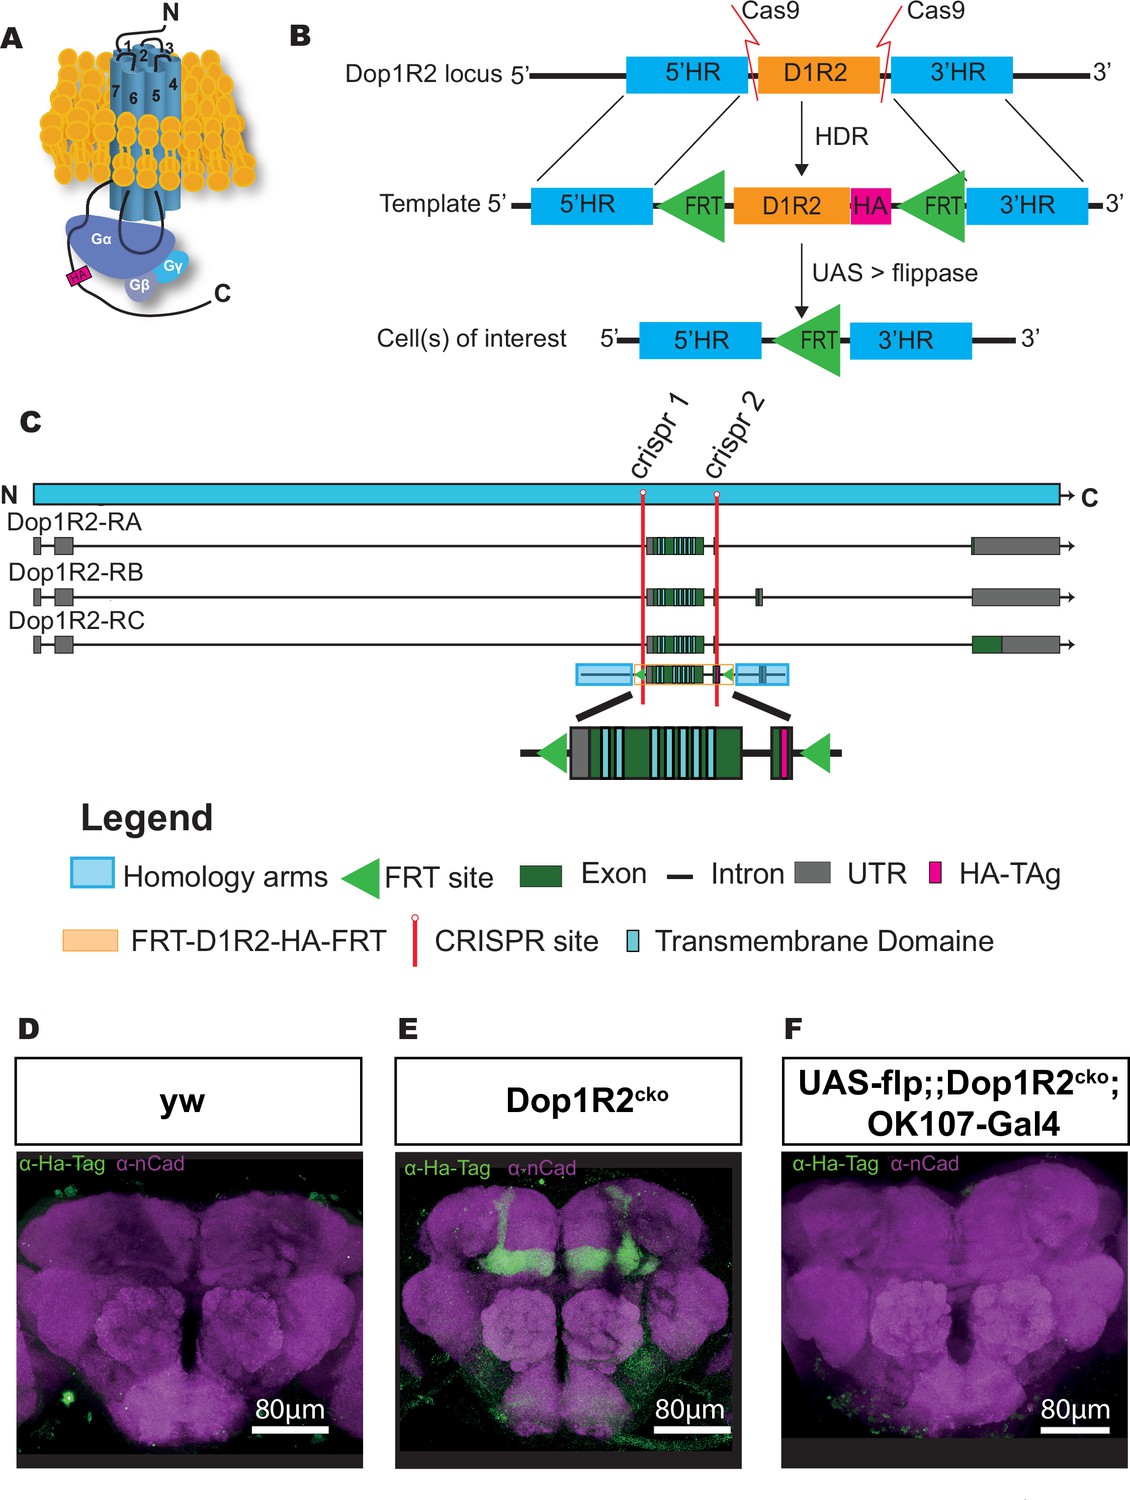
Generation of a conditional knockout allele for Dop1R2.
(A) Schematic representation of the receptor structure and interaction with the G-protein complex. The position of the HA-tag is indicated. (B) Schematic representation of the conditional knockout system. The endogenous Dop1R2 was replaced using CRISPR-Cas9-mediated homology-directed repair (HDR) from a donor plasmid. The plasmid contained the two common coding exons of Dop1R2 with an HA-tag in the C-terminus and two FRT sites flanking this sequence. In the resulting Dop1R2cko allele, the inserted HA-tag and Dop1R2 sequence can be removed by flippase (FLP) in cells of interest. (C) Schematic representation of the Dop1R2 gene locus with three different transcript isoforms. The location of the two used CRISPR sites is highlighted in red. The positions of the transmembrane domains in the isoforms and in the donor plasmid are indicated. (D–F) Dop1R2::HA expression in a frontal brain confocal section of (D) y, w, (E) Dop1R2cko, or (F) UAS-flp/+;; dop1R2cko, OK107-Gal4/+ flies aged 1 week. The HA-tag was visualized using an anti-HA-tag antibody (green). Brain structures were labeled with anti-N-cadherin (nCad, magenta) antibody. Scale bar: 80 µm.
Figure 1—figure supplement 1
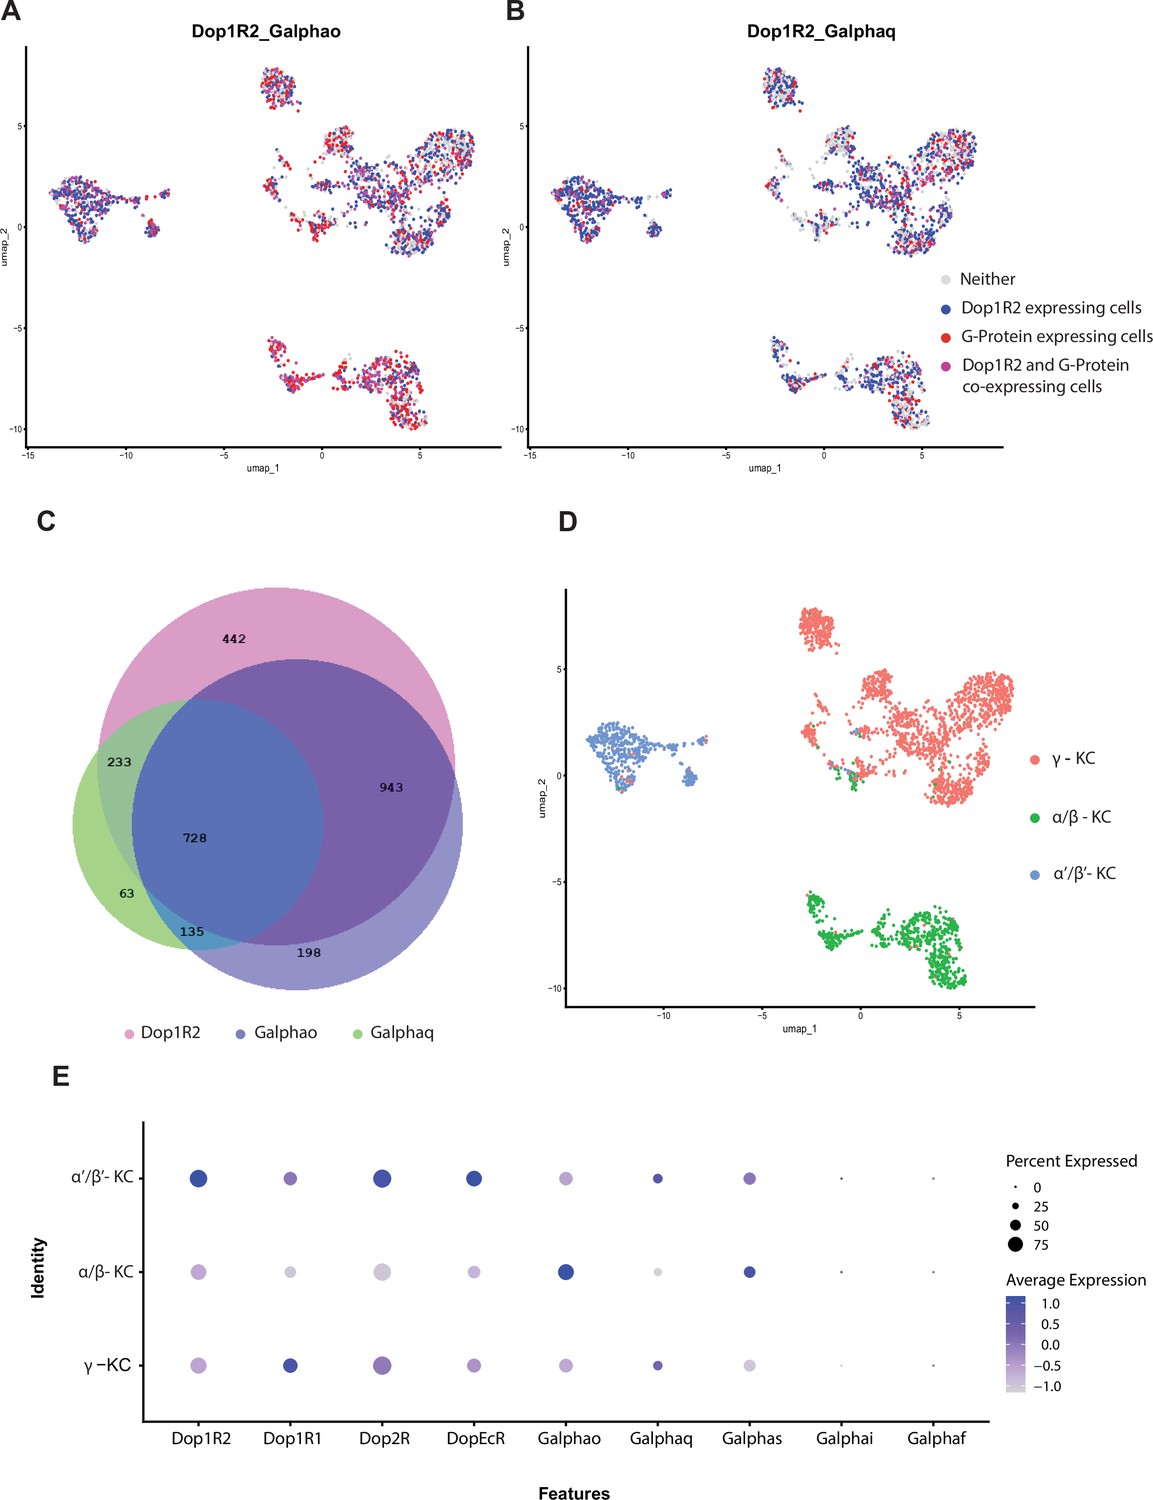
Single-cell transcriptomic analysis of Dop1R2 and various G-proteins in the mushroom body (MB) neurons.
(A–B) Co-expression of Dop1R2 and Gαo and Gαq, respectively. Cells expressing Dop1R2 are depicted in red, while the G-proteins are depicted in blue. Cells expressing both Dop1R2 and one of the G-proteins are shown in magenta. (C) Venn diagram of cells expressing Dop1R2, Gαo, and Gαq in pink, violet, and green, respectively. The size of the circles corresponds to the number of cells expressing proteins. (D) UMAP clustering of MB neurons, γ-lobe neurons are shown in pink, α/β-lobe neurons are shown in green, while α’/β’-lobe neurons are in blue. (E) Dot plot of dopamine receptors and G-proteins in the different MB lobes. The color and size of the dots represent the average expression and percentage of expression, respectively.
Figure 2 with 1 supplement
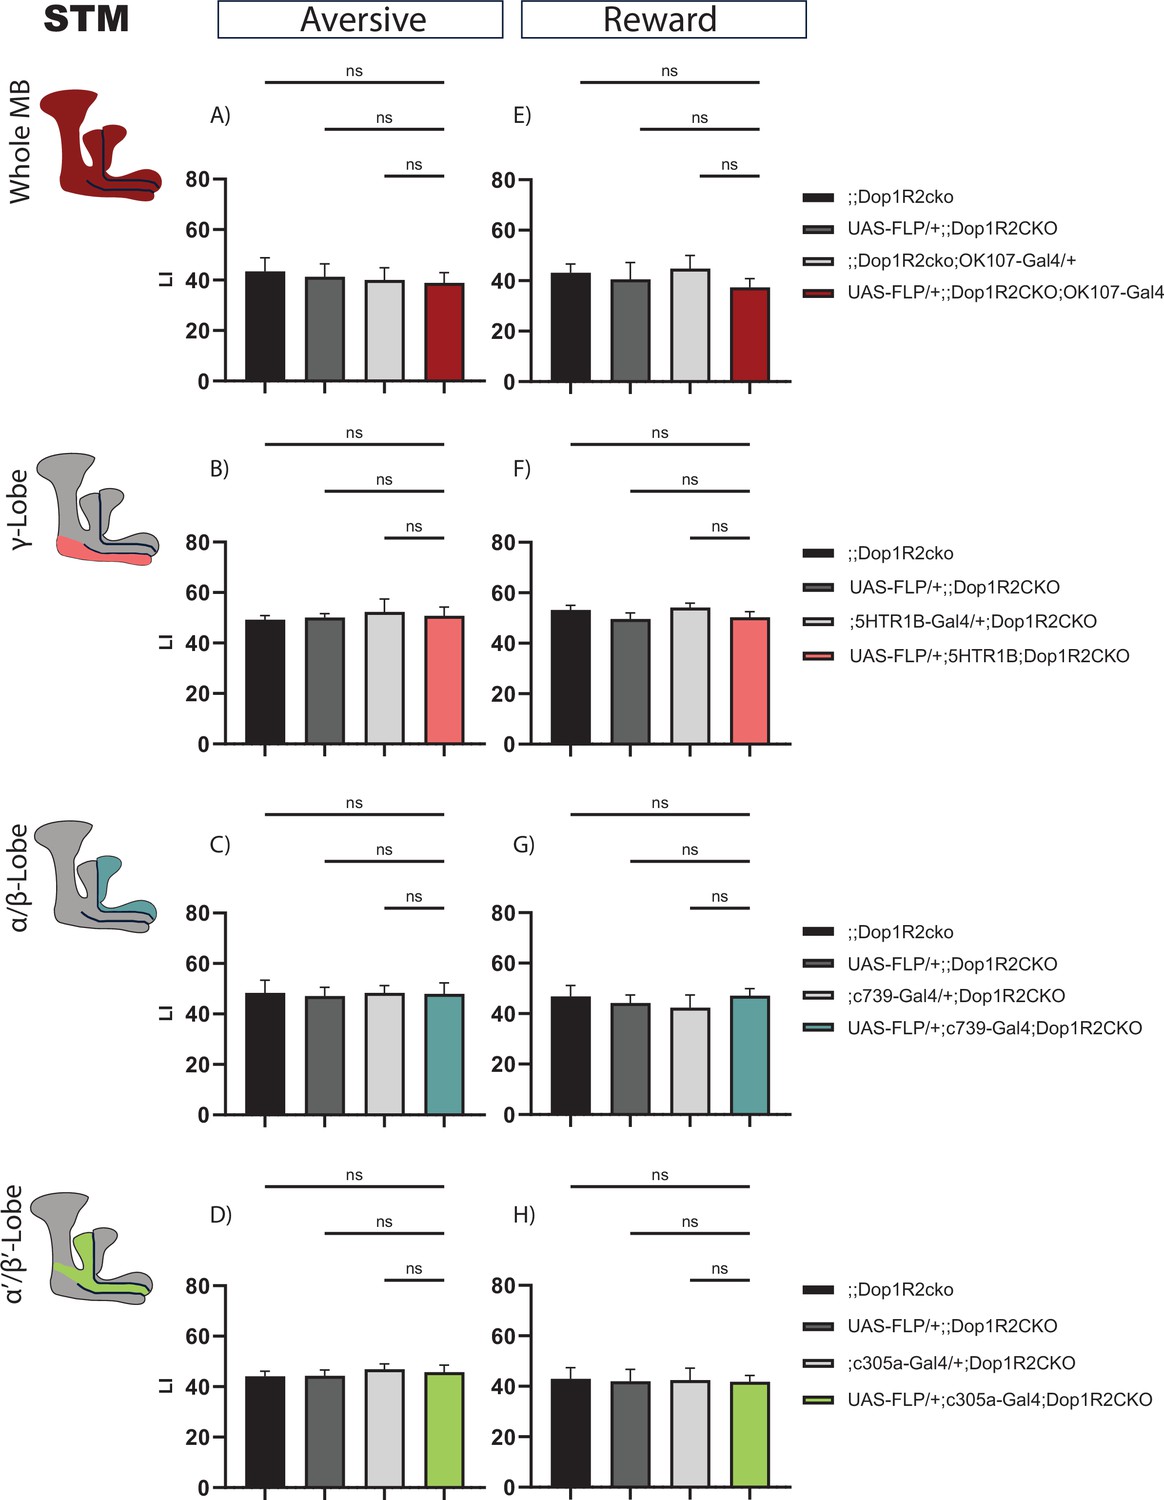
Short-term memory of flies with knockout of Dop1R2 in the mushroom body (MB).
(A–D) Aversive training, (E–H) reward training. (A and E) Whole MB flip-out using OK107-Gal4 and parental controls. (B and F) γ-Lobe flip-out using 5HTR1B-Gal4 and parental controls. (C and G) α/β-Lobe flip-out using c739-Gal4 and parental controls. (D and H) α’/β’-Lobe flip-out using c305a-Gal4 and parental controls. No performance impairment was observed in any of the tested conditions. See Figure 2—figure supplement 1 for sensory controls . Bar graphs represent the mean, and error bars represent the standard error of the mean. For each shown graph, N=12. ns: not significantly determined by a one-way ANOVA and Tukey’s HSD.
Figure 2—figure supplement 1
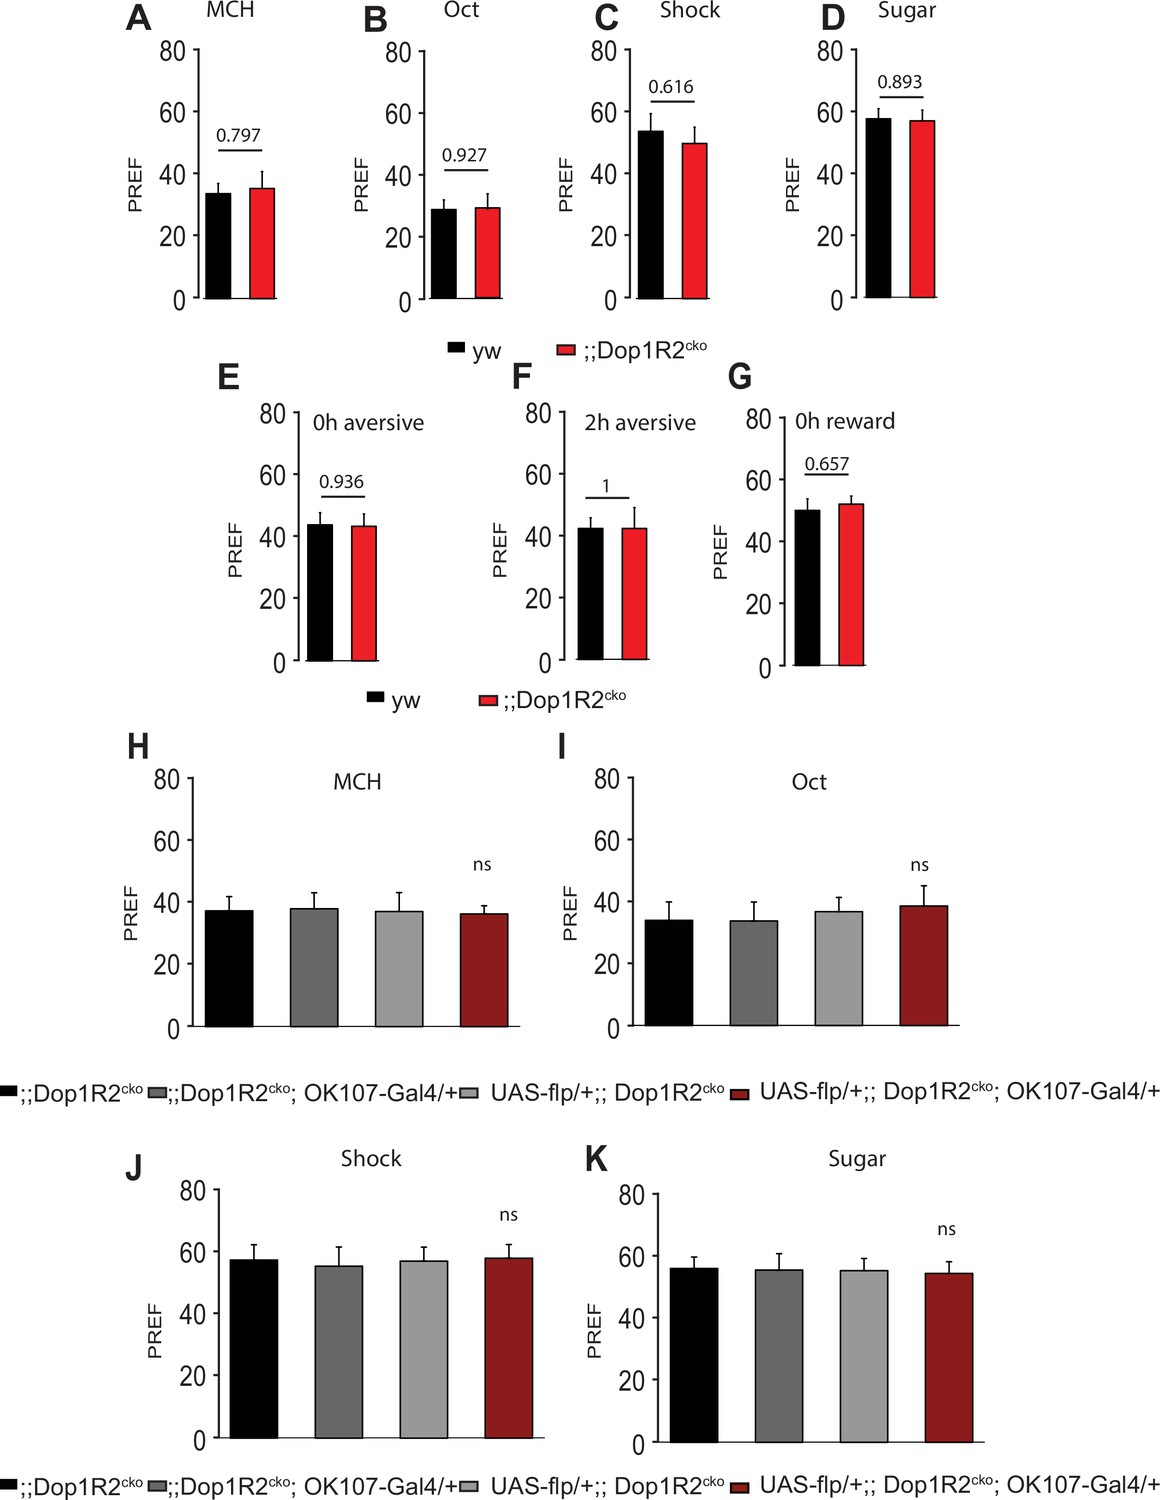
Sensory tests of the Dop1R2 conditional knockout line.
(A) Response of y w and Dop1R2cko to MCH. (B) Response of y w and Dop1R2cko to Oct. (A) Response of y w and Dop1R2cko to shock. (A) Response of y w and Dop1R2cko to sugar. (E) 0 hr aversive memory of y w and Dop1R2cko. (F) 2 hr aversive memory of y w and Dop1R2cko. (G) 0 hr reward memory of y w and Dop1R2cko. In all tested conditions, the Dop1R2cko shows no significant difference to the control line. (H–K) Sensory responses of flies with Dop1R2 knockout in the whole mushroom body (MB) alongside the parental control lines. (H) Response to MCH. (I) Response to Oct. (J) Response to shock. (K) Response to sugar. Loss of Dop1R2 in the whole MB does not affect sensory responses. Bar graphs represent the mean, and error bars represent the standard error of the mean. For each shown graph, N=12. Asterisks denote significant differences between groups (*p<0.05, **p<0.005, ***p<0.001, ns: not significant) determined by one-way ANOVA and Tukey’s HSD.
Figure 3
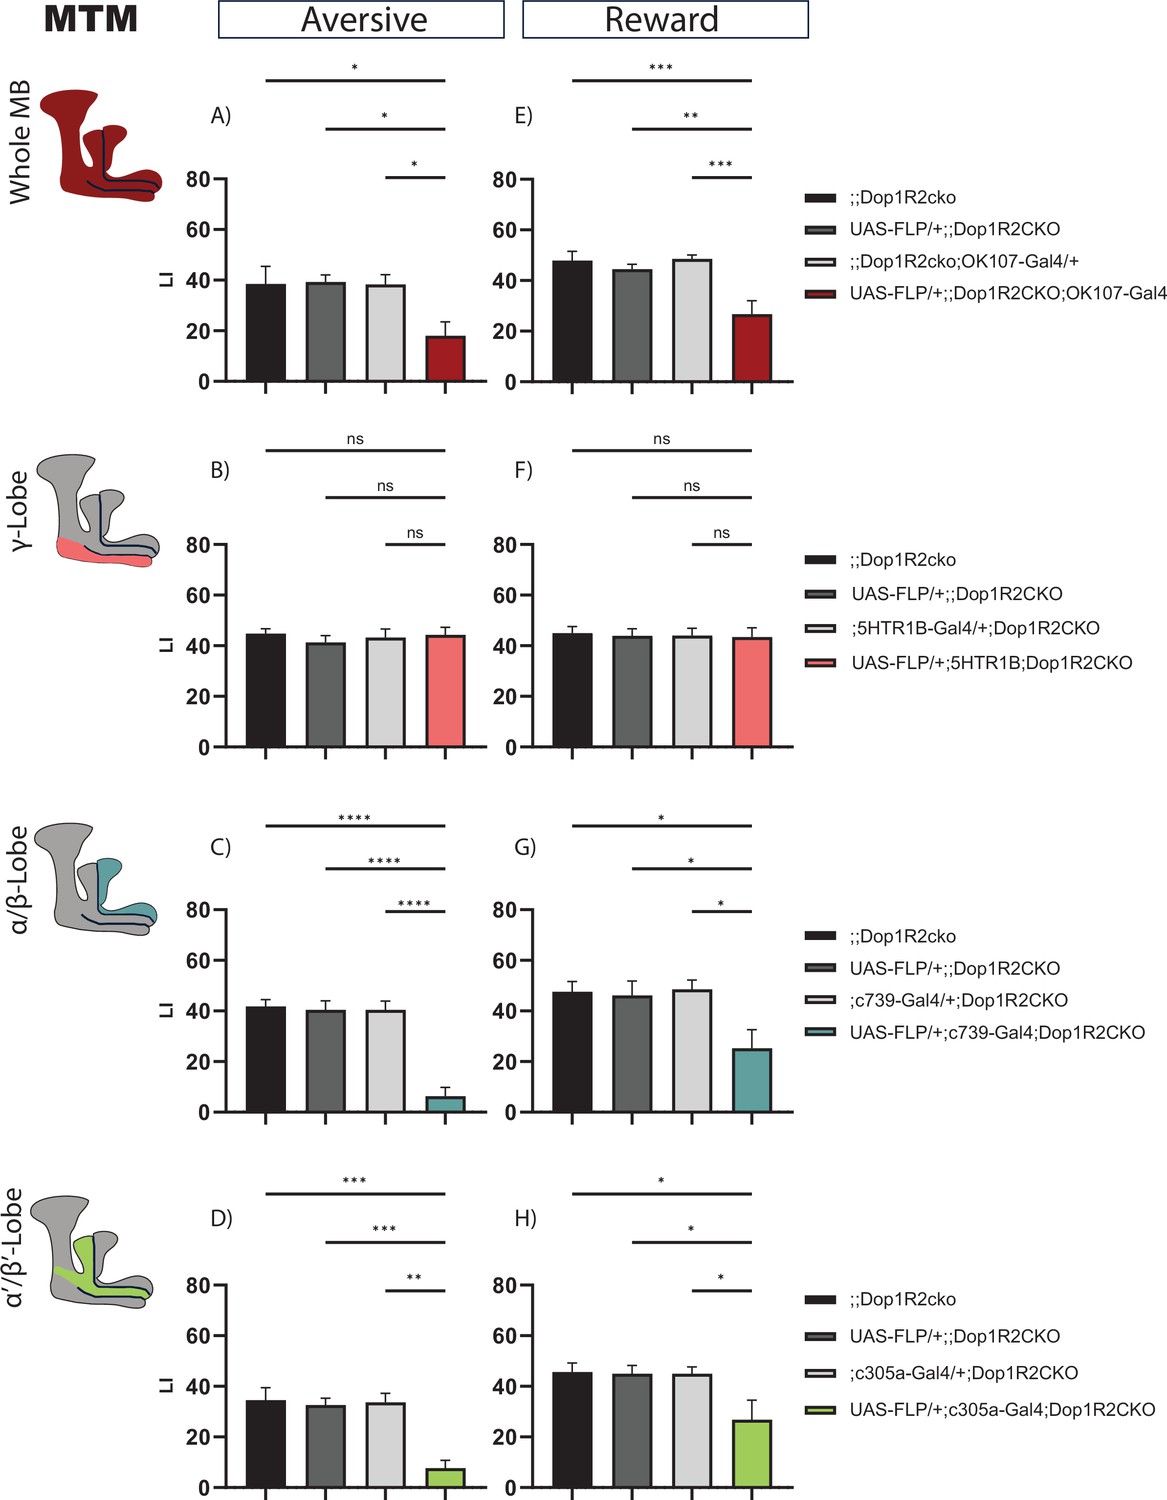
2 hr memory of flies with knockout of Dop1R2 in the mushroom body (MB).
(A–D) Aversive training, (E–H) reward training. (A and E) Whole MB flip-out using OK107-Gal4 and parental controls. (B and F) γ-Lobe flip-out using 5HTR1B-Gal4 and parental controls. (C and G) α/β-Lobe flip-out using c739-Gal4 and parental controls. (D and H) α’/β’-Lobe flip-out using c305a-Gal4 and parental controls. For whole MB flip-out, α/β-lobes and α’/β’-lobes, both aversive and appetitive 2 hr memory performance is impaired. Loss of Dop1R2 in the γ-lobe does not affect 2 hr memory. See Figure 2—figure supplement 1 for sensory controls. Bar graphs represent the mean, and error bars represent the standard error of the mean. For each shown graph, N=12. Asterisks denote significant differences between groups (*p<0.05, **p<0.005, ***p<0.001, ****p<0.0001, ns: not significant) determined by one-way ANOVA and Tukey’s HSD (panels A–C, E–H) and Kruskal-Wallis with Dunn’s multiple comparisons test due to non-normal distribution (panel D).
Figure 4 with 3 supplements
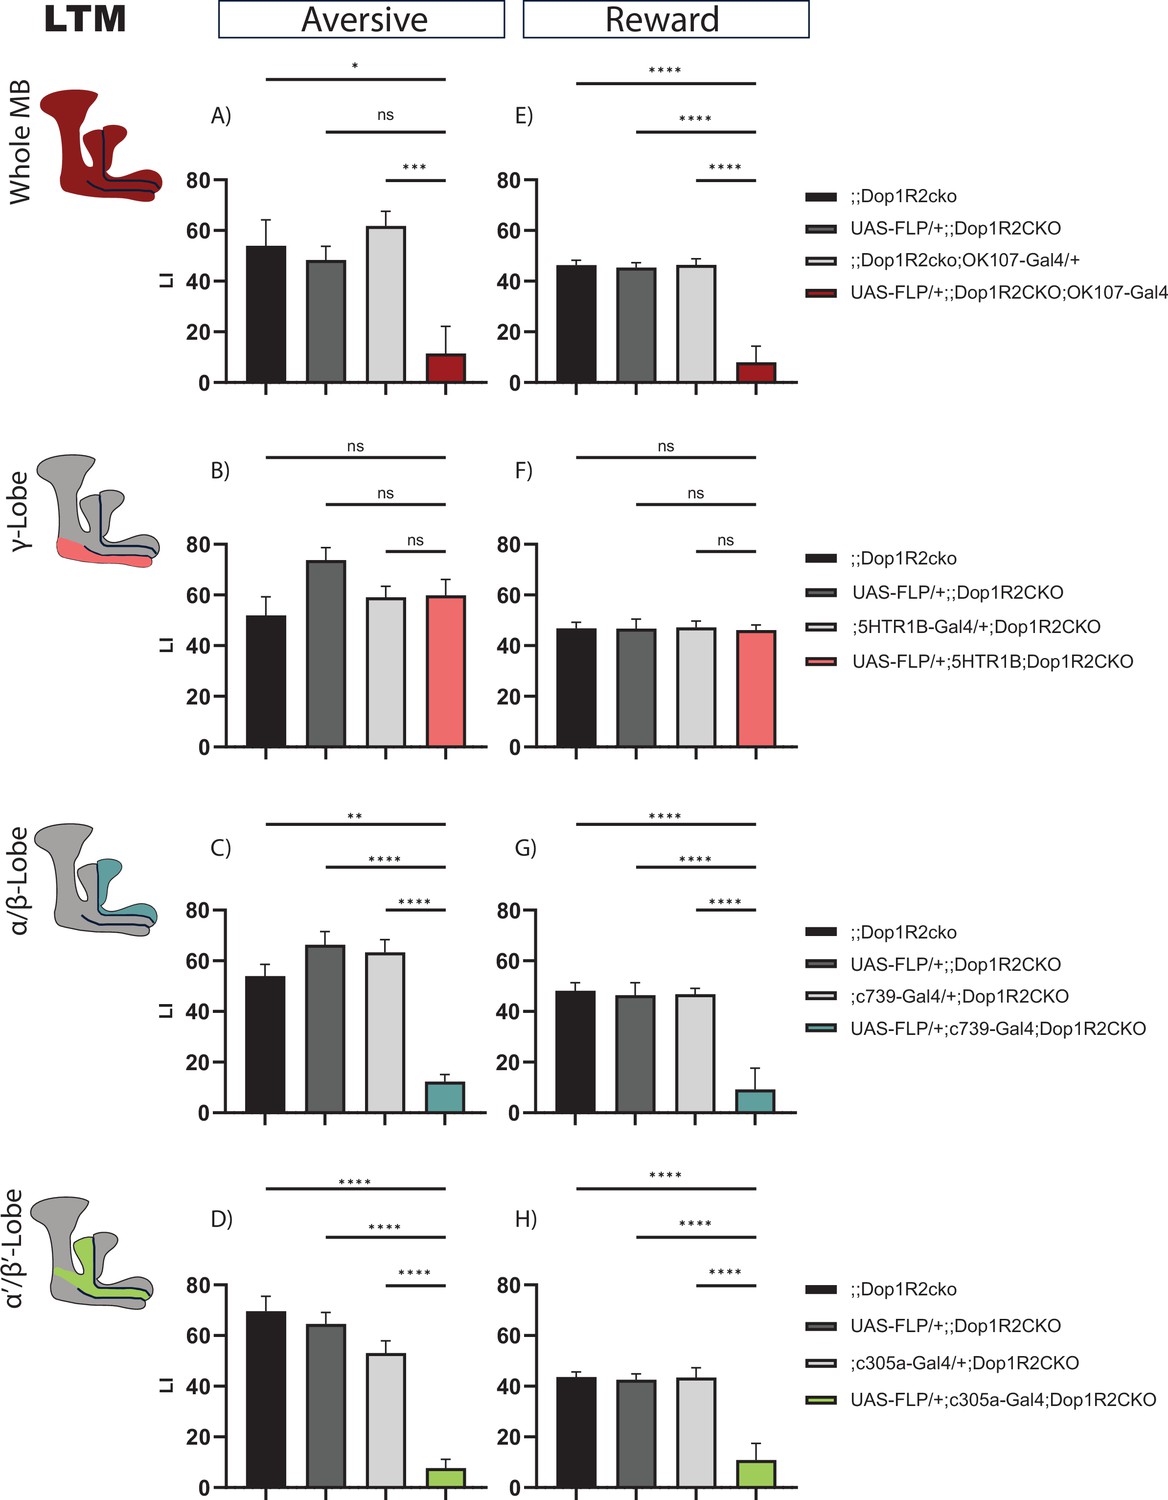
24 hr memory of flies with knockout of Dop1R2 in the mushroom body (MB).
(A–D) Aversive training, (E–H) reward training. (A and E) Whole MB flip-out using OK107-Gal4 and parental controls. (B and F) γ-Lobe flip-out using 5HTR1B-Gal4 and parental controls. (C and G) α/β-Lobe flip-out using c739-Gal4 and parental controls. (D and H) α’/β’-Lobe flip-out using c305a-Gal4 and parental controls. For whole MB flip-out, α/β-lobes and α’/β’-lobes, both aversive and appetitive 24 hr memory performance is impaired. Loss of Dop1R2 in the γ-lobe does not affect 24 hr memory. See Figure 2—figure supplement 1 for sensory controls. Bar graphs represent the mean, and error bars represent the standard error of the mean. For each shown graph included in the reward training experiment, N=12, while for the graphs included in the aversive training experiment, N=14. Asterisks denote significant differences between groups (*p<0.05, **p<0.005, ***p<0.001, ****p<0.0001, ns: not significant) determined by Kruskal-Wallis with Dunn’s multiple comparisons test due to non-normal distribution (panels A–C) and one-way ANOVA and Tukey’s HSD (panels D–H).
Figure 4—figure supplement 1
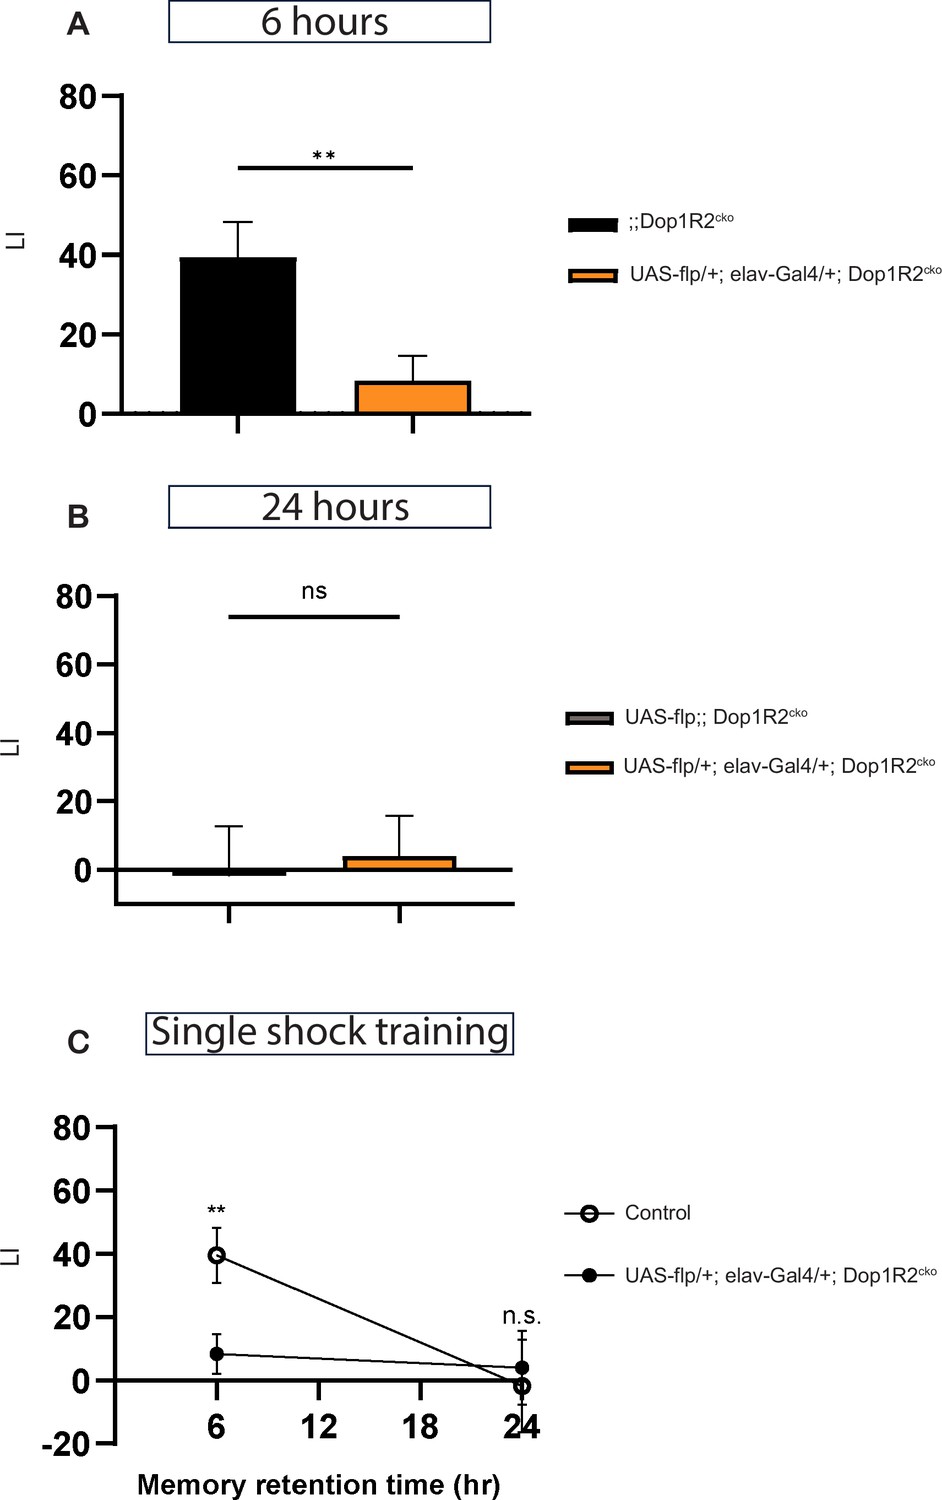
Memory retention upon single shock aversive training in Dop1R2 pan-neuronal knockout flies.
(A) 6 hr memory performance of Dop1R2 pan-neuronal knockout flies using elav-Gal4. (B) 24 hr memory performance of Dop1R2 pan-neuronal knockout flies using elav-Gal4. (C) Memory retention over 24 hr in Dop1R2 pan-neuronal knockout flies. Lack of the receptor in the whole nervous system does not improve memory retention, suggesting that Dop1R2 sparsely expressed outside of the mushroom body (MB) might not be regulating any memory process. Single shock training is not sufficient to retain aversive memory for 24 hr in control flies either. For each graph shown, N=7. Asterisks denote significant differences between groups (*p<0.05, **p<0.005, ***p<0.001, ns: p>0.05) determined by unpaired t-test. The one-sample t-test showed no significant difference from zero for all the groups apart from the control line in the 6 hr memory experiment.
Figure 4—figure supplement 2
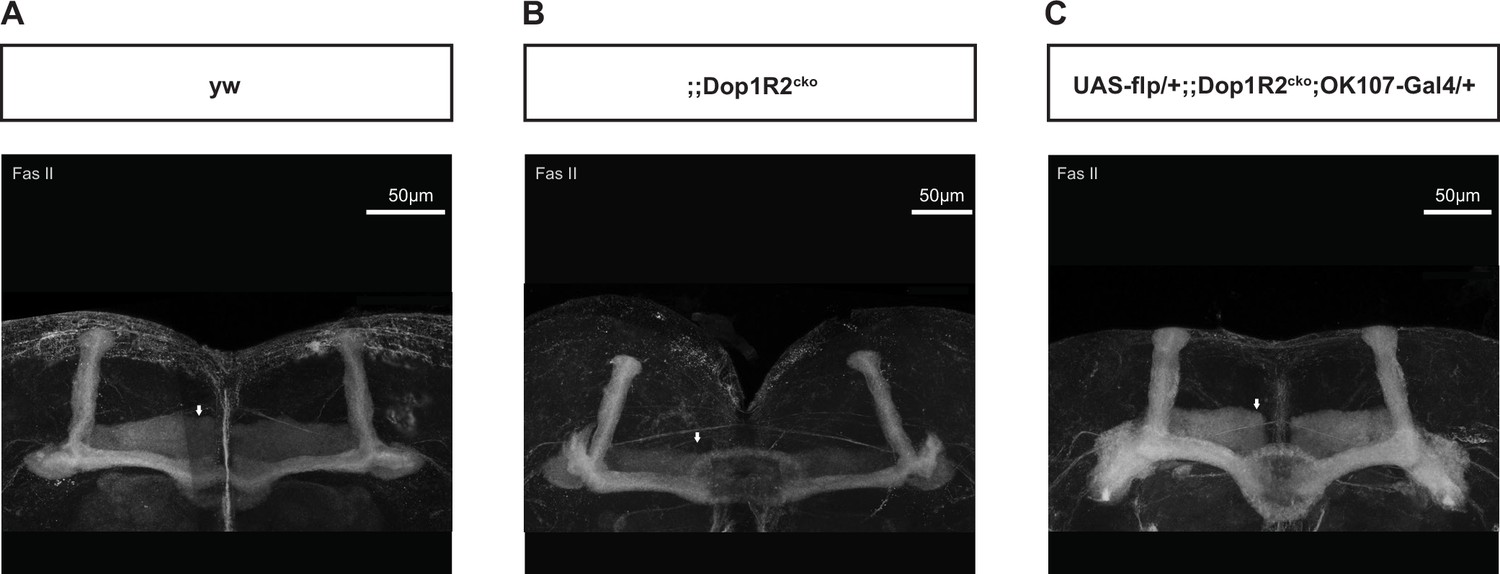
γ-Lobe development in the Dop1R2cko carrying flies.
(A–C) FasII expression in a frontal view of whole-brain immunostaining, highlighting the mushroom body. The Dop1R2cko modification does not affect γ-lobe (white arrows) development. Images were taken at ×63 magnification. Scale bar: 50 µm.
Figure 4—figure supplement 3
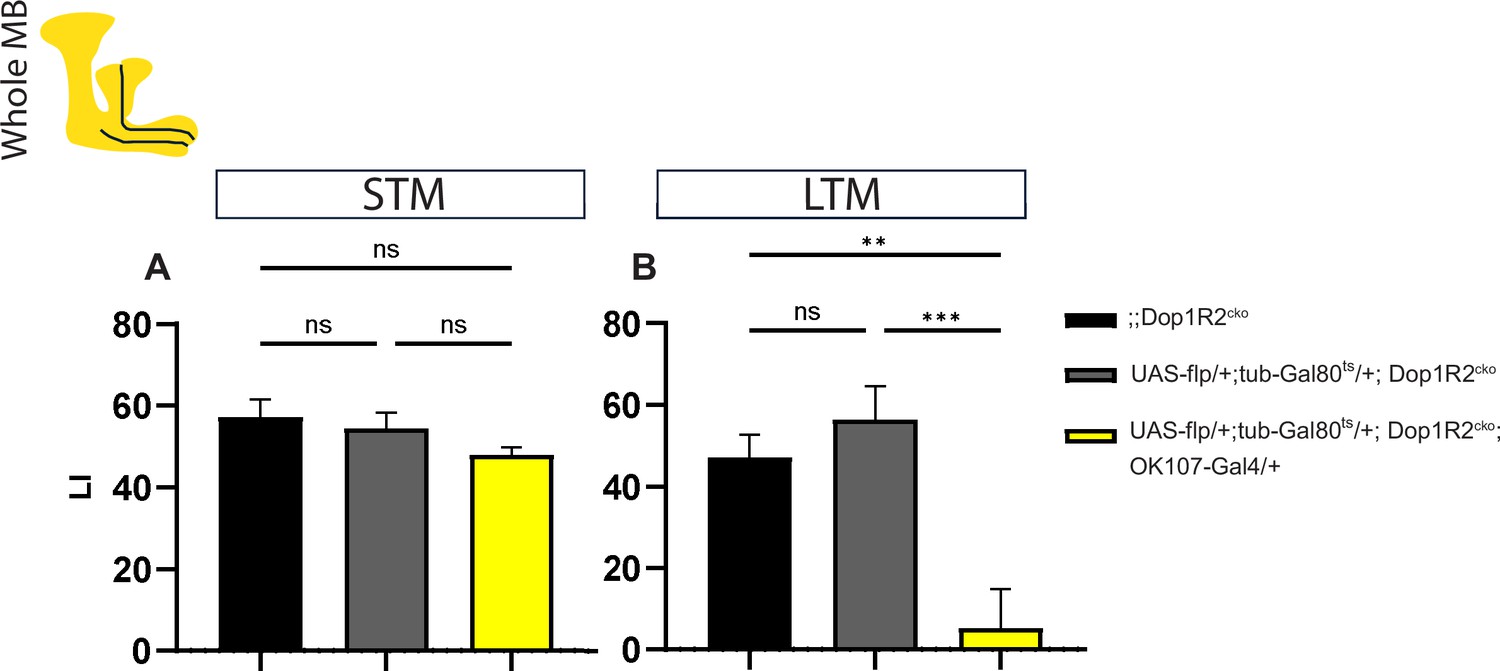
A temporally restricted knockout of Dop1R2 in the mushroom body rules out developmental defects.
(A and B) Aversive training of flies with whole mushroom body flip-out at 0 day post-eclosion, using the flies ;;Dop1R2cko and UAS-flp/+; tub-Gal80/+; Dop1R2cko as control and UAS-flp/+; tub-Gal80/+; Dop1R2cko; OK107-Gal4/+ the experimental, temporally restricted knockout flies. (A) Short-term memory (STM) tested 0 hr after training. (B) Long-term memory (LTM) tested 24 hr after training. Loss of Dop1R2 in the whole mushroom body exclusively after eclosion had no effect on STM but significantly impaired memory retention at 24 hr. Bar graphs represent the mean, error bars represent the standard error of the mean. For the STM graph, N=9, while for the LTM graph, N=14. Asterisks denote significant differences between groups (*p<0.05, **p<0.005, ***p<0.001, ****p<0.0001, ns: not significant) determined by one-way ANOVA and Tukey’s HSD.
Tables
Table 1
Primers and guide RNAs (gRNAs) for generating Dop1R2 conditional knockout lines.
| Primer name | Sequence | |
|---|---|---|
| Dop1R2 | ||
| Sequence-based reagent | Dop1R2_5’_fw_SpeI | GCTGCAGACTAGTCAGCCACCACA |
| Dop1R2_5’_re_SmaI | CCTGAACCCGGGGATAAACTTTACCATAATGC | |
| Dop1R2_fragment_fw_AgeI | GTTCGACCGGTGATTGCATTGTGTTCACCAG | |
| Dop1R2_fragment_re_BstEII | GGGCTTGGTAACCACGACGAATCTTGCGTGGACAG | |
| Dop1R2_3’_fw_XhoI | ATTCTCGAGAAGTATCAACCCACGATGCGTTC | |
| Dop1R2_3’_re_Acc65I | GGCAACGGTACCAGATGCAGATACCG | |
| Sequence-based reagent | Dop1R2_gRNA_5’ | ACGAACTTAAGATAAAGTGTCGG |
| Dop1R2_gRNA_3’ | GCATCGTGGGCTGGTACTTCCGG | |
| Sequence-based reagent | Dop1R2_Screening_for | TATCCCTATGACGTCCCGGAC |
| Dop1R2_Screening_re | GACAGGTTGAGTGATGCGCC | |
| Dop1R2_5’FRT_for | GGCTACACATCATTTTATGCCAG | |
| Dop1R2_5’FRT_re | GTTCCTGTGCCTGATTCTGTTC | |
| Dop1R2_3’FRT_for | TCCTAACTGGCTTCTCTTCC | |
| Dop1R2_3’FRT_re | AGCGCTTAATTCACGAAAGC | |
Key resources table
| Reagent type (species) or resource | Designation | Source or reference | Identifiers | Additional information |
|---|---|---|---|---|
| Genetic reagent Drosophila melanogaster both male and female | y[1] w[*] P{y[+t7.7]=nos-phiC31\int.NLS}X; P{y[+t7.7]=CaryIP}su(Hw)attP6 | Bloomington Stock Center | RRID:BDSC_32232 | |
| Genetic reagent Drosophila melanogaster both male and female | w;; Dr e/TM3 | Bloomington Stock Center | RRID:BDSC_36305 | |
| Genetic reagent Drosophila melanogaster both male and female | w[1118], 20XUAS-FLPG5.PEST | Bloomington Stock Center | RRID:BDSC_55807 | |
| Genetic reagent Drosophila melanogaster both male and female | OK107-Gal4 | Kyoto Stock Center | DGGR_106098 | |
| Genetic reagent Drosophila melanogaster both male and female | 5HTR1B-Gal4 | Bloomington Stock Center | RRID:BDSC_27636 | |
| Genetic reagent Drosophila melanogaster both male and female | c739-Gal4 | Hiromu Tanimoto (Tohoku University Japan) | RRID:BDSC_7362 | |
| Genetic reagent Drosophila melanogaster both male and female | c305a-Gal4 | Bloomington Stock Center | RRID:BDSC_30829 | |
| Genetic reagent Drosophila melanogaster both male and female | y w | Bloomington Stock Center | RRID:BDSC_1495 | |
| Genetic reagent Drosophila melanogaster both male and female | FRT-Dop1R2-HA-FRT Dop1R2cko | This paper | See Materials and methods section: Creation of Dop1R2cko | |
| Antibody | Mouse monoclonal α-HA clone 12CA5 | Roche | RRID:AB _514505 11583816001 | 1:200 |
| Antibody | Mouse monoclonal anti-Fasciclin II | Developmental Studies Hybridoma Bank | RRID:AB_528235 | 1:50 |
| Antibody | Rat monoclonal α-Droso-N-cadherin (Ncad) | Developmental Studies Hybridoma Bank | RRID:AB_528121 DN-Ex #8 | 1:30 |
| Recombinant protein | Recombinant DANN reagent, pCFD4-U6_1_6_3tandemgRNAs plasmid | Simon Bullock | RRID:Addgene_49411 |
Additional files
Download links
A two-part list of links to download the article, or parts of the article, in various formats.
Downloads (link to download the article as PDF)
Open citations (links to open the citations from this article in various online reference manager services)
Cite this article (links to download the citations from this article in formats compatible with various reference manager tools)
A temporally restricted function of the dopamine receptor Dop1R2 during memory formation
eLife 13:RP99368.
https://doi.org/10.7554/eLife.99368.3


