The novel role of Kallistatin in linking metabolic syndromes and cognitive memory deterioration by inducing amyloid-β plaques accumulation and tau protein hyperphosphorylation
- Department of Biochemistry and Molecular Biology, Zhongshan School of Medicine, Sun Yat-sen University, China
- Advanced Medical Technology Center, The First Affiliated Hospital, Zhongshan School of Medicine, Sun Yat-sen University, China
- Guangdong Key Laboratory of Nanomedicine, CAS-HK Joint Lab of Biomaterials, Shenzhen Institute of Advanced Technology (SIAT), Chinese Academy of Sciences (CAS), China
- Guangdong Province Key Laboratory of Brain Function and Disease, School of Medicine, Sun Yat-sen University, China
- Department of Clinical Medical Laboratory, Guangzhou First People Hospital, School of Medicine, South China University of Technology, China
- China Key Laboratory of Tropical Disease Control (Sun Yat-sen University), Ministry of Education, China
- Guangdong Engineering & Technology Research Center for Gene Manipulation and Biomacromolecular Products (Sun Yat-sen University), China
- Guangdong Province Key Laboratory of Brain Function and Disease, Zhongshan School of Medicine, Sun Yat-sen University, China
- Guangdong Provincial Key Laboratory of Diabetology & Guangzhou Municipal Key Laboratory of Mechanistic and Translational Obesity Research, Medical Center for Comprehensive Weight Control, The Third Affiliated Hospital of Sun Yat-sen University Guangzhou, China
Figures
Figure 1 with 1 supplement
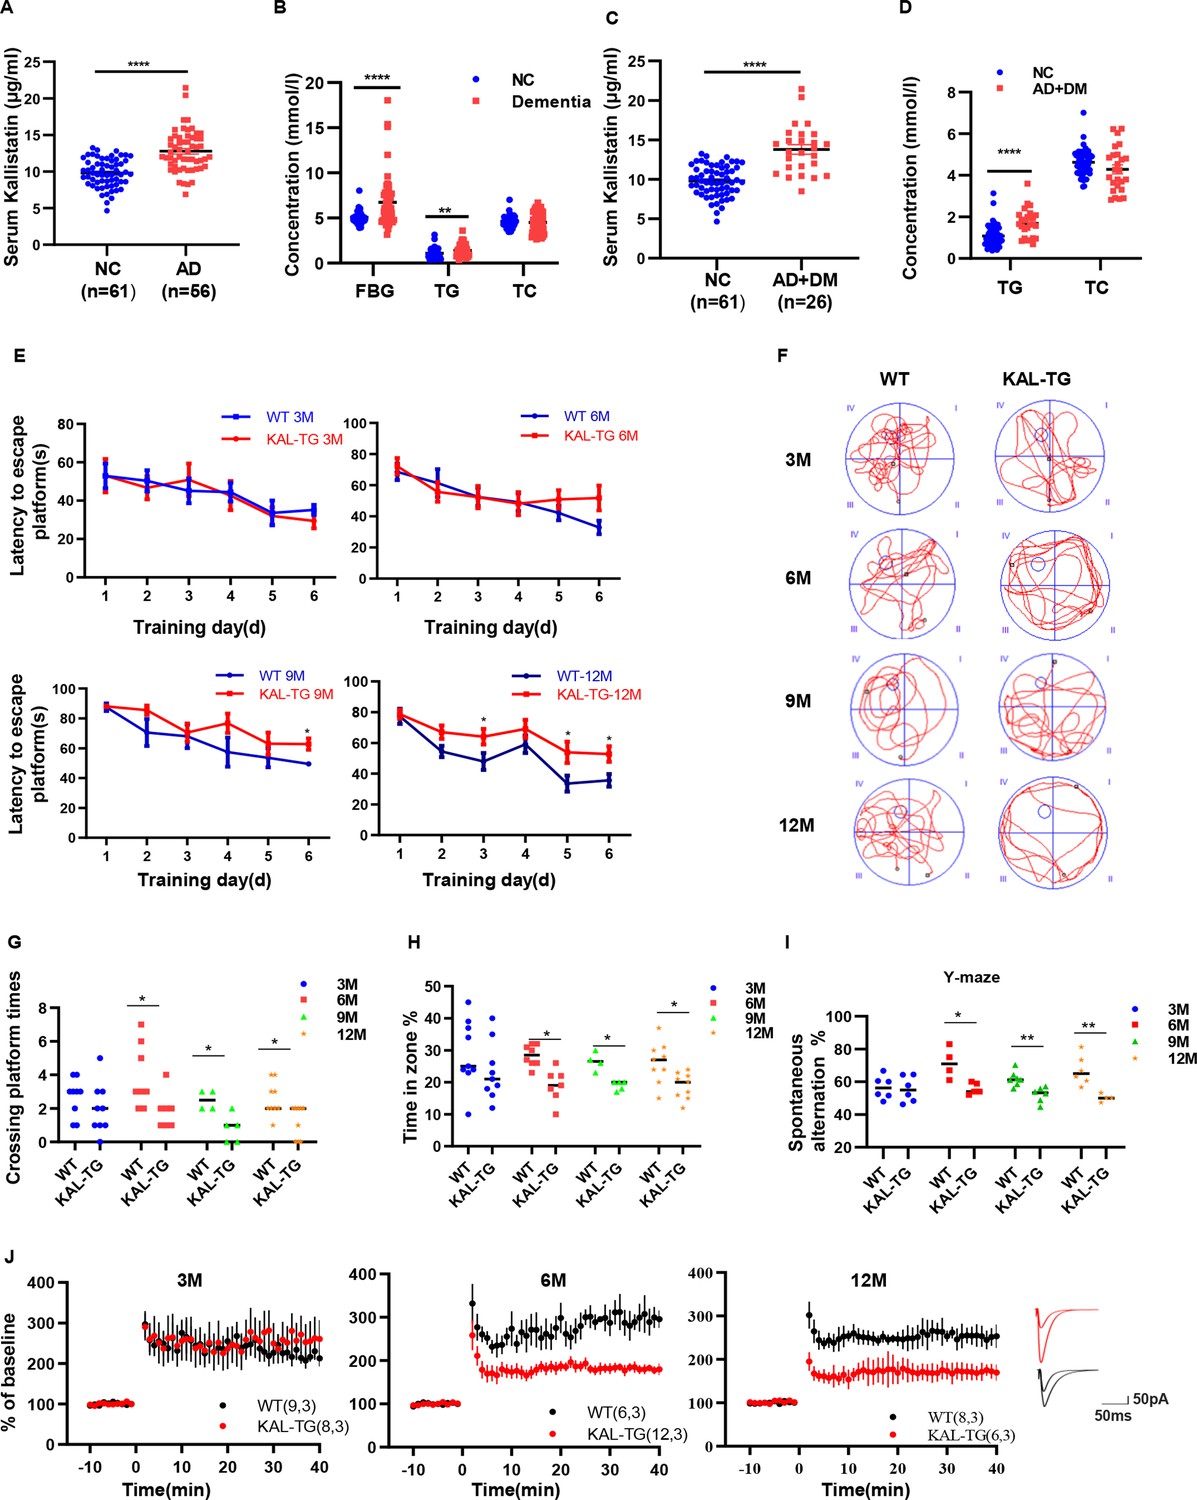
Increased Kallistatin was presented in Alzheimer’s disease (AD) patients and could impair cognitive memory in mice.
Serum Kallistatin (A), fasting blood glucose (FBG), triglyceride (TG), and total cholesterol (TC) (B) of AD patients and their corresponding normal control subjects. Serum Kallistatin (C), TG, and TC (D) of AD patients with DM and their corresponding normal control subjects (Student’s t-test). (E–J) The behavioral performance of KAL-TG mice was assessed through the Morris water maze test, Y-maze test, and electrophysiology. (E) The escape latency time of different months of KAL-TG mice (3, 6, 9, and 12 M) and corresponding WT mice was presented during 1–6 days (two-way ANOVA). Cognitive functions were evaluated by spatial probe test at day 7 (Student’s t-test), the representative each group mice traces were shown (F), then analyzing each group mice crossing platform times (G) and time percent in the targeted area (H), n = 4–9 per group. (I) Spontaneous alternation of Y-maze test. (J) Long-term potentiation (LTP) was measured by whole-cell voltage-clamp recordings of CA1 neurons in acute hippocampal slices of KAL-TG (3, 6, and 12 M) and WT mice (Student’s t-test, n = 6–12 cells from 3 mice per group). Error bars represent the standard deviation (SD); *p < 0.05; **p < 0.01; ***p < 0.0001.
Figure 1—figure supplement 1

Kallistatin is associated with Alzheimer’s disease.
GAD disease enrichment analysis (A) and PFAM analysis (B) result. Differentially expressed genes in neurons were obtained from GSE161355, and GAD disease enrichment was analyzed on the DAVID database. (C, D) Western blot analysis of Kallistatin expression in aging model SAMP8 and corresponding control SAMR1 mice hippocampal tissue samples, then statistically analyzing the above results. β-Actin served as a loading control. Error bars represent the standard deviation (SD); *p < 0.05.
-
Figure 1—figure supplement 1—source data 1
Kallistatin was upregulated in the hippocampal tissue of SAMP8 mice.
Western blot analysis of Kallistatin expression in aging model SAMP8 and corresponding control SAMR1 mice hippocampal tissue samples.
- https://cdn.elifesciences.org/articles/99462/elife-99462-fig1-figsupp1-data1-v1.zip
-
Figure 1—figure supplement 1—source data 2
Kallistatin was upregulated in the hippocampal tissue of SAMP8 mice.
Western blot analysis of Kallistatin expression in aging model SAMP8 and corresponding control SAMR1 mice hippocampal tissue samples.
- https://cdn.elifesciences.org/articles/99462/elife-99462-fig1-figsupp1-data2-v1.zip
Figure 2 with 1 supplement
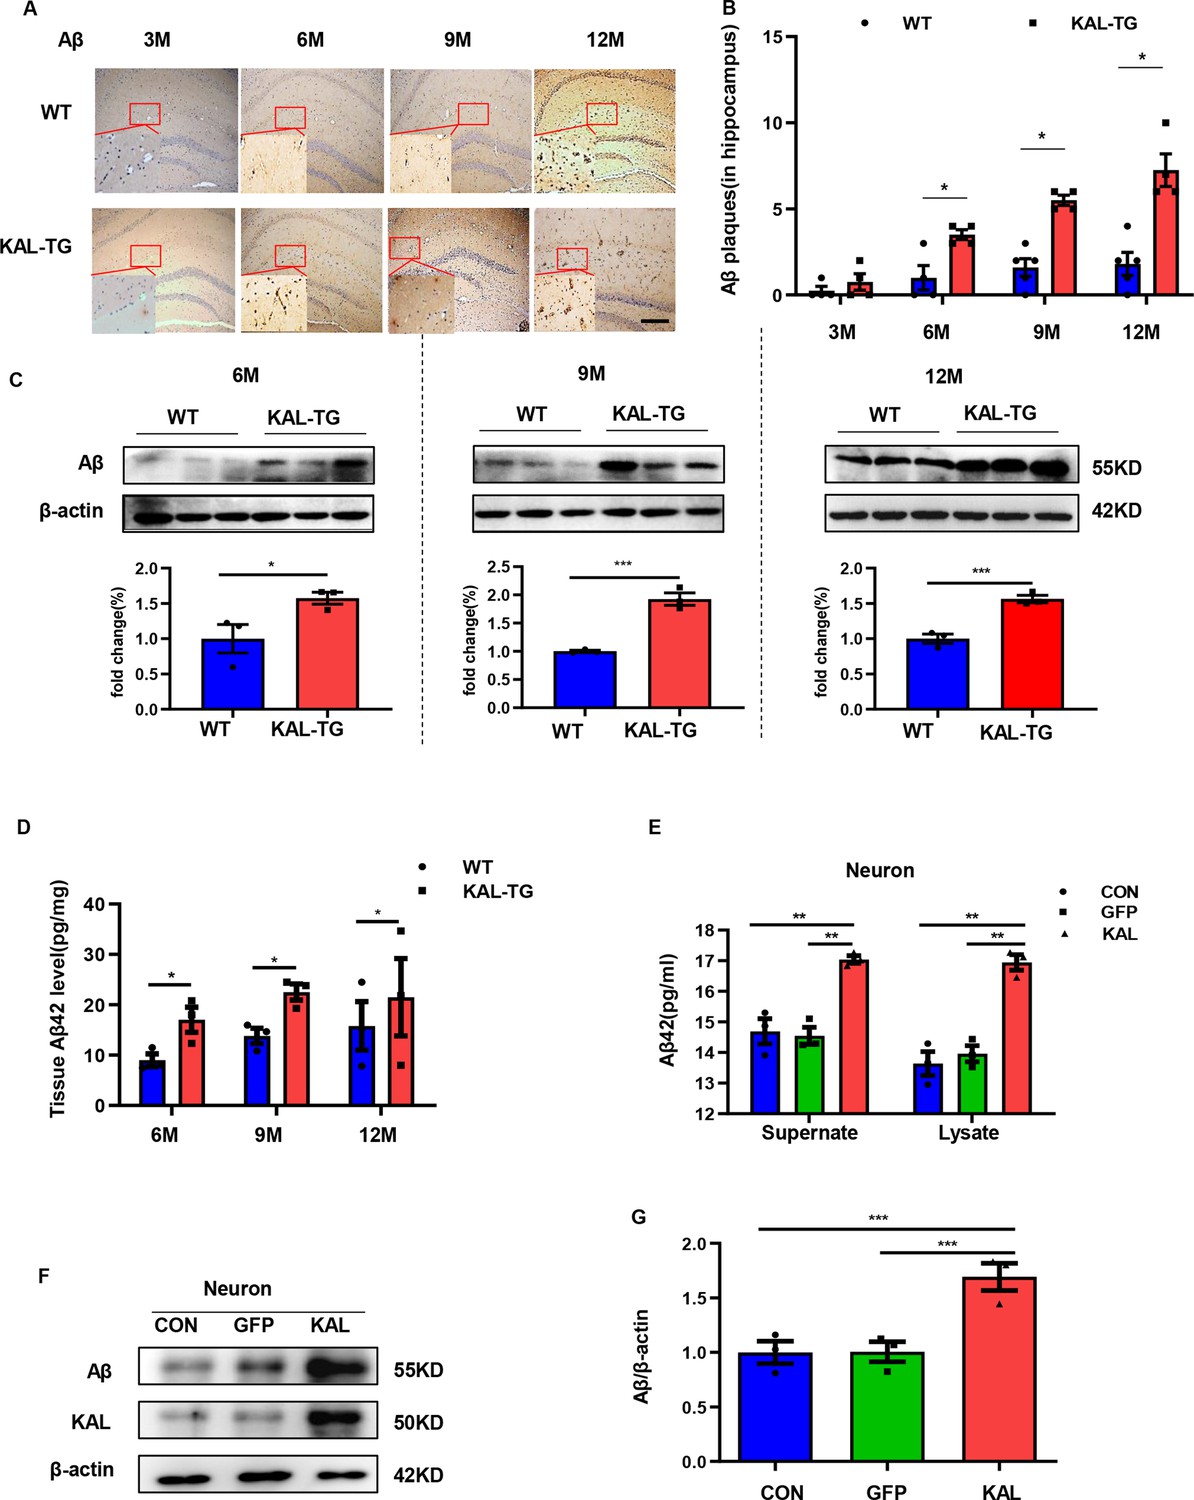
Kallistatin promoted Aβ generation.
(A, B) Immunohistochemistry staining of Aβ (A) was carried out in KAL-TG and WT mice hippocampal tissue. Scale bar, 100 μm. The statistical analysis of Aβ plaques (B) in hippocampal tissue of KAL-TG and WT mice, n = 4–5 per group. (C) Protein levels of Aβ were tested by western blot analysis in hippocampal tissue, n = 3 per group, then statistically analyzed the above results. (D) Hippocampal tissue Aβ42 contents were performed by ELISA in KAL-TG and WT groups, n = 3 per group. (E) Primary mouse neurons were isolated, then infected with adenovirus to overexpress Kallistatin for 72 hr. Aβ42 concentration of primary hippocampal neurons supernate and cell lysate was quantified by ELISA, n = 3 per group. (F, G) Western blot analysis of Aβ protein level in primary hippocampal neurons infected with overexpressing Kallistatin adenovirus and control groups, then statistical analysis of Aβ protein levels, n = 3 per group. Error bars represent the standard deviation (SD); *p < 0.05; **p < 0.01; ***p < 0.001; Student’s t-test.
-
Figure 2—source data 1
Kallistatin promoted Aβ generation.
Protein levels of Aβ were tested by western blot analysis in hippocampal tissue, n = 3 per group.
- https://cdn.elifesciences.org/articles/99462/elife-99462-fig2-data1-v1.zip
-
Figure 2—source data 2
Kallistatin promoted Aβ generation.
Western blot analysis of Aβ protein level in primary hippocampal neurons infected with overexpressing Kallistatin adenovirus and control groups, n = 3 per group.
- https://cdn.elifesciences.org/articles/99462/elife-99462-fig2-data2-v1.zip
Figure 2—figure supplement 1

Kallistatin promoted Aβ generation in HT22 cells.
(A) Primary hippocampal neurons were identified with MAP2. Scale bar, 500 μm. (B) HT22 cells were infected with adenovirus to overexpress Kallistatin for 48 hr. Aβ42 concentration of supernate and cell lysate was quantified by ELISA. (C, D) Western blot analysis of Aβ protein level in HT22 cells infected with overexpressing Kallistatin adenovirus and control groups for 48 hr, then statistical analysis of Kallistatin protein levels. Error bars represent the standard deviation (SD); *p < 0.05; **p < 0.01.
-
Figure 2—figure supplement 1—source data 1
Kallistatin promoted Aβ generation in HT22 cells.
Western blot analysis of Aβ protein level in HT22 cells infected with overexpressing Kallistatin adenovirus and control groups for 48 hr.
- https://cdn.elifesciences.org/articles/99462/elife-99462-fig2-figsupp1-data1-v1.zip
-
Figure 2—figure supplement 1—source data 2
Kallistatin promoted Aβ generation in HT22 cells.
Western blot analysis of Aβ protein level in HT22 cells infected with overexpressing Kallistatin adenovirus and control groups for 48 hr.
- https://cdn.elifesciences.org/articles/99462/elife-99462-fig2-figsupp1-data2-v1.zip
Figure 3
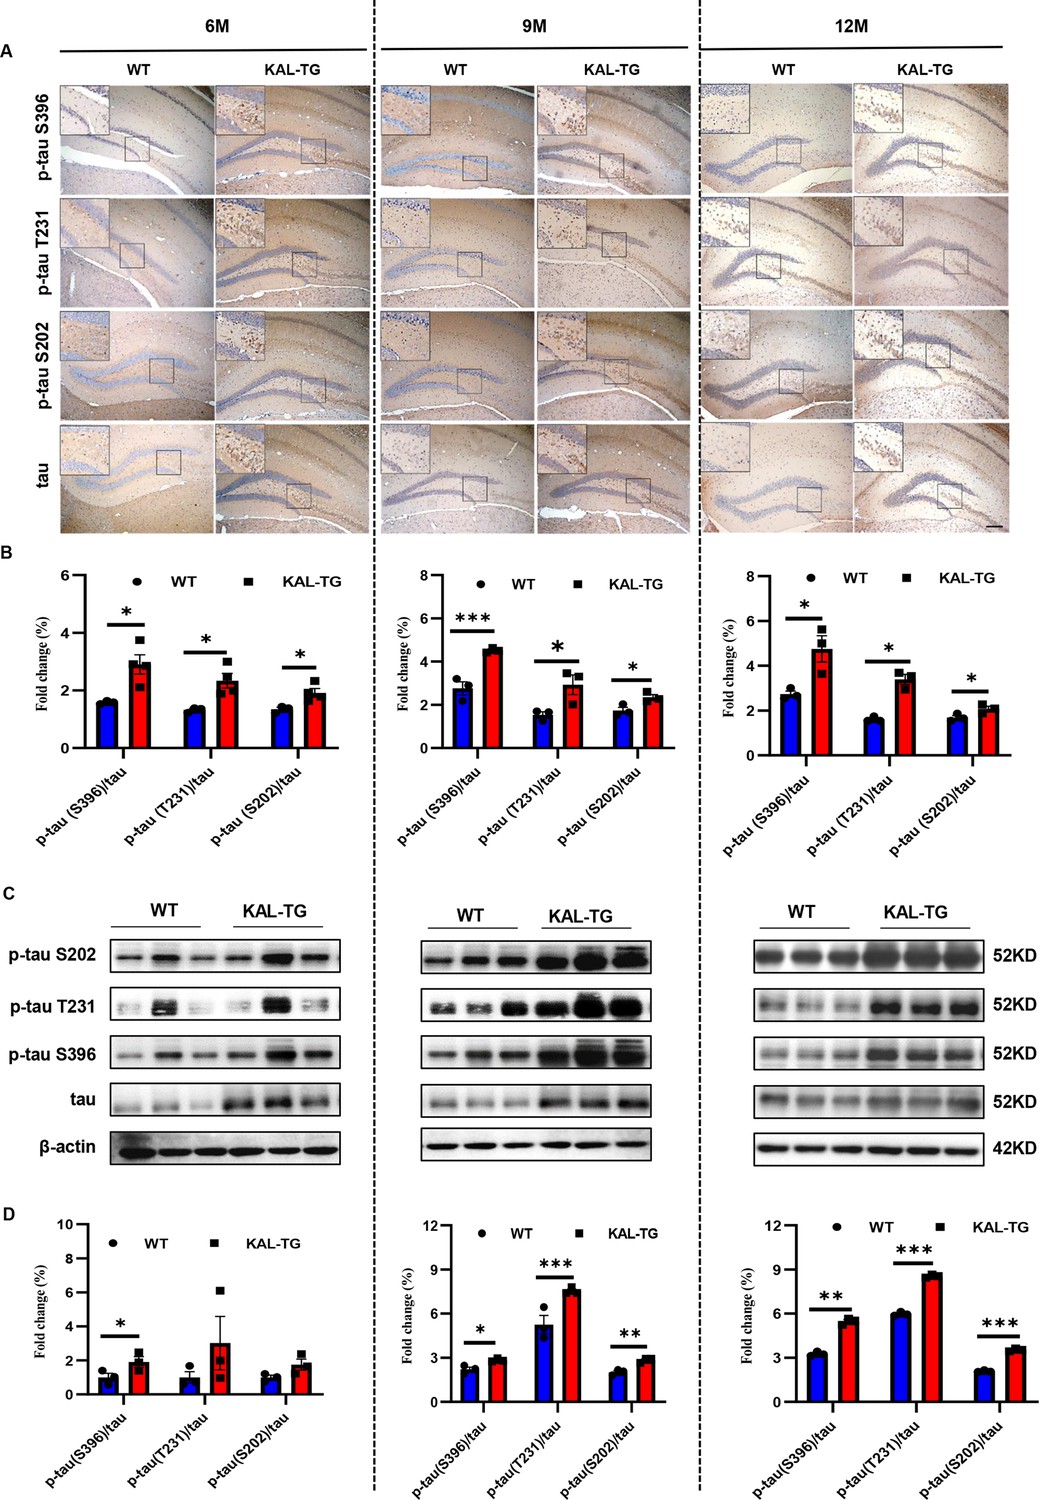
Kallistatin promoted tau phosphorylation.
(A, B) Immunohistochemistry staining of phosphorylated tau (p-tau S396, p-tau T231, and p-tau S202) and tau (A) was carried out in KAL-TG and WT mice hippocampal tissue. Scale bar, 100 μm. The statistical analysis of phosphorylated tau (B) in hippocampal tissue of KAL-TG and WT mice, n = 3 per group. (C, D) Protein levels of phosphorylated tau (p-tau S396, p-tau T231, and p-tau S202) and tau were tested by western blot analysis in hippocampal tissue, then statistically analyzed the above results. Error bars represent the standard deviation (SD); *p < 0.05; **p < 0.01; ***p < 0.001; Student’s t-test.
-
Figure 3—source data 1
Kallistatin promoted tau phosphorylation.
Protein levels of phosphorylated tau (p-tau S396, p-tau T231, and p-tau S202) and tau were tested by western blot analysis in hippocampal tissue.
- https://cdn.elifesciences.org/articles/99462/elife-99462-fig3-data1-v1.zip
-
Figure 3—source data 2
Kallistatin promoted tau phosphorylation.
Protein levels of phosphorylated tau (p-tau S396, p-tau T231, and p-tau S202) and tau were tested by western blot analysis in hippocampal tissue.
- https://cdn.elifesciences.org/articles/99462/elife-99462-fig3-data2-v1.zip
Figure 4 with 1 supplement
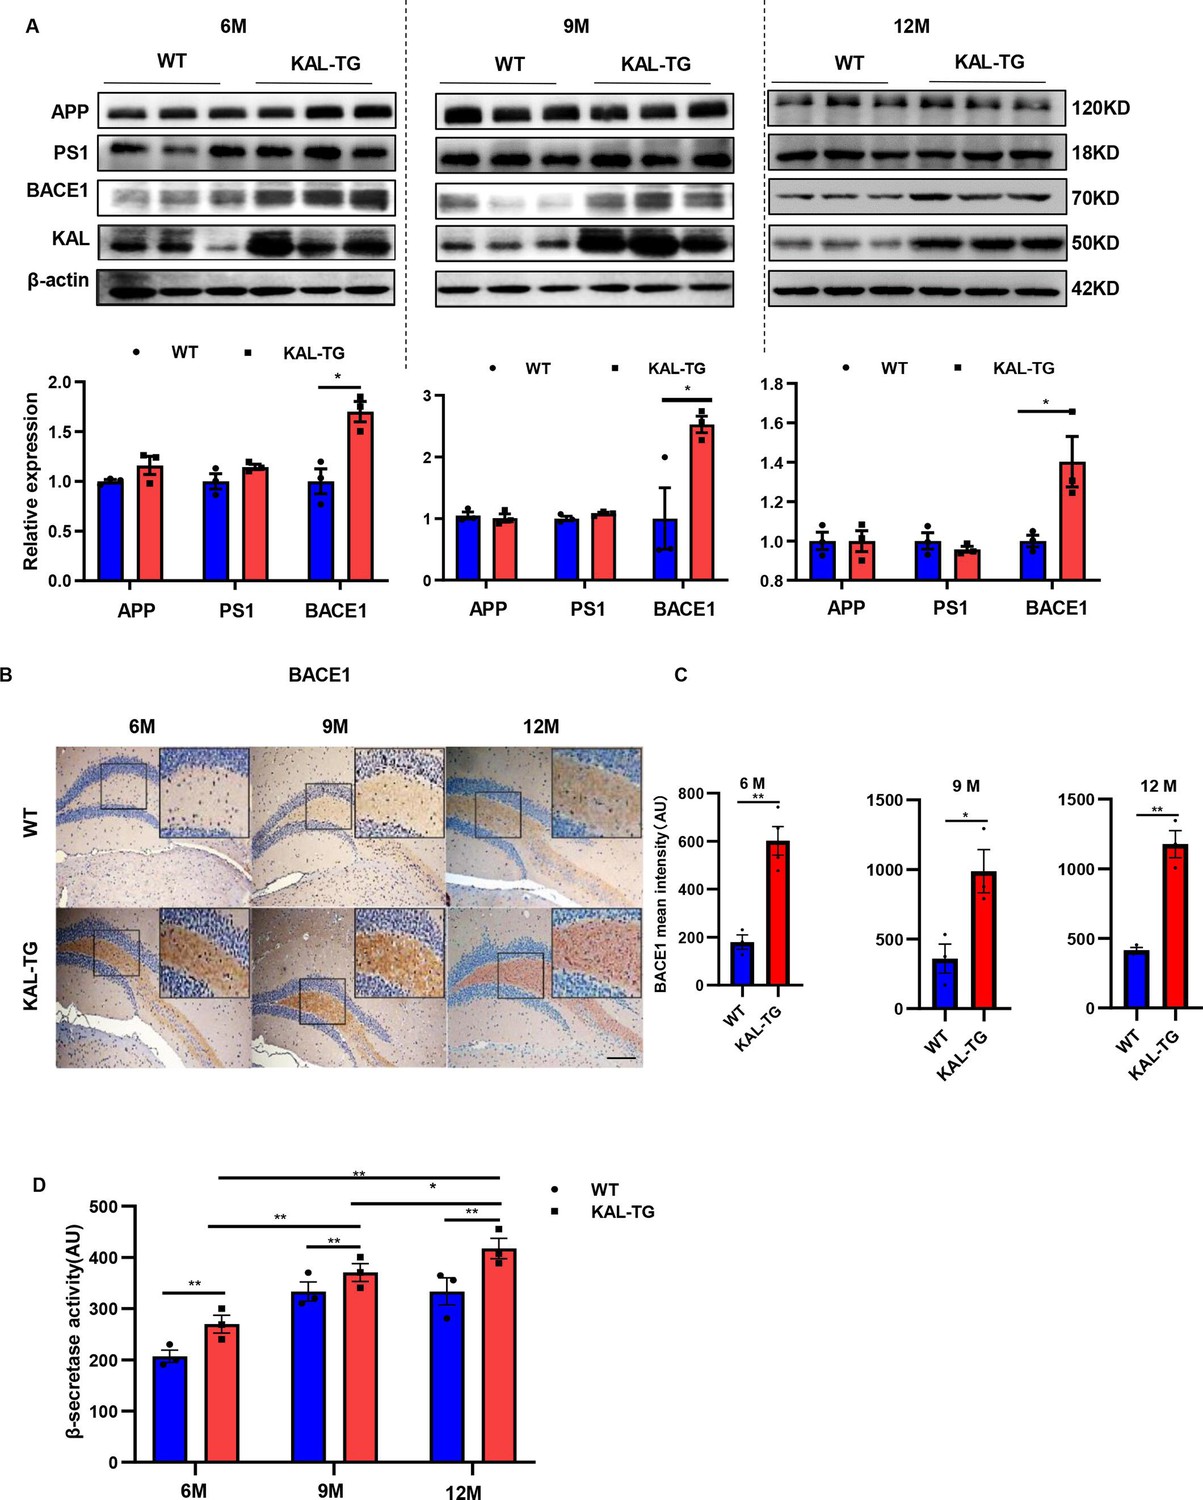
Kallistatin-transgenic mice exhibited increased BACE1 expression and activity in the hippocampus.
(A) Western blot analysis of relevant proteins, such as APP, PS1, and BACE1 during Aβ generation in hippocampal tissue of each time point (6, 9, and 12 M) KAL-TG mice and corresponding WT control groups, n = 3 per group, then statistical analysis of APP, PS1, and BACE1 protein levels. (B) Immunohistochemistry staining of BACE1 was carried out in KAL-TG and WT mice hippocampal tissue at each time point (6, 9, and 12 M). n = 3–5 per group. Scale bar, 100 μm. (C) Statistical analysis of BACE1 immunohistochemistry staining, n = 3–4 per group. (D) ELISA measured the β-secretase activity of each group’s hippocampal tissue, n = 3 per group. Error bars represent the standard deviation (SD); *p < 0.05; **p < 0.01; Student’s t-test.
-
Figure 4—source data 1
Kallistatin-transgenic mice exhibited increased BACE1 expression.
Western blot analysis of relevant proteins, such as APP, PS1, and BACE1 during Aβ generation in hippocampal tissue of each time point (6, 9, and 12 M) KAL-TG mice and corresponding WT control groups, n = 3 per group.
- https://cdn.elifesciences.org/articles/99462/elife-99462-fig4-data1-v1.zip
-
Figure 4—source data 2
Kallistatin-transgenic mice exhibited increased BACE1 expression.
Western blot analysis of relevant proteins, such as APP, PS1, and BACE1 during Aβ generation in hippocampal tissue of each time point (6, 9, and 12 M) KAL-TG mice and corresponding WT control groups, n = 3 per group.
- https://cdn.elifesciences.org/articles/99462/elife-99462-fig4-data2-v1.zip
Figure 4—figure supplement 1

Kallistatin promotes β-secretase rather than α- and γ-secretase.
(A) Bace1 mRNA expression in hippocampal tissue. (B) α-Secretases (Adam9, Adam10, and Adm17) mRNA expression in hippocampal tissue. (C) γ-Secretase activity of each group’s hippocampal tissue was measured by ELISA. Error bars represent the standard deviation (SD); *p < 0.05.
Figure 5 with 1 supplement
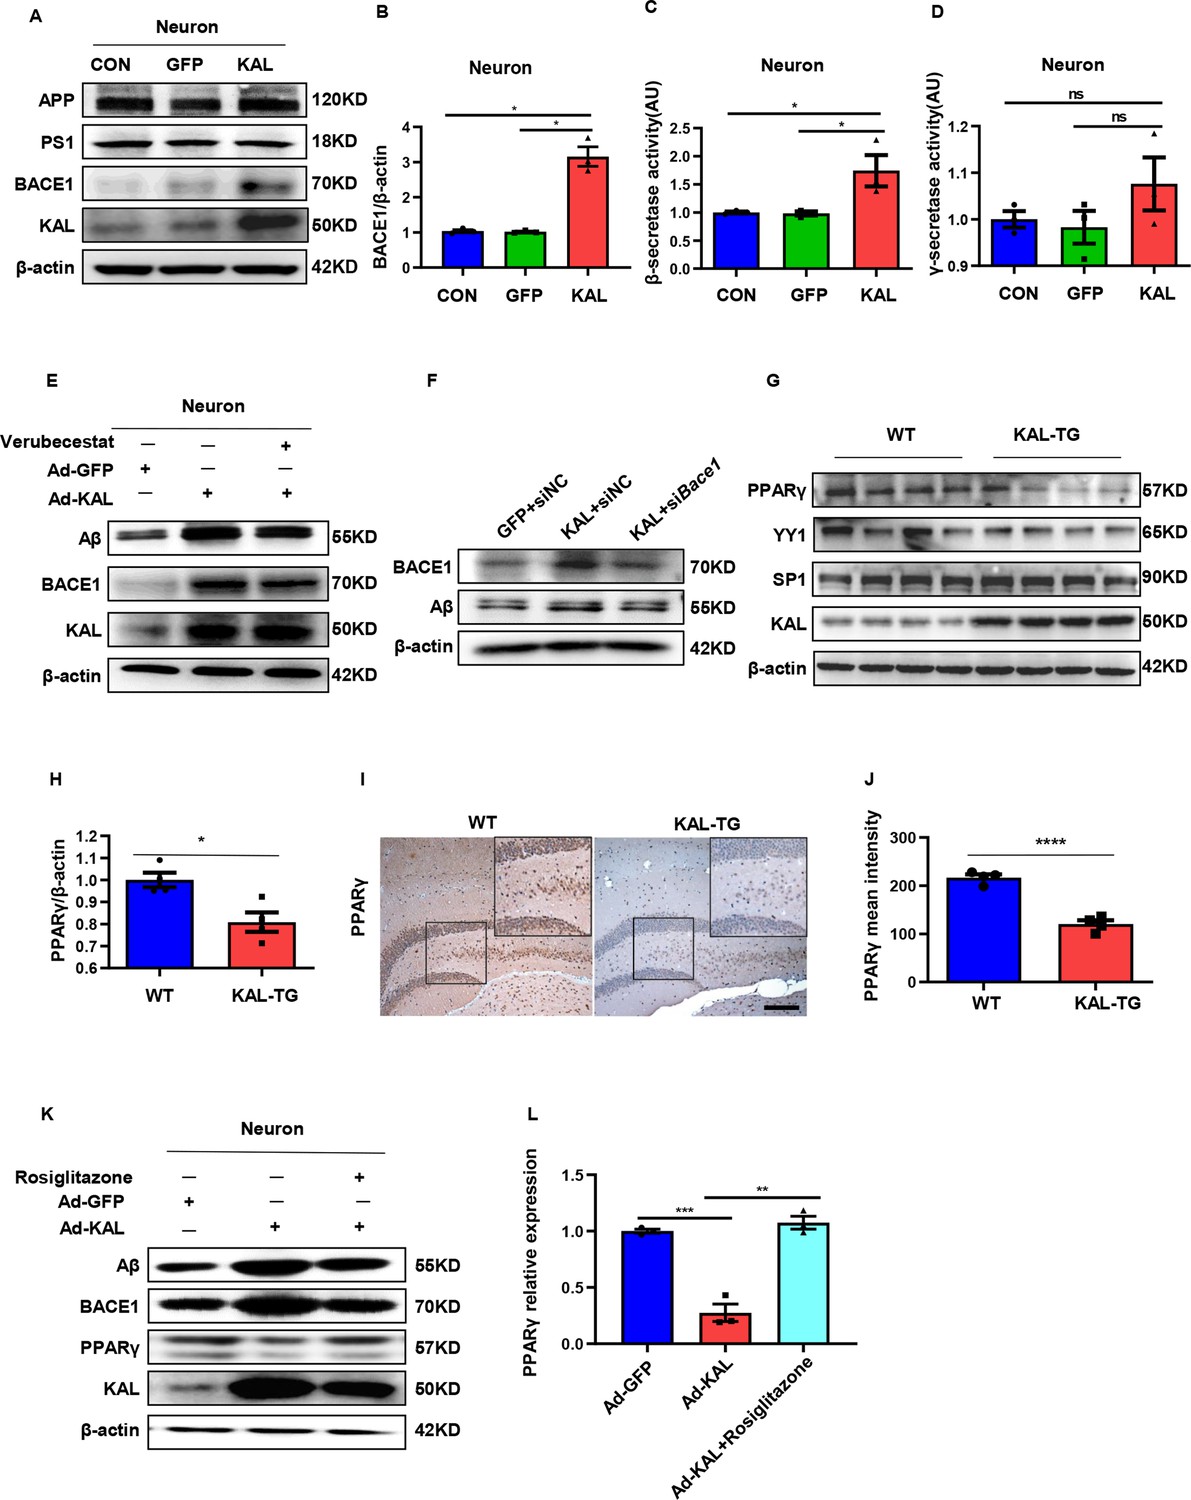
In vitro, Kallistatin promoted BACE1 expression to augment Aβ by suppressing PPARγ activation.
(A) The relevant protein levels in primary mouse neurons infected with overexpressing Kallistatin adenovirus during Aβ generation were determined by western blot analysis. (B) Statistical analysis of BACE1 expression in primary neurons. β-Secretase (C) and γ-secretase (D) activity of primary hippocampal neurons infected with overexpressing Kallistatin adenovirus and control adenovirus. was measured by ELISA. (E) Primary hippocampal neurons were treated with BACE1 inhibitor verubecestat (50 nM), then infected with adenovirus to overexpress Kallistatin. Western blot analysis of Aβ, BACE1, and Kallistatin protein levels; β-actin served as a loading control. (F) HT22 cells were infected with BACE1 siRNA, then infected with adenovirus to overexpress Kallistatin. Western blot analysis of Aβ and BACE1 protein levels, β-actin served as a loading control. (G) The relevant proteins involved in BACE1 transcriptional expressions, such as PPARγ, YY1, and SP1, were measured by western blot analysis in hippocampal tissue. β-Actin served as a loading control. (H) Statistical analysis of PPARγ in hippocampal tissue of each group. (I) The representative diagrams of PPARγ expression in hippocampal tissue were presented in the above graphs. Scale bar, 100 μm. (J) Statistical analysis of PPARγ immunohistochemistry staining in hippocampal tissue of each group, n = 3–4 per group. (K) Primary hippocampal neurons were treated with PPARγ agonist rosiglitazone (10 nM) for 12 hr, then infected with adenovirus to overexpress Kallistatin for 72 hr. Western blot analysis of Aβ and BACE1 protein levels. β-Actin served as a loading control. (L) Statistical analysis of PPARγ protein levels in each group. Error bars represent the standard deviation (SD); *p < 0.05; **p < 0.01; ***p < 0.001; ****p < 0.0001; ns means no significant difference; Student’s t-test.
-
Figure 5—source data 1
Original membranes corresponding to Figure 5A, E–G, K.
Hippocampal tissues and primary hippocampal neurons were run on the same membrane. A: lanes 1: primary hippocampal neurons control; lanes 2: primary hippocampal neurons infected with GFP adenovirus; lanes 3: primary hippocampal neurons infected with overexpressing Kallistatin adenovirus. E, F, G: lanes 1: primary hippocampal neurons infected with GFP adenovirus; lanes 2: primary hippocampal neurons infected with overexpressing Kallistatin adenovirus; lanes 3: primary hippocampal neurons infected with overexpressing Kallistatin adenovirus and treated with Verubecestat/siHESl/RSG; K: lanes 1-4: hippocampus from WT mice; lanes 5-8: hippocampusfom KAL-TG mice.
- https://cdn.elifesciences.org/articles/99462/elife-99462-fig5-data1-v1.zip
-
Figure 5—source data 2
Original membranes corresponding to Figure 5A, E–G, K.
Hippocampal tissues and primary hippocampal neurons were run on the same membrane. A: lanes 1: primary hippocampal neurons control; lanes 2: primary hippocampal neurons infected with GFP adenovirus; lanes 3: primary hippocampal neurons infected with overexpressing Kallistatin adenovirus. E, F, G: lanes 1: primary hippocampal neurons infected with GFP adenovirus; lanes 2: primary hippocampal neurons infected with overexpressing Kallistatin adenovirus; lanes 3: primary hippocampal neurons infected with overexpressing Kallistatin adenovirus and treated with Verubecestat/siHESl/RSG; K: lanes 1-4: hippocampus from WT mice; lanes 5-8: hippocampusfom KAL-TG mice.
- https://cdn.elifesciences.org/articles/99462/elife-99462-fig5-data2-v1.zip
Figure 5—figure supplement 1

Kallistatin increased BACE1 expression in HT22 cells.
(A) The relevant protein levels in HT22 cells infected with overexpressing Kallistatin adenovirus during Aβ generation were determined by western blot analysis. (B) Statistical analysis of BACE1 expression in HT22 cells. (C) β-Secretase activity of HT22 cells infected with overexpressing Kallistatin adenovirus and control adenovirus was measured by ELISA. (D) Primary hippocampal neurons were infected with Bace1 siRNA for 72 hr. Western blot analysis of BACE1 protein levels. (E) HT22 cells were treated with PPARγ agonist rosiglitazone (10 nM) for 12 hr, then infected with adenovirus to overexpress Kallistatin for 48 hr. Western blot analysis of Aβ and BACE1 protein levels. β-Actin served as a loading control. Error bars represent the standard deviation (SD); **p < 0.01.
-
Figure 5—figure supplement 1—source data 1
Original membranes corresponding to Figure 5—figure supplement 1A, D, E.
HT22 cells and primary hippocampal neurons were run on the same membrane. A: lanes 1: HT22 cells control; lanes 2: HT22 infected with GFP adenovirus; lanes 3: 1T22 cells imfected with overexpressimg Kalistatin adenovirus; D: lanes 1: HiT22 cells control; lanes 2: HT22 cells infected with siNC; lanes 3-5: HT22 cells infected with BACE1 siRNA 1-3; E: lanes 1: HT22 infected with GFP adenovirus; lanes 2: HT22 cells infected with overexpressing Kalistatin adenovirus; lanes 3: HT22 cels treaded with rosiglitazone, then infected with overexpressing Kallistatin adenovirus.
- https://cdn.elifesciences.org/articles/99462/elife-99462-fig5-figsupp1-data1-v1.zip
-
Figure 5—figure supplement 1—source data 2
Original membranes corresponding to Figure 5—figure supplement 1A, D, E.
HT22 cells and primary hippocampal neurons were run on the same membrane. A: lanes 1: HT22 cells control; lanes 2: HT22 infected with GFP adenovirus; lanes 3: 1T22 cells imfected with overexpressimg Kalistatin adenovirus; D: lanes 1: HiT22 cells control; lanes 2: HT22 cells infected with siNC; lanes 3-5: HT22 cells infected with BACE1 siRNA 1-3; E: lanes 1: HT22 infected with GFP adenovirus; lanes 2: HT22 cells infected with overexpressing Kalistatin adenovirus; lanes 3: HT22 cels treaded with rosiglitazone, then infected with overexpressing Kallistatin adenovirus.
- https://cdn.elifesciences.org/articles/99462/elife-99462-fig5-figsupp1-data2-v1.zip
Figure 6 with 1 supplement
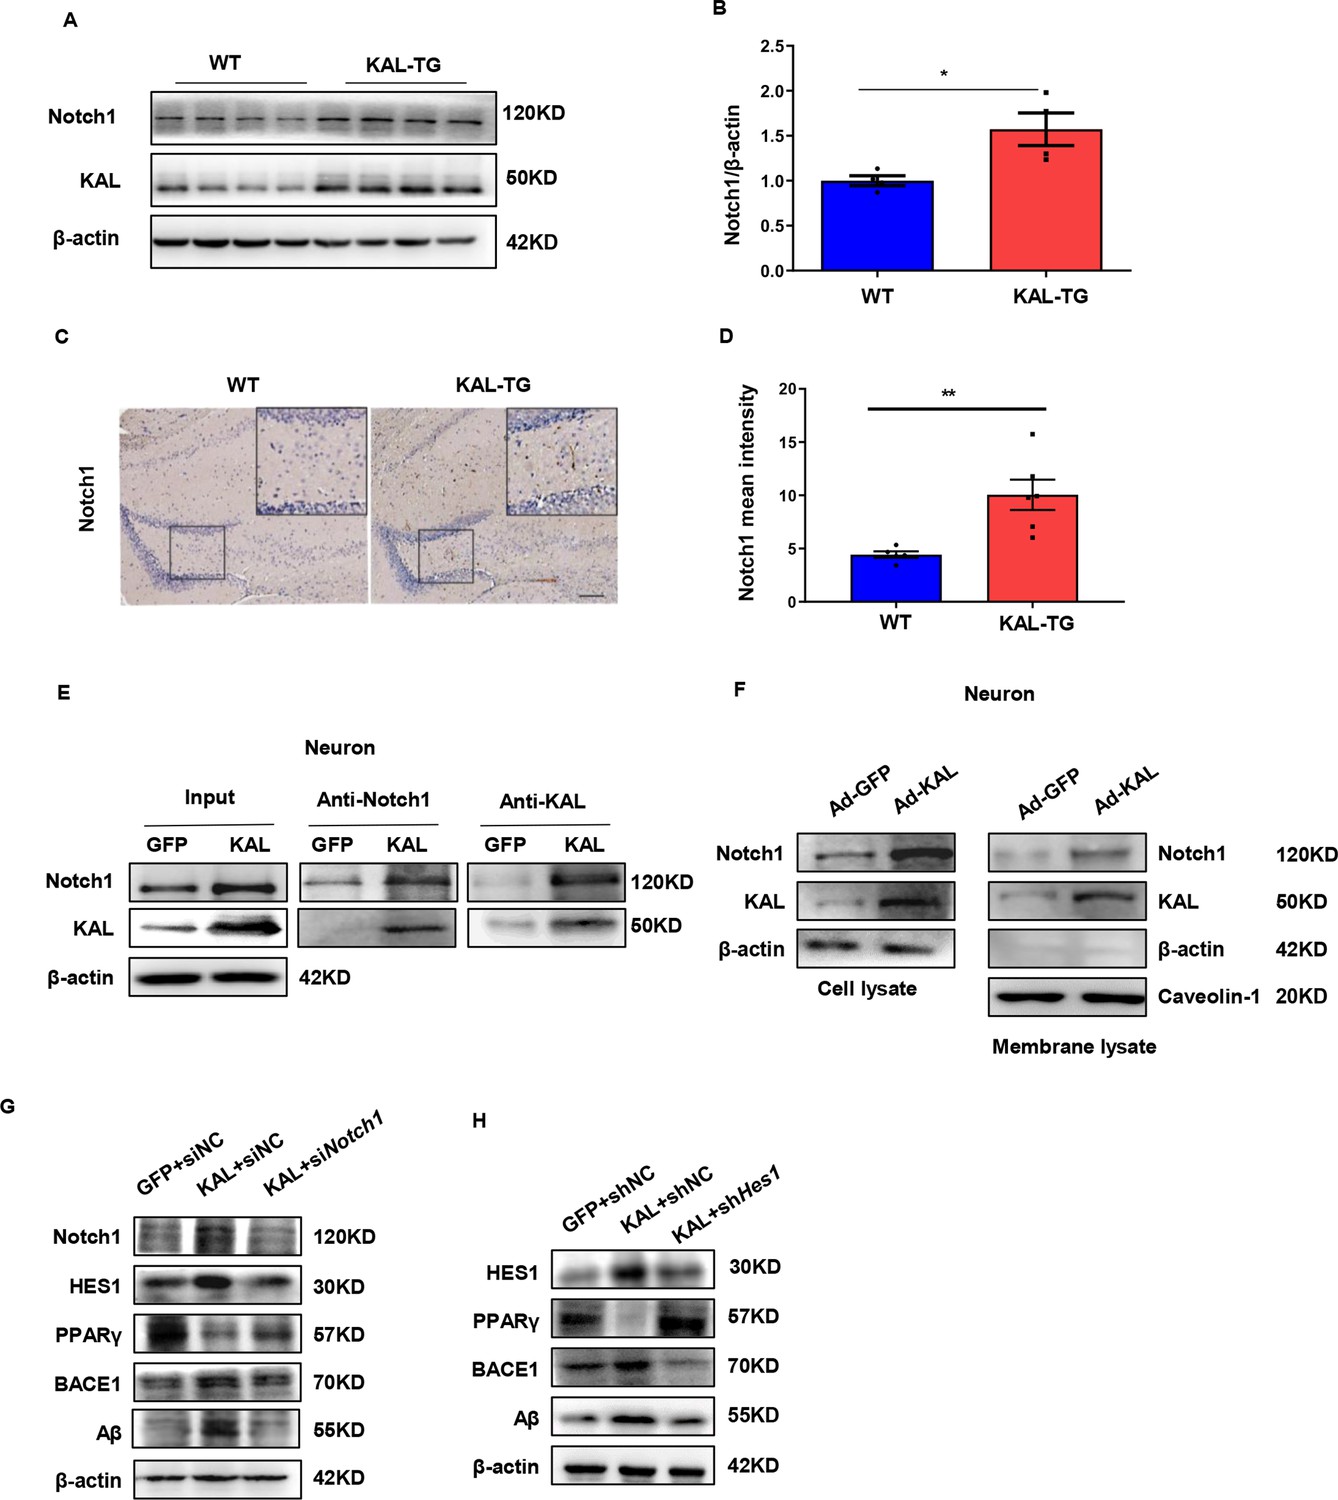
Kallistatin directly bonded to the Notch1 receptor, which activated the Notch1 pathway to promote Aβ production.
(A) Notch1 expression was measured by western blot analysis in hippocampal tissue. β-Actin served as a loading control. (B) Statistical analysis of Notch1 in hippocampal tissue of each group. (C) The representative diagrams of Nocth1 expression in hippocampal tissue were presented in the above graphs. Scale bar, 100 μm. (D) Statistical analysis of Notch1 immunohistochemistry staining in hippocampal tissue of each group. Primary hippocampal neurons were infected with overexpressing Kallistatin adenovirus for 72 hr, then Co-IP analysis (E) and membrane extraction experiment (F) was performed to verify whether Kallistatin can bind to the Notch1 receptor. β-Actin served as a loading control. (G, H) HT22 cells were treated with siRNA (Notch1) and shRNA (HES1) to knock down Notch1 and HES1 for 12 hr, then infected with adenovirus to overexpress Kallistatin for 24 hr. Western blot analysis was used to detect the Notch1 signaling pathway. Error bars represent the standard deviation (SD); *p < 0.05, **p < 0.01; Student’s t-test.
-
Figure 6—source data 1
Original membranes corresponding to Figure 6A, E–H.
Hippocampal tissues and primary hippocampal neurons were run on the same membrane. A: lanes 1-4: hippocampus from WT mice; lanes 5-8: hippocampus from KAL-TG mice; E–H: lanes 1: primary hippocampal neurons infected with GFP adenovirnus, lanes 2: primary hippocampal neurons infected with overexpressing Kallistatin adenovirus; lane 3: primary hippocampal neurons infected with overexpressing Kallistatin adenovirus and siHES1.
- https://cdn.elifesciences.org/articles/99462/elife-99462-fig6-data1-v1.zip
-
Figure 6—source data 2
Original membranes corresponding to Figure 6A, E–H.
Hippocampal tissues and primary hippocampal neurons were run on the same membrane. A: lanes 1-4: hippocampus from WT mice; lanes 5-8: hippocampus from KAL-TG mice; E–H: lanes 1: primary hippocampal neurons infected with GFP adenovirnus, lanes 2: primary hippocampal neurons infected with overexpressing Kallistatin adenovirus; lane 3: primary hippocampal neurons infected with overexpressing Kallistatin adenovirus and siHES1.
- https://cdn.elifesciences.org/articles/99462/elife-99462-fig6-data2-v1.zip
Figure 6—figure supplement 1

Validation of cell transfection efficiency.
(A, B) Western blot analysis of Notch1 protein level in primary hippocampal neurons and HT22 cells infected with overexpressing Kallistatin adenovirus and control groups. (C) HT22 cells were infected with overexpressing Kallistatin adenovirus for 48 hr, and Co-IP analysis was conducted to verify whether Kallistatin can bind to the Notch1 receptor. β-Actin served as a loading control. (D) Primary hippocampal neurons were treated with Kallistatin protein for 72 hr, then IP analysis. (E) Primary hippocampal neurons were infected with Notch1 siRNA for 72 hr. Western blot analysis of Notch1 protein levels. (F) HT22 cells were infected with Hes1 shRNA for 48 hr. Western blot analysis of HES1 protein levels.
-
Figure 6—figure supplement 1—source data 1
Original membranes corresponding to Figure 6—figure supplement 1A–F.
Primary hippocampal neurons and HT22 cells were run on thesame membrane. Lanes 1: Primary hippocampal neurons or HT22 cells control; lanes 2: primary hippocampal neurons or HT22 infected with GFP adenovirus, lanes 3: primary hippocampal neurons or HT22 cells infected with overexpressing Kallistatin adenovirus, E, F: lanes 1: primary hippocampal neurons or HT22 cells control: lanes 2: primary hippocampal neurons or HT22 cells infected with siNC: lanes 3-5: primary hippocampal neurons or HT22 cells infected with Notchl siRNA 1-3.
- https://cdn.elifesciences.org/articles/99462/elife-99462-fig6-figsupp1-data1-v1.zip
-
Figure 6—figure supplement 1—source data 2
Original membranes corresponding to Figure 6—figure supplement 1A–F.
Primary hippocampal neurons and HT22 cells were run on thesame membrane. Lanes 1: Primary hippocampal neurons or HT22 cells control; lanes 2: primary hippocampal neurons or HT22 infected with GFP adenovirus, lanes 3: primary hippocampal neurons or HT22 cells infected with overexpressing Kallistatin adenovirus, E, F: lanes 1: primary hippocampal neurons or HT22 cells control: lanes 2: primary hippocampal neurons or HT22 cells infected with siNC: lanes 3-5: primary hippocampal neurons or HT22 cells infected with Notchl siRNA 1-3.
- https://cdn.elifesciences.org/articles/99462/elife-99462-fig6-figsupp1-data2-v1.zip
Figure 7 with 1 supplement
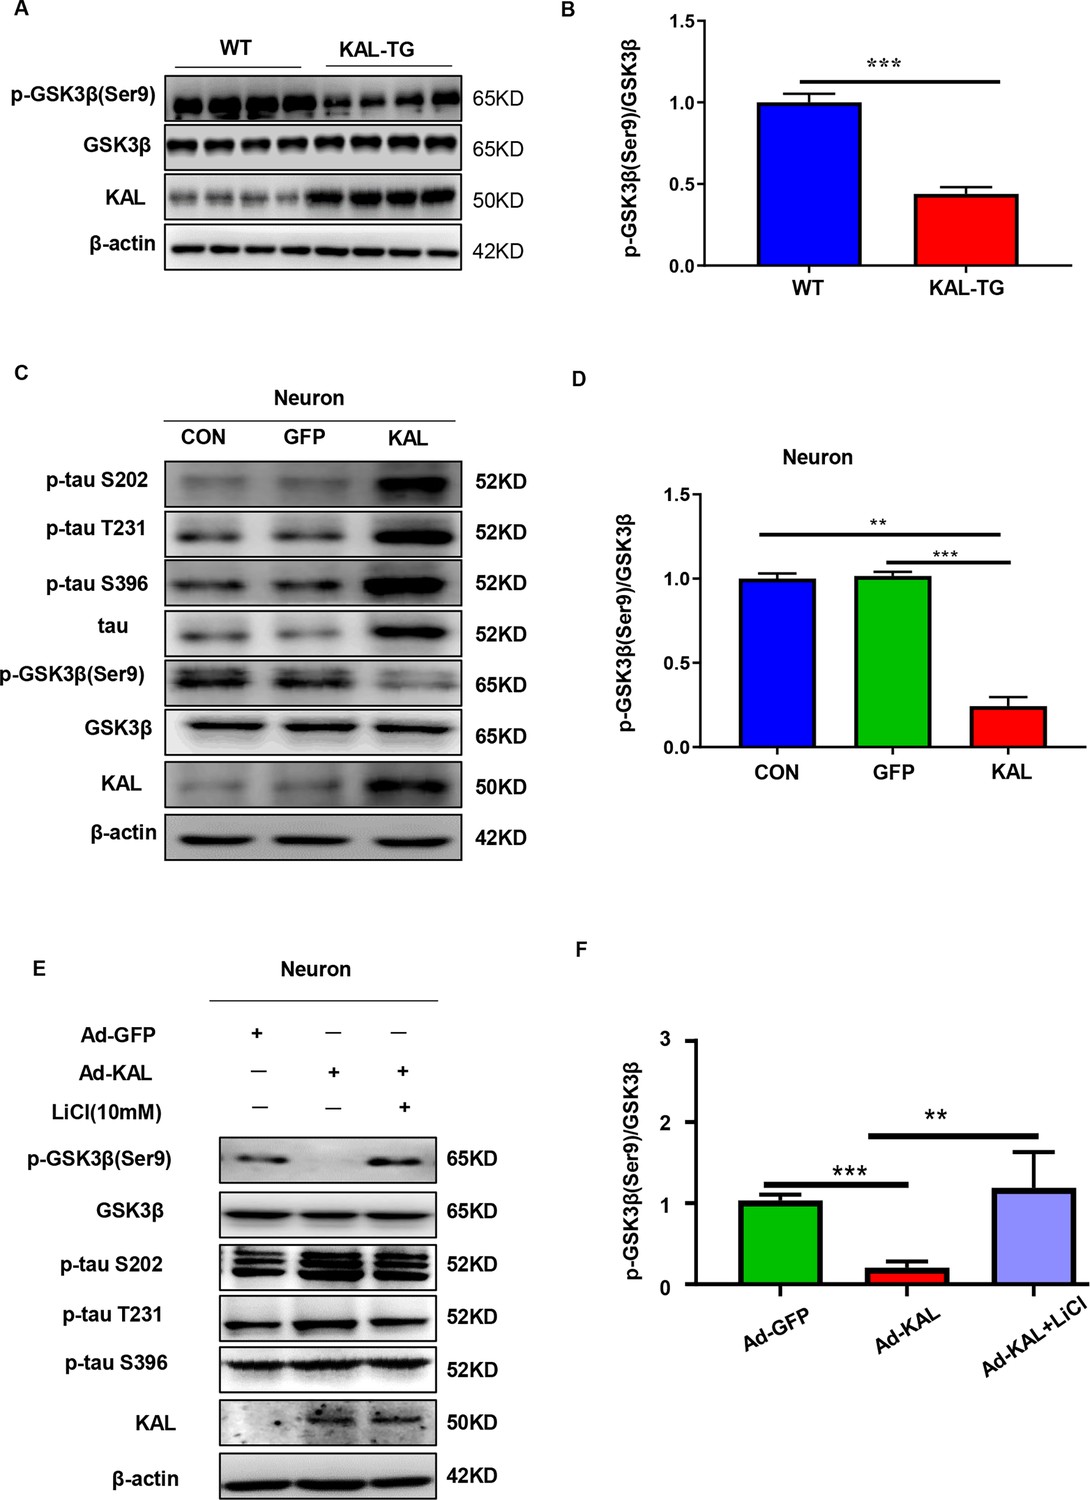
Kallistatin promoted phosphorylation of tau by suppressing the Wnt signaling pathway.
(A, B) GSK-3β and p-GSK-3β expression was measured by western blot analysis in hippocampal tissue, then statistically analyzed the above results. (C, D) Primary hippocampal neurons were treated with overexpressing Kallistatin adenovirus for 72 hr, then western blot analysis was used to detect the content of GSK-3β, p-GSK-3β, tau, and p-tau (Ser9, T231, and S396), and statistically analyzed the above results. (E, F) Primary hippocampal neurons were treated with overexpressing Kallistatin adenovirus for 48 hr, then treated with LiCl (10 mM) for 24 hr. Western blot analysis was used to detect the content of GSK-3β, p-GSK-3β, and p-tau (Ser9, T231, and S396), and statistical analysis of the above results. Error bars represent the standard deviation (SD), **p < 0.01; ***p < 0.001; Student’s t-test.
-
Figure 7—source data 1
Original membranes corresponding to Figure 7A, C, E.
Hippocampal tissues and primary hippocampal neurons were run on the same membrane. A: lanes 1-4: hippocampus from WT mice, lanes 5-8: hippocampus from KAL-TG mice; C, E: lanes 1: primary hippocampal neurons control; lanes 2: primary hippocampal neurons infected with GFP adenovirus; lanes 3: primary hippocampal neurons infected with overexpressing Kallistatin adenovirus, (E) then treated with LiCl (10 nM).
- https://cdn.elifesciences.org/articles/99462/elife-99462-fig7-data1-v1.zip
-
Figure 7—source data 2
Original membranes corresponding to Figure 7A, C, E.
Hippocampal tissues and primary hippocampal neurons were run on the same membrane. A: lanes 1-4: hippocampus from WT mice, lanes 5-8: hippocampus from KAL-TG mice; C, E: lanes 1: primary hippocampal neurons control; lanes 2: primary hippocampal neurons infected with GFP adenovirus; lanes 3: primary hippocampal neurons infected with overexpressing Kallistatin adenovirus, (E) then treated with LiCl (10 nM).
- https://cdn.elifesciences.org/articles/99462/elife-99462-fig7-data2-v1.zip
Figure 7—figure supplement 1

Kallistatin promotes the phosphorylation of tau by activating the Wnt signaling pathway.
(A) Western blot analysis of GSK-3β, p-GSK-3β, tau, and p-tau (Ser9, T231, and S396) in HT22 cells infected with overexpressing Kallistatin adenovirus and control groups. (B) Western blot analysis of GSK-3β, p-GSK-3β, and p-tau (Ser9, T231, and S396) in HT22 cells infected with overexpressing Kallistatin adenovirus and control groups for 24 hr, then treated with LiCl (10 mM) for 24 hr. (C) Simplified model depicting the pathway of Aβ regulated by Kallistatin.
-
Figure 7—figure supplement 1—source data 1
Kallistatin promotes the phosphorylation of tau by activating the Wnt signaling pathway.
Western blot analysis of GSK-3β, p-GSK-3β, tau, and p-tau (Ser9, T231, and S396) in HT22 cells infected with overexpressing Kallistatin adenovirus and control groups.
- https://cdn.elifesciences.org/articles/99462/elife-99462-fig7-figsupp1-data1-v1.zip
-
Figure 7—figure supplement 1—source data 2
Kallistatin promotes the phosphorylation of tau by activating the Wnt signaling pathway.
Western blot analysis of GSK-3β, p-GSK-3β, and p-tau (Ser9, T231, and S396) in HT22 cells infected with overexpressing Kallistatin adenovirus and control groups for 24 hr, then treated with LiCl (10 mM) for 24 hr.
- https://cdn.elifesciences.org/articles/99462/elife-99462-fig7-figsupp1-data2-v1.zip
Figure 8
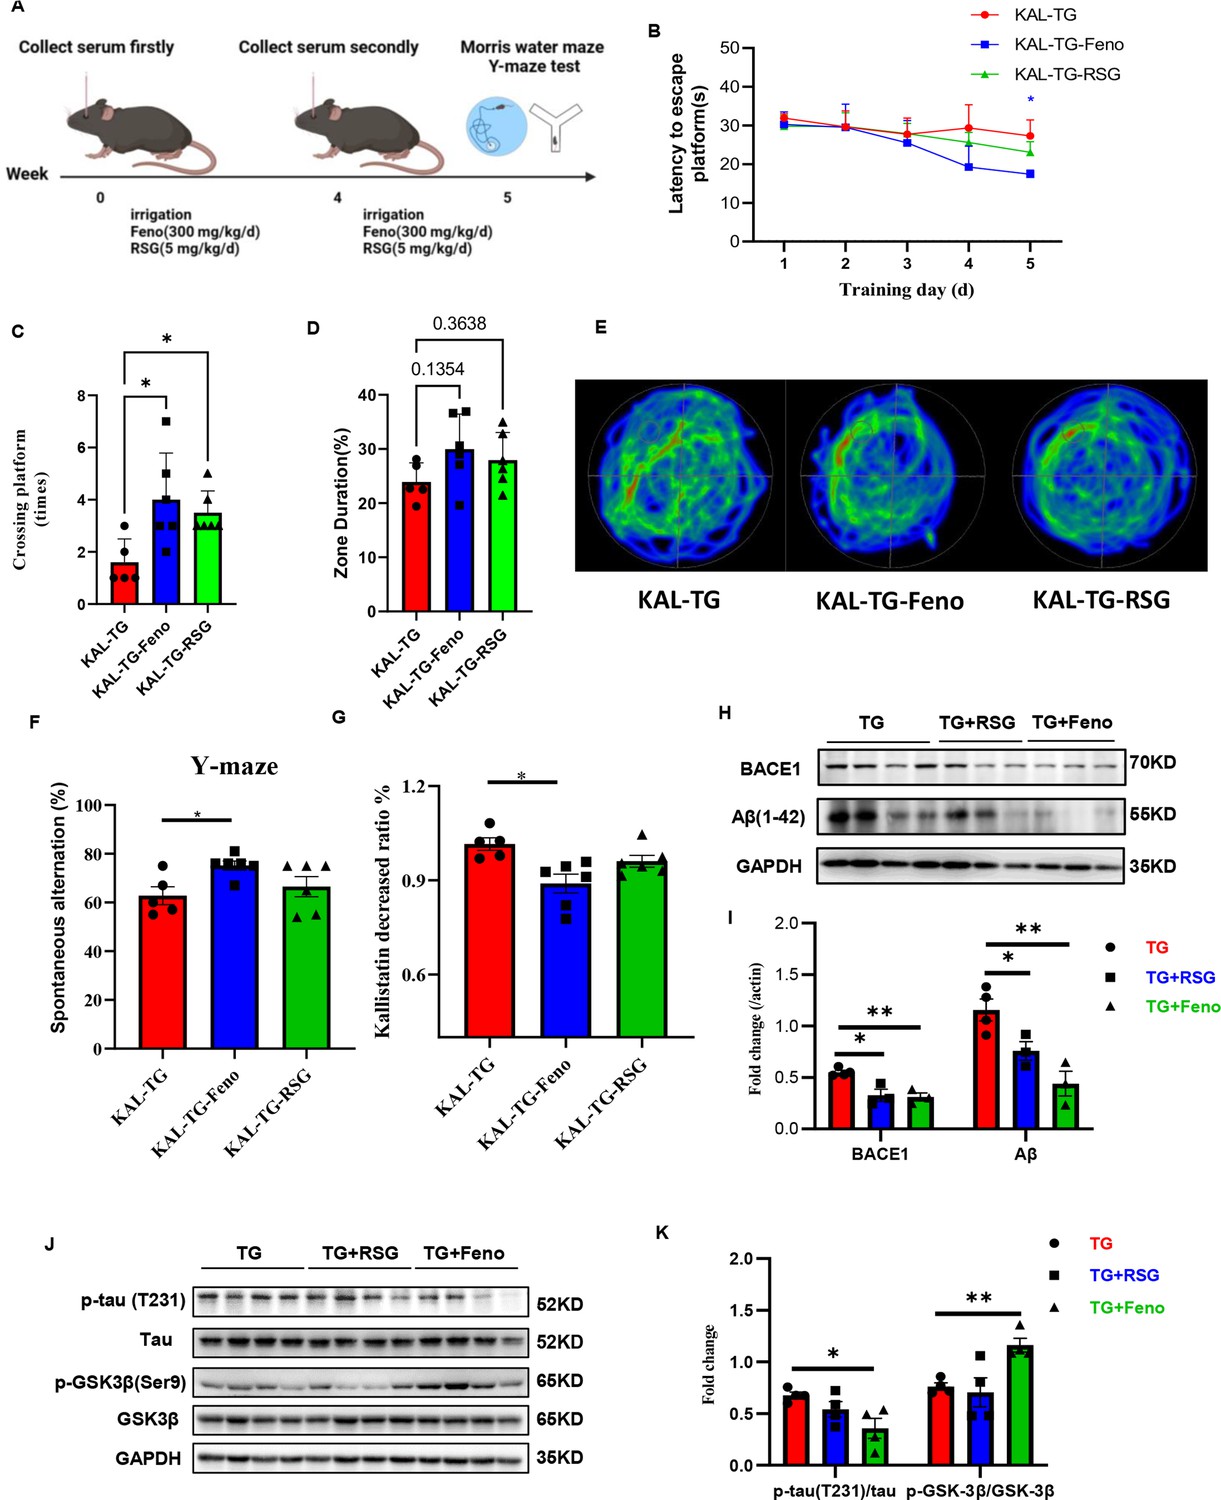
Fenofibrate could alleviate memory and cognitive impairment of KAL-TG mice.
(A) Illustration of experimental protocols. Fenofibrate (0.3 g/kg/day × 5 weeks, i.g.) or rosiglitazone (5 mg/kg/day × 5 weeks, i.g.) was given to KAL-TG mice. The serum for Kallistatin measuring was collected at weeks 0 and 4. And the Morris water maze and Y-maze test were performed at week 5. (B–E) Behavioral performance was assessed through the Morris water maze test and the Y-maze test. (B) The escape latency time was presented during 1–5 days. (C–E) Cognitive functions were evaluated by spatial probe test at day 6, then analyzing each group of mice crossing platform times (C), time percent in the targeted area (D), and the path traces heatmap (E), n = 5–6 per group. (F) Spontaneous alternation of Y-maze test. (G) Kallistatin decreased ratio was calculated by dividing the serum Kallistatin concentration of KAL-TG mice before fenofibrate/rosiglitazone treatment by the serum Kallistatin concentration of KAL-TG mice after a month of treatment, and serum Kallistatin concentration was measured by ELISA. (H–I) Protein levels of Aβ and BACE1 were tested by western blot analysis in hippocampal tissue, then statistically analyzing the above results. (J–K) Protein levels of p-tau (231), tau, p-GSK-3β (Ser9), and GSK-3β were tested by western blot analysis in hippocampal tissue, then statistically analyzing the above results. Error bars represent the standard deviation (SD); *p < 0.05, **p < 0.01; Student’s t-test.
-
Figure 8—source data 1
Fenofibrate reduced hippocampal BACE1 and Aβ levels in KAL-TG mice.
Protein levels of Aβ and BACE1 were tested by western blot analysis in hippocampal tissue.
- https://cdn.elifesciences.org/articles/99462/elife-99462-fig8-data1-v1.zip
-
Figure 8—source data 2
Fenofibrate activated the Wnt signaling pathway and inhibited Tau phosphorylation in the hippocampus of KAL-TG mice.
Protein levels of p-tau (231), tau, p-GSK-3β (Ser9), and GSK-3β were tested by western blot analysis in hippocampal tissue.
- https://cdn.elifesciences.org/articles/99462/elife-99462-fig8-data2-v1.zip
Author response image 1

Protein levels of PPARα were tested by western blot analysis in hippocampal tissue, then statistically analyzed the above results.
Author response image 2
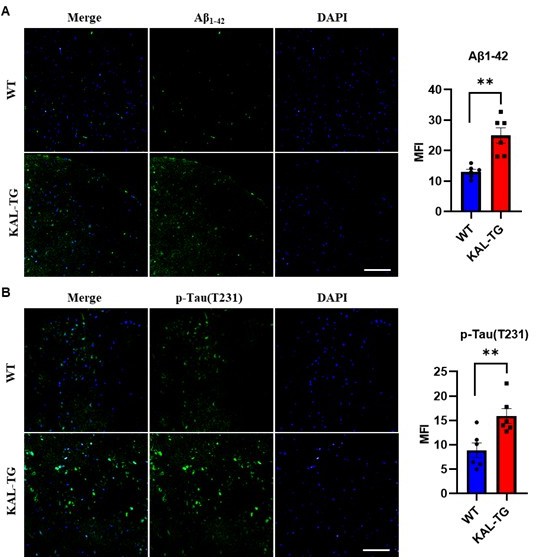
Immunofluorescence staining of Aβ and phosphorylated tau (p-tau T231) was carried out in the prefrontal cortex tissue of KAL-TG and WT mice.
Error bars represented the Standard Error of Mean (SEM); **p < 0.01. Scale bar, 100 μm.
Author response image 3

Protein levels of Kallistatin were tested by western blot analysis in the liver tissue, then statistically analyzed the above results.
Error bars represented the Standard Error of Mean (SEM); **p < 0.01.
Author response image 4

Kallistatin promoted Notch ligand Jagged1 expression to activate Notch1 signaling.
(A) QPCR analysis of Notch ligands (Dll1, Dll3, Jagged1, Jagged2) expression in the 9 months hippocampus tissue. (B) Western blotting analysis of Notch ligand Jagged1 expression in the hippocampus tissue. (C) Western blotting analysis of Notch ligand Jagged1 expression in the hippocampus primary neuron. β-actin served as the loading control. Error bars represented the Standard Error of Mean (SEM); *p < 0.05.
Author response image 5

Behavioral performance was assessed through the Morris water maze test.
(A) The escape latency time was presented during 1-5 days. (B-D) Cognitive functions were evaluated by spatial probe test on day 6, then analyzing each group of mice crossing platform times(B), time percent in the targeted area (C), and the path traces heatmap (D). Error bars represented the Standard Error of Mean (SEM); F represents Female, M represents Male, and TG refers to KAL-TG; *p < 0.05.
Additional files
-
Supplementary file 1
Clinical characteristics of Alzheimer’s disease (AD) patients and AD patients with DM.
N is an abbreviation for number; GLU is an abbreviation for glucose; TC is an abbreviation for total cholesterol; TG is an abbreviation for triglyceride; NA indicates not available; NS indicates no significance. **p < 0.01, ****p < 0.0001.
- https://cdn.elifesciences.org/articles/99462/elife-99462-supp1-v1.xls
-
MDAR checklist
- https://cdn.elifesciences.org/articles/99462/elife-99462-mdarchecklist1-v1.pdf
Download links
A two-part list of links to download the article, or parts of the article, in various formats.
Downloads (link to download the article as PDF)
Open citations (links to open the citations from this article in various online reference manager services)
Cite this article (links to download the citations from this article in formats compatible with various reference manager tools)
The novel role of Kallistatin in linking metabolic syndromes and cognitive memory deterioration by inducing amyloid-β plaques accumulation and tau protein hyperphosphorylation
eLife 13:RP99462.
https://doi.org/10.7554/eLife.99462.3


